Attached files
| file | filename |
|---|---|
| EX-99.7 - EX-99.7 - Community First Bancshares, Inc. | d299900dex997.htm |
| EX-23.4 - EX-23.4 - Community First Bancshares, Inc. | d299900dex234.htm |
| EX-23.2 - EX-23.2 - Community First Bancshares, Inc. | d299900dex232.htm |
| EX-3.2 - EX-3.2 - Community First Bancshares, Inc. | d299900dex32.htm |
| EX-2 - EX-2 - Community First Bancshares, Inc. | d299900dex2.htm |
| S-1/A - S-1/A - Community First Bancshares, Inc. | d299900ds1a.htm |
Exhibit 99.6

November 25, 2016
Boards of Directors
Community First Bancshares, MHC
Community First Bancshares, Inc.
Newton Federal Bank
3175 Highway 278
Covington, Georgia 30014
Members of the Boards of Directors:
At your request, we have completed and hereby provide an independent appraisal (“Appraisal”) of the estimated pro forma market value of the common stock which is to be issued in connection with the stock issuance transaction described below.
This Appraisal is furnished pursuant to the requirements stipulated in the Code of Federal Regulations and has been prepared in accordance with the “Guidelines for Appraisal Reports for the Valuation of Savings and Loan Associations Converting from Mutual to Stock Form of Organization” (the “Valuation Guidelines”) of the Office of Thrift Supervision (“OTS”) and accepted by the Federal Reserve Board (“FRB”), the Office of the Comptroller of the Currency (“OCC”) and the Federal Deposit Insurance Corporation (“FDIC”) and applicable regulatory interpretations thereof. This Original Appraisal is effective as of November 25, 2016 and amended as of February 3, 2017.
Description of Plan of Stock Issuance
On October 31, 2016, the Board of Directors of the Newton Federal Bank (“Newton Federal” or the “Bank”) adopted a Plan of Reorganization. Pursuant to the Plan, the Bank will reorganize in to a three-tier mutual holding company structure, including Community First Bancshares, MHC (the “MHC”) and Community First Bancshares, Inc. (the “Company”). The MHC will be a top-tier mutual holding company and the Company will be the mid-tier stock holding company, which will own 100% of the outstanding common stock of Newton Federal. The Company will issue a majority of its common stock to the MHC and sell a minority of its common stock to the public. Concurrent with the completion of the public stock offering, Newton Federal will receive at least 50.0% of the net stock proceeds and the balance will be retained by the Company. The MHC will own a controlling interest in the Company of at least 51%, and the Company will be the sole subsidiary of the MHC. For purposes of this document, the existing consolidated entity will hereinafter be referred to as Community First or the Company.
The Company will offer its common stock in a subscription offering to Eligible Account Holders, Tax-Qualified Employee Plans, Supplemental Eligible Account Holders and Other Members and the MHC as such terms are defined in the Company’s Plan for purposes of applicable federal regulatory guidelines governing stock offerings by mutual institutions. To the extent that shares remain available for purchase after satisfaction of all subscriptions received in the subscription offering, the shares may be offered for sale to members of the general public in a community offering and a syndicated offering
| Washington Headquarters | ||
| Three Ballston Plaza | Telephone: (703) 528-1700 | |
| 1100 North Glebe Road, Suite 600 | Fax No.: (703) 528-1788 | |
| Arlington, VA 22201 | Toll-Free No.: (866) 723-0594 | |
| www.rpfinancial.com | E-Mail: mail@rpfinancial.com |
Boards of Directors
November 25, 2016
Page 2
A portion of the net proceeds received from the sale of the common stock will be used to purchase all of the then to be issued and outstanding capital stock of Newton Federal and the balance of the net proceeds will be retained by the Company.
At this time, no other activities are contemplated for the Company other than the ownership of the Bank, a loan to the newly-formed employee stock ownership plan (“ESOP”) and reinvestment of the proceeds that are retained by the Company. In the future, the Company may acquire or organize other operating subsidiaries, diversify into other banking-related activities, pay dividends or repurchase its stock, although there are no specific plans to undertake such activities at the present time.
RP® Financial, LC.
RP® Financial, LC. (“RP Financial”) is a financial consulting firm serving the financial services industry nationwide that, among other things, specializes in financial valuations and analyses of business enterprises and securities, including the pro forma valuation for savings institutions converting from mutual-to-stock form. The background and experience of RP Financial is detailed in Exhibit V-1. We believe that, except for the fee we will receive for the Appraisal, we are independent of the MHC, the Company, the Bank and the other parties engaged by the MHC, the Company or the Bank to assist in the stock conversion process.
Valuation Methodology
In preparing our Appraisal, we have reviewed the regulatory applications of the Company, the Bank and the MHC, including the prospectus as filed with the FDIC and the Securities and Exchange Commission (“SEC”). We have conducted a financial analysis of the Company, the Bank and the MHC that has included a review of audited financial information for the years ended September 30, 2013 through September 30, 2016, a review of various unaudited information and internal financial reports through September 30, 2016, and due diligence related discussions with the Company’s management; Porter Keadle Moore, LLC, the Company’s independent auditor; Luse Gorman, PC, the Company’s counsel for the stock issuance and BSP Securities , LLP, the Company’s marketing advisor in connection with the stock offering. All assumptions and conclusions set forth in the Appraisal were reached independently from such discussions. In addition, where appropriate, we have considered information based on other available published sources that we believe are reliable. While we believe the information and data gathered from all these sources are reliable, we cannot guarantee the accuracy and completeness of such information.
We have investigated the competitive environment within which Newton Federal operates and have assessed Newton Federal’s relative strengths and weaknesses. We have kept abreast of the changing regulatory and legislative environment for financial institutions and analyzed the potential impact on Newton Federal and the industry as a whole. We have analyzed the potential effects of the stock offering on Newton Federal’s operating characteristics and financial performance as they relate to the pro forma market value of the Company. We have reviewed the economic and demographic characteristics of the Bank’s primary market area. We have compared Newton Federal’s financial performance and condition with selected publicly-traded thrifts in accordance with the Valuation Guidelines, as well as all publicly-traded thrifts and thrift holding companies. We have reviewed the current conditions in the securities
Boards of Directors
November 25, 2016
Page 3
markets in general and the market for thrift stocks in particular, including the market for existing thrift issues and initial public offerings by thrifts and thrift holding companies. We have excluded from such analyses thrifts subject to announced or rumored acquisition, and/or institutions that exhibit other unusual characteristics.
The Appraisal is based on Newton Federal’s representation that the information contained in the regulatory applications and additional information furnished to us by Newton Federal and its independent auditor, legal counsel and other authorized agents are truthful, accurate and complete. We did not independently verify the financial statements and other information provided by Newton Federal, or its independent auditor, legal counsel and other authorized agents nor did we independently value the assets or liabilities of the Bank. The valuation considers the Company only as a going concern and should not be considered as an indication of the Company’s liquidation value.
Our appraised value is predicated on a continuation of the current operating environment for the Company and for all thrifts and their holding companies. Changes in the local, state and national economy, the legislative and regulatory environment for financial institutions and mutual holding companies, the stock market, interest rates, and other external forces (such as natural disasters or significant world events) may occur from time to time, often with great unpredictability and may materially impact the value of thrift stocks as a whole or the value of the Company’s stock alone. It is our understanding that there are no current plans for selling control of the Company following completion of the stock offering. To the extent that such factors can be foreseen, they have been factored into our analysis.
The estimated pro forma market value is defined as the price at which the Company’s common stock, immediately upon completion of the stock offering, would change hands between a willing buyer and a willing seller, neither being under any compulsion to buy or sell and both having reasonable knowledge of relevant facts.
Valuation Conclusion
It is our opinion that, as of November 25, 2016, the estimated aggregate pro forma market value of the shares to be issued immediately following the offering, both shares issued publicly as well as to the MHC, was $55,000,000 at the midpoint, equal to 5,500,000 shares issued at a per share value of $10.00. Pursuant to the conversion guidelines, the 15% offering range indicates a minimum value of $46,750,000 and a maximum value of $63,250,000. Based on the $10.00 per share offering price determined by the Board, this valuation range equates to total shares outstanding of 4,675,000 shares at the minimum of the valuation range and 6,325,000 total shares outstanding at the maximum of the valuation range. In the event that the appraised value is subject to an increase, the aggregate pro forma market value may be increased up to a super maximum value of $72,737,500 without a resolicitation. Based on the $10.00 per share offering price, the super maximum value would result in total shares outstanding of 7,273,750. The Board of Directors has established a public offering range such that the public ownership of the Company will constitute a 46.0% ownership interest of the Company. Accordingly, the offering range to the public of the minority stock will be $21,505,000 at the minimum, $25,300,000 at the midpoint, $29,095,000 at the maximum and $33,459,250 at the super maximum.
Boards of Directors
November 25, 2016
Page 4
Limiting Factors and Considerations
The valuation is not intended, and must not be construed, as a recommendation of any kind as to the advisability of purchasing shares of the common stock. Moreover, because such valuation is determined in accordance with applicable regulatory guidelines and is necessarily based upon estimates and projections of a number of matters, all of which are subject to change from time to time, no assurance can be given that persons who purchase shares of common stock in the stock offering will thereafter be able to buy or sell such shares at prices related to the foregoing valuation of the estimated pro forma market value thereof. The appraisal reflects only a valuation range as of this date for the pro forma market value of the Company immediately upon issuance of the stock and does not take into account any trading activity with respect to the purchase and sale of common stock in the secondary market on the date of issuance of such securities or at anytime thereafter following the completion of the stock offering.
RP Financial’s valuation was based on the financial condition and operations of Newton Federal as of September 30, 2016, the date of the financial data included in the prospectus and amended as of February 3, 2017.
RP Financial is not a seller of securities within the meaning of any federal and state securities laws and any report prepared by RP Financial shall not be used as an offer or solicitation with respect to the purchase or sale of any securities. RP Financial maintains a policy which prohibits RP Financial, its principals or employees from purchasing stock of its client institutions.
This valuation will be updated as provided for in the conversion regulations and guidelines. These updates will consider, among other things, any developments or changes in the financial performance and condition of the Bank, management policies, and current conditions in the equity markets for thrift shares, both existing issues and new issues. These updates may also consider changes in other external factors which impact value including, but not limited to: various changes in the legislative and regulatory environment for financial institutions, the stock market and the market for thrift stocks, and interest rates. Should any such new developments or changes be material, in our opinion, to the valuation of the shares, appropriate adjustments to the estimated pro forma market value will be made. The reasons for any such adjustments will be explained in the update at the date of the release of the update. The valuation will also be updated at the completion of the Company’s stock offering.
Respectfully submitted,
RP® FINANCIAL, LC.

James J. Oren
Director
| RP® Financial, LC. | TABLE OF CONTENTS |
i
TABLE OF CONTENTS
NEWTON FEDERAL BANK
Covington, Georgia
| PAGE | ||||||
| DESCRIPTION |
NUMBER | |||||
| CHAPTER ONE |
OVERVIEW AND FINANCIAL ANALYSIS | |||||
| Introduction |
I.1 | |||||
| Plan of Conversion |
I.1 | |||||
| Strategic Overview |
I.2 | |||||
| Balance Sheet Trends |
I.4 | |||||
| Income and Expense Trends |
I.8 | |||||
| Interest Rate Risk Management |
I.11 | |||||
| Lending Activities and Strategy |
I.12 | |||||
| Loan Originations and Sales |
I.16 | |||||
| Asset Quality |
I.16 | |||||
| Funding Composition and Strategy |
I.17 | |||||
| Subsidiary Operations |
I.17 | |||||
| Legal Proceedings |
I.18 | |||||
| CHAPTER TWO |
MARKET AREA ANALYSIS | |||||
| Introduction |
II.1 | |||||
| National Economic Factors |
II.2 | |||||
| Interest Rate Environment |
II.4 | |||||
| Market Area Regional Economy |
II.5 | |||||
| Regional Employment |
II.6 | |||||
| Market Area Demographics |
II.7 | |||||
| Regional Economy |
II.9 | |||||
| Unemployment Data |
II.10 | |||||
| Market Area Deposit Characteristics/Competition |
II.10 | |||||
| Competition |
II.12 | |||||
| CHAPTER THREE |
PEER GROUP ANALYSIS | |||||
| Peer Group Selection |
III.1 | |||||
| Financial Condition |
III.5 | |||||
| Income and Expense Components |
III.8 | |||||
| Loan Composition |
III.11 | |||||
| Credit Risk |
III.11 | |||||
| Interest Rate Risk |
III.14 | |||||
| Summary |
III.16 | |||||
| RP® Financial, LC. | TABLE OF CONTENTS |
ii
TABLE OF CONTENTS
NEWTON FEDERAL BANK
Covington, Georgia
(continued)
| PAGE | ||||
| DESCRIPTION |
NUMBER | |||
| CHAPTER FOUR | VALUATION ANALYSIS | |||
| Introduction |
IV.1 | |||
| Appraisal Guidelines |
IV.1 | |||
| RP Financial Approach to the Valuation |
IV.1 | |||
| Valuation Analysis |
IV.2 | |||
| 1. Financial Condition |
IV.2 | |||
| 2. Profitability, Growth and Viability of Earnings |
IV.4 | |||
| 3. Asset Growth |
IV.6 | |||
| 4. Primary Market Area |
IV.6 | |||
| 5. Dividends |
IV.8 | |||
| 6. Liquidity of the Shares |
IV.9 | |||
| 7. Marketing of the Issue |
IV.9 | |||
| A. The Public Market |
IV.10 | |||
| B. The New Issue Market |
IV.14 | |||
| C. The Acquisition Market |
IV.14 | |||
| 8. Management |
IV.17 | |||
| 9. Effect of Government Regulation and Regulatory Reform |
IV.18 | |||
| Summary of Adjustments |
IV.18 | |||
| Valuation Approaches |
IV.18 | |||
| 1. Price-to-Earnings (“P/E”) |
IV.20 | |||
| 2. Price-to-Book (“P/B”) |
IV.24 | |||
| 3. Price-to-Assets (“P/A”) |
IV.25 | |||
| Comparison to Recent Offerings |
IV.29 | |||
| Valuation Conclusion |
IV.30 | |||
| RP® Financial, LC. | LIST OF TABLES |
iii
LIST OF TABLES.
NEWTON FEDERAL BANK
Covington, Georgia
| TABLE NUMBER |
DESCRIPTION |
PAGE | ||
| 1.1 |
Historical Balance Sheets | I.5 | ||
| 1.2 |
Historical Income Statements | I.9 | ||
| 2.1 |
Market Area Largest Employers | II.6 | ||
| 2.2 |
Summary Demographic Data | II.8 | ||
| 2.3 |
Primary Market Area Employment Sectors | II.9 | ||
| 2.4 |
Unemployment Trends | II.10 | ||
| 2.5 |
Deposit Summary | II.11 | ||
| 2.6 |
Market Area Deposit Competitors – Newton County | II.13 | ||
| 3.1 |
Peer Group of Publicly-Traded Thrifts | III.3 | ||
| 3.2 |
Balance Sheet Composition and Growth Rates | III.6 | ||
| 3.3 |
Income as a % of Average Assets and Yields, Costs, Spreads | III.9 | ||
| 3.4 |
Loan Portfolio Composition and Related Information | III.12 | ||
| 3.5 |
Credit Risk Measures and Related Information | III.13 | ||
| 3.6 |
Interest Rate Risk Measures and Net Interest Income Volatility | III.15 | ||
| 4.1 |
Market Area Unemployment Rates | IV.8 | ||
| 4.2 |
Pricing Characteristics and After Market Trends | IV.15 | ||
| 4.3 |
Public Market Pricing Versus Peer Group | IV.16 | ||
| 4.4 |
Valuation Adjustments | IV.18 | ||
| 4.5 |
Derivation of Core Earnings | IV.21 | ||
| 4.6 |
Fully Converted Market Pricing Versus Peer Group | IV.22 | ||
| 4.7 |
MHC Market Pricing Versus Peer Group | IV.23 | ||
| 4.8 |
MHC Institutions Implied Ratios, Full Conversion Basis | IV.27 | ||
| 4.9 |
Comparative MHC Pricing Data | IV.29 |
| RP® Financial, LC. | OVERVIEW AND FINANCIAL ANALYSIS |
I.1
I. OVERVIEW AND FINANCIAL ANALYSIS
Introduction
Newton Federal is a federally-chartered mutual savings association headquartered in Covington, Georgia. The Bank was originally organized in 1928 as a Georgia chartered mutual building and loan association under the name Newton County Building and Loan Association. In 1947, the Bank converted to a federal charter and changed its name to “Newton Federal Savings and Loan Association.” In 2004 the name was changed to “Newton Federal Bank.
Newton Federal operates in the northeastern section of the state of Georgia, maintaining three banking offices in Newton County (about 30 miles east of the city of Atlanta) and a loan production office in Oconee County, which is close to the city of Athens, Georgia. The Bank’s primary market area for deposit gathering thus consists of Newton County, while lending activities are focused in Newton County (1-4 family residential and commercial lending) and Gwinnett, Clarke, Walton, Barrow, Oconee and Jackson Counties (commercial and construction lending). A map of the Bank’s branch offices is provided in Exhibit I-1. Newton Federal is a member of the Federal Home Loan Bank (“FHLB”) system, and its deposits are insured up to the regulatory maximums by the Deposit Insurance Fund of the Federal Deposit Insurance Corporation (“FDIC”). Newton Federal is subject to regulatory oversight and examination by the Office of the Comptroller of the Currency (“OCC”) and the FDIC (for deposit insurance purposes). At September 30, 2016, Newton Federal reported $232.8 million in assets, $181.7 million in deposits and total equity of $45.1 million, equal to 19.36% of total assets. Newton Federal’s audited financial statements are included by reference as Exhibit I-2.
Plan of Conversion
The Board of Directors of Newton Federal adopted a plan of conversion and reorganization on October 31, 2016. Pursuant to the Plan, the Bank will reorganize into a three-tier mutual holding company structure, including Community First Bancshares, MHC (the “MHC”) and Community First Bancshares, Inc. (the “Company”). The MHC will be a top-tier mutual holding company and the Company will be the mid-tier stock holding company, which will own 100% of the outstanding common stock of Newton Federal. The Company will issue a majority of its common stock to the MHC and sell a minority of its common stock to the public. Concurrent with the completion of the public stock offering, Newton Federal will receive at least 50% of the net stock proceeds and the balance will be retained by the Company. The MHC will own a controlling interest in the Company of at least 51%, and the Company will be the sole subsidiary of the MHC. For purposes of this document, the post-conversion consolidated entity will hereinafter be referred to as Community First or the Company.
| RP® Financial, LC. | OVERVIEW AND FINANCIAL ANALYSIS |
I.2
The plan of conversion and reorganization provides that the Company will sell shares of its common stock in a subscription offering in descending order of priority to the Bank’s members and other stakeholders as follows: Eligible Account Holders, Tax-Qualified Employee Plans, Supplemental Eligible Account Holders and Other Members. If all shares are not subscribed for in the subscription offering, the Bank intends to offer common stock for sale to certain members of the public through a community offering. Shares not purchased in the subscription and community offerings may be offered for sale to the general public in a syndicated community offering. The MHC will be issued shares as prescribed in the Plan.
At this time, no other activities are contemplated for Community First other than the ownership of the Bank, a loan to the newly-formed employee stock ownership plan (“ESOP”) and reinvestment of the proceeds that are retained by the Company. In the future, the Company may acquire or organize other operating subsidiaries, diversify into other banking-related activities, pay dividends to shareholders and/or repurchase its stock, although there are no specific plans to undertake such activities at the present time.
Strategic Overview
Newton Federal has been serving the Newton County area as a locally-owned and operated financial institution since its founding in 1928. Following a long history of serving the local market area through a single office, the Bank expanded its customer reach by opening an “eastside office” in Covington in 2000, and a “southside office” in Covington in 2006. To further the lending capabilities of the Bank, in January 2016 Newton Federal opened a loan production office in Bogart, Oconee County, which provides access to the Athens, Georgia market and other surrounding counties , located approximately 45 miles northeast of Covington. Newton Federal thus operates within the Atlanta-Sandy Springs-Roswell metropolitan statistical area (of which Newton County is part), and the Athens, Georgia metropolitan area (Athens-Clark County).
For many years Newton Federal operated as a traditional thrift institution, originating for portfolio long-term fixed rate residential loans funded with certificates of deposit. In recent years, the Bank has strived to diversify the loan portfolio into commercial real estate, commercial and industrial and construction/land loans. The Bank’s products and services are focused on the lending and investment needs of the local retail and commercial customer base as well as
| RP® Financial, LC. | OVERVIEW AND FINANCIAL ANALYSIS |
I.3
households in the market area. Based on the operating history and growth of the Bank since its founding, the Bank has established, to a notable degree, its name recognition and overall reputation in the area. In addition, the Bank views itself as an integral part of the local communities served, and thus has historically strongly supported the retail customer base in Newton County through providing residential loan products.
Newton Federal’s original market area of Newton County experienced a substantial downturn in economic activity and related housing prices during the “great recession” of 2007-2009 which led to elevated levels of non-performing assets and net losses due to these asset quality issues. Since the end of the great recession, the economic condition of Newton County, and Newton Federal’s customer base, have improved such that the local market area economy is currently expanding in terms of population, with economic activity relatively stable. A new president and CEO and several other senior managers have been added over the past several years to direct the operations of the Bank.
The equity from the stock offering will increase the Bank’s liquidity, leverage and growth capacity and the overall financial strength. Newton Federal’s higher equity position resulting from the infusion of stock proceeds is anticipated to reduce interest rate risk through enhancing the interest-earning assets to interest-bearing liabilities (“IEA/IBL”) ratio. The increased equity is expected to reduce overall funding costs for the asset base. The Bank will also be better positioned to pursue growth and revenue diversification. The projected use of proceeds is highlighted below.
| • | The Company. The Company is expected to retain an estimated 50% of the net conversion proceeds. At present, funds at the holding company level are expected to be initially invested primarily into short-term liquid investments, along with providing the funds for the employee stock ownership plan purchases. Over time, the funds may be utilized for various corporate purposes. |
| • | The Bank. An estimated 50% of the net conversion proceeds will be infused into the Bank as cash and equity. Cash proceeds (i.e., net proceeds less deposits withdrawn to fund stock purchases) infused into the Bank are expected to be deposited as an interest-earning deposit, providing additional funds for reinvestment in earning assets. |
| RP® Financial, LC. | OVERVIEW AND FINANCIAL ANALYSIS |
I.4
With the Bank’s enhanced equity position, following the completion of the offering, Newton Federal intends to implement the following strategies in order to grow and achieve the Bank’s objective to develop into an independent high performing bank focused on meeting the needs of individuals, small businesses, and community organizations in Northeast Georgia through providing enhanced service and competitive products:
| • | Controlled loan growth with a focus on diversifying the loan portfolio, particularly in commercial real estate and commercial and industrial lending; |
| • | Continue to increase core deposits, with an emphasis on low cost commercial demand deposits, and add non-core funding opportunities; |
| • | Manage credit risk to maintain a low level of nonperforming assets; and, |
| • | Disciplined expansion through organic growth and opportunistic bank or branch acquisitions. |
Balance Sheet Trends
Table 1.1 presents the Bank’s historical balance sheet data for the most recent five fiscal years, all of which reflects data for Newton Federal as a mutual savings bank. Over this period, Newton Federal’s total assets have increased at a 0.4% annual rate, with loans receivable, representing the majority of the asset base, increasing at a 0.8% annual rate, a slightly higher rate than assets over the same time period.
Assets fluctuated within a modest range from fiscal 2012 through 2016 as a result of the Bank’s focus on resolving problem assets and limited lending activities available as the Newton County geographic area recovered from the recession of 2007-2009. Additional asset growth was also not required given the declining level of loans receivable experienced through fiscal 2015, which resulted in sufficient available liquidity. Over the time period shown in Table 1.1 investments also recorded minimal annual changes. Since September 30, 2012 assets have been funded with deposits and equity, as no borrowing have been required to fund the asset or liquidity base. Deposits declined by 1.3% annually over the past five years, while continued profitability has resulted in an annual increase in equity of 7.0%. Equity reached $45.1 million at September 30, 2016, or 19.36% of assets. A summary of Newton Federal’s key operating ratios for the past five years is presented in Exhibit I-3.
A key long term business strategy of Newton Federal is to maintain a significant investment in whole loans receivable. As such, the Bank’s loan portfolio totaled $190.1 million, or 81.6% of assets at September 30, 2016, an increase from $184.0 million, or 80.2% of assets as of September 30, 2012. From fiscal 2012 through September 30, 2016, the increase in the loan balance was enabled though the overall increase in balance sheet funding, funds from the
| RP® Financial, LC. | OVERVIEW AND FINANCIAL ANALYSIS |
I.5
Table 1.1
Newton Federal Bank
Historical Balance Sheets
| 2012-2016 | ||||||||||||||||||||||||||||||||||||||||||||
| As of September 30, | Annualized | |||||||||||||||||||||||||||||||||||||||||||
| 2012 | 2013 | 2014 | 2015 | 2016 | Growth | |||||||||||||||||||||||||||||||||||||||
| Amount | Pct(1) | Amount | Pct(1) | Amount | Pct(1) | Amount | Pct(1) | Amount | Pct(1) | Pct | ||||||||||||||||||||||||||||||||||
| ($000) | (%) | ($000) | (%) | ($000) | (%) | ($000) | (%) | ($000) | (%) | (%) | ||||||||||||||||||||||||||||||||||
| Total Amount of: |
||||||||||||||||||||||||||||||||||||||||||||
| Assets |
$ | 229,519 | 100.00 | % | $ | 222,328 | 100.00 | % | $ | 227,089 | 100.00 | % | $ | 226,337 | 100.00 | % | $ | 232,832 | 100.00 | % | 0.36 | % | ||||||||||||||||||||||
| Loans Receivable (net) (2) |
183,958 | 80.15 | % | 180,006 | 80.96 | % | 174,132 | 76.68 | % | 169,798 | 75.02 | % | 190,050 | 81.63 | % | 0.82 | % | |||||||||||||||||||||||||||
| Cash and Equivalents |
27,823 | 12.12 | % | 29,316 | 13.19 | % | 34,140 | 15.03 | % | 38,494 | 17.01 | % | 25,693 | 11.03 | % | -1.97 | % | |||||||||||||||||||||||||||
| Investment Securities |
7,065 | 3.08 | % | 5,431 | 2.44 | % | 7,183 | 3.16 | % | 7,694 | 3.40 | % | 7,704 | 3.31 | % | 2.19 | % | |||||||||||||||||||||||||||
| Deferred Tax Asset |
0 | 0.00 | % | 0 | 0.00 | % | 4,999 | 2.20 | % | 4,197 | 1.85 | % | 3,536 | 1.52 | % | NM | ||||||||||||||||||||||||||||
| Fixed Assets |
4,475 | 1.95 | % | 4,394 | 1.98 | % | 4,338 | 1.91 | % | 4,261 | 1.88 | % | 4,325 | 1.86 | % | -0.85 | % | |||||||||||||||||||||||||||
| OREO |
4,121 | 1.80 | % | 1,880 | 0.85 | % | 1,129 | 0.50 | % | 532 | 0.24 | % | 0 | 0.00 | % | -100.00 | % | |||||||||||||||||||||||||||
| Other Assets |
2,077 | 0.90 | % | 1,301 | 0.59 | % | 1,168 | 0.51 | % | 1,361 | 0.60 | % | 1,524 | 0.65 | % | -7.45 | % | |||||||||||||||||||||||||||
| Deposits |
$ | 191,389 | 83.39 | % | $ | 183,763 | 82.65 | % | $ | 179,264 | 78.94 | % | $ | 176,687 | 78.06 | % | $ | 181,699 | 78.04 | % | -1.29 | % | ||||||||||||||||||||||
| Borrowings |
0 | 0.00 | % | 0 | 0.00 | % | 0 | 0.00 | % | 0 | 0.00 | % | 0 | 0.00 | % | 0.00 | % | |||||||||||||||||||||||||||
| Other Liabilities |
3,779 | 1.65 | % | 4,507 | 2.03 | % | 5,514 | 2.43 | % | 5,726 | 2.53 | % | 6,052 | 2.60 | % | 12.49 | % | |||||||||||||||||||||||||||
| Retained Earnings |
34,351 | 14.97 | % | 34,058 | 15.32 | % | 42,311 | 18.63 | % | 43,924 | 19.41 | % | 45,081 | 19.36 | % | 7.03 | % | |||||||||||||||||||||||||||
| Tangible Retained Earnings |
34,351 | 14.97 | % | 34,058 | 15.32 | % | 42,311 | 18.63 | % | 43,924 | 19.41 | % | 45,081 | 19.36 | % | 7.03 | % | |||||||||||||||||||||||||||
| Net Unrealized Gain/(Loss) on Investment/MBS Available for Sale |
$ | 0 | 0.00 | % | $ | 0 | 0.00 | % | $ | 0 | 0.00 | % | $ | 0 | 0.00 | % | $ | 0 | 0.00 | % | ||||||||||||||||||||||||
| Loans/Deposits |
96.12 | % | 97.96 | % | 97.14 | % | 96.10 | % | 104.60 | % | ||||||||||||||||||||||||||||||||||
| Offices Open |
3 | 3 | 3 | 3 | 3 | |||||||||||||||||||||||||||||||||||||||
| (1) | Ratios are as a percent of ending assets. |
| (2) | Includes loans held for sale. |
Source: Community First’s preliminary prospectus, audited financial reports.
| RP® Financial, LC. | OVERVIEW AND FINANCIAL ANALYSIS |
I.6
resolution of other real estate owned (“OREO”), and additional investment of available funds in cash equivalents. The combination of the increase in loans receivable as a percent of assets and a reduction in deposit funds resulted in the loan/deposit ratio increasing from 96.1% at September 30, 2012 to 104.6% at September 30, 2016.
Newton Federal’s investment in loans reflects the Bank’s historical concentration in traditional long-term fixed rate 1-4 family residential loans, along with an increasing level of diversity into commercial real estate, commercial business and commercial construction lending. The 1-4 family residential loan first position portfolio comprised 69% of total loans as of September 30, 2016. Over the last five years, the Bank has been pursuing a diversification strategy and emphasizing growth in the commercial and construction/land portfolio, as such loans totaled 30.3% at the same date. Such loans increased from $33.2 million, or 17.5% of loans at September 30, 2012 to $58.7 million at September 30, 2016. The commercial and construction/land lending activities represent a primary part of the Bank’s business strategy to maximize revenue (in terms of yield on portfolio loans) and provide benefits in areas such as interest rate risk, and such activities have been focused in the loan production office operations in the Athens, Georgia area. The lending area for these types of loans has been expanded to include the region between Covington and Athens. Newton Federal historically originated consumer loans to customers, primarily second position home equity lines of credit and home equity loans, and other consumer type loans. This type of lending has remained modest in recent years, and consumer loans totaled $2.3 million, or 1.2% of loans as of September 30, 2016. The Bank has not typically sold loans into the secondary market, although there was a modest balance of loans held for sale ($472,000) as of September 30, 2016.
As indicated above, the Bank’s loan portfolio comprises over 80% of assets. The intent of the Bank’s cash and investment policy is to provide adequate liquidity and to generate a favorable return within the context of supporting Newton Federal’s cash operating needs and credit and interest rate risk objectives. Historically, the level of cash and equivalents has remained in the range of 11% to 17% of assets, which has been sufficient for daily operational needs. The ratio decreased as of September 30, 2016 primarily due to the use of funds for additional loan originations. As of September 30, 2016, the portfolio of cash and cash equivalents totaled $25.7 million, equal to 11.0% of assets. Within this portfolio, the Bank maintained insured investments in certificates of deposit in other financial institutions of approximately $11 million.
| RP® Financial, LC. | OVERVIEW AND FINANCIAL ANALYSIS |
I.7
Regarding the investment securities portfolio, as of September 30, 2016 the Bank held a modest portfolio of investments in the form of three government agency bonds that mature within three years. The only other investment security consisted of the required investment of FHLB of Atlanta stock of $205,000. The level of cash and investments is anticipated to increase initially following conversion, pending gradual redeployment into higher yielding loans. Details of the Bank’s investment securities portfolio are presented in Exhibit I-4.
Newton Federal owns the headquarters office and eastside office land and building and leases the land but owns the building for the southside office, while leasing the loan production office in Oconee County. The headquarters office was originally constructed in 1974, and was carried with a net book value of $1.2 million at September 30, 2016. This office, along with investment in the other branch offices (including land, buildings, and furniture, fixtures and equipment), totaled $4.3 million, or 1.9% of assets as of September 30, 2016. The investment in fixed assets has declined slightly since fiscal 2012 as only minimal costs were incurred in the opening of the Athens area LPO, and the remaining offices were opened fairly recently. The Bank has in place plans to build an operations center adjacent to one of the branch locations, which will open up space in the headquarters office for additional lending, customer service and marketing personnel.
As a result of the operating losses incurred prior to 2014, Newton Federal accumulated a notable balance of net operating loss carryforwards that created a net deferred tax asset (“DTA”). For a period of time the DTA was fully reserved on the balance sheet, given the uncertain time frame for the Bank to return to profitability. During fiscal 2014, the valuation allowance was removed in light of the expected future levels of profitability. Thus, a DTA of $5.0 million was added to the balance sheet as of September 30, 2014. As a result of continued profitability through September 30, 2016, this DTA has been reduced to $3.5 million, as the Bank can offset taxes payable by reducing this account.
Reflecting the overall improvement of the asset quality since the end of the 2007-2009 recession, the balance of OREO was reduced to a zero balance at September 30, 2016. Such OREO reached a high of $4.1 million as of September 30, 2012, and declined consistently over the last five years as a result of resolutions of existing properties and the lack of substantial additions of foreclosed properties from the loan portfolio.
Since December 31, 2012, Newton Federal’s funding needs have been provided by retail deposits and retained earnings. In contrast to the modest increase in assets, the balance of the Bank’s deposits has decreased slightly since 2012, reaching a low of $176.7 million as of September 30, 2015. Deposits increased by $5.0 million during fiscal 2016, primarily due to funds raised through the Bank’s “Kasasa” deposit program, which motivates customers to maintain
| RP® Financial, LC. | OVERVIEW AND FINANCIAL ANALYSIS |
I.8
checking accounts at the Bank. As a result of the growth in assets, the proportion of assets funded with deposits has declined from 83.4% to 78.0% over the past five years. The Bank maintains a concentration of deposits in certificates of deposit (reflective of the traditional thrift operations), which comprised 47.1% of deposits at September 30, 2016, although this ratio has declined notably from versus 59.0% of total deposits at fiscal year-end 2012.
Newton Federal has not historically utilized borrowings for funding. The Bank has not needed such funds due to the level of lending activities and available cash and liquidity, which has been used for recent increases in portfolio loans.
The balance of equity increased between fiscal 2012 and 2016 as the Bank recorded profitable operations, including the capture of the DTA. Reflecting the combination of this increase in equity and the increase in assets over that time period, the equity-to-assets ratio increased from 14.97% at year end 2012 to 19.36% at September 30, 2016. All of the Bank’s equity is tangible, and the Bank maintained surpluses relative to all of its regulatory capital requirements at September 30, 2016. The pro forma return on equity (“ROE”) is expected to initially decline given the increased equity position.
Income and Expense Trends
Table 1.2 presents the Bank’s income and expense trends over the past five fiscal years. The effects of the last years of the economic recession are evident in the net losses and provisions for loan losses recorded for fiscal 2012 and 2013, followed by the recovery of the fully-reserved deferred tax asset in fiscal 2014 and the return to profitability since that year. Profitability for fiscal 2015 and 2016 averaged $1.4 million, or 0.61% of average assets. The income statement has been affected to a modest degree by non-operating income or expense items over the past five years. Net interest income and operating expenses represent the primary components of the Bank’s income statement. Other revenues for the Bank largely are derived from customer service fees and charges on the deposit base and lending operations. The level of loan loss provisions has also followed the improvement in assets quality over the past five years.
The Bank’s net interest income to average assets ratio has reflected the impact of market interest rate trends and internal lending strategies over the time period shown in Table 1.2. Net interest income as a percent of average assets has increased from a low of 3.87% during fiscal 2012 to a high of 4.33% for fiscal 2016. The net interest income ratio is supported by several factors, including: (1) the high proportion of loans on the balance sheet as a percent of assets;
| RP® Financial, LC. | OVERVIEW AND FINANCIAL ANALYSIS |
I.9
Table 1.2
Newton Federal Bank
Historical Income Statements
| For the Fiscal Year Ended September 30, | ||||||||||||||||||||||||||||||||||||||||
| 2012 | 2013 | 2014 | 2015 | 2016 | ||||||||||||||||||||||||||||||||||||
| Amount | Pct(1) | Amount | Pct(1) | Amount | Pct(1) | Amount | Pct(1) | Amount | Pct(1) | |||||||||||||||||||||||||||||||
| ($000) | (%) | ($000) | (%) | ($000) | (%) | ($000) | (%) | ($000) | (%) | |||||||||||||||||||||||||||||||
| Interest Income |
$ | 12,571 | 5.25 | % | $ | 11,401 | 5.06 | % | $ | 11,570 | 5.22 | % | $ | 11,045 | 4.93 | % | $ | 11,248 | 4.96 | % | ||||||||||||||||||||
| Interest Expense |
(3,311 | ) | -1.38 | % | (2,700 | ) | -1.20 | % | (2,156 | ) | -0.97 | % | (1,813 | ) | -0.81 | % | (1,415 | ) | -0.62 | % | ||||||||||||||||||||
|
|
|
|
|
|
|
|
|
|
|
|
|
|
|
|
|
|
|
|
|
|||||||||||||||||||||
| Net Interest Income |
$ | 9,260 | 3.87 | % | $ | 8,701 | 3.86 | % | $ | 9,414 | 4.24 | % | $ | 9,232 | 4.12 | % | $ | 9,833 | 4.33 | % | ||||||||||||||||||||
| Provision for Loan Losses |
(9,017 | ) | -3.76 | % | (3,147 | ) | -1.40 | % | 0 | 0.00 | % | 0 | 0.00 | % | 0 | 0.00 | % | |||||||||||||||||||||||
|
|
|
|
|
|
|
|
|
|
|
|
|
|
|
|
|
|
|
|
|
|||||||||||||||||||||
| Net Interest Income after Provisions |
$ | 243 | 0.10 | % | $ | 5,554 | 2.46 | % | $ | 9,414 | 4.24 | % | $ | 9,232 | 4.12 | % | $ | 9,833 | 4.33 | % | ||||||||||||||||||||
| Other Income |
$ | 945 | 0.39 | % | $ | 876 | 0.39 | % | $ | 840 | 0.38 | % | $ | 921 | 0.41 | % | $ | 1,208 | 0.53 | % | ||||||||||||||||||||
| Gain(Loss) on Sale of Loans |
0 | 0.00 | % | 0 | 0.00 | % | 0 | 0.00 | % | 0 | 0.00 | % | 0 | 0.00 | % | |||||||||||||||||||||||||
| Operating Expense |
(7,259 | ) | -3.03 | % | (6,723 | ) | -2.98 | % | (6,603 | ) | -2.98 | % | (7,486 | ) | -3.34 | % | (8,764 | ) | -3.86 | % | ||||||||||||||||||||
|
|
|
|
|
|
|
|
|
|
|
|
|
|
|
|
|
|
|
|
|
|||||||||||||||||||||
| Net Operating Income |
($ | 6,071 | ) | -2.53 | % | ($ | 293 | ) | -0.13 | % | $ | 3,652 | 1.65 | % | $ | 2,667 | 1.19 | % | $ | 2,277 | 1.00 | % | ||||||||||||||||||
| OREO Expense |
$ | 0 | 0.00 | % | $ | 0 | 0.00 | % | ($ | 366 | ) | -0.16 | % | ($ | 174 | ) | -0.08 | % | ($ | 172 | ) | -0.08 | % | |||||||||||||||||
| Termination Expense-Former CEO |
0 | 0.00 | % | 0 | 0.00 | % | 0 | 0.00 | % | 0 | 0.00 | % | (251 | ) | -0.11 | % | ||||||||||||||||||||||||
| Gain on Sale of Investments |
0 | 0.00 | % | 0 | 0.00 | % | 31 | 0.01 | % | 0 | 0.00 | % | 0 | 0.00 | % | |||||||||||||||||||||||||
|
|
|
|
|
|
|
|
|
|
|
|
|
|
|
|
|
|
|
|
|
|||||||||||||||||||||
| Total Non-Operating Income (Exp.) |
$ | 0 | 0.00 | % | $ | 0 | 0.00 | % | ($ | 335 | ) | -0.15 | % | ($ | 174 | ) | -0.08 | % | ($ | 423 | ) | -0.19 | % | |||||||||||||||||
| Net Income Before Tax |
($ | 6,071 | ) | -2.53 | % | ($ | 293 | ) | -0.13 | % | $ | 3,317 | 1.50 | % | $ | 2,493 | 1.11 | % | $ | 1,854 | 0.82 | % | ||||||||||||||||||
| Income Taxes |
(349 | ) | -0.15 | % | 0 | 0.00 | % | 4,935 | 2.22 | % | (879 | ) | -0.39 | % | (697 | ) | -0.31 | % | ||||||||||||||||||||||
|
|
|
|
|
|
|
|
|
|
|
|
|
|
|
|
|
|
|
|
|
|||||||||||||||||||||
| Net Income (Loss) |
($ | 6,420 | ) | -2.68 | % | ($ | 293 | ) | -0.13 | % | $ | 8,252 | 3.72 | % | $ | 1,614 | 0.72 | % | $ | 1,157 | 0.51 | % | ||||||||||||||||||
| Adjusted Earnings: |
||||||||||||||||||||||||||||||||||||||||
| Net Income |
($ | 6,420 | ) | -2.68 | % | ($ | 293 | ) | -0.13 | % | $ | 8,252 | 3.72 | % | $ | 1,614 | 0.72 | % | $ | 1,157 | 0.51 | % | ||||||||||||||||||
| Add(Deduct): Non-Operating (Inc)/Exp |
0 | 0.00 | % | 0 | 0.00 | % | 31 | 0.01 | % | 0 | 0.00 | % | 251 | 0.11 | % | |||||||||||||||||||||||||
| Tax Effect |
0 | 0.00 | % | 0 | 0.00 | % | (12 | ) | -0.01 | % | 0 | 0.00 | % | (95 | ) | -0.04 | % | |||||||||||||||||||||||
|
|
|
|
|
|
|
|
|
|
|
|
|
|
|
|
|
|
|
|
|
|||||||||||||||||||||
| Adjusted Earnings: |
($ | 6,420 | ) | -2.68 | % | ($ | 293 | ) | -0.13 | % | $ | 8,271 | 3.73 | % | $ | 1,614 | 0.72 | % | $ | 1,313 | 0.58 | % | ||||||||||||||||||
| Memo: |
||||||||||||||||||||||||||||||||||||||||
| Efficiency Ratio (%) |
71.13 | % | 70.20 | % | 64.39 | % | 73.73 | % | 79.38 | % | ||||||||||||||||||||||||||||||
| Return on Equity (%) |
-15.70 | % | -0.88 | % | 23.39 | % | 3.83 | % | 2.60 | % | ||||||||||||||||||||||||||||||
| Effective Tax Rate (%) |
-5.75 | % | 0.00 | % | -148.78 | % | 35.26 | % | 37.59 | % | ||||||||||||||||||||||||||||||
| (1) | Ratios are as a percent of average assets. |
Source: Community First’s preliminary prospectus, audited financial reports.
| RP® Financial, LC. | OVERVIEW AND FINANCIAL ANALYSIS |
I.10
(2) the practice of originating long-term fixed rate loans that do not meet all requirements for secondary market sales, and thus bear higher interest rates; (3) the prevailing low interest rate environment, which has kept deposit funding costs low; (3) an effort to cause higher costing deposit funds to be withdrawn and replaced by low cost checking accounts through the Kasasa program; and, (4) the relatively significant fixed rate residential loan portfolio and increasing diversification into higher yielding commercial real estate and non-real estate loans, which has supported the interest income ratio. Interest income as a percent of average assets has increased from 4.93% for fiscal 2010 to 4.96% for the latest 12 month period. The Bank’s level of interest income is also supported by the relatively modest level of non- accruing loans, which would act to reduce the level of interest income recognized. The Bank’s interest rate spreads and yields and costs for the past three years are set forth in Exhibits I-3 and I-5.
Non-interest operating income (“other income”) has historically been a notable contributor to the Bank’s income statement, and averaged 0.42% of average assets for fiscal years 2012 through 2016. The non-interest operating income ratio is dependent upon the level of banking activities, including core deposit accounts, with customer service fees constituting the primary source of non-interest income for the Bank. For the 12 months ended September 30, 2016 other income totaled $1.2 million, or 0.53% of average assets.
Operating expenses represent the other major component of the Bank’s income statement, with such expenses showing a level of fluctuation over the time period covered in Table 1.2 as a percent of average assets. Total operating expenses equaled $8.8 million, or 3.86% of average assets during the 12 months ended September 30, 2016. Such expenses declined through fiscal 2014 as asset resolution costs declined substantially. The increase in operating expenses since 2014 reflects general inflation costs, the overall costs of operations and the hiring of a number of new mid-level managers in various operating departments of the Bank, including the LPO operations. The Bank’s level of operating expenses is indicative of the higher staffing needs associated with the intended diversification of the loan portfolio and lending operations. Additional increasing operating expenses include data processing and marketing as the Bank attempts to grow the balance sheet and loan portfolio. Upward pressure will be placed on the Bank’s expense ratio following the stock offering, due to expenses associated with operating as a publicly-traded company, including expenses related to the stock benefit plans.
| RP® Financial, LC. | OVERVIEW AND FINANCIAL ANALYSIS |
I.11
The trends in the net interest income and operating expense ratios since fiscal 2009 have caused the expense coverage ratio (net interest income divided by operating expenses) to decrease gradually from a high of 127.7% in fiscal 2012 to 112.2% in fiscal 2016. Also reflecting a similar trend, Newton Federal’s efficiency ratio (operating expenses, net of amortization of intangibles, as a percent of the sum of net interest income and other operating income) has increased from 71.1% for fiscal 2012 to 79.4% for fiscal 2016. The level of other income has assisted in maintaining the efficiency ratio. Going forward, the Bank believes the efficiency ratio should improve with continued efforts to control operating expenses and reinvestment of the offering proceeds.
As noted earlier, loan loss provisions had a significant impact on the income statement through fiscal 2013 as the Bank continued to work out of post-recession asset quality issues. In contrast, Newton Federal has not recorded any loan loss provisions since fiscal 2013, reflecting the Bank’s favorable asset quality and the decreasing need for increased reserve coverage. Reflecting the Bank’s asset quality position, chargeoffs have been relatively modest and generally decreasing in recent periods from a high reached in fiscal 2012. As of September 30, 2016, ALLLs equaled 132.87% of non-performing loans and non-performing assets and 2.22% of total loans receivable. Exhibit I-6 sets forth the Bank’s allowance for loan loss activity during the past five years.
Non-operating items have had a minimal impact on the Bank’s income statement in past five years and have consisted losses on the resolution of OREO, a small amount of gains on the sale of securities, and the costs related to the separation of the former CEO in 2016.
As noted above, the Bank’s income tax status has been impacted by operating losses incurred through fiscal 2013, which resulted in a DTA that was fully reserved until fiscal 2014. For fiscal years 2015 and 2016, Newton Federal recorded tax expense based on recorded taxable income, with the DTA utilized to offset required payments to the US Treasury. The effective tax rates for those years were within a narrow range and equaled 37.6% for fiscal 2016. The Bank’s marginal effective statutory tax rate approximates 38.0%, and this is the rate utilized to calculate the net reinvestment benefit from the offering proceeds.
Interest Rate Risk Management
Newton Federal’s balance sheet is liability-sensitive in the shorter-term and, thus, the net interest margin will typically be unfavorably affected during periods of rising and higher interest rates. Newton Federal measures its interest rate risk exposure by use of the net economic value risk (“NEV”) methodology, which provides an analysis of estimated changes in the Bank’s NEV under the assumed instantaneous changes in the U.S. treasury yield curve. Utilizing figures as of September 30, 2016, based on a 2.0% instantaneous and sustained increase in interest rates, the NEV model indicates that the Bank’s NEV would decrease by 12.3% (see Exhibit I-7).
| RP® Financial, LC. | OVERVIEW AND FINANCIAL ANALYSIS |
I.12
In recent periods, the Bank has pursued a number of strategies to manage interest rate risk, particularly with respect to seeking to limit the repricing mismatch between interest rate sensitive assets and liabilities. The Bank manages interest rate risk from the asset side of the balance sheet through pricing 1-4 family residential real estate loans in a way that encourages borrowers to select balloon loans as opposed to longer-term fixed rate loans, and diversifying into other types of lending beyond 1-4 family permanent mortgage loans such as originating commercial real estate, commercial business and construction/land loans, all of which have shorter terms to repricing or maturity, and carry higher interest rates. On the liability side of the balance sheet, management of interest rate risk has been pursued through growing the volume of deposits in lower cost and less interest rate sensitive transaction and savings accounts, and reducing dependence on certificates of deposits and wholesale funding. Core deposits, which consist of transaction and savings accounts, comprised 52.9% of the Bank’s deposits at September 30, 2016. As of September 30, 2016, of the Bank’s total loans due after September 30, 2017, ARM loans comprised 2.5% of those loans (see Exhibit I-8). In addition, the Bank maintains a notable balance of cash and cash equivalents, which provide for short-term to maturity funds on the balance sheet. Further, the Bank holds a relatively large percentage of the balance sheet in interest-free equity (19.36%), which funds interest earning assets at no repricing risk. The infusion of stock proceeds will serve to further limit the Bank’s interest rate risk exposure, as most of the net proceeds will be redeployed into interest-earning assets and the increase in the Bank’s capital will lessen the proportion of interest rate sensitive liabilities funding assets.
There are numerous limitations inherent in interest rate risk analyses such as the credit risk of Bank’s loans pursuant to changing interest rates. Additionally, such analyses do not measure the impact of changing spread relationships, as interest rates among various asset and liability accounts rarely move in tandem, as the shape of the yield curve for various types of assets and liabilities is constantly changing in response to investor perceptions and economic events and circumstances.
Lending Activities and Strategy
Newton Federal operates two principal lending activities: (1) the origination of 1-4 family residential first mortgage loans, originated primarily for retention in portfolio; and, (2) commercial real estate, commercial business and construction/land loans as part of a commercial lending
| RP® Financial, LC. | OVERVIEW AND FINANCIAL ANALYSIS |
I.13
focus. In recent periods, Newton Federal has increased its focus on commercial lending in an effort to diversify its overall loan portfolio, shorten the term-to-maturity or repricing, and increase the overall yield earned on loans. Details of the Bank’s loan portfolio composition are shown in Exhibit I-9, while Exhibit I-10 provides details of the Bank’s loan portfolio by contractual maturity date.
Residential Real Estate Lending
Newton Federal’s historical lending focus has been the origination of first position fixed-rate 1-4 family residential real estate loans, and depending on interest rate, local and regional real estate market conditions and borrower preferences, also offers 1-4 family residential real estate loans with balloon features, secured by traditional 1-4 family residential real estate property. The Bank typically retains such loans in portfolio, but occasionally sells loans to the secondary market. Newton Federal also originates to a much more limited extent second position home equity and home equity lines of credit. As of September 30, 2016, residential first and second position mortgage loans equaled $132.9 million, or 68.5% of total loans, with adjustable rate loans totaling less than 1% of total residential first mortgage loans. As shown in Exhibit I-9, the balance of first and second position residential mortgage loans has declined since September 30, 2012, given the increased focus on other lending activities.
Newton Federal’s first mortgage loans are generally underwritten to internal guidelines, although the Bank generally follows documentation practices of Fannie Mae guidelines. The guidelines allow for loans to be originated at higher interest rates given the non-conforming characteristics. Most of the 1-4 family mortgage loans secured by residences in the Newton County market surrounding the branch office locations. Loan-to-value ratios (“LTV”) of mortgage loans are generally limited to 90% LTV or the purchase price, whichever is lower, or above 90% if the loans carry private mortgage insurance. 1-4 family residential real estate loans typically have terms of up to 30 years and balances up to $150,000, although loans with balances above that amount will be originated. The balloon loans generally have terms of five to seven years and amortize over 30 years. The Bank will originate balloon loans with initial terms of ten years. Newton Federal does not offer “interest only”, “negative amortization” or “subprime” loans, all of which are loans with higher risk underwriting characteristics.
Second position residential loans totaled a minimal $1.3 million as of September 30, 2016, consisting of $1.2 million of home equity lines of credit and $0.1 million of home equity loans. These loans are provided as an additional lending service to customers.
| RP® Financial, LC. | OVERVIEW AND FINANCIAL ANALYSIS |
I.14
Commercial Real Estate/Multi-Family Lending
As of September 30, 2016, commercial real estate/multi-family loans totaled $29.2 million, or 15.0% of the total loan portfolio, and the balances of these loans have been trending upward in recent years due to the Bank’s focus to diversify its loan portfolio and increase yield. As of September 30, 2012, commercial real estate/multi-family loans totaled $27.1 million, or 14.3% of the total loan portfolio. These types of loans are attractive credits given the higher yields, larger balances, shorter duration and prospective relationship potential. Commercial real estate loans are generally balloon loans with an initial term of five years and an amortization term of 20 years, with a balloon payment at the end of the initial term. The maximum LTVs are generally 80% of the lower of cost or appraised value of the property securing the loan. Debt service coverage ratios are generally required at 1.20x.
These loans are generally priced at a higher rate of interest, have larger balances and involve a greater risk profile than 1-4 residential mortgage loans. Often the payments on commercial real estate loans are dependent on successful operations and management of the property. When originating commercial real estate loans, the Bank evaluates the qualifications and financial condition of the borrower, as well as the value and condition of the property securing the loan. The Bank will also generally require and obtain personal guarantees from the principals. The commercial real estate loans are generally secured by office buildings, industrial facilities, retail facilities, churches and 1-4 family non-owner occupied investment properties in the primary market area. As of September 30, 2016, the largest commercial real estate loan was $3.1 million and was secured by an owner occupied funeral home located in the primary market area. A certain portion of recent originations have been sourced from the Athens, Georgia LPO.
Construction/Land Loans
Construction and land loans totaled $13.3 million, or 6.9% of loans outstanding, at September 30, 2016, representing a modest, but increasing level of lending activity for the Bank. Most of the recent construction/land loans have been originated from the newly opened LPO near Athens. Such balances have increased from $2.0 million, or 1.0% of total loans as of September 30, 2012. Construction loans are made to individuals for the construction of their primary residences and loans to contractors and builders of single family homes. The Bank also makes land loans consisting of lots that will be used for future residential development. Newton Federal also originates construction loans for commercial development projects, including retail buildings, churches, small industrial, hotels and office buildings. Construction loans generally have initial
| RP® Financial, LC. | OVERVIEW AND FINANCIAL ANALYSIS |
I.15
terms of up to 12 months, during which the borrow pays interest only. Upon completion of construction, these loans may convert to permanent loans or may be paid off in full. Construction loans have loans and terms comparable to permanent commercial real estate loan originations, with maximum LTV is 80% of the lesser of the appraised value of the completed property.
Construction loans generally involve greater credit risk than improved owner-occupied real estate lending. Newton Federal reviews and inspects each property before disbursement of loan funds, and also requires detailed cost estimates to complete the construction project and an appraisal of the property. As of September 30, 2016, the largest construction/land loan had a total balance of $655,000, all of which was secured by improved building lots. This loan was performing according to its terms as of September 30, 2016.
Commercial Business Lending
As part of the full-service business lending philosophy, Newton Federal originates commercial business loans on non-real estate commercial business assets including lines of credit and term loans. The Bank originates commercial business loans to small businesses, professionals and sole proprietorships in the located regionally in its market area, including loans secured by business assets. As of September 30, 2016, the Bank had $16.2 million of commercial business loans in portfolio, equal to 8.4% of total loans, an increase from $4.2 million, or 2.2% of loans as of September 30, 2016. Newton Federal encourages the borrowers to maintain their primary deposit accounts with the Bank.
Commercial business term loans are either fixed rate or adjustable rate, with such rates based on the prime rate as published in the Wall Street Journal, plus a margin. Commercial business loans have greater credit risk compared to 1-4 family residential real estate loans, because the availability of funds for the repayment of commercial business loans are dependent on the success of the business and the general economic environment of the Bank’s market area. The Bank generally obtains personal guarantees with these loans. LTV’s are generally made up to 80% of the value of the collateral securing the loan.
Consumer Lending
To a minor extent, Newton Federal originates a variety of consumer loans to individuals who reside or work in the Bank’s market area, including loans secured by new and used automobiles, certificates of deposits, and unsecured personal loans. As of September 30, 2016, consumer loans totaled $2.3 million, or 1.2% of total loans. The Bank offers such loans since
| RP® Financial, LC. | OVERVIEW AND FINANCIAL ANALYSIS |
I.16
they tend to have shorter maturities and higher interest rates than mortgage loans. These loans also help to expand and create stronger customer relationships and opportunities for cross-marketing. Consumer loans have greater risk compared to mortgage loans, due to their dependence on the borrower’s continuing financial stability.
Loan Originations and Sales
All lending activities are conducted by bank personnel located at the office locations, including the LPO, underwritten pursuant to bank policies and procedures. Loan sources typically include loan officers, marketing efforts, the existing customer base, walk-in customers and referrals from real estate brokers, builders and attorneys. Newton Federal occasionally purchases whole loans from third parties to supplement internal loan production. These loans usually consist of loans to health care professionals and loans secured by manufactured housing. The majority of purchased loans are to borrowers who are not located in the primary market area.
Further, the Bank may purchase or sell participation interests in loans. Such loans are underwritten pursuant to existing bank underwriting criteria and procedures. The Bank has not historically sold participation interests in loans originated by the Bank. Historically, Newton Federal has not originated significant amounts of loans for sale, but such activity may increase in the future in order to assist in management of interest rate risk and to generate fee income. The Bank currently sell loans through the LenderSelect Mortgage Group. At September 30, 2016, there were a total of $472,000 of loans held for sale, and the Bank sold $2.3 million of loans during the year ended September 30, 2016.
Asset Quality
Newton Federal’s lending operations include originations of commercial real estate/multi-family, commercial business, construction/land and consumer loans for portfolio, all of which carry a higher risk profile than traditional 1-4 family mortgage lending. Since fiscal 2012 the Bank has recorded a declining level of non-performing assets (“NPAs”), consisting of non-accruing loans and OREO. NPAs have ranged from a low of $3.1 million as of September 30, 2015 to a high of $18.9 million at September 30, 2012, and totaled $3.2 million at September 30, 2016. This balance consisted solely of non-accruing loans, as the OREO balance was zero. The non-accruing loans were comprised of 1-4 family first and second position loans (93%) and commercial loans (7%). Exhibit I-11 presents a history of NPAs for the Bank since 2012.
| RP® Financial, LC. | OVERVIEW AND FINANCIAL ANALYSIS |
I.17
To track the Bank’s asset quality and the adequacy of valuation allowances, Newton Federal has established detailed asset classification policies and procedures which are consistent with regulatory guidelines. Detailed asset classifications are reviewed quarterly by senior management and the Board. Pursuant to these procedures, when needed, the Bank establishes additional valuation allowances to cover anticipated losses in classified or non-classified assets. As of September 30, 2016, the Bank maintained an allowance for loan losses of $4.3 million, equal to 2.22% of total loans receivable and 132.87% of non-accruing loans.
Funding Composition and Strategy
Deposits have traditionally accounted for all of the Bank’s IBL, as no borrowings has been used over the past five fiscal years. At September 30, 2016, deposits equaled $181.7 million. Exhibit I-12 sets forth the Bank’s deposit composition for the past three years and Exhibit I-13 provides the maturity composition of the certificate of deposit (“CD”) portfolio at September 30, 2016 for all CDs in excess of $250,000 in balance. CDs constitute the largest but decreasing portion of the Bank’s deposit base, totaling 47.1% of deposits at September 30, 2016 versus 59.0% of deposits as of September 30, 2012. Checking and savings accounts equaled $73.6 million, or 40.5% of total deposits as of September 30, 2016, versus $49.8 million, or 27.8% of total deposits at September 30, 2012.
Newton Federal’s current CD composition reflects a concentration of short-term CDs (maturities of one year or less). As of September 30, 2016, the CD portfolio totaled $85.5 million, and $35.0 million of CDs with balances in excess of $250,000. Of the CDs with balances greater than $250,000, 39.6% of the CDs were scheduled to mature in one year or less. There were no brokered CDs in portfolio as of September 30, 2016.
Newton Federal has not historically utilized borrowings for funding. The Bank has not needed such funds due to the level of lending activities and available cash and liquidity, which has been used for recent increases in portfolio loans. The Bank maintains a $58.0 million line of credit with the FHLB of Atlanta as a contingent funding source. Newton Federal also has two un-secured federal funds lines of credit for a total amount of $12.5 million. No amounts have been utilized under these borrowing relationships except for annual testing of the funding sources.
Subsidiary Operations
The Bank currently does not operate any subsidiaries. Upon completion of the conversion, Newton Federal will become the wholly-owned subsidiary of the Company.
| RP® Financial, LC. | OVERVIEW AND FINANCIAL ANALYSIS |
I.18
Legal Proceedings
The Bank is not involved in any pending legal proceedings other than routine legal proceedings occurring in the ordinary course of business which, in the aggregate, are believed by management to be immaterial to the financial condition of the Bank.
| RP® Financial, LC. | MARKET AREA |
II.1
II. MARKET AREA ANALYSIS
Introduction
Newton Federal currently conducts operations through three banking offices in Newton County, Georgia and an LPO in Bogart, Oconee County, Georgia. Newton County is located approximately 35 miles east of Atlanta, Georgia, while Oconee County is part of the Athens, Georgia metropolitan area. The Bank’s primary market area for deposit gathering thus consists of Newton County, while lending activities are focused in Newton County (1-4 family residential and commercial lending) and Gwinnett, Clarke, Walton, Barrow, Oconee and Jackson Counties (commercial and construction lending). The expansion of the lending market beyond Newton County (all of the additional counties are located to the north and northeast of Newton County extending to the city of Athens, Georgia), has been recently pursued in order to gain access to a larger market for business activities that has more favorable demographic and economic characteristics and trends. The LPO in Oconee County was opened in January 2016 and is staffed by loan originators that have experience and knowledge of the market area counties outside of Newton County. The primary market area contains small towns and has suburban and rural areas, all of which are exurbs of the Atlanta metropolitan area. The LPO is located close to the city of Athens, Georgia (Clarke County), the site of the University of Georgia. Details of the Bank’s office buildings are presented in Exhibit II-1.
The regional market area has a diversified economy, with services, wholesale/retail trade, construction, health care, manufacturing and state and local government constituting the primary sectors of employment. Within the expanded market area counties, income levels and housing values are generally higher than levels found in the Bank’s traditional Newton County market. The regional banking environment is highly competitive, and includes a large number of commercial banks, along with a number of credit unions and other financial services companies, some of which have a national presence. Within this region, community banking institutions remain a part of the banking industry.
Future business and growth opportunities will be partially influenced by economic and demographic characteristics of the markets served by the Bank, particularly the future growth trends of the regional economy, demographic growth trends, and the nature and intensity of the competitive environment for financial institutions. These factors outlined herein have been accounted for in the determination of the Company’s pro forma market value.
| RP® Financial, LC. | MARKET AREA |
II.2
National Economic Factors
The business potential of a financial institution is partially dependent on the future operating environment and growth opportunities for the financial services industry and the economy as a whole. Since the end of the “great recession” in 2009, the national economy has recorded modest growth rates, in terms of gross domestic product (“GDP”), ranging from a low of 1.6% in calendar year 2011 to a high of 2.5% in calendar year 2010. GDP growth was 2.2% for calendar year 2013, 2.4% for calendar years 2014 and 2015, and an annualized 1.8% for the nine months ended September 30, 2016, indicating positive, yet modest growth for the US economy. As a result of the recession, approximately 8 million jobs were lost as consumers cut back on spending, causing a reduction in the need for many products and services. Total personal wealth declined notably due to the housing crisis and the drop in real estate values. The economy has recorded slow, but steady job growth since reaching a low in early 2010, with approximately 2.5 million jobs added in 2015, and a total of 1.6 million jobs created for the nine months ended September 30, 2016.
For the 12 months ended October 2016, the national inflation rate was 1.06%, showing that inflation remains under control. Indicating a level of continued improvement, the national unemployment rate equaled 4.7% as of October 2016, slightly lower than the 4.8% rate as of October 2015. Job growth is expected to slow as baby boomers are aging and economy is approaching full employment level nationally. The Federal Reserve has indicated that it will continue efforts to stimulate growth in the economy through maintaining low interest rates, although certain signals have been given that rates may start to rise by the end of 2016. Low interest rates are expected to remain a focus in order to support a continued recovery of the economy in general and the housing sector specifically.
The major stock exchange indices have fluctuated, but trended upward over the last 12 months. Stock prices continue to be impacted by world events, including during the second half of June 2016, with Britain’s late-June vote on exiting the European Union (“Brexit”) impacting global stock markets. Stocks traded higher ahead of the Brexit vote and then plunged sharply lower, as the shock from Britain’s vote to leave the European Union swept across global stock markets. Further impacts to the stock market included the national election through November 2016 and the implications of the new administration that will be in place in early 2017. As an indication of the changes in the nation’s stock markets over the last 12 months, on September 30, 2016, the DJIA closed at 18,308.15, an increase of 12.4% from September 30, 2015, and the
| RP® Financial, LC. | MARKET AREA |
II.3
NASDAQ Composite Index closed at 5,312.00 an increase of 15.0% over the same time period. The S&P 500 closed at 2,168.27 on September 30, 2016, an increase of 13.0% from September 30, 2015. Forecasts indicate mediocre economic growth through 2017, with an expectation of a mild recession in 2018, given that the economic recovery is already the third longest in history.
Regarding factors that most directly impact the banking and financial services industries, the residential real estate industry has, to a large extent, recovered from the 2007-2009 housing crisis and recession. Following a relatively slow recovery through early 2012, in recent periods the number of housing foreclosures has remained modest, new and previously-owned home sales have increased, and residential housing prices have continued to trend upward in most metropolitan areas of the country. Home builders continue to report strong activity for new home construction. National home price indices have, to a large extent, recovered from the lows reached in 2009, with the national median home price reaching $236,450 in June 2016, versus $169,000 in March 2009. The commercial real estate market has also generally improved through mid-2016, in terms of sales activity, lease terms, and vacancy rates. However, competition among lenders remains high in most regions of the country.
According to the September 2016 housing forecast from the Mortgage Bankers Association (the “MBA”), existing home sales are projected to increase by approximately 4.8% and new home sales are expected to increase by 15.7% through the course of 2016. The MBA forecast also showed modest increase in the median sales prices for existing homes in 2016 and 2017. Total mortgage production is forecasted to increase in 2016 to $1.838 trillion compared to $1.630 trillion in 2015. The growth in 2016 originations is due in part to 11.4% increase in home purchase mortgage originations, with purchase lending forecasted to total $981 billion in 2016. Comparatively, refinancing volumes are predicted to increase by 14.4% in 2016, with refinancing volume forecasted to total $857 billion in 2016. For 2017, refinancing volume is projected to decline significantly, while home purchase mortgage originations are projected to continue growing.
Based on the consensus outlook of nearly 63 economists surveyed by The Wall Street Journal in September 2016, the U.S. economy is poised for stronger growth in 2016, with GDP growth forecasted at 1.8% for the year, due to lower gas prices, a tighter job market and expectation of steady wage gains. The forecast reveals the U.S. economy should grow at a faster pace of 2.2% in 2017. Economists expect that the unemployment rate will continue to steadily decline, from 5.0% in August 2016 to 4.7% by December 2016, and is forecasted to fall to 4.6%
| RP® Financial, LC. | MARKET AREA |
II.4
by the end of 2017, which would be the lowest jobless rate since April 2008. On average, the economists expect the Federal Reserve to begin raising its target rate in fourth quarter of 2016, and forecast an increase in 10-year Treasury yield to 1.8% by the end of 2016; thereafter increasing to 2.0% through June 2017. Inflation pressures were forecasted to remain below 2.5% through the end of 2017 and the price of oil was expected to increase to approximately $47 a barrel through the end of 2016.
Interest Rate Environment
The Federal Reserve manages interest rates in order to promote economic growth and to avoid inflationary periods. Amid increased indications of the economic downturn developing in 2007, the Fed began reducing market interest rates. Beginning in August 2007 and through December 2008, the Fed decreased market interest rates a total of 12 times in an effort to stimulate the economy, both for personal and business spending. As of January 2009, the Discount Rate had been lowered to 0.50%, and the Federal Funds rate target was 0.00% to 0.25%. These historically low rates were intended to enable a faster recovery of the housing industry, while at the same time lower business borrowing costs, and such rates remained in effect through early 2010. In February 2010, the Fed increased the discount rate to 0.75%, reflecting a slight change to monetary strategy. The effect of the interest rate decreases since mid-2008 has been most evident in short term rates, which decreased more than longer term rates, increasing the slope of the yield curve. The low interest rate environment has been maintained as part of a strategy to stimulate the economy by keeping both personal and business borrowing costs as low as possible. The strategy has achieved its goals, as borrowing costs for residential housing have been at historical lows, and the prime rate of interest remains at a low level.
As of September 30, 2016, the bond equivalent yields for U.S. Treasury bonds with terms of one and ten years equaled 0.59% and 1.60%, respectively, versus comparable year ago yields of 0.33% and 2.06%. The overall low interest rates have had an unfavorable impact on the net interest margins of many financial institutions, as they rely on a spread between the yields on longer term assets and the costs of shorter term funding sources. In the last couple of years, asset yields have continued to decline, while material reductions in liability costs have ceased, resulting a gradual reduction in yield/cost spreads for many institutions. In addition, institutions who originate substantial volumes of prime-based loans have also given up yield as the prime
| RP® Financial, LC. | MARKET AREA |
II.5
rate declined from 5.00% as of June 30, 2008 to 3.25% as of December 31, 2008. The rate remained at that level until January 2016, when it increased to 3.50%. This low interest rate environment, along with continued competition in the industry for quality loans, has placed downward pressure on net interest margins. Historical interest rate trends are presented in Exhibit II-2.
Market Area Regional Economy
Newton Federal’s primary market area (extending from Newton County in the south to the city of Athens in the north), lies in the heart of Georgia’s “Innovation Crescent”, a multi-county region anchored by Hartsfield-Jackson Atlanta International Airport and the Georgia Institute of Technology at the southern end and the University of Georgia and the Interstate 85 corridor on the northern end, with the region between Atlanta and Athens connected by the “Innovation Corridor”, Georgia Highway 316. The Crescent spans the area of Georgia to the east of the Atlanta metropolitan area. This region, typically one of the nation’s most economically active and diverse areas, is home to 40% of Georgia’s population, 16 Fortune 500 company headquarters, and 7 of the top 100 Health Information Technology company headquarters.
The Innovation Crescent serves as a hub for the life sciences, biotech and technology firms and contains highly rated research universities and government facilities such as the Centers for Disease Control. The higher education universities include the University of Georgia, Georgia Tech, Emory University, Morehouse School of Medicine, The Technical College System of Georgia and Georgia State University. There also is a concentration in advanced manufacturing firms and logistics and distribution centers. The region is centrally located in the southeastern US, with easy access to transportation facilities both nationally and internationally.
Newton Federal’s specific market area counties are also impacted by the economy and presence of the Atlanta metropolitan area, as a portion of the market area residents commute to employment in the city of Atlanta or in the close-in suburbs of Atlanta. The city of Covington, Georgia lies approximately 35 miles east of downtown Atlanta, with easy access along Interstate 20. The other market area counties also are within reasonable commuting distance to Atlanta.
| RP® Financial, LC. | MARKET AREA |
II.6
Regional Employment
Table 2.1 details the largest employers in the Bank’s market area counties. The market area contains a diverse cross section of employment sectors, which partially mitigates the risk
Table 2.1
Newton Federal Bank
Market Area Largest Employers
| Company/Institution |
County | Employees | ||||
| Newton County Board of Education |
Newton | 2,324 | ||||
| Shire Pharmaceuticals |
Newton | 1,500 | ||||
| CR Bard |
Newton | 650 | ||||
| Newton County Government |
Newton | 615 | ||||
| Piedmont Newton Hospital |
Newton | 600 | ||||
| General Mills |
Newton | 575 | ||||
| Pactiv Corp. |
Newton | 500 | ||||
| SRG Global |
Newton | 385 | ||||
| Walton County Board of Education |
Walton | 1,876 | ||||
| Wal-Mart Supply Chain |
Walton | 1,718 | ||||
| Hitachi Automotive Systems |
Walton | 900 | ||||
| Walton County Government |
Walton | 721 | ||||
| Gwinnett County Public School System |
Gwinnett | 20,479 | ||||
| Gwinnett County Government |
Gwinnett | 4,854 | ||||
| Gwinnett Health Care System |
Gwinnett | 3,566 | ||||
| Publix |
Gwinnett | 3,558 | ||||
| Barrow County School System |
Barrow | 2,100 | ||||
| Chico’s FAS, Inc. |
Barrow | 1,200 | ||||
| Harrison Poultry |
Barrow | 1,100 | ||||
| University of Georgia |
Clark, Madison, Oconee | 9,400 | ||||
| Athens Regional Medical Center |
Clark, Madison, Oconee | 2,720 | ||||
| Clarke County School District |
Clark, Madison, Oconee | 2,100 | ||||
| ConAgra |
Clark, Madison, Oconee | 1,590 | ||||
| Athens-Clarke County Government |
Clark, Madison, Oconee | 1,500 | ||||
Source: County and Government Websites.
associated with a decline in any particular economic sector or industry. Similar to many areas of the country, the largest employers typically include local school systems and local governments. Further, health care employment continues to expand in the nation, and the Bank’s market area also includes certain regional health care facilities. The above described Innovation Crescent has resulted in significant employment in the life sciences and technology, including employment in areas such as bio-medical, agriculture and food sciences, bio-chemistry and bio-physics, and nuclear medicine. There is further employment in services, retail and trade, with the size and scope of the market area employment resulting in a diversified employment base. As indicated earlier, a notable portion of residents also commute into the Atlanta metropolitan area for employment.
| RP® Financial, LC. | MARKET AREA |
II.7
Market Area Demographics
Demographic and economic growth trends, measured by changes in population, number of households, age distribution and median household income, provide key insight into the health of the Bank’s market area. Trends in these key measures are summarized by the data presented in Table 2.2 from 2010 to 2017 (estimated by the census) and projected through 2022, with additional detail shown in Exhibit II-3. The Bank’s market area population base totaled 108,000 in Newton County, the location of most residential lending and the deposit gathering branch offices. The other expanded market area counties contained a total population of 1.3 million, including 0.9 million in Gwinnett County. This recent market area expansion thus provides a significant population base for access to additional loan and deposit customers.
The original market area county of Newton recorded population growth from 2010 to 2017 of 1.1% annually, which was slightly higher than the state growth rate of 1.0%, and much higher than the national growth rate of 0.7%. The expanded market area counties are also included in Table 2.2, revealing that all such counties recorded annual population growth equal to or higher than the state growth rate from 2010-2017, with such growth rates ranging from a low of 1.0% in Walton and Jackson Counties to a high of 2.0% in Barrow County. Projections for the next five years indicate that these growth trends are expected to continue, with Newton County also recording relatively comparable population growth. This data supports the efforts by the Bank of expanding the market area counties to areas outside of Newton County, and into areas of strong growth trends. Household growth rates showed similar relative trends for all of the market area counties, the state and nation.
Age distribution figures in Table 2.2 indicate that the state of Georgia has a generally lower age profile than the nation as a whole. This characteristic is also present in the Bank’s market area counties, including the home county of Newton. This indicates that a larger portion of the residents are in their higher income or higher wealth years, a favorable characteristic for financial institutions such as the Bank.
Income levels in the market area tend to reflect the nature of the markets served, with the expanded market area counties recording higher income levels than Newton County in terms of median household and per capita incomes. Such levels of income reinforce the attractiveness of the expanded market area, which contains a higher proportion of professional and technical jobs
| RP® Financial, LC. | MARKET AREA |
II.8
Table 2.2
Newton Federal Bank
Summary Demographic Data
| Year | Growth Rate | |||||||||||||||||||
| 2010 | 2017 | 2022 | 2010-2017 | 2017-2022 | ||||||||||||||||
| (%) | (%) | |||||||||||||||||||
| Population (000) |
||||||||||||||||||||
| USA |
308,746 | 325,139 | 337,393 | 0.7 | % | 0.7 | % | |||||||||||||
| Georgia |
9,688 | 10,375 | 10,911 | 1.0 | % | 1.0 | % | |||||||||||||
| Newton County |
100 | 108 | 114 | 1.1 | % | 1.2 | % | |||||||||||||
| Gwinnett County |
805 | 923 | 998 | 2.0 | % | 1.6 | % | |||||||||||||
| Barrow County |
69 | 78 | 84 | 1.7 | % | 1.6 | % | |||||||||||||
| Walton County |
84 | 90 | 95 | 1.0 | % | 1.1 | % | |||||||||||||
| Jackson County |
60 | 65 | 69 | 1.0 | % | 1.2 | % | |||||||||||||
| Clark County |
117 | 126 | 134 | 1.2 | % | 1.2 | % | |||||||||||||
| Oconee County |
33 | 37 | 40 | 1.8 | % | 1.6 | % | |||||||||||||
| Households (000) |
||||||||||||||||||||
| USA |
116,716 | 123,357 | 128,247 | 0.8 | % | 0.8 | % | |||||||||||||
| Georgia |
3,586 | 3,854 | 4,062 | 1.0 | % | 1.1 | % | |||||||||||||
| Newton County |
34 | 37 | 39 | 0.9 | % | 1.1 | % | |||||||||||||
| Gwinnett County |
269 | 304 | 327 | 1.8 | % | 1.5 | % | |||||||||||||
| Barrow County |
24 | 27 | 29 | 1.5 | % | 1.5 | % | |||||||||||||
| Walton County |
30 | 32 | 34 | 1.1 | % | 1.1 | % | |||||||||||||
| Jackson County |
21 | 23 | 24 | 0.8 | % | 1.1 | % | |||||||||||||
| Clark County |
45 | 48 | 51 | 0.9 | % | 1.3 | % | |||||||||||||
| Oconee County |
12 | 13 | 14 | 1.9 | % | 1.7 | % | |||||||||||||
| Median Household Income ($) |
||||||||||||||||||||
| USA |
NA | 57,462 | 61,642 | NA | 1.4 | % | ||||||||||||||
| Georgia |
NA | 52,421 | 56,517 | NA | 1.5 | % | ||||||||||||||
| Newton County |
NA | 49,669 | 52,667 | NA | 1.2 | % | ||||||||||||||
| Gwinnett County |
NA | 63,148 | 66,521 | NA | 1.0 | % | ||||||||||||||
| Barrow County |
NA | 52,405 | 54,971 | NA | 1.0 | % | ||||||||||||||
| Walton County |
NA | 54,096 | 56,950 | NA | 1.0 | % | ||||||||||||||
| Jackson County |
NA | 57,111 | 62,006 | NA | 1.7 | % | ||||||||||||||
| Clark County |
NA | 32,847 | 34,181 | NA | 0.8 | % | ||||||||||||||
| Oconee County |
NA | 76,548 | 80,089 | NA | 0.9 | % | ||||||||||||||
| Per Capita Income ($) |
||||||||||||||||||||
| USA |
NA | 31,459 | 34,068 | NA | 1.6 | % | ||||||||||||||
| Georgia |
NA | 28,400 | 30,771 | NA | 1.6 | % | ||||||||||||||
| Newton County |
NA | 22,448 | 23,538 | NA | 1.0 | % | ||||||||||||||
| Gwinnett County |
NA | 27,361 | 28,974 | NA | 1.2 | % | ||||||||||||||
| Barrow County |
NA | 21,267 | 22,235 | NA | 0.9 | % | ||||||||||||||
| Walton County |
NA | 24,268 | 25,757 | NA | 1.2 | % | ||||||||||||||
| Jackson County |
NA | 24,987 | 27,123 | NA | 1.7 | % | ||||||||||||||
| Clark County |
NA | 22,369 | 23,519 | NA | 1.0 | % | ||||||||||||||
| Oconee County |
NA | 36,468 | 38,488 | NA | 1.1 | % | ||||||||||||||
| 2017 Age Distribution (%) |
0-14 Yrs. | 15-34 Yrs. | 35-54 Yrs. | 55-69 Yrs. | 70+ Yrs. | |||||||||||||||
| USA |
18.8 | 27.1 | 25.7 | 18.1 | 10.3 | |||||||||||||||
| Georgia |
20.0 | 27.7 | 26.8 | 16.9 | 8.6 | |||||||||||||||
| Newton County |
21.4 | 26.9 | 27.4 | 16.0 | 8.3 | |||||||||||||||
| Gwinnett County |
22.0 | 27.4 | 29.3 | 15.3 | 5.9 | |||||||||||||||
| Barrow County |
22.3 | 26.8 | 27.6 | 15.5 | 7.8 | |||||||||||||||
| Walton County |
20.3 | 25.5 | 26.8 | 17.6 | 9.9 | |||||||||||||||
| Jackson County |
20.7 | 24.7 | 27.7 | 17.4 | 9.5 | |||||||||||||||
| Clark County |
15.4 | 45.6 | 20.4 | 11.8 | 6.8 | |||||||||||||||
| Oconee County |
19.8 | 24.0 | 27.7 | 19.1 | 9.4 | |||||||||||||||
| 2017 HH Income Dist. (%) |
Less Than 25,000 |
$25,000 to 50,000 |
$50,000 to 100,000 |
$100,000+ | ||||||||||||||||
| USA |
21.9 | 22.9 | 29.5 | 25.7 | ||||||||||||||||
| Georgia |
24.2 | 24.1 | 29.2 | 22.5 | ||||||||||||||||
| Newton County |
24.4 | 26.0 | 31.5 | 18.1 | ||||||||||||||||
| Gwinnett County |
16.5 | 23.6 | 32.1 | 27.8 | ||||||||||||||||
| Barrow County |
19.5 | 28.3 | 36.7 | 15.5 | ||||||||||||||||
| Walton County |
21.1 | 25.4 | 33.5 | 19.9 | ||||||||||||||||
| Jackson County |
21.6 | 23.0 | 32.4 | 23.0 | ||||||||||||||||
| Clark County |
40.8 | 24.1 | 22.0 | 13.1 | ||||||||||||||||
| Oconee County |
13.5 | 18.8 | 30.7 | 37.0 | ||||||||||||||||
Source: SNL Financial, LC.
| RP® Financial, LC. | MARKET AREA |
II.9
in the life sciences and other employment areas that require a higher level of skills and education. Such incomes, with the exception of Clarke County (which contains a large student population base), were also in-line with or higher than statewide averages. The greater wealth of these markets confirms the efforts by the Crescent region to build a higher income employment base.
Household income levels shown in Table 2.2 also support this income data, with the market area having a higher proportion of households earning incomes in the $25,000 to $100,000 range, the type of incomes expected to be seen in the expanded market area counties and the employment characteristics implied by the Innovation Crescent.
Regional Economy
Comparative employment sector data for Newton Federal’s market area presented in Table 2.3 shows that employment in the services industry constituted the major source of jobs in Newton County and the expanded market area counties, while wholesale/retail employment and construction generally were the second and third largest employment sectors for the Bank’s primary market area counties. The level of construction employment is consistent with the higher demographic and economic growth characteristics of the market area. Finance/insurance/real estate employment represented a fourth significant employment sector. The data indicates that the Bank’s market area counties have economies that are relatively diversified.
Table 2.3
Newton Federal Bank
Primary Market Area Employment Sectors
(Percent of Labor Force)
| Newton | Gwinnett | Barrow | Walton | Jackson | Clarke | Oconee | ||||||||||||||||||||||||||
| Employment Sector |
Georgia | County | County | County | County | County | County | County | ||||||||||||||||||||||||
| (% of Total Employment) | ||||||||||||||||||||||||||||||||
| Services |
34.5 | % | 32.9 | % | 32.9 | % | 30.9 | % | 31.4 | % | 29.2 | % | 34.9 | % | 33.0 | % | ||||||||||||||||
| Healthcare |
4.9 | % | 4.1 | % | 4.6 | % | 4.3 | % | 4.2 | % | 3.2 | % | 6.4 | % | 5.8 | % | ||||||||||||||||
| Government |
3.7 | % | 2.9 | % | 0.7 | % | 5.1 | % | 3.9 | % | 6.0 | % | 4.8 | % | 4.0 | % | ||||||||||||||||
| Wholesale/Retail Trade |
25.7 | % | 24.5 | % | 26.4 | % | 25.5 | % | 23.4 | % | 28.4 | % | 26.9 | % | 21.4 | % | ||||||||||||||||
| Finance/Ins/Real Estate |
10.2 | % | 8.4 | % | 9.8 | % | 8.2 | % | 9.1 | % | 9.0 | % | 11.4 | % | 12.4 | % | ||||||||||||||||
| Manufacturing |
2.9 | % | 3.6 | % | 3.8 | % | 3.9 | % | 2.8 | % | 4.2 | % | 2.5 | % | 2.1 | % | ||||||||||||||||
| Construction |
7.9 | % | 12.0 | % | 9.6 | % | 10.8 | % | 14.1 | % | 10.0 | % | 5.7 | % | 10.3 | % | ||||||||||||||||
| Information |
1.0 | % | 0.7 | % | 1.2 | % | 0.8 | % | 0.7 | % | 0.5 | % | 0.9 | % | 1.0 | % | ||||||||||||||||
| Transportation/Utility |
3.4 | % | 3.7 | % | 2.9 | % | 3.8 | % | 3.4 | % | 3.4 | % | 2.6 | % | 2.7 | % | ||||||||||||||||
| Agriculture |
2.5 | % | 3.8 | % | 2.1 | % | 3.7 | % | 4.0 | % | 3.6 | % | 2.2 | % | 5.5 | % | ||||||||||||||||
| Other |
3.3 | % | 3.2 | % | 5.9 | % | 2.8 | % | 3.0 | % | 2.4 | % | 1.7 | % | 1.9 | % | ||||||||||||||||
|
|
|
|
|
|
|
|
|
|
|
|
|
|
|
|
|
|||||||||||||||||
| 100.0 | % | 100.0 | % | 100.0 | % | 100.0 | % | 100.0 | % | 100.0 | % | 100.0 | % | 100.0 | % | |||||||||||||||||
Source: SNL Financial, LC.
| RP® Financial, LC. | MARKET AREA |
II.10
Unemployment Data
Comparative unemployment rates for Newton County and the expanded market area counties, as well as for the U.S. and Georgia, are shown in Table 2.4. As of September 2016, Newton County reported a notably higher unemployment level than the state of Georgia and the expanded market area counties. This also provides an indication of the economic strength of the expanded market area that is located within the Innovation Crescent, and the more limited market in Newton County. Newton County’s unemployment rate of 5.9% was about 1.0% higher than the comparative rates, with such rate declining somewhat over the past 12 months. The statewide and expanded market area counties reported relatively stable unemployment rates over the past year, with such rates in general at a “full employment” level of just under 5.0%.
Table 2.4
Newton Federal Bank
Unemployment Trends
| Region |
Sept. 2015 Unemployment |
Sept. 2016 Unemployment |
Change | |||||||||
| USA |
4.9 | % | 4.8 | % | -0.1 | % | ||||||
| Georgia |
5.6 | % | 5.3 | % | -0.3 | % | ||||||
| Newton County |
6.3 | % | 5.9 | % | -0.4 | % | ||||||
| Expanded Market Area Avg |
4.8 | % | 4.9 | % | 0.1 | % | ||||||
| Gwinnett County |
4.9 | % | 4.7 | % | -0.2 | % | ||||||
| Clarke County |
5.6 | % | 6.0 | % | 0.4 | % | ||||||
| Walton County |
5.0 | % | 5.1 | % | 0.1 | % | ||||||
| Barrow County |
4.9 | % | 4.9 | % | 0.0 | % | ||||||
| Oconee County |
4.2 | % | 4.4 | % | 0.2 | % | ||||||
| Jackson County |
4.4 | % | 4.3 | % | -0.1 | % | ||||||
Source: U.S. Bureau of Labor Statistics.
Market Area Deposit Characteristics/Competition
The Bank’s deposit base is closely tied to the economic fortunes of Newton County, the location of the Bank’s three branches. Table 2.5 displays deposit market trends from June 30, 2013 through June 30, 2016 for Newton Federal, as well as for all commercial bank and savings institution branches located in Newton County, the expanded market area counties and the state
| RP® Financial, LC. | MARKET AREA |
II.11
Table 2.5
Newton Federal Bank
Deposit Summary
| As of June 30, | ||||||||||||||||||||||||||||
| 2013 | 2016 | Deposit | ||||||||||||||||||||||||||
| Deposits | Market Share |
No. of Branches |
Deposits | Market Share |
No. of Branches |
Growth Rate 2013-2016 |
||||||||||||||||||||||
| (Dollars in Thousands) | (%) | |||||||||||||||||||||||||||
| Georgia |
$ | 187,642,000 | 100.0 | % | 2,576 | $ | 225,317,000 | 100.0 | % | 2,440 | 6.3 | % | ||||||||||||||||
| Commercial Banks |
183,988,000 | 98.1 | % | 2,466 | 222,313,000 | 98.7 | % | 2,351 | 6.5 | % | ||||||||||||||||||
| Savings Institutions |
3,654,000 | 1.9 | % | 110 | 3,004,000 | 1.3 | % | 89 | -6.3 | % | ||||||||||||||||||
| Newton County |
$ | 827,798 | 100.0 | % | 109 | $ | 873,294 | 100.0 | % | 16 | 1.8 | % | ||||||||||||||||
| Commercial Banks |
634,731 | 76.7 | % | 103 | 683,101 | 78.2 | % | 10 | 2.5 | % | ||||||||||||||||||
| Savings Institutions |
193,067 | 23.3 | % | 6 | 190,193 | 21.8 | % | 6 | -0.5 | % | ||||||||||||||||||
| Newton Federal |
186,895 | 22.6 | % | 3 | 182,100 | 20.9 | % | 3 | -0.9 | % | ||||||||||||||||||
| Expanded Market Area-Below Listed Counties |
||||||||||||||||||||||||||||
| Total Deposits |
$ | 16,326,575 | 100.0 | % | 282 | $ | 19,872,009 | 100.0 | % | 268 | 6.8 | % | ||||||||||||||||
| Commercial Banks |
16,180,674 | 99.1 | % | 273 | 19,779,412 | 99.5 | % | 260 | 6.9 | % | ||||||||||||||||||
| Savings Institutions |
145,901 | 0.9 | % | 9 | 92,597 | 0.5 | % | 8 | -14.1 | % | ||||||||||||||||||
| Gwinnett County |
$ | 11,907,835 | 100.0 | % | 201 | $ | 14,724,037 | 100.0 | % | 192 | 7.3 | % | ||||||||||||||||
| Commercial Banks |
11,827,006 | 99.3 | % | 193 | 14,697,379 | 99.8 | % | 185 | 7.5 | % | ||||||||||||||||||
| Savings Institutions |
80,829 | 0.7 | % | 8 | 26,658 | 0.2 | % | 7 | -30.9 | % | ||||||||||||||||||
| Clarke County |
$ | 2,398,139 | 100.0 | % | 33 | $ | 2,826,332 | 100.0 | % | 32 | 5.6 | % | ||||||||||||||||
| Commercial Banks |
2,398,139 | 100.0 | % | 33 | 2,826,332 | 100.0 | % | 32 | 5.6 | % | ||||||||||||||||||
| Savings Institutions |
0 | 0.0 | % | 0 | 0 | 0.0 | % | 0 | 0.0 | % | ||||||||||||||||||
| Walton County |
$ | 821,785 | 100.0 | % | 17 | $ | 958,386 | 100.0 | % | 17 | 5.3 | % | ||||||||||||||||
| Commercial Banks |
819,021 | 99.7 | % | 16 | 958,386 | 100.0 | % | 17 | 5.4 | % | ||||||||||||||||||
| Savings Institutions |
2,764 | 0.3 | % | 1 | 0 | 0.0 | % | 0 | -100.0 | % | ||||||||||||||||||
| Barrow County |
$ | 740,024 | 100.0 | % | 16 | $ | 804,449 | 100.0 | % | 14 | 2.8 | % | ||||||||||||||||
| Commercial Banks |
740,024 | 100.0 | % | 16 | 804,449 | 100.0 | % | 14 | 2.8 | % | ||||||||||||||||||
| Savings Institutions |
0 | 0.0 | % | 0 | 0 | 0.0 | % | 0 | 0.0 | % | ||||||||||||||||||
| Oconee County |
$ | 596,989 | 100.0 | % | 13 | $ | 802,433 | 100.0 | % | 13 | 10.4 | % | ||||||||||||||||
| Commercial Banks |
531,917 | 89.1 | % | 12 | 736,494 | 91.8 | % | 12 | 11.5 | % | ||||||||||||||||||
| Savings Institutions |
65,072 | 10.9 | % | 1 | 65,939 | 8.2 | % | 1 | 0.4 | % | ||||||||||||||||||
| Jackson County |
$ | 680,824 | 100.0 | % | 18 | $ | 714,758 | 100.0 | % | 17 | 1.6 | % | ||||||||||||||||
| Commercial Banks |
680,824 | 100.0 | % | 18 | 714,758 | 100.0 | % | 17 | 1.6 | % | ||||||||||||||||||
| Savings Institutions |
0 | 0.0 | % | 0 | 0 | 0.0 | % | 0 | 0.0 | % | ||||||||||||||||||
| Source: FDIC. |
||||||||||||||||||||||||||||
of Georgia. In the state of Georgia, commercial banks hold essentially all financial institution deposits, with a market share of 98.7% as of June 30, 2016. Since June 30, 2010, commercial banks increased deposits at an annual rate of 6.5%, versus a decline of 6.3% annually for savings institutions.
| RP® Financial, LC. | MARKET AREA |
II.12
Consistent with the state of Georgia, commercial banks maintained a dominant market share of deposits versus savings institutions in all of Newton Federal’s market area counties, except for Newton County, which recorded the deposits held by the Bank. For the three-year period covered in Table 2.5, savings institutions experienced a decrease in deposit market share in Newton County of 0.5% annually, while overall deposits increased at an annual rate of 1.8%. This deposit growth rate is lower than the expanded market area counties, which together recorded an annual increase in deposits of 6.8% over the most recent three year period, and the statewide rate of 6.3% over the same time period. The most rapid deposit growth over the time period shown in Table 2.5 was recorded in Oconee County (10.4% annually), with other high growth counties including Gwinnett County (7.4% annually) and Clarke County (5.6% annually). This implies that the expanded market area counties are a more attractive market area for financial institutions and future growth capabilities, and confirms the Bank’s efforts to expand the market area.
Based on June 30, 2016 deposit data, Newton Federal’s $182.1 million of deposits provided for a 20.9% market share of bank and thrift deposits in Newton County, indicating a relatively strong market presence. Due to the Bank’s net deposit shrinkage since June 30, 2014, the Bank’s deposit market share declined from 22.6% as of June 30, 2013. This data indicates a reduction in the competitiveness of the Bank given the overall market growth.
Competition
Newton Federal faces notable competition in both deposit gathering and lending activities, including direct competition with financial institutions that primarily have a local, regional or national presence. Securities firms and mutual funds also represent major sources of competition in raising deposits. In many cases, these competitors are also seeking to provide some or all of the community-oriented services as the Bank. With regard to lending competition, the Bank encounters the most significant competition from the same institutions providing deposit services. In addition, the Bank competes with mortgage companies, independent mortgage brokers, and credit unions. Table 2.6 lists the Bank’s largest competitors in the Newton County market area based on deposit market share as noted parenthetically, indicating that the large commercial banks with national operations dominate the local markets, with Newton Federal having a relatively high market share position. This is a positive factor in terms of competitive position for the Bank.
| RP® Financial, LC. | MARKET AREA |
II.13
Table 2.6
Newton Federal Bank
Market Area Deposit Competitors - Newton County
| Location |
Name |
Market Share |
Rank | |||
| Newton County, GA |
Synovus Bank | 24.38% | ||||
| Branch Banking and Trust Co. | 24.27% | |||||
| Newton Federal Bank | 20.85% | 3 out of 8 | ||||
| United Bank | 9.73% | |||||
| Pinnacle Bank | 8.58% | |||||
| Wells Fargo Bank, NA | 7.96% | |||||
| United Community Bank | 3.30% | |||||
| Guaranty Bank | 0.93% |
Source: SNL Financial, LC.
| RP® Financial, LC. | PEER GROUP ANALYSIS |
III.1
III. PEER GROUP ANALYSIS
This chapter presents an analysis of Newton Federal’s operations versus a group of comparable banks (the “Peer Group”) selected from the universe of all publicly-traded savings institutions in a manner consistent with the regulatory valuation guidelines. The basis of the pro forma market valuation of Newton Federal is derived from the pricing ratios of the Peer Group institutions, incorporating valuation adjustments for key differences in relation to the Peer Group. Since no Peer Group can be exactly comparable to Newton Federal, key areas examined for differences are: financial condition; profitability, growth and viability of earnings; asset growth; primary market area; dividends; liquidity of the shares; marketing of the issue; management; and effect of government regulations and regulatory reform.
Peer Group Selection
The Peer Group selection process is governed by the general parameters set forth in the regulatory valuation guidelines. Accordingly, the Peer Group is comprised of only those publicly-traded savings institutions whose common stock is either listed on a national exchange (NYSE or AMEX), or is NASDAQ listed, since their stock trading activity is regularly reported and generally more frequent than non-publicly traded and closely-held institutions. Institutions that are not listed on a national exchange or NASDAQ are inappropriate, since the trading activity for thinly-traded or closely-held stocks is typically highly irregular in terms of frequency and price and thus may not be a reliable indicator of market value. We have also excluded from the Peer Group those companies those under acquisition or subject to rumored acquisition and recent conversions, since their pricing ratios are subject to unusual distortion and/or have limited trading history. A recent listing of the universe of all publicly-traded savings institutions is included as Exhibit III-1.
Ideally, the Peer Group, which must have at least 10 members to comply with the regulatory valuation guidelines, should be comprised of publicly-traded MHCs with comparable resources, strategies and financial characteristics as Newton Federal. However, there are currently only eight publicly-traded MHCs. Accordingly, in deriving a Peer Group comprised of institutions with relatively comparable characteristics as Newton Federal, the companies selected for Newton Federal’s Peer Group are all fully-converted companies. The valuation adjustments applied in the Chapter IV analysis will take into consideration differences between the Company’s MHC form of ownership relative to the fully-converted Peer Group companies. Also included in Chapter IV is a pricing analysis of the publicly-traded MHCs on a fully-converted basis.
| RP® Financial, LC. | PEER GROUP ANALYSIS |
III.2
From the universe of publicly-traded thrifts, we selected 10 institutions with characteristics similar to those of Newton Federal. In the selection process, we applied one “screen” to the universe of all public companies that were eligible for consideration:
| • | Screen: Savings institutions with assets less than $600 million, equity/assets ratios above 12.50% and having been fully converted for at least one year. Ten companies met the criteria for the screen and were included in the Peer Group. |
Exhibit III-1 provides financial and public market pricing characteristics of all publicly-traded thrifts, while Exhibit III-2 provides financial and public market pricing characteristics for all savings institutions with assets greater than $600 million. Table 3.1 shows the general characteristics of each of the 10 Peer Group companies and Exhibit III-3 provides summary demographic and deposit market share data for the primary market areas served by each of the Peer Group companies. While there are expectedly some differences between the Peer Group companies and Newton Federal, we believe that the Peer Group companies, on average, provide a good basis for valuation subject to valuation adjustments. The following sections present a comparison of Newton Federal’s financial condition, income and expense trends, loan composition, credit risk and interest rate risk versus the Peer Group as of the most recent publicly available date. Comparative data for all publicly-traded thrifts have been included in the Chapter III tables as well.
A summary description of the key comparable characteristics of each of the Peer Group companies relative to Peer Group as a whole is detailed below.
| • | Anchor Bancorp of Washington. Comparable due to elevated equity/asset ratio, similar yield/cost spread, similar earning asset concentration in loans, elevated level of interest income and operating expenses. |
| • | Equitable Financial Corp. of Nebraska. Comparable due to elevated equity/asset ratio, similar earning asset concentration in loans, costing liability funding composition, similar return on assets with comparable non-interest income, limited investment in MBS, relatively favorable asset quality. |
| • | IF Bancorp, Inc. of Illinois. Comparable due to elevated equity/asset ratio, relatively limited asset growth in most recent year, similar funding costs, level of non-interest income and effective tax rate, level of construction loans. |
| • | Jacksonville Bancorp of Illinois. Comparable due to elevated equity/asset ratio, similar balance sheet funding composition, limited levels of non-recurring income or losses, similar operating expense ratio, elevated yield on interest earning assets and similar |
| RP® Financial, LC. | PEER GROUP ANALYSIS |
III.3
Table 3.1
Peer Group of Publicly-Traded Thrifts
As of November 25, 2016 or the Most Recent Date Available
| As of | ||||||||||||||||||||||||||||||||||||||||||
| November 25, 2016 | ||||||||||||||||||||||||||||||||||||||||||
| Total | Fiscal | Conv. | Stock | Market | ||||||||||||||||||||||||||||||||||||||
| Ticker |
Financial Institution |
Exchange | Region | City | State | Assets | Offices | Mth End | Date | Price | Value | |||||||||||||||||||||||||||||||
| ($Mil) | ($) | ($Mil) | ||||||||||||||||||||||||||||||||||||||||
| ANCB |
Anchor Bancorp | NASDAQ | WE | Lacey | WA | 436 | 10 | Jun | 1/26/11 | 25.40 | 64 | |||||||||||||||||||||||||||||||
| EQFN |
Equitable Financial Corp. | NASDAQ | MW | Grand Island | NE | 228 | 6 | Jun | 7/9/15 | 9.10 | 32 | |||||||||||||||||||||||||||||||
| IROQ |
IF Bancorp, Inc. | NASDAQ | MW | Watseka | IL | 589 | 6 | Jun | 7/8/11 | 19.35 | 76 | |||||||||||||||||||||||||||||||
| JXSB |
Jacksonville Bancorp, Inc. | NASDAQ | MW | Jacksonville | IL | 331 | 6 | Dec | 7/15/10 | 29.26 | 53 | |||||||||||||||||||||||||||||||
| MELR |
Melrose Bancorp, Inc. | NASDAQ | NE | Melrose | MA | 267 | 1 | Dec | 10/22/14 | 15.91 | 41 | |||||||||||||||||||||||||||||||
| MSBF |
MSB Financial Corp. | NASDAQ | MA | Millington | NJ | 434 | 5 | Dec | 7/17/15 | 13.70 | 78 | |||||||||||||||||||||||||||||||
| PBSK |
Poage Bankshares, Inc. | NASDAQ | MW | Ashland | KY | 449 | 10 | Dec | 9/13/11 | 18.95 | 70 | |||||||||||||||||||||||||||||||
| PBIP |
Prudential Bancorp, Inc. | NASDAQ | MA | Philadelphia | PA | 559 | 6 | Sep | 10/10/13 | 15.81 | 127 | |||||||||||||||||||||||||||||||
| UCBA |
United Community Bancorp | NASDAQ | MW | Lawrenceburg | IN | 528 | 8 | Jun | 1/10/13 | 16.20 | 68 | |||||||||||||||||||||||||||||||
| WBKC |
Wolverine Bancorp, Inc. | NASDAQ | MW | Midland | MI | 369 | 3 | Dec | 1/20/11 | 27.97 | 59 | |||||||||||||||||||||||||||||||
Source: SNL Financial, LC.
| RP® Financial, LC. | PEER GROUP ANALYSIS |
III.4
levels of commercial real estate and commercial business loans as a percent of assets, and comparable reserve coverage ratios.
| • | Melrose Bancorp, Inc. of Massachusetts. Comparable due to elevated equity/asset ratio, comparable level of cash and investments, relatively similar earning asset/funding liabilities composition, similar return on assets and cost of interest-bearing liabilities, level of 1-4 family residential loans as a percent of assets, limited diversification into construction/land loans. |
| • | MSB Financial Corp. of New Jersey. Comparable due to elevated equity/asset ratio, similar earning asset/costing liability structure, costs of interest bearing liabilities, similar lending focus on 1-4 family residential loans and diversification into commercial real estate loans, comparable level of NPAs+90 day delinquencies and NPAs as a percent of loans. |
| • | Poage Bankshares, Inc. of Kentucky. Comparable due to elevated equity/asset ratio, similar earning asset/costing liability structure, similar level of interest income, non-interest income and operating expenses as a percent of average assets, similar yield cost spread, similar level of loan portfolio diversification as a percent of assets. |
| • | Prudential Bancorp, Inc. of Pennsylvania. Comparable due to elevated equity/asset ratio, level of net income and interest expense as a percent of average assets, similar level of cost of funds, lending diversification on commercial real estate and low risk-weighted assets/assets ratio. |
| • | United Community Bancorp of Indiana. Comparable due to elevated equity/asset ratio, similar composition of balance sheet liability base, limited asset growth in past 12 months, similar investment in 1-4 family residential assets in the form of MBS and whole loans, similar loan diversification into non-residential lending, relatively more favorable asset quality. |
| • | Wolverine Bancorp, Inc. of Michigan. Comparable due to elevated equity/asset ratio, similar loans/assets ratio, similar level of interest income and yield on interest earning assets, comparable levels of construction loans and commercial business loans, and relatively more favorable asset quality. |
In aggregate, the Peer Group companies maintained a higher level of equity as the industry average (15.88% of assets versus 12.51% for all public companies), but recorded a lower level of profitability as a percent of average assets (0.57% ROAA versus 0.63% for all public companies), as well as a less favorable ROE (3.59% ROE versus 5.40% for all public companies). The Peer Group’s average P/TB ratio was lower than the industry average, while the average P/CE multiple was above the respective average for all publicly-traded thrifts.
| RP® Financial, LC. | PEER GROUP ANALYSIS |
III.5
| All Fully-Conv. Publicly-Traded |
Peer Group | |||||||
| Financial Characteristics (Averages) |
||||||||
| Assets ($Mil) |
$ | 1,882 | $ | 419 | ||||
| Market capitalization ($Mil) |
$ | 318 | $ | 67 | ||||
| Equity/assets (%) |
12.51 | % | 15.88 | % | ||||
| Return on average assets (%) |
0.63 | % | 0.57 | % | ||||
| Return on average equity (%) |
5.40 | % | 3.59 | % | ||||
| Pricing Ratios (Averages)(1) |
||||||||
| Price/core earnings (x) |
18.23 | x | 21.94 | x | ||||
| Price/tangible book (%) |
119.15 | % | 100.73 | % | ||||
| Price/assets (%) |
13.58 | % | 15.84 | % | ||||
| (1) | Based on market prices as of November 25, 2016. |
Ideally, the Peer Group companies would be comparable to Newton Federal in terms of all of the selection criteria, but the universe of publicly-traded thrifts does not provide for an appropriate number of such companies. However, in general, the companies selected for the Peer Group were fairly comparable to Newton Federal, as will be highlighted in the following comparative analysis.
Financial Condition
Table 3.2 shows comparative balance sheet measures for Newton Federal and the Peer Group, reflecting the expected similarities and some differences given the selection procedures outlined above. The Bank’s and Peer Group ratios reflect balances as of September 30, 2016. Newton Federal’s equity-to-assets ratio of 19.36% was higher than the Peer Group’s average equity ratio of 15.88%. The Bank’s pro forma capital position will increase with the addition of stock proceeds, providing the Bank with an increased advantage in for this metric in comparison to the Peer Group. Tangible equity-to-assets ratios for the Bank and the Peer Group equaled 19.36% and 15.70%, respectively. The increase in Newton Federal’s pro forma capital position will be favorable from a risk perspective and in terms of future earnings potential that could be realized through leverage and lower funding costs. At the same time, the Bank’s higher pro forma capitalization will depress return on equity. Both Newton Federal’s and the Peer Group’s capital ratios reflected capital surpluses with respect to the regulatory capital requirements, with the Bank’s ratios currently higher than the Peer Group’s ratios. On a pro forma basis, the Bank’s regulatory surpluses will become more significant.
| RP® Financial, LC. | PEER GROUP ANALYSIS |
III.6
Table 3.2
Balance Sheet Composition and Growth Rates
Comparable Institution Analysis
As of September 30, 2016 or the Most Recent Date Available
| Balance Sheet as a Percent of Assets | Balance Sheet Annual Growth Rates | Regulatory Capital | ||||||||||||||||||||||||||||||||||||||||||||||||||||||||||||||||||||||||||||||||||||
| Cash & | MBS & | Net | Borrowed | Sub. | Total | Goodwill | Tangible | MBS, Cash & | Borrows. | Total | Tangible | Tier 1 | Tier 1 | Risk-Based | ||||||||||||||||||||||||||||||||||||||||||||||||||||||||||||||||||||||||
| Equivalents | Invest | BOLI | Loans (1) | Deposits | Funds | Debt | Equity | & Intang | Equity | Assets | Investments | Loans | Deposits | &Subdebt | Equity | Equity | Leverage | Risk-Based | Capital | |||||||||||||||||||||||||||||||||||||||||||||||||||||||||||||||||||
| Newton Federal Bank |
||||||||||||||||||||||||||||||||||||||||||||||||||||||||||||||||||||||||||||||||||||||
| September 30, 2016 |
11.03 | % | 3.31 | % | 0.00 | % | 81.63 | % | 78.04 | % | 0.00 | % | 0.00 | % | 19.36 | % | 0.00 | % | 19.36 | % | 2.87 | % | -27.69 | % | 11.93 | % | 2.84 | % | 0.00 | % | 2.63 | % | 2.63 | % | 19.32 | % | 30.86 | % | 32.13 | % | ||||||||||||||||||||||||||||||||||||||||||||||
| All Thrifts |
||||||||||||||||||||||||||||||||||||||||||||||||||||||||||||||||||||||||||||||||||||||
| Averages |
7.18 | % | 14.77 | % | 1.59 | % | 72.36 | % | 75.70 | % | 10.29 | % | 0.44 | % | 12.50 | % | 0.46 | % | 12.26 | % | 12.67 | % | 9.53 | % | 14.59 | % | 13.78 | % | 9.00 | % | 10.70 | % | 8.51 | % | 12.08 | % | 18.54 | % | 19.67 | % | ||||||||||||||||||||||||||||||||||||||||||||||
| Medians |
5.28 | % | 12.31 | % | 1.63 | % | 74.94 | % | 76.84 | % | 9.04 | % | 0.00 | % | 11.42 | % | 0.00 | % | 11.12 | % | 8.34 | % | 3.59 | % | 10.46 | % | 9.16 | % | 0.00 | % | 3.98 | % | 3.31 | % | 10.91 | % | 15.60 | % | 16.85 | % | ||||||||||||||||||||||||||||||||||||||||||||||
| State of GA |
||||||||||||||||||||||||||||||||||||||||||||||||||||||||||||||||||||||||||||||||||||||
| CHFN |
Charter Financial Corporation | GA | 7.37 | % | 14.55 | % | 3.41 | % | 69.09 | % | 80.52 | % | 3.46 | % | 0.46 | % | 14.08 | % | 2.25 | % | 11.83 | % | 40.50 | % | 44.93 | % | 39.21 | % | 57.25 | % | -8.73 | % | -0.87 | % | -14.83 | % | 11.51 | % | 14.34 | % | 15.26 | % | ||||||||||||||||||||||||||||||||||||||||||||
| Comparable Group |
||||||||||||||||||||||||||||||||||||||||||||||||||||||||||||||||||||||||||||||||||||||
| Averages |
5.80 | % | 16.22 | % | 2.05 | % | 73.05 | % | 76.78 | % | 6.29 | % | 0.06 | % | 15.88 | % | 0.19 | % | 15.70 | % | 10.11 | % | -1.03 | % | 13.84 | % | 10.83 | % | 147.65 | % | -0.35 | % | -0.27 | % | 14.28 | % | 20.76 | % | 21.91 | % | ||||||||||||||||||||||||||||||||||||||||||||||
| Medians |
5.06 | % | 12.96 | % | 2.09 | % | 75.87 | % | 78.67 | % | 4.04 | % | 0.00 | % | 15.73 | % | 0.00 | % | 15.46 | % | 7.82 | % | -13.63 | % | 10.77 | % | 7.90 | % | 0.00 | % | -0.11 | % | -0.04 | % | 13.71 | % | 19.80 | % | 20.82 | % | ||||||||||||||||||||||||||||||||||||||||||||||
| Comparable Group |
||||||||||||||||||||||||||||||||||||||||||||||||||||||||||||||||||||||||||||||||||||||
| ANCB |
Anchor Bancorp | WA | 2.83 | % | 7.23 | % | 4.51 | % | 80.82 | % | 69.78 | % | 14.11 | % | 0.00 | % | 14.63 | % | 0.00 | % | 14.63 | % | 14.45 | % | -21.43 | % | 23.59 | % | 1.04 | % | 515.00 | % | 0.77 | % | 0.77 | % | 14.20 | % | 15.30 | % | 16.20 | % | ||||||||||||||||||||||||||||||||||||||||||||
| EQFN |
Equitable Financial Corp. | NE | 3.92 | % | 0.70 | % | 0.00 | % | 90.74 | % | 83.23 | % | 0.00 | % | 0.00 | % | 15.92 | % | 0.00 | % | 15.92 | % | 7.67 | % | -30.32 | % | 11.21 | % | 8.53 | % | 0.00 | % | 3.29 | % | 3.29 | % | 11.83 | % | 13.00 | % | 14.25 | % | ||||||||||||||||||||||||||||||||||||||||||||
| IROQ |
IF Bancorp, Inc. | IL | 2.01 | % | 20.17 | % | 1.46 | % | 74.73 | % | 71.96 | % | 12.74 | % | 0.00 | % | 14.23 | % | 0.00 | % | 14.23 | % | 5.50 | % | -13.63 | % | 12.99 | % | 3.82 | % | 19.46 | % | 3.27 | % | 3.27 | % | 13.80 | % | 18.80 | % | 20.10 | % | ||||||||||||||||||||||||||||||||||||||||||||
| JXSB |
Jacksonville Bancorp, Inc. | IL | 9.47 | % | 28.31 | % | 2.19 | % | 56.14 | % | 81.25 | % | 2.04 | % | 0.00 | % | 14.60 | % | 0.82 | % | 13.77 | % | 7.97 | % | 31.18 | % | -2.45 | % | 15.16 | % | -65.61 | % | 3.35 | % | 3.56 | % | 13.16 | % | 18.96 | % | 20.21 | % | ||||||||||||||||||||||||||||||||||||||||||||
| MELR |
Melrose Bancorp, Inc. | MA | 7.91 | % | 12.31 | % | 2.00 | % | 77.06 | % | 81.69 | % | 1.87 | % | 0.00 | % | 16.23 | % | 0.00 | % | 16.23 | % | 19.29 | % | -17.97 | % | 36.29 | % | 23.06 | % | NA | -5.74 | % | -5.74 | % | 13.61 | % | 21.04 | % | 22.14 | % | |||||||||||||||||||||||||||||||||||||||||||||
| MSBF |
MSB Financial Corp. | NJ | 7.30 | % | 10.63 | % | 3.15 | % | 75.92 | % | 77.18 | % | 5.23 | % | 0.00 | % | 16.74 | % | 0.00 | % | 16.74 | % | 16.94 | % | -20.85 | % | 30.52 | % | 29.67 | % | -30.60 | % | -4.95 | % | -4.95 | % | 13.52 | % | 17.68 | % | 18.93 | % | ||||||||||||||||||||||||||||||||||||||||||||
| PBSK |
Poage Bankshares, Inc. | KY | 4.79 | % | 13.61 | % | 1.58 | % | 75.81 | % | 80.15 | % | 2.85 | % | 0.63 | % | 15.54 | % | 0.53 | % | 15.01 | % | 5.54 | % | -3.87 | % | 9.51 | % | 7.28 | % | 3.00 | % | -1.53 | % | -1.08 | % | 13.85 | % | 20.64 | % | 21.43 | % | ||||||||||||||||||||||||||||||||||||||||||||
| PBIP |
Prudential Bancorp, Inc. | PA | 2.55 | % | 31.93 | % | 2.33 | % | 61.66 | % | 69.56 | % | 9.05 | % | 0.00 | % | 20.38 | % | 0.00 | % | 20.38 | % | 14.84 | % | NA | 10.34 | % | 6.61 | % | 895.28 | % | -2.56 | % | -2.56 | % | 20.41 | % | 38.57 | % | 39.70 | % | |||||||||||||||||||||||||||||||||||||||||||||
| UCBA |
United Community Bancorp | IN | 5.34 | % | 36.45 | % | 3.29 | % | 52.04 | % | 83.70 | % | 2.27 | % | 0.00 | % | 13.38 | % | 0.53 | % | 12.85 | % | 1.57 | % | -0.57 | % | 3.96 | % | 2.50 | % | -7.69 | % | -0.98 | % | -0.85 | % | 11.42 | % | 21.11 | % | 22.36 | % | ||||||||||||||||||||||||||||||||||||||||||||
| WBKC |
Wolverine Bancorp, Inc. | MI | 11.88 | % | 0.87 | % | 0.00 | % | 85.56 | % | 69.25 | % | 12.73 | % | 0.00 | % | 17.20 | % | 0.00 | % | 17.20 | % | 7.33 | % | 68.18 | % | 2.44 | % | 10.63 | % | 0.00 | % | 1.54 | % | 1.54 | % | 17.02 | % | 22.50 | % | 23.78 | % | ||||||||||||||||||||||||||||||||||||||||||||
| (1) | Includes loans held for sale. |
Source: SNL Financial, LC. and RP® Financial, LC. calculations. The information provided in this table has been obtained from sources we believe are reliable, but we cannot guarantee the accuracy or completeness of such information.
Copyright (c) 2016 by RP® Financial, LC.
| RP® Financial, LC. | PEER GROUP ANALYSIS |
III.7
The interest-earning asset compositions for the Bank and the Peer Group were similar, with loans constituting the bulk of interest-earning assets for both. The Bank’s loans-to-assets ratio of 81.63% was higher than the comparable Peer Group ratio of 73.05%. Comparatively, the Bank’s cash-to-assets ratio of 11.03% was also higher than the ratio for the Peer Group of 5.80%. Newton Federal reported a smaller level of investment securities (3.31%) and no investments in BOLI at all, compared to a combined ratio of 18.27% for the Peer Group. Overall, Newton Federal’s earning assets amounted to 95.97% of assets, which was slightly lower than the comparable Peer Group ratio of 97.12%.
Newton Federal’s funding liabilities reflected a funding strategy that relied on a similar level of deposits as the Peer Group’s funding composition. The Bank’s deposits equaled 78.04% of assets, which was slightly above the Peer Group’s ratio of 76.78%. Comparatively, the Bank maintained a zero level of borrowings, while the Peer Group reported a borrowings-to-assets ratio of 6.35%.
Total interest-bearing liabilities maintained by the Bank and the Peer Group, as a percent of assets, equaled 78.04% and 83.13%, respectively. Following the increase in equity provided by the net proceeds of the stock offering, the Bank’s ratio of interest-bearing liabilities as a percent of assets will further decline in comparison to the Peer Group’s ratio. A key measure of balance sheet strength for a thrift institution is its IEA/IBL ratio. Presently, the Bank’s IEA/IBL ratio is lower than the Peer Group’s ratio, based on IEA/IBL ratios of 122.98% and 116.83%, respectively. The additional equity realized from stock proceeds will serve to strengthen Newton Federal’s IEA/IBL ratio in comparison to the Peer Group ratio, as the increase in capital provided by the infusion of stock proceeds will lower the level of interest-bearing liabilities funding assets and will be primarily deployed into interest-earning assets.
The growth rate section of Table 3.2 shows annual growth rates for key balance sheet items, with growth rates for both Newton Federal and the Peer Group based on annual growth rates for the 12 months ended September 30, 2016. Newton Federal recorded asset growth of 2.87%, lower than the Peer Group’s asset growth of 10.11%. The Bank’s cash and investments declined by 27.69% over the past year, with the funds reinvested into loans, which increased at a rate of 11.93%. The asset growth for the Peer Group was also evident in the higher loan growth, with a corresponding decrease in cash/investments. Funding of Newton Federal’s growth was obtained from a deposit increase of 2.84%, with no change in borrowings. The Peer Group recorded an increase in deposits and also increased borrowings as a funding base, although the percent increase in borrowings reflected the low initial balance.
| RP® Financial, LC. | PEER GROUP ANALYSIS |
III.8
Reflecting the recent levels of net income, the Bank’s equity increased at a 2.63% annual rate, versus a reduction in equity of 0.87% for the Peer Group. The increase in equity realized from stock proceeds will likely depress the Bank’s equity growth rate initially following the stock offering. Dividend payments and stock repurchases, pursuant to regulatory limitations and guidelines could also potentially slow the Bank’s equity growth rate in the longer term following the stock offering.
Income and Expense Components
Table 3.3 displays statements of operations for the Bank and the Peer Group, with the income ratios based on earnings for the 12 months ended September 30, 2016 for the Bank and the Peer Group.
Newton Federal reported net income of 0.51% of average assets for the 12 months ended September 30, 2016, similar to average net income of 0.57% of average assets for the Peer Group. A higher level of net operating expenses and lower non-interest income accounted for the Bank’s slightly less favorable reported results, despite of the Bank’s higher level of net interest income.
The Bank’s net interest income ratio was higher than the Peer Group’s ratio, due to a much higher level of interest income despite a slightly higher level of interest expense. The Bank’s interest income is supported by the higher ratio of loans in the asset base than the Peer Group, along with the traditional lending practice which provides for higher interest rates on residential loans that do not generally meet secondary market standards and thus carry higher interest rates. Newton Federal’s overall yield earned on interest-earning assets (5.02%) was higher than the 3.97% ratio for the Peer Group. The Bank’s cost of funds was somewhat higher than the Peer Group (0.87% versus 0.79% for the Peer Group), reflecting the deposit base that contains a level of higher costing certificates of deposit. Overall, Newton Federal reported a significantly higher net interest income to average assets ratio than the Peer Group, at 4.33% and 3.11%, respectively.
In another key area of core earnings strength, the Bank reported a higher ratio of operating expenses, 3.94% of average assets versus the Peer Group (2.86% of average assets). In connection with the operating expense ratios, Newton Federal maintained a comparatively higher number of employees relative to its asset size. Assets per full time equivalent employee equaled $3.5 million for the Bank versus a comparable measure of $5.8 million for the Peer Group.
| RP® Financial, LC. | PEER GROUP ANALYSIS |
III.9
Table 3.3
Income as Percent of Average Assets and Yields, Costs, Spreads
Comparable Institution Analysis
For the 12 Months Ended September 30, 2016 or the Most Recent 12 Months Available
| Net Interest Income | Non- Interest Income |
Non-Op. Items | Yields, Costs, and Spreads |
|||||||||||||||||||||||||||||||||||||||||||||||||||||||||||||||||||||||
| Loss | NII | Gain | Other | Total | Provision | MEMO: | MEMO: | |||||||||||||||||||||||||||||||||||||||||||||||||||||||||||||||||||
| Net | Provis. | After | on Sale of | Non-Int | Non-Int | Net Gains/ | Extrao. | for | Yield | Cost | Yld-Cost | Assets/ | Effective | |||||||||||||||||||||||||||||||||||||||||||||||||||||||||||||
| Income | Income | Expense | NII | on IEA | Provis. | Loans | Income | Expense | Losses (1) | Items | Taxes | On IEA | Of IBL | Spread | FTE Emp. | Tax Rate | ||||||||||||||||||||||||||||||||||||||||||||||||||||||||||
| (%) | ||||||||||||||||||||||||||||||||||||||||||||||||||||||||||||||||||||||||||
| Newton Federal Bank |
||||||||||||||||||||||||||||||||||||||||||||||||||||||||||||||||||||||||||
| September 30, 2016 |
0.51 | % | 4.96 | % | -0.62 | % | 4.33 | % | 0.00 | % | 4.33 | % | 0.00 | % | 0.53 | % | -3.94 | % | -0.11 | % | 0.00 | % | 0.31 | % | 5.02 | % | 0.87 | % | 4.15 | % | $ | 3,537 | 38.00 | % | ||||||||||||||||||||||||||||||||||||||||
| All Public Thrifts |
||||||||||||||||||||||||||||||||||||||||||||||||||||||||||||||||||||||||||
| Averages |
0.62 | % | 3.66 | % | 0.60 | % | 3.07 | % | 0.07 | % | 0.30 | % | 0.33 | % | 0.46 | % | 2.91 | % | -0.01 | % | 0.00 | % | 0.22 | % | 3.89 | % | 0.77 | % | 3.10 | % | $ | 6,075 | 24.55 | % | ||||||||||||||||||||||||||||||||||||||||
| Medians |
0.59 | % | 3.59 | % | 0.57 | % | 3.03 | % | 0.06 | % | 0.00 | % | 0.05 | % | 0.38 | % | 2.84 | % | 0.00 | % | 0.00 | % | 0.24 | % | 3.81 | % | 0.73 | % | 3.05 | % | $ | 5,273 | 32.93 | % | ||||||||||||||||||||||||||||||||||||||||
| State of GA |
||||||||||||||||||||||||||||||||||||||||||||||||||||||||||||||||||||||||||
| CHFN |
Charter Financial Corporation | GA | 0.98 | % | 3.96 | % | 0.47 | % | 3.49 | % | -0.02 | % | 0.00 | % | 0.18 | % | 1.24 | % | 3.33 | % | -0.10 | % | 0.00 | % | 0.51 | % | 4.40 | % | 0.67 | % | 3.73 | % | $ | 4,474 | 33.98 | % | ||||||||||||||||||||||||||||||||||||||
| Comparable Group |
||||||||||||||||||||||||||||||||||||||||||||||||||||||||||||||||||||||||||
| Averages |
0.57 | % | 3.70 | % | 0.58 | % | 3.11 | % | 0.08 | % | 0.36 | % | 0.09 | % | 0.60 | % | 2.86 | % | 0.04 | % | 0.00 | % | 0.26 | % | 3.97 | % | 0.79 | % | 3.18 | % | $ | 5,824 | 30.15 | % | ||||||||||||||||||||||||||||||||||||||||
| Medians |
0.48 | % | 3.67 | % | 0.57 | % | 3.14 | % | 0.11 | % | 0.00 | % | 0.08 | % | 0.67 | % | 2.66 | % | 0.01 | % | 0.00 | % | 0.24 | % | 3.83 | % | 0.77 | % | 3.12 | % | $ | 5,394 | 33.93 | % | ||||||||||||||||||||||||||||||||||||||||
| Comparable Group |
||||||||||||||||||||||||||||||||||||||||||||||||||||||||||||||||||||||||||
| ANCB |
Anchor Bancorp | WA | 0.17 | % | 4.37 | % | 0.70 | % | 3.68 | % | 0.10 | % | 3.58 | % | 0.05 | % | 0.99 | % | 4.41 | % | 0.00 | % | 0.00 | % | 0.04 | % | 5.01 | % | 1.00 | % | 4.01 | % | $ | 3,824 | 17.75 | % | ||||||||||||||||||||||||||||||||||||||
| EQFN |
Equitable Financial Corp. | NE | 0.46 | % | 3.73 | % | 0.47 | % | 3.26 | % | 0.16 | % | 0.00 | % | 0.34 | % | 0.76 | % | 3.47 | % | -0.02 | % | 0.00 | % | 0.26 | % | 3.95 | % | 0.68 | % | 3.27 | % | $ | 3,209 | 35.69 | % | ||||||||||||||||||||||||||||||||||||||
| IROQ |
IF Bancorp, Inc. | IL | 0.70 | % | 3.61 | % | 0.60 | % | 3.02 | % | 0.17 | % | 0.00 | % | 0.05 | % | 0.57 | % | 2.46 | % | 0.10 | % | 0.00 | % | 0.41 | % | 3.71 | % | 0.75 | % | 2.96 | % | $ | 6,197 | 36.60 | % | ||||||||||||||||||||||||||||||||||||||
| JXSB |
Jacksonville Bancorp, Inc. | IL | 0.99 | % | 3.76 | % | 0.33 | % | 3.42 | % | 0.04 | % | 0.00 | % | 0.07 | % | 1.20 | % | 3.43 | % | 0.11 | % | 0.00 | % | 0.35 | % | 4.02 | % | 0.45 | % | 3.57 | % | $ | 3,518 | 25.99 | % | ||||||||||||||||||||||||||||||||||||||
| MELR |
Melrose Bancorp, Inc. | MA | 0.42 | % | 2.91 | % | 0.64 | % | 2.27 | % | 0.12 | % | 0.00 | % | 0.00 | % | 0.10 | % | 1.81 | % | 0.20 | % | 0.00 | % | 0.22 | % | 3.18 | % | 0.85 | % | 2.33 | % | $ | 9,525 | 34.82 | % | ||||||||||||||||||||||||||||||||||||||
| MSBF |
MSB Financial Corp. | NJ | 0.18 | % | 3.47 | % | 0.55 | % | 2.92 | % | 0.15 | % | 0.00 | % | 0.00 | % | 0.26 | % | 2.62 | % | -0.13 | % | 0.00 | % | 0.09 | % | 3.68 | % | 0.79 | % | 2.89 | % | $ | 6,883 | 33.04 | % | ||||||||||||||||||||||||||||||||||||||
| PBSK |
Poage Bankshares, Inc. | KY | 0.43 | % | 4.45 | % | 0.53 | % | 3.92 | % | 0.19 | % | 0.00 | % | 0.13 | % | 0.40 | % | 3.57 | % | -0.02 | % | 0.00 | % | 0.24 | % | 4.75 | % | 0.70 | % | 4.05 | % | $ | 4,081 | 35.44 | % | ||||||||||||||||||||||||||||||||||||||
| PBIP |
Prudential Bancorp, Inc. | PA | 0.51 | % | 3.27 | % | 0.62 | % | 2.64 | % | 0.04 | % | 0.00 | % | 0.09 | % | 0.80 | % | 2.05 | % | 0.02 | % | 0.00 | % | 0.24 | % | 3.49 | % | 0.83 | % | 2.66 | % | $ | 9,024 | 31.64 | % | ||||||||||||||||||||||||||||||||||||||
| UCBA |
United Community Bancorp | IN | 0.68 | % | 3.02 | % | 0.43 | % | 2.59 | % | 0.03 | % | 0.00 | % | 0.09 | % | 0.76 | % | 2.70 | % | 0.09 | % | 0.00 | % | 0.13 | % | 3.25 | % | 0.56 | % | 2.69 | % | $ | 4,592 | 15.62 | % | ||||||||||||||||||||||||||||||||||||||
| WBKC |
Wolverine Bancorp, Inc. | MI | 1.13 | % | 4.38 | % | 0.98 | % | 3.40 | % | -0.16 | % | 0.00 | % | 0.13 | % | 0.15 | % | 2.11 | % | 0.00 | % | 0.00 | % | 0.60 | % | 4.65 | % | 1.28 | % | 3.37 | % | $ | 7,383 | 34.87 | % | ||||||||||||||||||||||||||||||||||||||
| (1) | Net gains/losses includes gain/loss on sale of securities and nonrecurring income and expense. |
| (2) | For the twelve months ended March 31, 2015 or the most recent date available. |
Source: SNL Financial, LC. and RP® Financial, LC. calculations. The information provided in this table has been obtained from sources we believe are reliable, but we cannot guarantee the accuracy or completeness of such information.
Copyright (c) 2016 by RP® Financial, LC.
| RP® Financial, LC. | PEER GROUP ANALYSIS |
III.10
On a post-offering basis, the Bank’s operating expenses can be expected to further increase with the addition of the ESOP and certain expenses that result from being a publicly-traded savings institution, with such expenses already impacting the Peer Group’s operating expenses. At the same time, Newton Federal’s capacity to leverage operating expenses will be enhanced following the increase in capital realized from the infusion of net stock proceeds.
When viewed together, net interest income and operating expenses provide considerable insight into a bank’s earnings strength, since those sources of income and expenses are typically the most prominent components of earnings and are generally more predictable than losses and gains realized from the sale of assets or other non-recurring activities. In this regard, as measured by their expense coverage ratios (net interest income divided by operating expenses), the Bank’s earnings were similar to the Peer Group’s, based on respective expense coverage ratios of 1.10x for Newton Federal and 1.09x for the Peer Group. A ratio less than 1.00x indicates that an institution depends on non-interest operating income to achieve profitable operations.
Sources of non-interest operating income provided a somewhat lower contribution to Newton Federal’s earnings compared to the Peer Group. Non-interest operating income equaled 0.53% and 0.60% of Newton Federal’s and the Peer Group’s average assets, respectively. Taking non-interest operating income into account in comparing the Bank’s and the Peer Group’s earnings, Newton Federal’s efficiency ratio (operating expenses, net of amortization of intangibles, as a percent of the sum of non-interest operating income and net interest income) of 81.1% was less favorable than the Peer Group’s efficiency ratio of 77.1%.
Loan loss provisions had a modest, but larger impact on the Peer Group’s earnings, with loan loss provisions established by the Bank and the Peer Group equaling 0.00% and 0.08% of average assets, respectively. The impact of loan loss provisions on the Bank’s and the Peer Group’s earnings, particularly when taking into consideration the prevailing credit market environment for mortgage based lenders, were indicative of the asset quality position of the Bank and Peer Group.
For the 12 months ended September 30, 2016, the Bank reported net non-operating losses equal to 0.11% of average assets, while the Peer Group reported, on average, 0.04% of average assets of net non-operating gains. Non-operating items for the Bank consisted of one-time payments for the termination of a senior manager. Typically, gains and losses generated from non-operating items are viewed as non-recurring in nature, particularly to the extent that such gains and losses result from the sale of investments or other assets that are not considered to be part of an institution’s core operations. Extraordinary items were not a factor in either the Bank’s or the Peer Group’s earnings.
| RP® Financial, LC. | PEER GROUP ANALYSIS |
III.11
On average, the Peer Group reported an average effective tax rate of 30.15%, while Newton Federal reported an effective tax rate of 37.60%. As indicated in the prospectus, the Bank’s effective marginal tax rate is assumed to equal 38.0% when calculating the after tax return on conversion proceeds.
Loan Composition
Table 3.4 presents data related to the Bank’s and the Peer Group’s loan portfolio compositions (including any investment in MBS). The Bank’s loan portfolio composition reflected a higher concentration of investment in 1-4 family property secured assets (permanent mortgage loans and MBS) than maintained by the Peer Group (57.45% of assets versus 41.10% for the Peer Group). The Bank reported no investments in MBS, while the Peer Group reported an MBS investment at 7.3% of assets on average. Newton Federal did not have a portfolio of loans serviced for others, while six members of the Peer Group reported a loan servicing portfolio and related capitalized servicing right.
Diversification into higher risk and higher yielding types of lending was greater for the Peer Group, as the Bank reported total loans other than 1-4 family and MBS of 26.21% of assets, versus 40.78% for the Peer Group. Commercial real estate/multi-family loans represented the most significant area of lending diversification for the Bank (12.47% of assets), followed by commercial business loans (6.97% of assets). The Peer Group’s lending diversification consisted primarily also of commercial real estate/multi-family loans (22.16% of assets), followed by commercial business loans (6.48% of assets). The relative concentration of assets in loans and diversification into higher risk types of loans by the Peer Group translated into a lower risk weighted assets-to-assets ratio for the Bank (62.35%) than the Peer Group (71.04%).
Credit Risk
Based on a comparison of credit quality measures, the Bank’s credit risk exposure was considered to be somewhat unfavorable to that of the Peer Group. As shown in Table 3.5, the Bank’s non-performing assets/assets (excluding performing troubled debt restructured loans)
| RP® Financial, LC. | PEER GROUP ANALYSIS |
III.12
Table 3.4
Loan Portfolio Composition and Related Information
Comparable Institution Analysis
As of September 30, 2016 or the Most Recent Date Available
| Portfolio Composition as a Percent of Assets | ||||||||||||||||||||||||||||||||||||||||||||
| MBS | 1-4 Family |
Constr. & Land |
Multi- Family |
Comm RE |
Commerc. Business |
Consumer | RWA/ Assets |
Serviced For Others |
Servicing Assets |
|||||||||||||||||||||||||||||||||||
| (%) | (%) | (%) | (%) | (%) | (%) | (%) | (%) | ($000) | ($000) | |||||||||||||||||||||||||||||||||||
| Newton Federal Bank |
||||||||||||||||||||||||||||||||||||||||||||
| September 30, 2016 |
0.00 | % | 57.45 | % | 5.73 | % | 0.05 | % | 12.47 | % | 6.97 | % | 0.99 | % | 62.35 | % | $ | 0 | $ | 0 | ||||||||||||||||||||||||
| All Public Thrifts |
||||||||||||||||||||||||||||||||||||||||||||
| Averages |
8.18 | % | 37.85 | % | 4.10 | % | 7.38 | % | 16.80 | % | 0.67 | % | 1.72 | % | 67.10 | % | $ | 909,667 | $ | 5,583 | ||||||||||||||||||||||||
| Medians |
5.80 | % | 38.18 | % | 2.67 | % | 2.79 | % | 15.82 | % | 0.00 | % | 0.51 | % | 65.91 | % | $ | 17,083 | $ | 148 | ||||||||||||||||||||||||
| State of |
GA |
|||||||||||||||||||||||||||||||||||||||||||
| CHFN |
Charter Financial Corporation |
GA |
11.37 | % | 18.74 | % | 10.12 | % | 1.89 | % | 32.67 | % | 0.00 | % | 1.47 | % | 77.55 | % | $ | 0 | $ | 820 | ||||||||||||||||||||||
| Comparable Group |
||||||||||||||||||||||||||||||||||||||||||||
| Averages |
7.30 | % | 33.80 | % | 4.47 | % | 6.24 | % | 22.16 | % | 6.48 | % | 1.43 | % | 71.04 | % | $ | 47,761 | $ | 317 | ||||||||||||||||||||||||
| Medians |
5.90 | % | 32.83 | % | 3.71 | % | 3.34 | % | 18.67 | % | 6.87 | % | 1.12 | % | 69.44 | % | $ | 42,482 | $ | 281 | ||||||||||||||||||||||||
| Comparable Group |
||||||||||||||||||||||||||||||||||||||||||||
| ANCB |
Anchor Bancorp |
WA |
6.51 | % | 17.87 | % | 8.80 | % | 12.51 | % | 35.03 | % | 8.42 | % | 1.21 | % | 90.76 | % | $ | 79,237 | $ | 216 | ||||||||||||||||||||||
| EQFN |
Equitable Financial Corp. |
NE |
0.34 | % | 22.51 | % | 8.13 | % | 2.93 | % | 39.32 | % | 17.60 | % | 1.58 | % | 90.75 | % | $ | 103,050 | $ | 748 | ||||||||||||||||||||||
| IROQ |
IF Bancorp, Inc. |
IL |
4.84 | % | 26.20 | % | 3.79 | % | 13.98 | % | 21.02 | % | 8.88 | % | 1.56 | % | 73.94 | % | $ | 81,378 | $ | 518 | ||||||||||||||||||||||
| JXSB |
Jacksonville Bancorp, Inc. |
IL |
9.59 | % | 16.99 | % | 2.79 | % | 1.82 | % | 19.90 | % | 10.99 | % | 4.21 | % | 66.19 | % | $ | 128,982 | $ | 585 | ||||||||||||||||||||||
| MELR |
Melrose Bancorp, Inc. |
MA |
0.00 | % | 64.83 | % | 4.59 | % | 3.07 | % | 4.86 | % | 0.00 | % | 0.05 | % | 58.80 | % | $ | 0 | $ | 0 | ||||||||||||||||||||||
| MSBF |
MSB Financial Corp. |
NJ |
5.80 | % | 44.26 | % | 2.04 | % | 6.07 | % | 17.44 | % | 3.56 | % | 0.11 | % | 72.00 | % | $ | 0 | $ | 0 | ||||||||||||||||||||||
| PBSK |
Poage Bankshares, Inc. |
KY |
6.01 | % | 43.22 | % | 3.64 | % | 1.26 | % | 14.59 | % | 8.19 | % | 4.12 | % | 66.89 | % | $ | 0 | $ | 345 | ||||||||||||||||||||||
| PBIP |
Prudential Bancorp, Inc. |
PA |
17.52 | % | 42.09 | % | 2.94 | % | 2.23 | % | 14.22 | % | 0.02 | % | 0.14 | % | 52.30 | % | $ | 0 | $ | 0 | ||||||||||||||||||||||
| UCBA |
United Community Bancorp |
IN |
22.36 | % | 39.46 | % | 1.80 | % | 3.60 | % | 14.68 | % | 1.55 | % | 1.04 | % | 62.51 | % | $ | 72,752 | $ | 694 | ||||||||||||||||||||||
| WBKC |
Wolverine Bancorp, Inc. |
MI |
0.00 | % | 20.59 | % | 6.20 | % | 14.93 | % | 40.53 | % | 5.56 | % | 0.26 | % | 76.28 | % | $ | 12,211 | $ | 60 | ||||||||||||||||||||||
| Source: | SNL Financial LC. and RP® Financial, LC. calculations. The information provided in this table has been obtained from sources we believe are reilable, but we cannot guarantee the accuracy or completeness of such information. |
Copyright (c) 2016 by RP® Financial, LC.
| RP® Financial, LC. | PEER GROUP ANALYSIS |
III.13
Table 3.5
Credit Risk Measures and Related Information
Comparable Institution Analysis
As of September 30, 2016 or the Most Recent Date Available
| NPAs & | Adj NPAs & | Rsrves/ | ||||||||||||||||||||||||||||||||||||||
| REO/ | 90+Del/ | 90+Del/ | NPLs/ | Rsrves/ | Rsrves/ | NPAs & | Net Loan | NLCs/ | ||||||||||||||||||||||||||||||||
| Assets | Assets (1) | Assets (2) | Loans (3) | Loans HFI | NPLs (3) | 90+Del (1) | Chargeoffs (4) | Loans | ||||||||||||||||||||||||||||||||
| (%) | (%) | (%) | (%) | (%) | (%) | (%) | ($000) | (%) | ||||||||||||||||||||||||||||||||
| Newton Federal Bank |
||||||||||||||||||||||||||||||||||||||||
| September 30, 2016 |
0.00 | % | 3.77 | % | 1.39 | % | 4.62 | % | 2.27 | % | 49.11 | % | 49.11 | % | $ | 1,565 | 0.82 | % | ||||||||||||||||||||||
| All Public Thrifts |
||||||||||||||||||||||||||||||||||||||||
| Averages |
0.15 | % | 1.33 | % | 0.86 | % | 1.57 | % | 1.09 | % | 120.47 | % | 102.06 | % | $ | 997 | 0.07 | % | ||||||||||||||||||||||
| Medians |
0.06 | % | 1.13 | % | 0.64 | % | 1.20 | % | 0.99 | % | 85.51 | % | 68.00 | % | $ | 121 | 0.04 | % | ||||||||||||||||||||||
| State of |
GA |
|||||||||||||||||||||||||||||||||||||||
| CHFN |
Charter Financial Corporation |
GA |
0.19 | % | 0.76 | % | 0.45 | % | 0.83 | % | 1.03 | % | 124.65 | % | 94.06 | % | -$ | 1,132 | -0.13 | % | ||||||||||||||||||||
| Comparable Group |
||||||||||||||||||||||||||||||||||||||||
| Averages |
0.07 | % | 1.81 | % | 1.06 | % | 2.29 | % | 1.31 | % | 66.93 | % | 63.94 | % | $ | 140 | 0.05 | % | ||||||||||||||||||||||
| Medians |
0.05 | % | 1.85 | % | 0.81 | % | 2.10 | % | 1.22 | % | 71.34 | % | 67.78 | % | $ | 90 | 0.04 | % | ||||||||||||||||||||||
| Comparable Group |
||||||||||||||||||||||||||||||||||||||||
| ANCB |
Anchor Bancorp |
WA | 0.06 | % | 2.26 | % | 0.63 | % | 2.69 | % | 1.08 | % | 39.88 | % | 38.78 | % | $ | 258 | 0.08 | % | ||||||||||||||||||||
| EQFN |
Equitable Financial Corp. |
NE | 0.20 | % | 1.93 | % | 0.98 | % | 0.98 | % | 1.47 | % | 77.76 | % | 69.57 | % | -$ | 17 | -0.01 | % | ||||||||||||||||||||
| IROQ |
IF Bancorp, Inc. |
IL | 0.04 | % | 0.82 | % | 0.47 | % | 1.03 | % | 1.22 | % | 118.60 | % | 112.83 | % | $ | 187 | 0.04 | % | ||||||||||||||||||||
| JXSB |
Jacksonville Bancorp, Inc. |
IL | 0.07 | % | 1.33 | % | 0.57 | % | 2.22 | % | 1.58 | % | 71.34 | % | 67.78 | % | $ | 52 | 0.03 | % | ||||||||||||||||||||
| MELR |
Melrose Bancorp, Inc. |
MA | 0.00 | % | 0.00 | % | 0.00 | % | 0.00 | % | 0.42 | % | NA | NA | $ | 0 | 0.00 | % | ||||||||||||||||||||||
| MSBF |
MSB Financial Corp. |
NJ | 0.00 | % | 3.60 | % | 1.45 | % | 4.59 | % | 1.21 | % | 26.42 | % | 25.94 | % | $ | 127 | 0.05 | % | ||||||||||||||||||||
| PBSK |
Poage Bankshares, Inc. |
KY | 0.22 | % | 1.78 | % | 1.07 | % | 2.04 | % | 0.68 | % | 33.13 | % | 29.03 | % | $ | 537 | 0.16 | % | ||||||||||||||||||||
| PBIP |
Prudential Bancorp, Inc. |
PA | 0.10 | % | 3.39 | % | 2.94 | % | 5.28 | % | 0.94 | % | 17.79 | % | 17.24 | % | -$ | 114 | -0.03 | % | ||||||||||||||||||||
| UCBA |
United Community Bancorp |
IN | 0.01 | % | 1.03 | % | 0.60 | % | 1.90 | % | 1.62 | % | 84.53 | % | 82.99 | % | $ | 818 | 0.30 | % | ||||||||||||||||||||
| WBKC |
Wolverine Bancorp, Inc. |
MI | 0.02 | % | 1.92 | % | 1.87 | % | 2.16 | % | 2.87 | % | 132.93 | % | 131.27 | % | -$ | 448 | -0.14 | % | ||||||||||||||||||||
| (1) | NPAs are defined as nonaccrual loans, performing TDRs, and OREO. |
| (2) | Adjusted NPAs are defined as nonaccrual loans and OREO (performing TDRs are excluded). |
| (3) | NPLs are defined as nonaccrual loans and performing TDRs. |
| (4) | Net loan chargeoffs are shown on a last twelve month basis. |
| Source: | SNL Financial, LC and RP® Financial, LC. calculations. The information provided in this table has been obrained from sources we believe are reliable, but we cannot guarantee the accuracy or completeness of such information. |
Copyright (c) 2016 by RP® Financial, LC.
| RP® Financial, LC. | PEER GROUP ANALYSIS |
III.14
and foreclosed real estate/assets equaled 1.39% and 0.00%, respectively, versus comparable measures of 1.06% and 0.07% for the Peer Group, indicating a disadvantage for the Bank. At the same time, the Bank recorded a higher non-performing loans/loans ratio than the Peer Group, at 4.62% and 1.88% respectively. The Bank maintained a lower reserve coverage ratio, loss reserves as a percent of total NPAs, which equaled 49.11% for the Bank versus 63.94% for the Peer Group. Reflecting a more favorable ratio for the Bank, loss reserves maintained as percent of net loans receivable equaled 2.27% for the Bank versus 1.31% for the Peer Group. Net loan charge-offs were much higher for Newton Federal than the Peer Group, based on ratios of 0.82% and 0.05% of net loans receivable, respectively, indicating a higher more recent level of activities in terms of addressing problem assets.
Interest Rate Risk
Table 3.6 reflects various key ratios highlighting the relative interest rate risk exposure of the Bank versus the Peer Group. In terms of balance sheet ratios, Newton Federal’s interest rate risk characteristics were considered to be more favorable than the Peer Group. The Bank’s equity-to-assets and IEA/IBL ratios were higher than the Peer Group, thereby implying a lower dependence on the yield-cost spread to sustain the net interest margin for the Bank. The Bank also reported a lower level of non-interest earning assets, which provides an indication of the earnings capabilities and interest rate risk of the balance sheet. On a pro forma basis, the infusion of stock proceeds can be expected to provide the Bank with more favorable balance sheet interest rate risk characteristics than currently maintained by the Peer Group, particularly with respect to the increases that will be realized in the Bank’s equity-to-assets and IEA/IBL ratios.
To analyze interest rate risk associated with the net interest margin, we reviewed quarterly changes in net interest income as a percent of average assets for Newton Federal and the Peer Group. The relative fluctuations in the Bank’s net interest income to average assets ratio were considered to be higher than the Peer Group and, thus, based on the interest rate environment that prevailed during the period analyzed in Table 3.6, Newton Federal was viewed as maintaining a higher degree of interest rate risk exposure in the net interest margin. The stability of the Bank’s net interest margin should be enhanced by the infusion of stock proceeds, as the increase in capital will reduce the level of interest rate sensitive liabilities funding Newton Federal’s assets.
| RP® Financial, LC. | PEER GROUP ANALYSIS |
III.15
Table 3.6
Interest Rate Risk Measures and Net Interest Income Volatility
Comparable Institution Analysis
As of September 30, 2016 or the Most Recent Date Available
| Balance Sheet Measures | ||||||||||||||||||||||||||||||||||||||||
| Tangible | Avg | Non-Earn. | Quarterly Change in Net Interest Income | |||||||||||||||||||||||||||||||||||||
| Equity/ | IEA/ | Assets/ | ||||||||||||||||||||||||||||||||||||||
| Assets | Avg IBL | Assets | 9/30/2016 | 6/30/2016 | 3/31/2016 | 12/31/2015 | 9/30/2015 | 6/30/2015 | ||||||||||||||||||||||||||||||||
| (%) | (%) | (%) | (change in net interest income is annualized in basis points) | |||||||||||||||||||||||||||||||||||||
| Newton Federal Bank |
||||||||||||||||||||||||||||||||||||||||
| September 30, 2016 |
19.4 | % | 138.5 | % | 4.0 | % | 4 | 5 | 7 | 8 | -9 | -6 | ||||||||||||||||||||||||||||
| All Public Thrifts |
12.3 | % | 125.7 | % | 7.3 | % | -2 | 2 | -4 | 0 | 1 | 1 | ||||||||||||||||||||||||||||
| State of |
GA |
12.1 | % | 124.8 | % | 11.4 | % | -12 | 18 | -29 | 0 | 41 | 10 | |||||||||||||||||||||||||||
| Comparable Group |
||||||||||||||||||||||||||||||||||||||||
| Average |
15.7 | % | 124.3 | % | 6.4 | % | 4 | 3 | -5 | -1 | 13 | 0 | ||||||||||||||||||||||||||||
| Median |
15.5 | % | 126.6 | % | 6.3 | % | 3 | 2 | 3 | 2 | 10 | 0 | ||||||||||||||||||||||||||||
| Comparable Group |
||||||||||||||||||||||||||||||||||||||||
| ANCB |
Anchor Bancorp |
WA | 14.6 | % | 127.7 | % | 9.3 | % | 5 | 7 | 4 | -11 | 1 | 5 | ||||||||||||||||||||||||||
| EQFN |
Equitable Financial Corp. |
NE | 15.9 | % | 131.0 | % | 5.9 | % | 18 | 17 | -20 | -26 | 38 | 22 | ||||||||||||||||||||||||||
| IROQ |
IF Bancorp, Inc. |
IL | 14.2 | % | 118.2 | % | 3.0 | % | 4 | 2 | -5 | 9 | 5 | 5 | ||||||||||||||||||||||||||
| JXSB |
Jacksonville Bancorp, Inc. |
IL | 13.9 | % | 126.3 | % | 9.9 | % | -18 | -12 | 7 | 13 | -4 | 0 | ||||||||||||||||||||||||||
| MELR |
Melrose Bancorp, Inc. |
MA | 16.2 | % | 126.9 | % | 6.3 | % | 6 | -3 | 8 | 2 | 15 | 0 | ||||||||||||||||||||||||||
| MSBF |
MSB Financial Corp. |
NJ | 16.7 | % | 130.3 | % | 11.0 | % | -14 | 5 | 18 | 6 | -5 | -1 | ||||||||||||||||||||||||||
| PBSK |
Poage Bankshares, Inc. |
KY | 15.1 | % | 129.6 | % | 6.4 | % | 0 | -11 | -40 | 36 | 15 | -15 | ||||||||||||||||||||||||||
| PBIP |
Prudential Bancorp, Inc. |
PA | 20.4 | % | 116.3 | % | 3.6 | % | 2 | 1 | 4 | -4 | 15 | -14 | ||||||||||||||||||||||||||
| UCBA |
United Community Bancorp |
IN | 12.9 | % | 117.5 | % | 6.8 | % | -12 | 0 | 1 | 2 | 4 | 5 | ||||||||||||||||||||||||||
| WBKC |
Wolverine Bancorp, Inc. |
MI | 17.2 | % | 119.5 | % | 1.6 | % | 45 | 26 | -31 | -31 | 50 | -7 | ||||||||||||||||||||||||||
NA=Change is greater than 100 basis points during the quarter.
| Source: | SNL Financial LC. and RP® Financial, LC. calculations. The information provided in this table has been obtained from sources we believe are reliable, but we cannot guarantee the accuracy or completeness of such information. |
Copyright (c) 2015 by RP® Financial, LC.
| RP® Financial, LC. | PEER GROUP ANALYSIS |
III.16
Summary
Based on the above analysis, RP Financial concluded that the Peer Group forms a reasonable basis for determining the pro forma market value of the Bank. Such general characteristics as asset size, capital position, interest-earning asset composition, funding composition, core earnings measures, loan composition, credit quality and exposure to interest rate risk all tend to support the reasonability of the Peer Group from a financial standpoint. Those areas where differences exist will be addressed in the form of valuation adjustments to the extent necessary.
| RP® Financial, LC. | VALUATION ANALYSIS |
IV.1
IV. VALUATION ANALYSIS
Introduction
This chapter presents the valuation analysis and methodology, prepared pursuant to the regulatory valuation guidelines, and valuation adjustments and assumptions used to determine the estimated pro forma market value of the common stock to be issued in conjunction with the Company’s minority stock offering.
Appraisal Guidelines
The federal regulatory appraisal guidelines utilized by the OCC specify the pro forma market value methodology for estimating the pro forma market value of an institution. Pursuant to this methodology: (1) a peer group of comparable publicly-traded institutions is selected; (2) a financial and operational comparison of the subject company relative to the peer group is conducted to discern key differences, leading to valuation adjustments; and, (3) a valuation analysis in which the pro forma market value of the converting thrift is determined based on the market pricing of the peer group as of the date of the valuation, incorporating valuation adjustments for key differences. In addition, the pricing characteristics of recent conversions, both at conversion and in the aftermarket, must be considered. Given the unique differences in the pricing characteristics of publicly-traded MHCs relative to fully-converted thrift stocks, we have also reviewed the pricing characteristics of publicly-traded and non-publicly-traded MHCs on a fully-converted basis.
RP Financial Approach to the Valuation
The valuation analysis herein complies with such regulatory approval guidelines. Accordingly, the valuation incorporates a detailed analysis based on the Peer Group, discussed in Chapter III, which constitutes “fundamental analysis” techniques. Additionally, the valuation incorporates a “technical analysis” of recently completed conversions, including closing pricing and aftermarket trading of such offerings. It should be noted that these valuation analyses cannot possibly fully account for all the market forces which impact trading activity and pricing characteristics of a particular stock on a given day.
The pro forma market value determined herein is a preliminary value for the Company’s to-be-issued stock. Throughout the stock issuance process, RP Financial will: (1) review changes in Newton Federal’s operations and financial condition; (2) monitor the Bank’s
| RP® Financial, LC. | VALUATION ANALYSIS |
IV.2
operations and financial condition relative to the Peer Group to identify any fundamental changes; (3) monitor the external factors affecting value including, but not limited to, local and national economic conditions, interest rates, and the stock market environment, including the market for thrift stocks; and, (4) monitor pending conversion offerings, both regionally and nationally. If material changes should occur prior to closing of the offering, RP Financial will evaluate if updated valuation reports should be prepared reflecting such changes and their related impact on value, if any. RP Financial will also prepare a final valuation update at the closing of the offering to determine if the prepared valuation analysis and resulting range of value continues to be appropriate.
The appraised value determined herein is based on the current market and operating environment for the Bank and for all thrifts. Subsequent changes in the local and national economy, the legislative and regulatory environment, the stock market, interest rates, and other external forces (such as natural disasters or major world events), which may occur from time to time (often with great unpredictability) may materially impact the market value of all thrift stocks, including the Company’s value, or the Company’s value alone. To the extent a change in factors impacting the Bank’s value can be reasonably anticipated and/or quantified, RP Financial has incorporated the estimated impact into the analysis.
Valuation Analysis
A fundamental analysis discussing similarities and differences relative to the Peer Group was presented in Chapter III. The following sections summarize the key differences between the Bank and the Peer Group and how those differences affect the pro forma valuation. Emphasis is placed on the specific strengths and weaknesses of Newton Federal relative to the Peer Group in such key areas as financial condition, profitability, growth and viability of earnings, asset growth, primary market area, dividends, liquidity of the shares, marketing of the issue, management, and the effect of government regulations and/or regulatory reform. We have also considered the market for thrift stocks, in particular new issues, to assess the impact on value of the Bank coming to market at this time.
| RP® Financial, LC. | VALUATION ANALYSIS |
IV.3
| 1. | Financial Condition |
The financial condition of an institution is an important determinant in pro forma market value because investors typically look to such factors as liquidity, capital, asset composition and quality, and funding sources in assessing investment attractiveness. The similarities and differences in the Bank’s and the Peer Group’s financial strengths are noted as follows:
| • | Overall A/L Composition. In comparison to the Peer Group, the Bank’s IEA composition was slightly more favorable, reflecting a higher concentration of loans, and a lower concentration of cash and investments, resulting in a higher earnings capacity. In terms of funding liabilities, Newton Federal’s deposits were lower and borrowings were lower as a percent of assets compared to the Peer Group, resulting from the higher equity position of the Bank. Lending diversification into higher yielding types of loans (albeit higher risk loans) was more significant for the Peer Group, with such loans approximating 41% percent of assets for the Peer Group versus 26% for Newton Federal. Recent loan growth has occurred in the construction loan portfolio, and the relative unseasoned nature of this portfolio provides additional risk. The lower investment in higher risk loans resulted in Newton Federal reporting a lower risk weighted assets-to-assets ratio in comparison to the Peer Group’s ratio, as well as all, but two of the Peer Group members. The Bank’s IEA composition also resulted in a higher yield earned on IEA, while the Bank’s cost of IBL was slightly higher than the Peer Group’s cost of funds. As a percent of assets, Newton Federal maintained a lower level of IEA and a lower level of IBL, given the higher pre-conversion equity position of the Bank. The Bank’s IEA/IBL ratio of 123.0% was higher than the 116.8% ratio for the Peer Group. After factoring in the impact of the net stock proceeds, the Company’s IEA/IBL ratio will continue to exceed the Peer Group’s ratio. RP Financial concluded that A/L composition was a slight upward factor in the adjustment for financial condition. |
| • | Credit Quality. Newton Federal’s NPAs/assets and NPLs/loans ratios were higher than the comparable Peer Group ratios. Additionally, when excluding performing TDRs from the NPA/assets ratio, Newton Federal’s ratio remained higher than the Peer Group average. Loan loss reserves as a percent of NPLs and NPAs were lower than the Peer Group averages, while Newton Federal reported a higher ratio of loan loss reserves as a percent of loans. Net loan charge-offs as a percent of loans for Newton Federal were much higher than the Peer Group average. As noted above, Newton Federal’s risk weighted assets-to-assets ratio was lower than the Peer Group’s ratio. In addition, the Bank’s loan portfolio composition was concentrated in lower risk residential assets, including MBS. Overall, RP Financial concluded that credit quality was a slight downward factor in the adjustment for financial condition. |
| • | Balance Sheet Liquidity. As of the valuation date, Newton Federal reported a lower level of cash and investment securities relative to the Peer Group, with the Bank’s investments concentrated in cash and equivalents. Following the infusion of stock proceeds, the Bank’s cash and investments ratio is expected to increase as the proceeds retained at the holding company level will be initially deployed into shorter term investment securities while the Bank’s portion of the proceeds will also be deployed into investments pending the longer term reinvestment into loans. The Bank’s future borrowing capacity was considered to be higher than the Peer Groups’, given current zero level of borrowings currently utilized by the Bank in funding the asset base. Overall, RP Financial concluded that pro forma balance sheet liquidity was a neutral factor in our adjustment for financial condition. |
| RP® Financial, LC. | VALUATION ANALYSIS |
IV.4
| • | Funding Liabilities. Newton Federal’s IBL composition reflected a slightly higher concentration of deposits and lower use of borrowings relative to the comparable Peer Group ratios, although Newton Federal’s cost of funds was somewhat higher than the Peer Group’s ratio. Total IBL as a percent of assets were lower for the Bank as compared to the Peer Group’s ratio due to the higher pre-conversion equity ratio maintained by the Bank. Following the stock offering, the increase in the Bank’s equity position will reduce the level of IBL, further expanding this advantage in comparison to the Peer Group. Overall, RP Financial concluded that funding liabilities were a slightly positive factor in our adjustment for financial condition. |
| • | Tangible Equity/Return on Equity. Newton Federal currently operates with a higher tangible equity-to-assets ratio as compared to the Peer Group. Following the stock offering, Newton Federal’s pro forma tangible equity position will further exceed the Peer Group’s ratio, which will result in greater growth potential. At the same time, the Bank’s more significant equity surplus will likely result in a lower ROE. On balance, RP Financial concluded that the tangible equity position was a neutral factor in our adjustment for financial condition, as the greater leverage potential was offset by lower return on equity. |
On balance, Newton Federal’s financial condition, taking into account the above factors, was considered to be similar to that of the Peer Group, and thus no adjustment was applied for this valuation factor.
| 2. | Profitability, Growth and Viability of Earnings |
Earnings are a key factor in determining pro forma market value, as the level and risk characteristics of a financial institution’s earnings stream and the prospects and ability to generate future earnings, heavily influence the multiple that the investment community will pay for earnings. The major factors considered in the valuation are described below.
| • | Reported Profitability. For the most recent 12 month period, Newton Federal reported net income of $1.2 million, or 0.51% of average assets, versus average and median profitability of 0.57% and 0.48% of average assets for the Peer Group. The Bank’s lower income in comparison to the Peer Group was attributable a higher level of operating expense and lower non-interest income, which was partially offset by higher net interest income (a result of higher interest income and slightly higher interest expense). The Peer Group relied to a limited extent on gains on the sale of loans. A key difference between the Bank and the Peer Group is Newton Federal’s higher interest income ratio, a result of the higher loans/assets ratio and the Bank’s higher yield on earning assets and overall yield/cost spread. Reinvestment and leveraging of stock proceeds into interest-earning assets will serve to increase the Bank’s bottom line income, with the benefit of reinvesting proceeds expected to be somewhat offset by higher operating expenses associated with operating as a publicly-traded company. The Bank’s level of NPAs will remain as a potential negative factor in future earnings as additional loan loss reserves may be incurred. However, the Peer Group can also be expected to experience losses related to problem assets. On balance, RP Financial concluded that the Bank’s reported earnings were a neutral factor in our adjustment for profitability, growth and viability of earnings. |
| RP® Financial, LC. | VALUATION ANALYSIS |
IV.5
| • | Core Profitability. Net interest income, operating expenses, non-interest operating income and loan loss provisions were reviewed in assessing the relative strengths and weaknesses of core profitability. Newton Federal operated with a higher net interest income ratio and a lower level of non-interest operating income, based on a comparison to the Peer Group averages and medians. The advantage in terms of revenues were mitigated to an extent by the Bank’s higher operating expense ratio such that the Bank’s efficiency ratio was modestly less favorable to the Peer Group’s ratio. Loan loss provisions had a larger impact on the Peer Group’s earnings, although Peer Group provisions were modest in total. The expected earnings benefits the Bank should realize from the redeployment of stock proceeds into IEA and leveraging of post-conversion equity will be somewhat negated by expenses associated with the stock benefit plans, as well as incremental costs associated with the growth oriented business plan. On balance we believe the Bank’s core profitability was a neutral factor in this valuation adjustment. |
| • | Interest Rate Risk. Quarterly changes in the net interest income ratio for Newton Federal indicated a somewhat higher degree of volatility. Other measures of interest rate risk, such as tangible equity and the IEA/IBL ratio were more favorable than the Peer Group. On a pro forma basis, the infusion of stock proceeds can be expected to provide the Bank with equity-to-assets and IEA/IBL ratios that will further exceed the Peer Group ratios, as well as enhance the stability of the Bank’s net interest margin through the reinvestment of stock proceeds into IEA. On balance, RP Financial concluded that interest rate risk was a neutral factor in our adjustment for profitability, growth and viability of earnings. |
| • | Credit Risk. Loan loss provisions were a lower factor in the Bank’s income statement over the most recent 12 month time period. In terms of future exposure to credit quality related losses, Newton Federal maintained a higher concentration of assets in loans and less lending diversification into higher credit risk loans. The Bank’s risk weighted assets-to-assets ratio was lower than the Peer Group’s ratio, as well as all but one of the Peer Group member ratios. The Bank’s NPAs/assets ratio was less favorable than the Peer Group and loss reserves also were less favorable for the Bank in comparison to NPAs and NPLs but more favorable in terms of loans receivable. Net loan charge-offs over the last 12 months as a percent of loans were higher for the Bank as a percent of loans as compared to the Peer Group. Overall, RP Financial concluded that credit risk was a slightly negative factor in the adjustment for profitability, growth and viability of earnings. |
| • | Earnings Growth Potential. Newton Federal maintained a higher level of net interest income and a higher interest rate spread as compared to the Peer Group. The Bank’s earnings growth potential is dictated by the growth capabilities of the balance sheet in general – a key part of the future operating strategy. The timing of such asset and loan growth, and quality of such loans to be obtained, remains uncertain. While the Bank’s original primary market area reveals less favorable current demographic and economic data and future trends, Newton Federal’s eventual success in transitioning to the expanded market area between Covington and Athens also will determine future profitability growth. The infusion of stock proceeds will provide the Bank with greater leverage potential than the Peer Group. On balance, we viewed the growth potential from the higher post-conversion equity ratio as a favorable valuation comparison to the Peer Group, which would be expected to result in favorable earnings growth over time. On balance, we concluded that a slight upward valuation adjustment was warranted for this factor. |
| RP® Financial, LC. | VALUATION ANALYSIS |
IV.6
| • | Return on Equity. Currently, the Bank’s trailing 12 month ROE on either a reported or core basis is lower than the Peer Group’s ROE. On a pro forma basis, immediately following the conversion the Bank’s earnings increase will be limited whereas the equity will increase considerably, thus resulting in a lower pro forma ROE relative to the Peer Group, however the Bank will have higher growth potential in terms of earning assets and earnings given the higher equity position. On balance, RP Financial concluded that the tangible equity position was a neutral factor in our adjustment for financial condition, as the greater leverage potential was offset by lower return on equity. |
On balance, Newton Federal’s pro forma earnings strength was considered to be somewhat less favorable than the Peer Group’s and, thus, a slight downward adjustment was warranted for profitability, growth and viability of earnings.
| 3. | Asset Growth |
Newton Federal’s assets increased at an annual rate of 2.9% during the most recent 12 month period, while the Peer Group’s assets increased by 10.1% over the same time period. All ten of the Peer Group companies reported increases in assets, with the highest growth of a peer member equal to 19.29% (due to loan growth). The recent modest asset growth reported by Newton Federal is primarily the result of lower needs for additional funds given the current level of liquidity and overall loan demand. On a pro forma basis, Newton Federal’s tangible equity-to-assets ratio will further exceed the Peer Group’s tangible equity-to-assets ratio, indicating greater leverage capacity for the Bank. Newton Federal’s original market area location in Newton County and the related size and growth rate of the population base implies a restricted growth capability. The Bank has begun a movement north and northeastward to higher population centers and geographic areas that have more favorable demographic and economic trends. After taking into account the lower historical asset growth rate, and based on the greater leverage capacity with the enhanced equity base following the offering, and the market area expansion in process, we concluded that no valuation adjustment was warranted for asset growth.
| 4. | Primary Market Area |
The general condition of an institution’s market area has an impact on value, as future success is in part dependent upon opportunities for profitable activities in the local market
| RP® Financial, LC. | VALUATION ANALYSIS |
IV.7
served. Newton Federal’s primary market area for loans and deposits is considered to be Newton County (1-4 family residential), with additional lending activities in the expanded market area counties to the north and northeast of Newton County, extending to the Athens, Georgia metropolitan area where the Bank maintains its LPO. Within this market, the Bank faces significant competition for loans and deposits from both community based institutions and larger regional financial institutions, which provide a broader array of services and have significantly larger branch networks. However, the Peer Group companies by virtue of their relatively comparable size relative to Newton Federal also face numerous and/or large competitors.
Demographic and economic trends and characteristics in the Bank’s primary market area are presented in Exhibit III-3 along with Peer Group comparable data. In this regard, the total population of Newton County is lower than the average and higher than the median primary market areas of the Peer Group. In addition, the historical and projected population growth rate in Newton County is well above the Peer Group average over the 2010-2016 and 2016-2022 periods. While these demographic trends are more favorable, the per capita income level in Newton County ($22,587 as of 2016) is well below the average and median of the Peer Group’s markets. As a percentage of the state average, Newton County is also below the average and median of the Peer Group. This low income characteristic of Newton County is a notable limitation on business activities such as financial institutions, as income levels translate to an extent to average home prices and value appreciation. The deposit market share exhibited by the Bank in Newton County is above the Peer Group average and median, however, indicative of the smaller market within which the Bank operates, as several of the Peer Group members operate in large metropolitan areas. As shown in Table 4.1, the average unemployment rate for the primary market area counties served by the Peer Group companies was below the unemployment rate reflected for Newton County.
The size of the Bank’s original market area of Newton County in terms of population was more favorable than the Peer Group, although the economic base is less favorable. The Bank has recently expanded the lending market area beyond Newton County to include a number of counties with more attractive demographic and economic trends. The ability to successfully expand operations in a reasonable time period and at acceptable costs remains uncertain. There also remains significant uncertainty as to the timing and level of loan originations to be obtained in these new markets. On balance, we concluded that no adjustment was appropriate for the Bank’s market area.
| RP® Financial, LC. | VALUATION ANALYSIS |
IV.8
Table 4.1
Market Area Unemployment Rates
Newton Federal and the Peer Group Companies (1)
| County | September 2016 Unemployment |
|||||
| Newton Federal—GA |
Newton | 5.9 | % | |||
| Peer Group Average |
4.9 | |||||
| The Peer Group |
||||||
| Anchor Bancorp—WA |
Thurston | 5.7 | ||||
| Equitable Financial Corp.—NE |
Hall | 3.2 | ||||
| IF Bancorp, Inc.–IL |
Iroquois | 5.3 | ||||
| Jacksonville Bancorp, Inc.—IL |
Morgan | 4.8 | ||||
| Melrose Bancorp, Inc.—MA |
Middlesex | 2.8 | ||||
| MSB Financial Corp.—NJ |
Morris | 4.2 | ||||
| Poage Bankshares, Inc.—KY |
Boyd | 7.9 | ||||
| Prudential Bancorp, Inc.—PA |
Philadelphia | 7.0 | ||||
| United Community Bancorp, Inc.—IN |
Dearborn | 4.4 | ||||
| Wolverine Bancorp, Inc.—MI |
Midland | 3.6 | ||||
| (1) | Unemployment rates are not seasonally adjusted. |
Source: SNL Financial, LC; Department of Labor.
| 5. | Dividends |
At this time the Bank has not established a dividend policy. Future declarations of dividends by the Board of Directors will depend upon a number of factors, including investment opportunities, growth objectives, financial condition, profitability, tax considerations, minimum capital requirements, regulatory limitations, stock market characteristics and general economic conditions.
Five of the ten Peer Group companies pay regular cash dividends, with implied dividend yields ranging from 0.76% to 1.69%. The median dividend yield on the stocks of the Peer Group institutions was 1.10% as of November 25, 2016, representing a median payout ratio of 40.03% of earnings. Comparatively, as of November 25, 2016, the median dividend yield on the stocks of all fully-converted publicly-traded thrifts equaled 1.41%.
Our valuation adjustment for dividends for Newton Federal also considered the regulatory policy with regard to payment of dividends to the MHC. Under current FRB policy, any dividends declared by Newton Federal would be required to be paid to all shareholders. Accordingly, dividends paid by Newton Federal would increase the amount of assets held by the MHC, after adjusting for applicable income taxes, and, thereby, increase the implied dilution incurred by the minority shareholders in a second-step conversion pursuant to the calculation to account for net assets held by the MHC in a second-step offering.
| RP® Financial, LC. | VALUATION ANALYSIS |
IV.9
Overall, while the Bank has not established a definitive dividend policy prior to its stock offering, the Bank will have the capacity to pay a dividend comparable to the Peer Group’s average dividend yield based on pro forma earnings and capitalization. At the same time, dividend payments retained by the MHC would increase the implied dilution to minority shareholders in a second-step offering. On balance, we concluded that a slight downward adjustment was warranted for purposes of the Bank’s dividend policy.
| 6. | Liquidity of the Shares |
The Peer Group is by definition composed of companies that are traded in the public markets. All ten of the Peer Group members trade on NASDAQ. Typically, the number of shares outstanding and market capitalization provides an indication of how much liquidity there will be in a particular stock. The market capitalization of the Peer Group companies ranged from $31.6 million to $127.2 million as of November 25, 2016, with average and median market values of $66.8 million and $65.8 million, respectively. The shares issued and outstanding to the public shareholders of the Peer Group members ranged from 1.8 million to 8.0 million, with average and median shares outstanding of 3.8 million and 3.6 million, respectively. The Bank’s stock offering at the midpoint is expected to provide for pro forma shares outstanding that will be lower than the average and median shares outstanding indicated for the Peer Group companies. Likewise, the market capitalization of the Bank at the midpoint of the offering range will be lower than the Peer Group average and median values. Like all of the Peer Group companies, the Company’s stock is expected to be quoted on NASDAQ following the conversion offering, however the stock will retain characteristics of an initial public offering. Based on the above factors and the comparability of the anticipated trading market on NASDAQ, we concluded that a slight downward valuation adjustment was warranted for this factor.
| 7. | Marketing of the Issue |
We believe that three separate markets exist for thrift stocks, including those coming to market such as Newton Federal’s: (A) the after-market for public companies both fully-converted and MHCs, in which trading activity is regular and investment decisions are made
| RP® Financial, LC. | VALUATION ANALYSIS |
IV.10
based upon financial condition, earnings, capital, ROE, dividends and future prospects; (B) the new issue market in which converting thrifts are evaluated on the basis of the same factors, but on a pro forma basis without the benefit of prior operations as a fully-converted publicly-held company and stock trading history; and, (C) the thrift acquisition market. All three of these markets were considered in the valuation of the Bank’s to-be-issued stock.
A. The Public Market
The value of publicly-traded thrift stocks is easily measurable, and is tracked by most investment houses and related organizations. Exhibit IV-1 provides pricing and financial data on all publicly-traded thrifts. In general, thrift stock values react to market stimuli such as interest rates, inflation, perceived industry health, projected rates of economic growth, regulatory issues, and stock market conditions in general. Exhibit IV-2 displays historical stock market trends for various indices and includes historical stock price index values for thrifts and commercial banks. Exhibit IV-3 displays historical stock price indices for thrifts only.
In terms of assessing general stock market conditions, the overall stock market has generally trended higher in recent quarters. Stocks traded in a narrow range during the first couple weeks of the second quarter of 2016, as investors turned cautious at the start of the first quarter earnings season that was expected to show a decline in corporate profits. Bank stocks contributed to stock market gains in mid-April with the Dow Jones Industrial Average (“DJIA”) closing above 18000 for the first time since July 20, 2015, as first quarter earnings reports posted by some of the large banks came in above lowered expectations. The broader stock market traded in a narrow range heading into the last week of April, as investors turned cautious ahead of the late-April meeting of the Federal Reserve. The broader stock market trended lower in late-April 2016, as investors reacted to weak first quarter GDP growth and the Bank of Japan’s decision not to launch additional stimulus measures. Fresh worries about a slowing global economy and lower oil prices extended the downturn in stocks during the first week of May, as U.S. stock indexes fell for a second consecutive week. Volatility prevailed in the broader stock market heading into mid-May. Energy shares led the stock market higher as crude oil prices hit a new high for 2016, while consumer-focused companies led indexes lower following weak earnings reports posted by some of the large retailers. The DJIA traded down for three consecutive sessions at the start of the second half of May, as a handful of upbeat economic data releases and comments from Federal Reserve officials raised the possibility of a June rate increase. Technology and financial stocks led a rebound in the stock market in late-May,
| RP® Financial, LC. | VALUATION ANALYSIS |
IV.11
as strong housing data, rising oil prices and growing investor confidence that higher interest rates would not undermine stock prices combined to lift major U.S. stock indexes. The positive trend in the broader stock market continued through the last full trading week of May, with major U.S. stock indexes matching their biggest weekly gains in months. Comments by Federal Reserve Chairwoman Janet Yellen reiterating that Federal Reserve policymakers were looking at a possible rate increase at its June or July meeting served to trim May stock market gains at the close of the month. During the first two weeks of June, the broader stock market seesawed in a narrow range. Weak job growth reflected in the May employment report pulled stocks lower at the start of June, which was followed by a stock market rebound led by a rally in energy stocks as oil approached $50 a barrel. Volatility prevailed in the broader stock market during the second half of June, with Britain’s late-June vote on whether to exit the European Union (“Brexit”) impacting global stock markets. Stocks traded higher ahead of the Brexit vote and then plunged sharply lower, as the shock from Britain’s vote to leave the European Union swept across global stock markets. Stocks rebounded to close out the month of June, led by the sectors that were hit hardest by the Brexit vote.
The rally in the broader stock market continued at the start of July 2016, with the stronger-than-expected job growth reflected in the June employment report propelling the S&P 500 to a record high close. Stocks continued to trend higher going in the second half of July, as a string of economic data releases that showed improvement in home building, retail sales and job creation helped to propel the DJIA higher for nine consecutive sessions. Following the extended rally, the DJIA closed lower for seven consecutive sessions going into early-August. A decline in oil prices amid concerns of a glut in the supply of oil and weaker-than-expected second quarter GDP growth were factors that contributed to the downturn in the broader stock market. A rally in energy and financial shares helped to snap the seven day losing streak in the DJIA ahead of the July employment report. Better-than-expected job growth reflected in the July employment report fueled a rally in the broader stock market to close out the first week of trading in August. All three major stock indexes closed at record highs in mid-August, led by gains in commodity-linked shares. The broader stock market eased lower during the second half of August with the DJIA finishing down for the month of August, which snapped a six-month winning streak for the DJIA. Some lackluster data for the U.S. economy provided for a narrow trading range in the broader stock market in early-September, as investors reassessed the likelihood of a rate increase in the near term. Volatility prevailed in the broader stock market in mid-September, based on various hawkish and dovish comments from Federal Reserve officials
| RP® Financial, LC. | VALUATION ANALYSIS |
IV.12
for a near term rate hike. Stocks rebounded after the Federal Reserve concluded its September meeting leaving interest rates unchanged and then seesawed higher and lower to close out the third quarter. Overall, all three of the major U.S. stock indexes posted gains for the third quarter.
Stocks traded unevenly at the start of the fourth quarter of 2016, as investors reacted to third quarter earnings reports that had varied results. Consumer shares weighed on the broader stock market in the second half of October, following a string of disappointing earnings reports coming out of the consumer sector and a downbeat outlook for the rest of 2016. The DJIA fell for a third month in a row to close out October, with a monthly decline of 0.9%. Stocks extended their losing streak in early-November, as investors reacted to tightening polls for the presidential election. News of the FBI finding no new evidence to warrant charges against Democratic candidate Hillary Clinton sent stocks sharply higher the day before the presidential election. However, investors embraced Trump’s election, as stocks surged higher based on expectations for reduced corporate taxes and regulation and greater infrastructure spending under a Trump administration. Additional news regarding the election and Trump’s intentions upon taking office through mid- and late-November resulted in further strength to the stock market in general. On November 25, 2016, the DJIA closed at 19152.14, an increase of 7.5% from one year ago and an increase of 9.9% year-to-date, and the NASDAQ Composite Index closed at 5398.92, an increase of 5.5% from one year ago and an increase of 7.8% year-to-date. The S&P 500 closed at 2213.35 on November 25, 2016, an increase of 6.0% from one year ago and an increase of 8.3% year-to-date.
The market for thrift stocks has also experienced varied trends in recent quarters. Financial shares traded lower at the start of the second quarter of 2016, as investors anticipated a decline in first quarter profitability for the banking sector. Better-than-expected first quarter earnings reports posted by some of the money center banks contributed to a mid-April rebound for bank and thrift stocks in general. Thrift stocks advanced ahead of the late-April policy meeting of the Federal Reserve, which was followed by a downturn in thrift shares at the close of April and into the first week of May. The pullback in financial shares was fueled by growing expectations that the Federal Reserve was not in a hurry to raise interest rates, based on economic data that showed a slowdown in first quarter GDP growth and a decline in April job growth. Thrift shares seesawed along with the broader stock market heading into mid-May, initially rallying with a rebound in oil prices followed by a pullback as some favorable economic reports spurred increased expectations that the Federal Reserve could move to increase
| RP® Financial, LC. | VALUATION ANALYSIS |
IV.13
interest rates at its next meeting in June. Financial shares outpaced the broader stock market going into the second half of May, as minutes from the Federal Reserve’s April meeting suggested that a June interest rate increase was a possibility. A surge in April new home sales added to gains in the banking sector heading into late-May. Financial shares led the market lower in early-June and then settled into narrow trading range heading into mid-June, as the weak jobs report for May dimmed expectations that the Federal Reserve would move to lift interest rates this summer. Going into the second half June, thrift shares paralleled trends in the broader stock market. After trending higher ahead of the Brexit vote, financial shares were among the hardest hit sectors on Britain’s surprising vote to exit the European Union. Also, similar to the broader stock market, thrift shares rallied at the close of the second quarter.
The positive trend for thrift stocks continued at the start of July 2016, with the strong jobs report for June fueling additional gains for the thrift sector. Some stronger-than-expected second quarter earnings reports coming out of the banking sector, along with favorable data on the U.S. economy, helped to sustain the positive trend in thrift shares going into the second half of July. Financial shares traded in a narrow range to closeout July and into early-August, as the Federal Reserve concluded its late-July policy meeting with no change in its target interest rate as expected. Financial shares posted healthy gains on the heels of the favorable jobs report for July, as the S&P 500’s financial sector moved into positive territory for the first time in 2016. After trading in a narrow range into the second half of August, some favorable housing data helped thrift shares to rally in late-August. The positive trend in thrift stocks continued into early-September, as a slowdown in August job growth reduced expectations that the Federal Reserve would soon raise rates. Thrift shares followed the broader stock market lower in mid-September, as investors reacted to oil prices moving to a one-month low. For the balance of September and into mid-October, thrift shares traded in a tight range as Federal Reserve minutes released in mid-October offered investors few new insights about a next rate increase. Financial shares led the stock market higher heading into the second half of October, in light of third quarter earnings reports generally offering fresh evidence of profitability improving for banks. Thrift stocks were largely trendless through the end of October and then pulled back along with the broader stock market in early-November. Bank and thrift stocks were among the strongest performers in leading the post-election stock market rally, reflecting investor expectations for reduced regulation of the banking sector. On November 25, 2016, the SNL Index for all publicly-traded thrifts closed at 932.54, an increase of 13.8% from one year ago and an increase of 15.3% year-to-date.
| RP® Financial, LC. | VALUATION ANALYSIS |
IV.14
| B. | The New Issue Market |
In addition to thrift stock market conditions in general, the new issue market for converting thrifts is also an important consideration in determining the Bank’s pro forma market value. The new issue market is separate and distinct from the market for seasoned thrift stocks in that the pricing ratios for converting issues are computed on a pro forma basis, specifically: (1) the numerator and denominator are both impacted by the conversion offering amount, unlike existing stock issues in which price change affects only the numerator; and (2) the pro forma pricing ratio incorporates assumptions regarding source and use of proceeds, effective tax rates, stock plan purchases, etc. which impact pro forma financials, whereas pricing for existing issues are based on reported financials. The distinction between pricing of converting and existing issues is perhaps no clearer than in the case of the price/book (“P/B”) ratio in that the P/B ratio of a converting thrift will typically result in a discount to book value whereas in the current market for existing thrifts the P/B ratio may reflect a premium to book value. Therefore, it is appropriate to also consider the market for new issues, both at the time of the conversion and in the aftermarket.
As shown in Table 4.2, two second-step conversions have been completed during the past three months. While the second step conversion are not considered to be totally relevant for Newton Federal’s pro forma pricing, given the MHC offering structure, we can still examine such information. The average closing pro forma price/tangible book ratio of the two recent second step conversion offerings equaled 72.5%. On average, the two second step conversion offerings reflected price appreciation of 23.7% after the first week of trading. As of November 25, 2016, the two recent second step conversion offerings reflected a 20.5% increase in price on average.
Shown in Table 4.3 are the current pricing ratios for these two second step converted offerings completed during the past three months that trade on NASDAQ. The current average P/TB ratio of these two companies equaled 87.51%, based on closing stock prices as of November 25, 2016.
| C. | The Acquisition Market |
Also considered in the valuation was the potential impact on Newton Federal’s stock price of recently completed and pending acquisitions of other thrift institutions operating in Georgia. As shown in Exhibit IV-4, there have been eight thrift acquisitions completed from the beginning of 2001 through November 25, 2016, and there are currently no acquisitions pending
| RP® Financial, LC. | VALUATION ANALYSIS |
IV.15
Table 4.2
Pricing Characteristics and After-Market Trends
Conversions Completed in the Last Three Months
| Institutional Information |
Pre-Conversion Data | Offering Information | Insider Purchases | Pro Forma Data | Post-IPO Pricing Trends | |||||||||||||||||||||||||||||||||||||||||||||||||||||||||||||||||||||||||||||||||||||||||||||||||||||||||||||||||||||||||||
| Financial Info. |
Asset Quality |
Contribution to Char. Found. |
% Off Incl. Fdn.+Merger Shares |
Pricing Ratios(2)(5) |
Financial Charac. |
Closing Price: | ||||||||||||||||||||||||||||||||||||||||||||||||||||||||||||||||||||||||||||||||||||||||||||||||||||||||||||||||||||||||||
| Excluding Foundation | % of Public Off. Inc. Fdn. |
Benefit Plans | Initial Div. Yield |
First Trading Day |
After First Week(3) |
After First Month(4) |
||||||||||||||||||||||||||||||||||||||||||||||||||||||||||||||||||||||||||||||||||||||||||||||||||||||||||||||||||||||||||
| Institution |
Conversion Date |
Ticker | Assets | Equity/ Assets |
NPAs/ Assets |
Res. Cov. |
Gross Proc. |
% Offer |
% of Mid. |
Exp./ Proc. |
Form | ESOP | Recog. Plans |
Stk Option |
Mgmt.& Dirs. |
P/TB | Core P/E |
P/A | Core ROA |
TE/A | Core ROE |
IPO Price |
% Chge |
% Chge |
% Chge |
Thru 11/25/2016 |
% Chge |
|||||||||||||||||||||||||||||||||||||||||||||||||||||||||||||||||||||||||||||||||||||||||||||||||||||
| ($Mil) | (%) | (%) | (%) | ($Mil.) | (%) | (%) | (%) | (%) | (%) | (%) | (%) | (%)(1) | (%) | (%) | (x) | (%) | (%) | (%) | (%) | ($) | ($) | (%) | ($) | (%) | ($) | (%) | ($) | (%) | ||||||||||||||||||||||||||||||||||||||||||||||||||||||||||||||||||||||||||||||||||||||||||||||||||||
| Second Step Conversions |
||||||||||||||||||||||||||||||||||||||||||||||||||||||||||||||||||||||||||||||||||||||||||||||||||||||||||||||||||||||||||||||||
| Bancorp 34, Inc. |
10/12/16 |
|
BCTF- NASDAQ |
|
$ | 287 | 10.61 | % | 0.54 | % | 626 | % | $ | 18.8 | 55 | % | 132 | % | 7.5 | % | N.A. | N.A. | 8.0 | % | 4.0 | % | 10.0 | % | 5.2 | % | 0.00 | % | 76.0 | % | 52.3x | 11.4 | % | 0.2 | % | 15.0 | % | 1.4 | % | $ | 10.00 | $ | 12.75 | 27.5 | % | $ | 13.00 | 30.0 | % | $ | 12.33 | 23.3 | % | $ | 12.37 | 23.7 | % | |||||||||||||||||||||||||||||||||||||||||||||||||||||||||||||||||||
| Ottawa Bancorp, Inc. |
10/12/16 |
|
OTTW- NASDAQ |
|
$ | 217 | 14.55 | % | 2.16 | % | NA | $ | 23.8 | 69 | % | 115 | % | 6.4 | % | N.A. | N.A. | 8.0 | % | 4.0 | % | 10.0 | % | 1.5 | % | 1.60 | % | 69.1 | % | 30.1x | 14.6 | % | 0.5 | % | 21.2 | % | 2.3 | % | $ | 10.00 | $ | 11.57 | 15.7 | % | $ | 11.74 | 17.4 | % | $ | 11.68 | 16.8 | % | $ | 11.73 | 17.3 | % | ||||||||||||||||||||||||||||||||||||||||||||||||||||||||||||||||||||
| Averages - Second Step Conversions: |
|
$ | 252 | 12.58 | % | 1.35 | % | 626 | % | $ | 21.3 | 62 | % | 123 | % | 6.9 | % | N.A. | N.A. | 8.0 | % | 4.0 | % | 10.0 | % | 3.3 | % | 0.80 | % | 72.5 | % | 41.2x | 13.0 | % | 0.4 | % | 18.1 | % | 1.8 | % | $ | 10.00 | $ | 12.16 | 21.6 | % | $ | 12.37 | 23.7 | % | $ | 12.00 | 20.0 | % | $ | 12.05 | 20.5 | % | ||||||||||||||||||||||||||||||||||||||||||||||||||||||||||||||||||||||
| Medians - Second Step Conversions: |
|
$ | 252 | 12.58 | % | 1.35 | % | 626 | % | $ | 21.3 | 62 | % | 123 | % | 6.9 | % | N.A. | N.A. | 8.0 | % | 4.0 | % | 10.0 | % | 3.3 | % | 0.80 | % | 72.5 | % | 41.2x | 13.0 | % | 0.4 | % | 18.1 | % | 1.8 | % | $ | 10.00 | $ | 12.16 | 21.6 | % | $ | 12.37 | 23.7 | % | $ | 12.00 | 20.0 | % | $ | 12.05 | 20.5 | % | ||||||||||||||||||||||||||||||||||||||||||||||||||||||||||||||||||||||
| Note: | * - Appraisal performed by RP Financial; BOLD = RP Fin. Did the business plan, “NT” - Not Traded; “NA” - Not Applicable, Not Available; C/S-Cash/Stock. |
11/25/2016
| RP® Financial, LC. | VALUATION ANALYSIS |
IV.16
Table 4.3
Public Market Pricing Versus Peer Group
Community First Bancshares, Inc.
As of November 25, 2016
| Market | Per Share Data | |||||||||||||||||||||||||||||||||||||||||||||||||||||||||||||||||||||||||||||||||||
| Capitalization | Core | Book | Dividends(4) | Financial Characteristics(6) | ||||||||||||||||||||||||||||||||||||||||||||||||||||||||||||||||||||||||||||||||
| Price/ | Market | 12 Month | Value/ | Pricing Ratios(3) | Amount/ | Payout | Total | Equity/ | Tang. Eq./ | NPAs/ | Reported | Core | ||||||||||||||||||||||||||||||||||||||||||||||||||||||||||||||||||||||||
| Share(1) | Value | EPS(2) | Share | P/E | P/B | P/A | P/TB | P/Core | Share | Yield | Ratio(5) | Assets | Assets | T. Assets | Assets | ROAA | ROAE | ROAA | ROAE | |||||||||||||||||||||||||||||||||||||||||||||||||||||||||||||||||
| ($) | ($Mil) | ($) | ($) | (x) | (%) | (%) | (%) | (x) | ($) | (%) | (%) | ($Mil) | (%) | (%) | (%) | (%) | (%) | (%) | (%) | |||||||||||||||||||||||||||||||||||||||||||||||||||||||||||||||||
| All Non-MHC Public Companies(6) |
||||||||||||||||||||||||||||||||||||||||||||||||||||||||||||||||||||||||||||||||||||
| Averages |
$ | 20.55 | $ | 530.90 | $ | 1.05 | $ | 15.78 | 18.80x | 123.90 | % | 15.20 | % | 134.09 | % | 19.59x | $ | 0.31 | 1.49 | % | 49.23 | % | $ | 3,069 | 12.71 | % | 12.15 | % | 1.13 | % | 0.71 | % | 5.98 | % | 0.73 | % | 6.11 | % | ||||||||||||||||||||||||||||||||||||||||||||||
| Median |
$ | 16.33 | $ | 132.28 | $ | 0.78 | $ | 14.42 | 18.77x | 121.48 | % | 14.66 | % | 127.40 | % | 19.15x | $ | 0.24 | 1.43 | % | 39.21 | % | $ | 937 | 11.50 | % | 11.12 | % | 0.88 | % | 0.62 | % | 5.34 | % | 0.64 | % | 5.14 | % | ||||||||||||||||||||||||||||||||||||||||||||||
| Comparable Group |
||||||||||||||||||||||||||||||||||||||||||||||||||||||||||||||||||||||||||||||||||||
| Averages |
$ | 12.05 | $ | 41.51 | $ | 0.26 | $ | 14.02 | 35.27x | 86.31 | % | 15.60 | % | 87.51 | % | 35.27x | $ | 0.08 | 0.68 | % | 24.24 | % | $ | 269 | 18.34 | % | 18.11 | % | 1.35 | % | 0.36 | % | 1.85 | % | 0.36 | % | 1.85 | % | ||||||||||||||||||||||||||||||||||||||||||||||
| Medians |
$ | 12.05 | $ | 41.51 | $ | 0.26 | $ | 14.02 | 35.27x | 86.31 | % | 15.60 | % | 87.51 | % | 35.27x | $ | 0.08 | 0.68 | % | 24.24 | % | $ | 269 | 18.34 | % | 18.11 | % | 1.35 | % | 0.36 | % | 1.85 | % | 0.36 | % | 1.85 | % | ||||||||||||||||||||||||||||||||||||||||||||||
| Comparable Group |
||||||||||||||||||||||||||||||||||||||||||||||||||||||||||||||||||||||||||||||||||||
| BCTF |
Bancorp 34, Inc. | NM | $ | 12.37 | $ | 42.53 | $ | 0.19 | $ | 13.26 | NM | 93.26 | % | 14.08 | % | 93.95 | % | NM | $ | 0.00 | 0.00 | % | 0.00 | % | $ | 302 | 15.09 | % | 14.99 | % | 0.54 | % | 0.22 | % | 1.44 | % | 0.22 | % | 1.44 | % | ||||||||||||||||||||||||||||||||||||||||||||
| OTTW |
Ottawa Bancorp, Inc. | IL | $ | 11.73 | $ | 40.48 | $ | 0.33 | $ | 14.78 | 35.27x | 79.35 | % | 17.13 | % | 81.07 | % | 35.27x | $ | 0.16 | 1.36 | % | 48.48 | % | $ | 236 | 21.58 | % | 21.22 | % | 2.16 | % | 0.49 | % | 2.25 | % | 0.49 | % | 2.25 | % | ||||||||||||||||||||||||||||||||||||||||||||
| (1) | Core income, on a diluted per-share basis. Core income is net income after taxes and before extraordinary items, less net income attributable to noncontrolling interest, gain on the sale of securities, amortization of intangibles, goodwill and nonrecurring items. Assumed tax rate is 35%. |
| (2) | P/E = Price to earnings; P/B = Price to book; P/A = Price to assets; P/TB = Price to tangible book value; and P/Core = Price to core earnings. P/E and P/Core =NM if the ratio is negative or above 35x. |
| (3) | Indicated 12 month dividend, based on last quarterly dividend declared. |
| (4) | Indicated 12 month dividend as a percent of trailing 12 month earnings. |
| (5) | ROAA (return on average assets) and ROAE (return on average equity) are indicated ratios based on trailing 12 month earnings and average equity and assets balances. |
| (6) | Excludes from averages and medians those companies the subject of actual or rumored acquisition activities or unusual operating characteristics. |
| Source: | SNL Financial, LC. and RP Financial, LC. calculations. The information provided in this report has been obtained from sources we believe are reliable, but we cannot guarantee the accuracy or completeness of such information. |
Copyright (c) 2016 by RP® Financial, LC.
| RP® Financial, LC. | VALUATION ANALYSIS |
IV.17
of a Georgia savings institution. The recent acquisition activity may imply a certain degree of acquisition speculation for the Company’s stock. To the extent that acquisition speculation may impact the offering, we have largely taken this into account in selecting companies for the Peer Group which operate in markets that have experienced a comparable level of acquisition activity as the Bank’s market and, thus, are subject to the same type of acquisition speculation that may influence the Company’s stock. However, since converting thrifts are subject to a three-year regulatory moratorium from being acquired, acquisition speculation in the Company’s stock would tend to be less, compared to the stocks of the Peer Group companies. Furthermore, in comparison to the stocks of the fully-converted Peer Group companies, the degree of acquisition speculation in the Bank’s stock is also viewed to be relatively more limited since there are fewer potential acquirers for the Bank’s stock as a re-mutualization transaction can only be completed by a mutual institution or an institution in the MHC form of ownership. Additionally, there tends to be less acquisition speculation in the stocks of publicly-traded MHCs in general, given the majority of the shares are held by the MHC rather than public shareholders which own 100% of the stocks of the fully-converted Peer Group companies. Accordingly, the Peer Group companies are considered to be subject to a greater degree of acquisition speculation relative to the acquisition speculation that may influence Newton Federal’s trading price.
* * * * * * * * * * *
In determining our valuation adjustment for marketing of the issue, we considered trends in both the overall thrift market, the new issue market including the new issue market for MHC conversions and the local acquisition market for thrift stocks. Taking these factors and trends into account, RP Financial concluded that no valuation adjustment was appropriate in the valuation analysis for purposes of marketing of the issue.
| 8. | Management |
The Bank’s management team appears to have experience and expertise in all of the key areas of the Bank’s operations. Exhibit IV-5 provides summary resumes of the Newton Federal’s Board of Directors and senior management. The financial characteristics of the Bank suggest that the Board and senior management have been effective in pursuing an operating strategy that can be well managed by the Bank’s present organizational structure. The Bank currently does not have any senior management positions that are vacant.
| RP® Financial, LC. | VALUATION ANALYSIS |
IV.18
Similarly, the returns, equity positions, and other operating measures of the Peer Group companies are indicative of well-managed financial institutions, which have Boards and management teams that have been effective in implementing competitive operating strategies. Therefore, on balance, we concluded no valuation adjustment relative to the Peer Group was appropriate for this factor.
| 9. | Effect of Government Regulation and Regulatory Reform |
In summary, as a federally-insured savings institution operating in the MHC form of ownership, Newton Federal will be operating in substantially the same regulatory environment as the Peer Group members — all of whom are adequately capitalized institutions and are operating with no apparent restrictions. Exhibit IV-6 reflects the Bank’s pro forma regulatory capital ratios. Accordingly, no adjustment has been applied for the effect of government regulation and regulatory reform.
Summary of Adjustments
Overall, based on the factors discussed above, we concluded that the Bank’s pro forma market value should reflect the following valuation adjustments relative to the Peer Group:
Table 4.4
Newton Federal Bank
Valuation Adjustments
| Key Valuation Parameters: | Valuation Adjustment | |
| Financial Condition | No Adjustment | |
| Profitability, Growth and Viability of Earnings | Slight Downward | |
| Asset Growth | No Adjustment | |
| Primary Market Area | No Adjustment | |
| Dividends | Slight Downward | |
| Liquidity of the Shares | Slight Downward | |
| Marketing of the Issue | No Adjustment | |
| Management | No Adjustment | |
| Effect of Govt. Regulations and Regulatory Reform | No Adjustment |
Valuation Approaches
In applying the accepted valuation methodology utilized by the OCC, i.e., the pro forma market value approach, we considered the three key pricing ratios in valuing the Bank’s to-be-issued stock — price/earnings (“P/E”), price/book (“P/B”), and price/assets (“P/A”) approaches — all performed on a pro forma basis including the effects of the stock proceeds. In computing the
| RP® Financial, LC. | VALUATION ANALYSIS |
IV.19
pro forma impact of the conversion and the related pricing ratios, we have incorporated the valuation parameters disclosed in the Bank’s prospectus for the reinvestment rate, effective tax rate, stock benefit plan assumptions, and offering expenses (summarized in Exhibits IV-9 and IV-10). The assumptions utilized in the pro forma analysis in calculating the Company’s full conversion value were consistent with the assumptions utilized for the minority stock offering, except that expenses were adjusted for variable expenses based on the amount sold (summarized in Exhibits IV-7 and IV-8).
In our estimate of value, we assessed the relationship of the pro forma pricing ratios relative to the Peer Group, recent conversion offerings and publicly-traded MHCs on a fully-converted basis.
RP Financial’s valuation placed an emphasis on the following:
| • | P/E Approach. The P/E approach is generally the best indicator of long-term value for a stock. Given the similarities between the Company’s and the Peer Group’s earnings composition and overall financial condition, the P/E approach was carefully considered in this valuation. At the same time, recognizing that (1) the earnings multiples will be evaluated on a pro forma fully-converted basis for the Company; and (2) the Peer Group on average has had the opportunity to realize the benefit of reinvesting net conversion proceeds, we also gave weight to the other valuation approaches. |
| • | P/B Approach. P/B ratios have generally served as a useful benchmark in the valuation of thrift stocks, particularly in the context of an initial public offering, as the earnings approach involves assumptions regarding the use of proceeds. RP Financial considered the P/B approach to be a valuable indicator of pro forma value taking into account the pricing ratios under the P/E and P/A approaches. We have also modified the P/B approach to exclude the impact of intangible assets (i.e., price/tangible book value or “P/TB”), in that the investment community frequently makes this adjustment in its evaluation of this pricing approach. |
| • | P/A Approach. P/A ratios are generally a less reliable indicator of market value, as investors typically assign less weight to assets and attribute greater weight to book value and earnings. Furthermore, this approach as set forth in the regulatory valuation guidelines does not take into account the amount of stock purchases funded by deposit withdrawals, thus understating the pro forma P/A ratio. At the same time, the P/A ratio is an indicator of franchise value, and, in the case of highly capitalized institutions, high P/A ratios may limit the investment community’s willingness to pay market multiples for earnings or book value when ROE is expected to be low. |
| RP® Financial, LC. | VALUATION ANALYSIS |
IV.20
The Company will adopt “Employers’ Accounting for Employee Stock Ownership Plans” (“ASC 718-40”), which will cause earnings per share computations to be based on shares issued and outstanding excluding unreleased ESOP shares. For purposes of preparing the pro forma pricing analyses, we have reflected all shares issued in the offering, including all ESOP shares, to capture the full dilutive impact, particularly since the ESOP shares are economically dilutive, receive dividends and can be voted. However, we did consider the impact of ASC 718-40 in the valuation.
Based on the application of the three valuation approaches, taking into consideration the valuation adjustments discussed above, RP Financial concluded that as of November 25, 2016, the pro forma market value of the Company’s full conversion offering equaled $55,000,000 at the midpoint, equal to 5,500,000 shares at $10.00 per share. The $10.00 per share price was determined by the Newton Federal Board.
Basis of Valuation – Fully Converted Pricing Ratios
1. Price-to-Earnings (“P/E”). The application of the P/E valuation method requires calculating the Company’s pro forma market value by applying a valuation P/E multiple (fully-converted basis) to the pro forma earnings base. In applying this technique, we considered both reported earnings and a recurring earnings base, that is, earnings adjusted to exclude any one-time non-operating items, plus the estimated after-tax earnings benefit of the reinvestment of the net proceeds. The Bank reported net income of $1.157 million for the fiscal year ended September 30, 2016. In deriving Newton Federal’s core earnings, the adjustments made to reported earnings were to eliminate expense related to the separation of the former President and CEO in early 2016 ($251,000). As shown in the table below, on a tax-effected basis, assuming an effective marginal tax rate of 38% for the earnings adjustments, the Company’s core earnings were determined to equal $1.313 million for the fiscal year ended September 30, 2016.
| RP® Financial, LC. | VALUATION ANALYSIS |
IV.21
Table 4.5
Newton Federal Bank
Derivation of Core Earnings
| Amount | ||||
| ($000) | ||||
| Net Income |
$ | 1,157 | ||
| Addback: Expenses Related to CEO Separation |
251 | |||
| Tax Effect (1) |
(95 | ) | ||
|
|
|
|||
| Core Earnings Estimate |
$ | 1,313 | ||
| (1) | Tax effected at 38%. |
Based on the Company’s reported and estimated core earnings, and incorporating the impact of the pro forma assumptions discussed previously, the Company’s pro forma reported and core P/E multiples (fully-converted basis) at the $55.0 million midpoint value equaled 63.00 times and 53.47 times, respectively, indicating premiums of 226.8% and 143.7%, relative to the Peer Group’s average reported and core earnings multiples of 19.28 times and 21.94 times (see Table 4.6). In comparison to the Peer Group’s median reported and core earnings multiples of 17.92 times and 19.92 times, the Company’s pro forma reported and core P/E multiples (fully-converted basis) at the midpoint value indicated premiums of 251.6% and 168.4%, respectively. The Company’s pro forma P/E ratios (fully-converted basis) based on reported earnings at the minimum and the maximum, as adjusted equaled 51.12 times and 92.79 times, and based on core earnings at the minimum and the maximum, as adjusted equaled 43.69 times and 77.42 times, respectively.
On an MHC reported basis, the Company’s reported and core P/E multiples at the midpoint value of $55.0 million equaled 54.91 times and 47.52 times, respectively (see Table 4.7). The Company’s reported and core P/E multiples provided for premiums of 184.8% and 116.6% relative to the Peer Group’s average reported and core P/E multiples of 19.28 times and 21.94 times, respectively. In comparison to the Peer Group’s median reported and core earnings multiples which equaled 17.92 times and 19.92 times, respectively, the Company’s pro forma reported and core P/E multiples (MHC basis) at the midpoint value indicated premiums of 206.4% and 138.6%, respectively. The Company’s pro forma reported P/E ratios (MHC basis) at the minimum and the super maximum equaled 45.67 times and 76.22 times, respectively. The Company’s pro forma core P/E ratios (MHC basis) at the minimum and the super maximum equaled 39.64 times and 65.53 times, respectively.
| RP® Financial, LC. | VALUATION ANALYSIS |
IV.22
Table 4.6
Fully Converted Market Pricing Versus Peer Group
Community First Bancshares, Inc.
As of November 25, 2016
| Market | Per Share Data | |||||||||||||||||||||||||||||||||||||||||||||||||||||||||||||||||||||||||||||||||||||
| Capitalization | Core | Book | Dividends(4) | Financial Characteristics(6) | ||||||||||||||||||||||||||||||||||||||||||||||||||||||||||||||||||||||||||||||||||
| Price/ | Market | 12 Month | Value/ | Pricing Ratios(3) | Amount/ | Payout | Total | Equity/ | Tang. Eq./ | NPAs/ | Reported | Core | ||||||||||||||||||||||||||||||||||||||||||||||||||||||||||||||||||||||||||
| Share(1) | Value | EPS(2) | Share | P/E | P/B | P/A | P/TB | P/Core | Share | Yield | Ratio(5) | Assets | Assets | T. Assets | Assets | ROAA | ROAE | ROAA | ROAE | |||||||||||||||||||||||||||||||||||||||||||||||||||||||||||||||||||
| ($) | ($Mil) | ($) | ($) | (x) | (%) | (%) | (%) | (x) | ($) | (%) | (%) | ($Mil) | (%) | (%) | (%) | (%) | (%) | (%) | (%) | |||||||||||||||||||||||||||||||||||||||||||||||||||||||||||||||||||
| Community First Bancshares, Inc. |
||||||||||||||||||||||||||||||||||||||||||||||||||||||||||||||||||||||||||||||||||||||
| Supermaximum |
$ | 10.00 | $ | 72.74 | $ | 0.13 | $ | 14.76 | 92.79x | 67.75 | % | 24.65 | % | 67.75 | % | 77.42x | $ | 0.00 | 0.00 | % | 0.00 | % | $ | 295 | 36.38 | % | 36.38 | % | 1.10 | % | 0.27 | % | 0.73 | % | 0.32 | % | 0.88 | % | ||||||||||||||||||||||||||||||||||||||||||||||||
| Maximum |
$ | 10.00 | $ | 63.25 | $ | 0.16 | $ | 15.66 | 76.06x | 63.86 | % | 22.05 | % | 63.86 | % | 64.07x | $ | 0.00 | 0.00 | % | 0.00 | % | $ | 287 | 34.54 | % | 34.54 | % | 1.13 | % | 0.29 | % | 0.84 | % | 0.34 | % | 1.00 | % | ||||||||||||||||||||||||||||||||||||||||||||||||
| Midpoint |
$ | 10.00 | $ | 55.00 | $ | 0.19 | $ | 16.71 | 63.00x | 59.84 | % | 19.67 | % | 59.84 | % | 53.47x | $ | 0.00 | 0.00 | % | 0.00 | % | $ | 280 | 32.86 | % | 32.86 | % | 1.16 | % | 0.31 | % | 0.95 | % | 0.37 | % | 1.12 | % | ||||||||||||||||||||||||||||||||||||||||||||||||
| Minimum |
$ | 10.00 | $ | 46.75 | $ | 0.23 | $ | 18.12 | 51.12x | 55.19 | % | 17.16 | % | 55.19 | % | 43.69x | $ | 0.00 | 0.00 | % | 0.00 | % | $ | 272 | 31.09 | % | 31.09 | % | 1.19 | % | 0.34 | % | 1.08 | % | 0.39 | % | 1.26 | % | ||||||||||||||||||||||||||||||||||||||||||||||||
| All Non-MHC Public Companies(6) |
||||||||||||||||||||||||||||||||||||||||||||||||||||||||||||||||||||||||||||||||||||||
| Averages |
$ | 20.55 | $ | 530.90 | $ | 1.05 | $ | 15.78 | 18.80x | 123.90 | % | 15.20 | % | 134.09 | % | 19.59x | $ | 0.31 | 1.49 | % | 49.23 | % | $ | 3,069 | 12.71 | % | 12.15 | % | 1.13 | % | 0.71 | % | 5.98 | % | 0.73 | % | 6.11 | % | ||||||||||||||||||||||||||||||||||||||||||||||||
| Median |
$ | 16.33 | $ | 132.28 | $ | 0.78 | $ | 14.42 | 18.77x | 121.48 | % | 14.66 | % | 127.40 | % | 19.15x | $ | 0.24 | 1.43 | % | 39.21 | % | $ | 937 | 11.50 | % | 11.12 | % | 0.88 | % | 0.62 | % | 5.34 | % | 0.64 | % | 5.14 | % | ||||||||||||||||||||||||||||||||||||||||||||||||
| Comparable Group |
||||||||||||||||||||||||||||||||||||||||||||||||||||||||||||||||||||||||||||||||||||||
| Averages |
$ | 19.16 | $ | 66.83 | $ | 0.75 | $ | 19.29 | 19.28x | 99.32 | % | 15.84 | % | 100.73 | % | 21.94x | $ | 0.21 | 1.02 | % | 42.97 | % | $ | 419 | 15.88 | % | 15.72 | % | 1.72 | % | 0.57 | % | 3.59 | % | 0.55 | % | 3.48 | % | ||||||||||||||||||||||||||||||||||||||||||||||||
| Medians |
$ | 17.58 | $ | 65.82 | $ | 0.48 | $ | 17.81 | 17.92x | 98.00 | % | 15.61 | % | 99.99 | % | 19.92x | $ | 0.20 | 1.10 | % | 40.03 | % | $ | 435 | 15.73 | % | 15.50 | % | 1.55 | % | 0.48 | % | 2.84 | % | 0.50 | % | 3.08 | % | ||||||||||||||||||||||||||||||||||||||||||||||||
| State of GA (6) |
||||||||||||||||||||||||||||||||||||||||||||||||||||||||||||||||||||||||||||||||||||||
| CHFN |
Charter Financial Corporation | GA | $ | 14.47 | $ | 217.50 | $ | 0.86 | $ | 13.52 | 18.32x | 107.06 | % | 15.07 | % | 127.40 | % | 16.80x | $ | 0.22 | 1.52 | % | 25.95 | % | $ | 1,443 | 14.08 | % | 12.10 | % | 0.76 | % | 0.98 | % | 5.90 | % | 1.07 | % | 6.43 | % | ||||||||||||||||||||||||||||||||||||||||||||||
| Comparable Group |
||||||||||||||||||||||||||||||||||||||||||||||||||||||||||||||||||||||||||||||||||||||
| ANCB |
Anchor Bancorp | WA | $ | 25.40 | $ | 63.63 | $ | 0.29 | $ | 25.46 | NM | 99.77 | % | 14.60 | % | 99.77 | % | NM | NA | NA | NA | $ | 436 | 14.63 | % | 14.63 | % | NA | 0.17 | % | 1.14 | % | 0.17 | % | 1.14 | % | ||||||||||||||||||||||||||||||||||||||||||||||||||
| EQFN |
Equitable Financial Corp. | NE | $ | 9.10 | $ | 31.64 | $ | 0.32 | $ | 10.43 | 29.35x | 87.24 | % | 13.89 | % | 87.24 | % | 28.58x | NA | NA | NA | $ | 228 | 15.92 | % | 15.92 | % | NA | 0.46 | % | 3.00 | % | 0.47 | % | 3.08 | % | ||||||||||||||||||||||||||||||||||||||||||||||||||
| IROQ |
IF Bancorp, Inc. | IL | $ | 19.35 | $ | 76.44 | $ | 0.98 | $ | 21.12 | 17.92x | 91.60 | % | 13.04 | % | 91.60 | % | 19.77x | $ | 0.16 | 0.83 | % | 14.81 | % | $ | 589 | 14.23 | % | 14.23 | % | 0.82 | % | 0.70 | % | 4.93 | % | 0.64 | % | 4.46 | % | ||||||||||||||||||||||||||||||||||||||||||||||
| JXSB |
Jacksonville Bancorp, Inc. | IL | $ | 29.26 | $ | 52.63 | $ | 1.57 | $ | 26.84 | 17.21x | 109.00 | % | 15.91 | % | 115.53 | % | 18.58x | $ | 0.40 | 1.37 | % | 81.18 | % | $ | 331 | 14.60 | % | 13.89 | % | 1.33 | % | 0.99 | % | 6.53 | % | 0.92 | % | 6.05 | % | ||||||||||||||||||||||||||||||||||||||||||||||
| MELR |
Melrose Bancorp, Inc. | MA | $ | 15.91 | $ | 41.39 | $ | 0.28 | $ | 16.61 | NM | 95.77 | % | 15.54 | % | 95.77 | % | NM | NA | NA | NA | $ | 267 | 16.23 | % | 16.23 | % | 0.00 | % | 0.42 | % | 2.26 | % | 0.29 | % | 1.55 | % | |||||||||||||||||||||||||||||||||||||||||||||||||
| MSBF |
MSB Financial Corp. | NJ | $ | 13.70 | $ | 78.24 | $ | 0.12 | $ | 12.71 | NM | 107.81 | % | 18.04 | % | 107.81 | % | NM | $ | 0.00 | 0.00 | % | NA | $ | 434 | 16.74 | % | 16.74 | % | 3.53 | % | 0.18 | % | 0.90 | % | 0.26 | % | 1.34 | % | |||||||||||||||||||||||||||||||||||||||||||||||
| PBSK |
Poage Bankshares, Inc. | KY | $ | 18.95 | $ | 70.37 | $ | 0.60 | $ | 18.78 | NM | 100.89 | % | 15.68 | % | 104.44 | % | 31.57x | $ | 0.32 | 1.69 | % | 53.85 | % | $ | 449 | 15.54 | % | 15.09 | % | 1.78 | % | 0.43 | % | 2.68 | % | 0.50 | % | 3.08 | % | ||||||||||||||||||||||||||||||||||||||||||||||
| PBIP |
Prudential Bancorp, Inc. | PA | $ | 15.81 | $ | 127.20 | $ | 0.35 | $ | 14.17 | NM | 111.58 | % | 22.74 | % | 111.58 | % | NM | $ | 0.12 | 0.76 | % | 33.33 | % | $ | 559 | 20.38 | % | 20.38 | % | 3.39 | % | 0.51 | % | 2.36 | % | 0.49 | % | 2.29 | % | ||||||||||||||||||||||||||||||||||||||||||||||
| UCBA |
United Community Bancorp | IN | $ | 16.20 | $ | 68.01 | $ | 0.81 | $ | 16.83 | 18.84x | 96.23 | % | 12.88 | % | 100.20 | % | 20.07x | $ | 0.24 | 1.48 | % | 27.91 | % | $ | 528 | 13.38 | % | 12.92 | % | 1.02 | % | 0.68 | % | 5.14 | % | 0.63 | % | 4.83 | % | ||||||||||||||||||||||||||||||||||||||||||||||
| WBKC |
Wolverine Bancorp, Inc. | MI | $ | 27.97 | $ | 58.70 | $ | 2.14 | $ | 29.97 | 13.07x | 93.33 | % | 16.05 | % | 93.33 | % | 13.07x | NA | NA | 46.73 | % | $ | 369 | 17.20 | % | 17.20 | % | 1.92 | % | 1.13 | % | 7.00 | % | 1.13 | % | 7.00 | % | ||||||||||||||||||||||||||||||||||||||||||||||||
| (1) | Core income, on a diluted per-share basis. Core income is net income after taxes and before extraordinary items, less net income attributable to noncontrolling interest, gain on the sale of securities, amortization of intangibles, goodwill and nonrecurring items. Assumed tax rate is 35%. |
| (2) | P/E = Price to earnings; P/B = Price to book; P/A = Price to assets; P/TB = Price to tangible book value; and P/Core = Price to core earnings. P/E and P/Core =NM if the ratio is negative or above 35x. |
| (3) | Indicated 12 month dividend, based on last quarterly dividend declared. |
| (4) | Indicated 12 month dividend as a percent of trailing 12 month earnings. |
| (5) | ROAA (return on average assets) and ROAE (return on average equity) are indicated ratios based on trailing 12 month earnings and average equity and assets balances. |
| (6) | Excludes from averages and medians those companies the subject of actual or rumored acquisition activities or unusual operating characteristics. |
| Source: | SNL Financial, LC. and RP Financial, LC. calculations. The information provided in this report has been obtained from sources we believe are reliable, but we cannot guarantee the accuracy or completeness of such information. |
Copyright (c) 2016 by RP® Financial, LC.
| RP® Financial, LC. | VALUATION ANALYSIS |
IV.23
Table 4.7
MHC Market Pricing Versus Peer Group
Community First Bancshares, Inc.
As of November 25, 2016
| Market | Per Share Data | |||||||||||||||||||||||||||||||||||||||||||||||||||||||||||||||||||||||||||||||||||||
| Capitalization | Core | Book | Dividends(4) | Financial Characteristics(6) | ||||||||||||||||||||||||||||||||||||||||||||||||||||||||||||||||||||||||||||||||||
| Price/ | Market | 12 Month | Value/ | Pricing Ratios(3) | Amount/ | Payout | Total | Equity/ | Tang. Eq./ | NPAs/ | Reported | Core | ||||||||||||||||||||||||||||||||||||||||||||||||||||||||||||||||||||||||||
| Share(1) | Value | EPS(2) | Share | P/E | P/B | P/A | P/TB | P/Core | Share | Yield | Ratio(5) | Assets | Assets | T. Assets | Assets | ROAA | ROAE | ROAA | ROAE | |||||||||||||||||||||||||||||||||||||||||||||||||||||||||||||||||||
| ($) | ($Mil) | ($) | ($) | (x) | (%) | (%) | (%) | (x) | ($) | (%) | (%) | ($Mil) | (%) | (%) | (%) | (%) | (%) | (%) | (%) | |||||||||||||||||||||||||||||||||||||||||||||||||||||||||||||||||||
| Community First Bancshares, Inc. |
||||||||||||||||||||||||||||||||||||||||||||||||||||||||||||||||||||||||||||||||||||||
| Supermaximum |
$ | 10.00 | $ | 72.74 | $ | 0.13 | $ | 10.01 | 76.22x | 99.95 | % | 27.92 | % | 99.95 | % | 65.53x | $ | 0.00 | 0.00 | % | 0.00 | % | $ | 261 | 27.93 | % | 27.93 | % | 1.24 | % | 0.37 | % | 1.31 | % | 0.43 | % | 1.53 | % | ||||||||||||||||||||||||||||||||||||||||||||||||
| Maximum |
$ | 10.00 | $ | 63.25 | $ | 0.15 | $ | 10.91 | 64.56x | 91.65 | % | 24.63 | % | 91.65 | % | 55.71x | $ | 0.00 | 0.00 | % | 0.00 | % | $ | 257 | 26.88 | % | 26.88 | % | 1.26 | % | 0.38 | % | 1.42 | % | 0.44 | % | 1.65 | % | ||||||||||||||||||||||||||||||||||||||||||||||||
| Midpoint |
$ | 10.00 | $ | 55.00 | $ | 0.18 | $ | 11.95 | 54.91x | 83.67 | % | 21.70 | % | 83.67 | % | 47.52x | $ | 0.00 | 0.00 | % | 0.00 | % | $ | 253 | 25.93 | % | 25.93 | % | 1.28 | % | 0.40 | % | 1.52 | % | 0.46 | % | 1.76 | % | ||||||||||||||||||||||||||||||||||||||||||||||||
| Minimum |
$ | 10.00 | $ | 46.75 | $ | 0.22 | $ | 13.36 | 45.67x | 74.85 | % | 18.68 | % | 74.85 | % | 39.64x | $ | 0.00 | 0.00 | % | 0.00 | % | $ | 250 | 24.96 | % | 24.96 | % | 1.30 | % | 0.41 | % | 1.64 | % | 0.47 | % | 1.89 | % | ||||||||||||||||||||||||||||||||||||||||||||||||
| All Non-MHC Public Companies(6) |
||||||||||||||||||||||||||||||||||||||||||||||||||||||||||||||||||||||||||||||||||||||
| Averages |
$ | 20.55 | $ | 530.90 | $ | 1.05 | $ | 15.78 | 18.80x | 123.90 | % | 15.20 | % | 134.09 | % | 19.59x | $ | 0.31 | 1.49 | % | 49.23 | % | $ | 3,069 | 12.71 | % | 12.15 | % | 1.13 | % | 0.71 | % | 5.98 | % | 0.73 | % | 6.11 | % | ||||||||||||||||||||||||||||||||||||||||||||||||
| Median |
$ | 16.33 | $ | 132.28 | $ | 0.78 | $ | 14.42 | 18.77x | 121.48 | % | 14.66 | % | 127.40 | % | 19.15x | $ | 0.24 | 1.43 | % | 39.21 | % | $ | 937 | 11.50 | % | 11.12 | % | 0.88 | % | 0.62 | % | 5.34 | % | 0.64 | % | 5.14 | % | ||||||||||||||||||||||||||||||||||||||||||||||||
| Comparable Group |
||||||||||||||||||||||||||||||||||||||||||||||||||||||||||||||||||||||||||||||||||||||
| Averages |
$ | 19.16 | $ | 66.83 | $ | 0.75 | $ | 19.29 | 19.28x | 99.32 | % | 15.84 | % | 100.73 | % | 21.94x | $ | 0.21 | 1.02 | % | 42.97 | % | $ | 419 | 15.88 | % | 15.72 | % | 1.72 | % | 0.57 | % | 3.59 | % | 0.55 | % | 3.48 | % | ||||||||||||||||||||||||||||||||||||||||||||||||
| Medians |
$ | 17.58 | $ | 65.82 | $ | 0.48 | $ | 17.81 | 17.92x | 98.00 | % | 15.61 | % | 99.99 | % | 19.92x | $ | 0.20 | 1.10 | % | 40.03 | % | $ | 435 | 15.73 | % | 15.50 | % | 1.55 | % | 0.48 | % | 2.84 | % | 0.50 | % | 3.08 | % | ||||||||||||||||||||||||||||||||||||||||||||||||
| State of GA (6) |
||||||||||||||||||||||||||||||||||||||||||||||||||||||||||||||||||||||||||||||||||||||
| CHFN |
Charter Financial Corporation | GA | $ | 14.47 | $ | 217.50 | $ | 0.86 | $ | 13.52 | 18.32x | 107.06 | % | 15.07 | % | 127.40 | % | 16.80x | $ | 0.22 | 1.52 | % | 25.95 | % | $ | 1,443 | 14.08 | % | 12.10 | % | 0.76 | % | 0.98 | % | 5.90 | % | 1.07 | % | 6.43 | % | ||||||||||||||||||||||||||||||||||||||||||||||
| Comparable Group |
||||||||||||||||||||||||||||||||||||||||||||||||||||||||||||||||||||||||||||||||||||||
| ANCB |
Anchor Bancorp | WA | $ | 25.40 | $ | 63.63 | $ | 0.29 | $ | 25.46 | NM | 99.77 | % | 14.60 | % | 99.77 | % | NM | NA | NA | NA | $ | 436 | 14.63 | % | 14.63 | % | NA | 0.17 | % | 1.14 | % | 0.17 | % | 1.14 | % | ||||||||||||||||||||||||||||||||||||||||||||||||||
| EQFN |
Equitable Financial Corp. | NE | $ | 9.10 | $ | 31.64 | $ | 0.32 | $ | 10.43 | 29.35x | 87.24 | % | 13.89 | % | 87.24 | % | 28.58x | NA | NA | NA | $ | 228 | 15.92 | % | 15.92 | % | NA | 0.46 | % | 3.00 | % | 0.47 | % | 3.08 | % | ||||||||||||||||||||||||||||||||||||||||||||||||||
| IROQ |
IF Bancorp, Inc. | IL | $ | 19.35 | $ | 76.44 | $ | 0.98 | $ | 21.12 | 17.92x | 91.60 | % | 13.04 | % | 91.60 | % | 19.77x | $ | 0.16 | 0.83 | % | 14.81 | % | $ | 589 | 14.23 | % | 14.23 | % | 0.82 | % | 0.70 | % | 4.93 | % | 0.64 | % | 4.46 | % | ||||||||||||||||||||||||||||||||||||||||||||||
| JXSB |
Jacksonville Bancorp, Inc. | IL | $ | 29.26 | $ | 52.63 | $ | 1.57 | $ | 26.84 | 17.21x | 109.00 | % | 15.91 | % | 115.53 | % | 18.58x | $ | 0.40 | 1.37 | % | 81.18 | % | $ | 331 | 14.60 | % | 13.89 | % | 1.33 | % | 0.99 | % | 6.53 | % | 0.92 | % | 6.05 | % | ||||||||||||||||||||||||||||||||||||||||||||||
| MELR |
Melrose Bancorp, Inc. | MA | $ | 15.91 | $ | 41.39 | $ | 0.28 | $ | 16.61 | NM | 95.77 | % | 15.54 | % | 95.77 | % | NM | NA | NA | NA | $ | 267 | 16.23 | % | 16.23 | % | 0.00 | % | 0.42 | % | 2.26 | % | 0.29 | % | 1.55 | % | |||||||||||||||||||||||||||||||||||||||||||||||||
| MSBF |
MSB Financial Corp. | NJ | $ | 13.70 | $ | 78.24 | $ | 0.12 | $ | 12.71 | NM | 107.81 | % | 18.04 | % | 107.81 | % | NM | $ | 0.00 | 0.00 | % | NA | $ | 434 | 16.74 | % | 16.74 | % | 3.53 | % | 0.18 | % | 0.90 | % | 0.26 | % | 1.34 | % | |||||||||||||||||||||||||||||||||||||||||||||||
| PBSK |
Poage Bankshares, Inc. | KY | $ | 18.95 | $ | 70.37 | $ | 0.60 | $ | 18.78 | NM | 100.89 | % | 15.68 | % | 104.44 | % | 31.57x | $ | 0.32 | 1.69 | % | 53.85 | % | $ | 449 | 15.54 | % | 15.09 | % | 1.78 | % | 0.43 | % | 2.68 | % | 0.50 | % | 3.08 | % | ||||||||||||||||||||||||||||||||||||||||||||||
| PBIP |
Prudential Bancorp, Inc. | PA | $ | 15.81 | $ | 127.20 | $ | 0.35 | $ | 14.17 | NM | 111.58 | % | 22.74 | % | 111.58 | % | NM | $ | 0.12 | 0.76 | % | 33.33 | % | $ | 559 | 20.38 | % | 20.38 | % | 3.39 | % | 0.51 | % | 2.36 | % | 0.49 | % | 2.29 | % | ||||||||||||||||||||||||||||||||||||||||||||||
| UCBA |
United Community Bancorp | IN | $ | 16.20 | $ | 68.01 | $ | 0.81 | $ | 16.83 | 18.84x | 96.23 | % | 12.88 | % | 100.20 | % | 20.07x | $ | 0.24 | 1.48 | % | 27.91 | % | $ | 528 | 13.38 | % | 12.92 | % | 1.02 | % | 0.68 | % | 5.14 | % | 0.63 | % | 4.83 | % | ||||||||||||||||||||||||||||||||||||||||||||||
| WBKC |
Wolverine Bancorp, Inc. | MI | $ | 27.97 | $ | 58.70 | $ | 2.14 | $ | 29.97 | 13.07x | 93.33 | % | 16.05 | % | 93.33 | % | 13.07x | NA | NA | 46.73 | % | $ | 369 | 17.20 | % | 17.20 | % | 1.92 | % | 1.13 | % | 7.00 | % | 1.13 | % | 7.00 | % | ||||||||||||||||||||||||||||||||||||||||||||||||
| (1) | Core income, on a diluted per-share basis. Core income is net income after taxes and before extraordinary items, less net income attributable to noncontrolling interest, gain on the sale of securities, amortization of intangibles, goodwill and nonrecurring items. Assumed tax rate is 35%. |
| (2) | P/E = Price to earnings; P/B = Price to book; P/A = Price to assets; P/TB = Price to tangible book value; and P/Core = Price to core earnings. P/E and P/Core =NM if the ratio is negative or above 35x. |
| (3) | Indicated 12 month dividend, based on last quarterly dividend declared. |
| (4) | Indicated 12 month dividend as a percent of trailing 12 month earnings. |
| (5) | ROAA (return on average assets) and ROAE (return on average equity) are indicated ratios based on trailing 12 month earnings and average equity and assets balances. |
| (6) | Excludes from averages and medians those companies the subject of actual or rumored acquisition activities or unusual operating characteristics. |
| Source: | SNL Financial, LC. and RP Financial, LC. calculations. The information provided in this report has been obtained from sources we believe are reliable, but we cannot guarantee the accuracy or completeness of such information. |
Copyright (c) 2016 by RP® Financial, LC.
| RP® Financial, LC. | VALUATION ANALYSIS |
IV.24
2. Price-to-Book (“P/B”). The application of the P/B valuation method requires calculating the Company’s pro forma market value by applying a valuation P/B ratio, as derived from the Peer Group’s P/B ratio, to the Company’s pro forma book value (fully-converted basis). Based on the $55.0 million midpoint valuation, the Company’s pro forma P/B and P/TB ratios (fully-converted basis) both equaled 59.84% (see Table 4.6). In comparison to the average P/B and P/TB ratios for the Peer Group of 99.32% and 100.73%, respectively, the Company’s ratios reflected a discount of 39.8% on a P/B basis and a discount of 40.6% on a P/TB basis. In comparison to the Peer Group’s median P/B and P/TB ratios of 98.00% and 99.99%, respectively, the Company’s pro forma P/B and P/TB ratios (fully-converted basis) at the midpoint value reflected discounts of 38.9% and 40.2%, respectively. At the top of the super range or supermaximum, the Company’s P/B and P/TB ratios (fully-converted basis) both equaled 67.75%. In comparison to the Peer Group’s average P/B and P/TB ratios, the Bank’s P/B and P/TB ratios at the top of the super range reflected discounts of 31.8% and 32.7%, respectively. In comparison to the Peer Group’s median P/B and P/TB ratios, the Company’s P/B and P/TB ratios at the top of the super range reflected discounts of 30.9% and 32.2%, respectively. RP Financial considered the discounts under the P/B approach to be reasonable, given the nature of the calculation of the P/B ratio, which mathematically results in a ratio discounted to book value, along with consideration of the Company’s higher pro forma equity ratio and in consideration of the trading of recent conversions.
On an MHC reported basis, the Company’s P/B and P/TB ratios at the $55.0 million midpoint value both equaled 83.67% (see Table 4.7). In comparison to the average P/B and P/TB ratios indicated for the Peer Group of 99.32% and 100.73%, respectively, the Company’s ratios were discounted by 15.8% on a P/B basis and 16.9% on a P/TB basis. In comparison to the Peer Group’s median P/B and P/TB ratios of 98.00% and 99.99%, respectively, the Company’s pro forma P/B and P/TB ratios (MHC basis) at the midpoint value reflected discounts of 14.6% and 16.3%, respectively. At the top of the super range, the Company’s P/B and P/TB ratios (MHC basis) both equaled 99.95%. In comparison to the Peer Group’s average P/B and P/TB ratios, the Company’s P/B and P/TB ratios at the top of the super range reflected a premium of 0.6% and a discount of 0.8%, respectively. In comparison to the Peer Group’s median P/B and P/TB ratios, the Company’s P/B and P/TB ratios at the top of the super range reflected a premium of 2.0% and a discount of 0.04%, respectively.
| RP® Financial, LC. | VALUATION ANALYSIS |
IV.25
3. Price-to-Assets (“P/A”). The P/A valuation methodology determines market value by applying a valuation P/A ratio (fully-converted basis) to the Company’s pro forma asset base, conservatively assuming no deposit withdrawals are made to fund stock purchases. In all likelihood there will be deposit withdrawals, which results in understating the pro forma P/A ratio, which is computed herein. At the $55.0 million midpoint of the valuation range, the Company’s pro forma P/A ratio (fully-converted basis) equaled 19.67% of pro forma assets. Comparatively, the Peer Group companies exhibited an average P/A ratio of 15.84%, which implies a premium of 24.2% has been applied to the Company’s pro forma P/A ratio. In comparison to the Peer Group’s median P/A ratio of 15.61%, the Bank’s pro forma P/A ratio (fully-converted basis) at the midpoint value reflects a premium of 26.0%.
On an MHC reported basis, the Company’s pro forma P/A ratio at the $55.0 million midpoint value equaled 21.70% (see Table 4.7). In comparison to the Peer Group’s average P/A ratio of 15.84%, the Company’s P/A ratio (MHC basis) indicated a premium of 36.99%. In comparison to the Peer Group’s median P/A ratio of 15.61%, the Company’s pro forma P/A ratio (MHC basis) at the midpoint value reflects a premium of 39.01%.
Comparison to Publicly-Traded MHCs
As indicated in Chapter III, we believe there are a number of characteristics of MHC shares that make them different from the shares of fully-converted companies. These factors include: (1) lower aftermarket liquidity in the MHC shares since less than 50% of the shares are available for trading; (2) no opportunity for public shareholders to exercise voting control; (3) the potential pro forma impact of second-step conversions on the pricing of MHC institutions; and (4) the regulatory policies regarding the accounting for net assets and/or waived dividends held by the MHC in a second-step conversion and, thereby, lessening the attractiveness of paying cash dividends. The above characteristics of MHC shares have provided MHC stocks with different trading characteristics versus fully-converted companies. To account for the unique trading characteristics of MHC shares, RP Financial has placed the financial data and pricing ratios of the publicly-traded MHCs and the MHCs listed on the Over-the-Counter Bulletin Board (“OTCBB”) on a fully-converted basis to make them comparable for valuation purposes. We feel that examining the OTCBB MHCs is also useful as Newton Federal shares more characteristics to those companies than the publicly-traded companies in terms of asset size, market capitalization, resources, etc.
| RP® Financial, LC. | VALUATION ANALYSIS |
IV.26
Using the per share and pricing information of the publicly-traded and OTC MHCs on a fully-converted basis accomplishes a number of objectives. First, such figures eliminate distortions that result when trying to compare institutions that have different public ownership interests outstanding. Secondly, such an analysis provides ratios that are comparable to the pricing information of fully-converted public companies and are directly applicable to determining the pro forma market value range of the 100% ownership interest in the Company as an MHC. This technique is validated by the investment community’s evaluation of MHC pricing, which also incorporates the pro forma impact of a second-step conversion based on the current market price.
To calculate the fully-converted pricing information for MHCs, the reported financial information for the public MHCs incorporate the following assumptions: (1) all shares owned by the MHC are assumed to be sold at the current trading price in a second step-conversion; (2) the gross proceeds from such a sale are adjusted to reflect reasonable offering expenses and standard stock based benefit plan parameters that would be factored into a second-step conversion of an MHC institution; and (3) net proceeds are assumed to be reinvested at market rates on a tax effected basis. Book value per share and earnings per share figures for the public MHCs were adjusted by the impact of the assumed second step-conversion, resulting in an estimation of book value per share and earnings per share figures on a fully-converted basis. Table 4.8 on the following pages shows the calculation of per share financial data (fully-converted basis) for each of the eight publicly-traded MHC institutions and the 18 OTCBB-listed MHCs, which have not announced plans to complete a second-step conversion offering.
Table 4.9 below shows a comparative pricing analysis of the publicly-traded MHCs and the OTCBB MHCs on a fully-converted basis versus the Company’s Peer Group. In comparison to the Peer Group’s average P/TB ratio, the P/TB ratio of the publicly-traded MHCs reflected a discount of 10.23%. In comparison to the Peer Group’s P/E multiple, the average P/E multiple of the publicly-traded MHCs reflected a premium of 7.2%, while the OTC MHCs P/E multiple indicated a discount of 5.4%. In comparison to the publicly-traded MHCs, the Company’s pro forma P/TB ratio (fully-converted basis) of 59.84% at the midpoint of the valuation range reflected a discount of 33.8%, and reflected a discount of 8.3% to the average of the OTCBB MHCs. At the top of the super range, the Company’s P/TB ratio (fully-converted basis) of 67.75% reflected a discount of 25.1% to the average of the publicly-traded MHCs, and a premium of 3.8% to the average of the OTCBB MHCs.
| RP® Financial, LC. | VALUATION ANALYSIS |
IV.27
Table 4.8
MHC Institutions, Implied Pricing Ratios, Full Conversion Basis
Financial Data as of the Most Recent Quarter or Twelve Month Period Available
Prices as of November 25, 2016
| Key Financial Data(2) | ||||||||||||||||||||||||||||||||||||||||||||||||||||||||||||
| Per Share Data | Pricing Ratios(2) |
Dividends | LTM | |||||||||||||||||||||||||||||||||||||||||||||||||||||||||
| Stock | Mkt | LTM | Tang. | P/E | Price/ | Price/ | Price/ | Ann Div | Div. | Div Pay | Total | Tang. | Reported | |||||||||||||||||||||||||||||||||||||||||||||||
| Ticker |
Company Name |
City |
State |
Exchange |
Price(1) | Value | EPS | BV/Sh |
LTM |
Book | TBk |
Assts | Rate | Yield | Ratio |
Assets | E/A |
ROAA | ROAE | |||||||||||||||||||||||||||||||||||||||||
| ($) | ($M) | ($) | ($) | (x) | (%) | (%) | (%) | ($) | (%) | (%) | ($000) | (%) | (%) | (%) | ||||||||||||||||||||||||||||||||||||||||||||||
| Publicly Traded MHCs, Full Conversion Basis—Averages |
16.70 | 835.4 | 0.60 | 18.46 | 20.66 | 88.45 | 90.43 | 20.83 | 0.25 | 1.60 | 53.98 | 2,884,449 | 23.09 | 0.69 | 3.05 | |||||||||||||||||||||||||||||||||||||||||||||
| Publicly Traded MHCs, Full Conversion Basis—Medians |
18.39 | 149.1 | 0.58 | 19.00 | 19.98 | 85.94 | 87.44 | 21.19 | 0.33 | 1.78 | 33.94 | 729,735 | 23.12 | 0.77 | 2.94 | |||||||||||||||||||||||||||||||||||||||||||||
| OTC MHCs, Full Conversion Basis—Averages |
10.72 | 25.71 | 0.55 | 16.96 | 18.24 | 62.20 | 65.27 | 11.41 | 0.24 | 4.90 | 20.91 | 261,313 | 18.14 | 0.46 | 2.55 | |||||||||||||||||||||||||||||||||||||||||||||
| OTC MHCs, Full Conversion Basis—Medians |
9.46 | 18.18 | 0.50 | 15.70 | 19.53 | 62.10 | 63.25 | 10.82 | 0.12 | 1.10 | 22.44 | 173,822 | 17.68 | 0.46 | 2.81 | |||||||||||||||||||||||||||||||||||||||||||||
| Publicly Traded MHCs, Full Conversion Basis |
||||||||||||||||||||||||||||||||||||||||||||||||||||||||||||
| 1 | GCBC |
Greene County Bancorp, Inc. (MHC) |
Catskill |
NY |
NASDAQ |
21.70 | 184.2 | 1.21 | 19.14 | 17.97 | 113.39 | 113.39 | 18.81 | 0.38 | 1.75 | 31.5 | 979,133 | 16.59 | 1.05 | 6.31 | ||||||||||||||||||||||||||||||||||||||||
| 2 | HONE |
HarborOne Bancorp, Inc. (MHC) |
Brockton |
MA |
NASDAQ |
19.62 | 630.2 | 0.24 | 18.86 | NM | 101.73 | 104.01 | 23.88 | 0.00 | 0.00 | 0.0 | 2,638,719 | 22.96 | 0.29 | 1.24 | ||||||||||||||||||||||||||||||||||||||||
| 3 | KFFB |
Kentucky First Federal Bancorp (MHC) |
Frankfort |
KY |
NASDAQ |
8.65 | 73.4 | 0.19 | 10.39 | NM | 71.48 | 83.25 | 22.22 | 0.40 | 4.62 | 206.8 | 330,280 | 26.69 | 0.50 | 1.60 | ||||||||||||||||||||||||||||||||||||||||
| 4 | LSBK |
Lake Shore Bancorp, Inc. (MHC) |
Dunkirk |
NY |
NASDAQ |
14.18 | 86.5 | 0.77 | 19.95 | 18.44 | 71.06 | 71.06 | 16.54 | 0.28 | 1.97 | 36.4 | 522,780 | 23.27 | 0.90 | 3.85 | ||||||||||||||||||||||||||||||||||||||||
| 5 | MGYR |
Magyar Bancorp, Inc. (MHC) |
New Brunswick |
NJ |
NASDAQ |
10.60 | 61.7 | 0.24 | 13.21 | NM | 80.23 | 80.23 | 10.06 | 0.00 | 0.00 | 0.0 | 613,552 | 12.53 | 0.23 | 1.83 | ||||||||||||||||||||||||||||||||||||||||
| 6 | OFED |
Oconee Federal Financial Corp. (MHC) |
Seneca |
SC |
NASDAQ |
22.05 | 127.8 | 1.02 | 27.76 | 21.53 | 77.83 | 79.43 | 22.69 | 0.40 | 1.81 | 39.1 | 563,182 | 28.56 | 1.05 | 3.62 | ||||||||||||||||||||||||||||||||||||||||
| 7 | PVBC |
Provident Bancorp, Inc. (MHC) |
Amesbury |
MA |
NASDAQ |
17.95 | 170.5 | 0.73 | 19.59 | 24.70 | 91.64 | 91.64 | 20.16 | 0.00 | 0.00 | 0.0 | 845,917 | 21.99 | 0.82 | 3.71 | ||||||||||||||||||||||||||||||||||||||||
| 8 | TFSL |
TFS Financial Corporation (MHC) |
Cleveland |
OH |
NASDAQ |
18.82 | 5,349.0 | 0.42 | 18.74 | NM | 100.24 | 100.42 | 32.26 | 0.50 | 2.66 | 118.1 | 16,582,031 | 32.12 | 0.73 | 2.25 | ||||||||||||||||||||||||||||||||||||||||
| OTC MHCs, Full Conversion Basis |
||||||||||||||||||||||||||||||||||||||||||||||||||||||||||||
| 9 | ABBB |
Auburn Bancorp, Inc. (MHC) |
Auburn |
ME |
OTC Pink |
9.40 | 4.7 | 0.66 | 17.50 | 14.16 | 53.71 | 53.71 | 6.47 | 0.00 | 0.00 | 0.0 | 73,143 | 12.04 | 0.46 | 3.79 | ||||||||||||||||||||||||||||||||||||||||
| 10 | BVFL |
BV Financial, Inc. (MHC) |
Baltimore |
MD |
OTC Pink |
6.70 | 20.1 | 0.00 | 10.94 | NM | 60.95 | 61.23 | 11.22 | 0.00 | 0.00 | 0.0 | 179,110 | 18.32 | 0.00 | 0.00 | ||||||||||||||||||||||||||||||||||||||||
| 11 | CNNB |
Cincinnati Bancorp (MHC) |
Cincinnati |
OH |
OTC Pink |
9.51 | 16.4 | 0.39 | 15.03 | 24.13 | 63.25 | 63.25 | 9.96 | 0.00 | 0.00 | 0.0 | 164,152 | 15.75 | 0.41 | 2.62 | ||||||||||||||||||||||||||||||||||||||||
| 12 | CULL |
Cullman Bancorp, Inc. (MHC) |
Cullman |
AL |
OTC Pink |
22.50 | 57.7 | 1.08 | 28.25 | 20.85 | 79.65 | 79.65 | 19.12 | 0.25 | 1.11 | 23.2 | 301,705 | 24.01 | 0.92 | 3.82 | ||||||||||||||||||||||||||||||||||||||||
| 13 | FSGB |
First Federal of South Carolina, FSB (MHC) |
Walterboro |
SC |
OTC Pink |
4.49 | 4.5 | 0.50 | 7.92 | 8.91 | 56.71 | 56.71 | 5.97 | 0.12 | 2.67 | 23.8 | 76,224 | 10.52 | 0.67 | 6.37 | ||||||||||||||||||||||||||||||||||||||||
| 14 | GOVB |
Gouverneur Bancorp, Inc. (MHC) |
Gouverneur |
NY |
OTC Pink |
14.50 | 32.2 | 0.58 | 20.79 | 24.85 | 69.73 | 69.73 | 20.43 | 0.34 | 2.34 | 58.3 | 157,751 | 29.30 | 0.82 | 2.81 | ||||||||||||||||||||||||||||||||||||||||
| 15 | GVFF |
Greenville Federal Financial Corporation (MHC) |
Greenville |
OH |
OTC Pink |
8.46 | 17.6 | 0.36 | 14.35 | 23.43 | 58.93 | 58.93 | 10.42 | 0.28 | 3.31 | 77.6 | 168,535 | 17.68 | 0.44 | 2.51 | ||||||||||||||||||||||||||||||||||||||||
| 16 | GFCJ |
Guaranty Financial Corp. (MHC) |
Glendale |
WI |
OTC Pink |
2.85 | 5.3 | -0.20 | NA |
NM | 20.37 | NA | 0.53 | 2.00 | 70.18 | NM | 999,850 | NA | -0.04 | -1.41 | ||||||||||||||||||||||||||||||||||||||||
| 17 | HTWC |
Hometown Bancorp, Inc. (MHC) |
Walden |
NY |
OTC Pink |
2.65 | 6.2 | 0.00 | 4.68 | NM | 54.75 | 56.67 | 4.90 | 0.00 | 0.00 | 0.0 | 125,934 | 8.64 | 0.00 | 0.00 | ||||||||||||||||||||||||||||||||||||||||
| 18 | LSFG |
LifeStore Financial Group (MHC) |
West Jefferson |
NC |
OTC Pink |
16.75 | 17.1 | 2.07 | NA |
8.10 | 57.74 | NA | 6.23 | 0.00 | 0.00 | 0.0 | 273,802 | NA | 0.77 | 7.13 | ||||||||||||||||||||||||||||||||||||||||
| 19 | LPBC |
Lincoln Park Bancorp (MHC) |
Lincoln Park |
NJ |
OTC Pink |
11.00 | 19.8 | 0.55 | 15.70 | 19.91 | 69.95 | 70.08 | 5.78 | 0.12 | 1.09 | 21.7 | 343,058 | 8.25 | 0.29 | 3.51 | ||||||||||||||||||||||||||||||||||||||||
| 20 | MSVB |
Mid-Southern Savings Bank, FSB (MHC) |
Salem |
IN |
OTC Pink |
17.95 | 26.4 | 1.36 | 26.94 | 13.20 | 66.62 | 66.62 | 13.39 | 0.53 | 2.92 | 38.6 | 197,276 | 20.09 | 1.01 | 5.05 | ||||||||||||||||||||||||||||||||||||||||
| 21 | MFDB |
Mutual Federal Bancorp, Inc. (MHC) |
Chicago |
IL |
OTC Pink |
5.35 | 17.6 | NA | NA |
NA | 65.73 | NA | 18.95 | 0.00 | 0.00 | NM | 92,940 | NA | NA | NA | ||||||||||||||||||||||||||||||||||||||||
| 22 | NECB |
NorthEast Community Bancorp, Inc. (MHC) |
White Plains |
NY |
OTC Pink |
7.30 | 89.2 | 0.38 | 12.42 | 19.16 | 58.39 | 58.75 | 12.63 | 0.12 | 1.64 | 31.5 | 706,584 | 21.49 | 0.66 | 3.05 | ||||||||||||||||||||||||||||||||||||||||
| 23 | SCAY |
Seneca-Cayuga Bancorp, Inc. (MHC) |
Seneca Falls |
NY |
OTC Pink |
12.00 | 27.7 | 0.04 | 16.66 | NM | 71.43 | 72.03 | 9.56 | 0.00 | 0.00 | 0.0 | 290,082 | 13.28 | 0.03 | 0.22 | ||||||||||||||||||||||||||||||||||||||||
| 24 | WAKE |
Wake Forest Bancshares, Inc. (MHC) |
Wake Forest |
NC |
OTC Pink |
16.35 | 18.7 | 0.94 | 27.75 | 17.39 | 58.92 | 58.92 | 16.30 | 0.24 | 1.47 | 25.5 | 114,948 | 27.67 | 0.94 | 3.39 | ||||||||||||||||||||||||||||||||||||||||
| 25 | WAWL |
Wawel Bank (MHC) |
Garfield |
NJ |
OTC Pink |
5.09 | 10.9 | -0.14 | 6.05 | NM | 84.16 | 84.16 | 13.86 | 0.00 | 0.00 | 0.0 | 78,764 | 16.47 | -0.37 | -2.25 | ||||||||||||||||||||||||||||||||||||||||
| 26 | WMPN |
William Penn Bancorp, Inc. (MHC) |
Levittown |
PA |
OTC Pink |
20.20 | 70.6 | 0.81 | 29.44 | 24.86 | 68.62 | 68.62 | 19.61 | 0.28 | 1.39 | 34.5 | 359,774 | 28.58 | 0.79 | 2.76 | ||||||||||||||||||||||||||||||||||||||||
| (1) | Current stock price of minority stock. |
| (2) | Ratios are pro forma assumings a second step conversion to full stock form. |
| Source: | SNL Financial, LC. And RP Financial, LC. Calculations. The information provided in this report has been obtained from sources we believe are reliable, but we cannot guarantee the accuracy or completeness of such information. |
| RP® Financial, LC. | VALUATION ANALYSIS |
IV.28
Table 4.8
Calculation of Implied Per Share Data—Incorporating MHC Second Step Conversion
Publicly Traded MHC Institutions
| Per Share | Net | Net | Pro Forma | |||||||||||||||||||||||||||||||||||||||||||||||||||||||||||
| Current Ownership | TTM NI | Tang. | Share | Gross | Capital | Income | Net Inc./ |
Tang. Bk. | Assets/ | |||||||||||||||||||||||||||||||||||||||||||||||||||||
| Ticker |
Name |
City |
State |
Exhange |
Public | MHC Shares |
Total Shares |
Reported | Bk Value | Assets | Price | Proceeds(1) | Increase(2) | Increase(3) | Share | Value/Share | Share | |||||||||||||||||||||||||||||||||||||||||||||
| 1 | GCBC |
Greene County Bancorp, Inc. (MHC) |
Catskill |
NY |
NASDAQ |
3,878,350 | 4,609,264 | 8,487,614 | $ | 1.10 | $ | 9.00 | $ | 105.23 | $ | 21.70 | $ | 100,021,029 | $ | 86,018,085 | $ | 930,796 | $ | 1.21 | $ | 19.14 | $ | 115.36 | ||||||||||||||||||||||||||||||||||
| 2 | HONE |
HarborOne Bancorp, Inc. (MHC) |
Brockton |
MA |
NASDAQ |
14,839,846 | 17,281,034 | 32,120,880 | $ | 0.14 | $ | 9.79 | $ | 73.07 | $ | 19.62 | $ | 339,053,887 | $ | 291,586,343 | $ | 3,155,235 | $ | 0.24 | $ | 18.86 | $ | 82.15 | ||||||||||||||||||||||||||||||||||
| 3 | KFFB |
Kentucky First Federal Bancorp (MHC) |
Frankfort |
KY |
NASDAQ |
3,755,563 | 4,727,938 | 8,483,501 | $ | 0.15 | $ | 6.25 | $ | 34.79 | $ | 8.65 | $ | 40,896,664 | $ | 35,171,131 | $ | 380,584 | $ | 0.19 | $ | 10.39 | $ | 38.93 | ||||||||||||||||||||||||||||||||||
| 4 | LSBK |
Lake Shore Bancorp, Inc. (MHC) |
Dunkirk |
NY |
NASDAQ |
2,460,881 | 3,636,875 | 6,097,756 | $ | 0.69 | $ | 12.68 | $ | 78.46 | $ | 14.18 | $ | 51,569,069 | $ | 44,349,399 | $ | 479,902 | $ | 0.77 | $ | 19.95 | $ | 85.73 | ||||||||||||||||||||||||||||||||||
| 5 | MGYR |
Magyar Bancorp, Inc. (MHC) |
New Brunswick |
NJ |
NASDAQ |
2,620,296 | 3,200,450 | 5,820,746 | $ | 0.19 | $ | 8.20 | $ | 100.40 | $ | 10.60 | $ | 33,924,770 | $ | 29,175,302 | $ | 315,704 | $ | 0.24 | $ | 13.21 | $ | 105.41 | ||||||||||||||||||||||||||||||||||
| 6 | OFED |
Oconee Federal Financial Corp. (MHC) |
Seneca |
SC |
NASDAQ |
1,629,894 | 4,164,415 | 5,794,309 | $ | 0.88 | $ | 14.13 | $ | 83.57 | $ | 22.05 | $ | 91,825,351 | $ | 78,969,802 | $ | 854,527 | $ | 1.02 | $ | 27.76 | $ | 97.20 | ||||||||||||||||||||||||||||||||||
| 7 | PVBC |
Provident Bancorp, Inc. (MHC) |
Amesbury |
MA |
NASDAQ |
4,464,399 | 5,034,323 | 9,498,722 | $ | 0.64 | $ | 11.41 | $ | 80.87 | $ | 17.95 | $ | 90,366,098 | $ | 77,714,844 | $ | 840,947 | $ | 0.73 | $ | 19.59 | $ | 89.06 | ||||||||||||||||||||||||||||||||||
| 22 | TFSL |
TFS Financial Corporation (MHC) |
Cleveland |
OH |
NASDAQ |
57,099,887 | 227,119,132 | 284,219,019 | $ | 0.28 | $ | 5.81 | $ | 45.41 | $ | 18.82 | $ | 4,274,382,064 | $ | 3,675,968,575 | $ | 39,777,399 | $ | 0.42 | $ | 18.74 | $ | 58.34 | ||||||||||||||||||||||||||||||||||
| 8 | ABBB |
Auburn Bancorp, Inc. (MHC) |
Auburn |
ME |
OTC Pink |
226,478 | 276,806 | 503,284 | $ | 0.62 | $ | 13.06 | $ | 140.88 | $ | 9.40 | $ | 2,601,976 | $ | 2,237,700 | $ | 24,214 | $ | 0.66 | $ | 17.50 | $ | 145.33 | ||||||||||||||||||||||||||||||||||
| 9 | BVFL |
BV Financial, Inc. (MHC) |
Baltimore |
MD |
OTC Pink |
949,136 | 2,049,988 | 2,999,124 | ($ | 0.04 | ) | $ | 7.00 | $ | 55.78 | $ | 6.70 | $ | 13,734,920 | $ | 11,812,031 | $ | 127,817 | ($ | 0.00 | ) | $ | 10.94 | $ | 59.72 | ||||||||||||||||||||||||||||||||
| 10 | CNNB |
Cincinnati Bancorp (MHC) |
Cincinnati |
OH |
OTC Pink |
773,663 | 945,587 | 1,719,250 | $ | 0.35 | $ | 10.54 | $ | 90.98 | $ | 9.51 | $ | 8,992,532 | $ | 7,733,578 | $ | 83,685 | $ | 0.39 | $ | 15.03 | $ | 95.48 | ||||||||||||||||||||||||||||||||||
| 11 | CULL |
Cullman Bancorp, Inc. (MHC) |
Cullman |
AL |
OTC Pink |
1,160,727 | 1,403,731 | 2,564,458 | $ | 0.96 | $ | 17.66 | $ | 107.06 | $ | 22.50 | $ | 31,583,948 | $ | 27,162,195 | $ | 293,920 | $ | 1.08 | $ | 28.25 | $ | 117.65 | ||||||||||||||||||||||||||||||||||
| 12 | FSGB |
First Federal of South Carolina, FSB (MHC) |
Walterboro |
SC |
OTC Pink |
162,041 | 850,714 | 1,012,755 | $ | 0.47 | $ | 4.67 | $ | 72.02 | $ | 4.49 | $ | 3,819,706 | $ | 3,284,947 | $ | 35,546 | $ | 0.50 | $ | 7.92 | $ | 75.26 | ||||||||||||||||||||||||||||||||||
| 13 | GOVB |
Gouverneur Bancorp, Inc. (MHC) |
Gouverneur |
NY |
OTC Pink |
911,527 | 1,311,222 | 2,222,749 | $ | 0.50 | $ | 13.44 | $ | 63.61 | $ | 14.50 | $ | 19,012,719 | $ | 16,350,938 | $ | 176,932 | $ | 0.58 | $ | 20.79 | $ | 70.97 | ||||||||||||||||||||||||||||||||||
| 14 | GVFF |
Greenville Federal Financial Corporation (MHC) |
Greenville |
OH |
OTC Pink |
812,397 | 1,264,126 | 2,076,523 | $ | 0.31 | $ | 9.93 | $ | 76.73 | $ | 8.46 | $ | 10,691,725 | $ | 9,194,883 | $ | 99,497 | $ | 0.36 | $ | 14.35 | $ | 81.16 | ||||||||||||||||||||||||||||||||||
| 15 | GFCJ |
Guaranty Financial Corp. (MHC) |
Glendale |
WI |
OTC Pink |
884,470 | 982,961 | 1,867,431 | ($ | 0.21 | ) | NA | $ | 534.12 | $ | 2.85 | $ | 2,801,439 | $ | 2,409,237 | $ | 26,070 | ($ | 0.20 | ) | NA | $ | 535.41 | ||||||||||||||||||||||||||||||||||
| 16 | HTWC |
Hometown Bancorp, Inc. (MHC) |
Walden |
NY |
OTC Pink |
1,017,664 | 1,309,275 | 2,326,939 | ($ | 0.01 | ) | $ | 3.39 | $ | 52.84 | $ | 2.65 | $ | 3,469,579 | $ | 2,983,838 | $ | 32,288 | $ | 0.00 | $ | 4.68 | $ | 54.12 | |||||||||||||||||||||||||||||||||
| 17 | LSFG |
LifeStore Financial Group (MHC) |
West Jefferson |
NC |
OTC Pink |
480,870 | 538,221 | 1,019,091 | $ | 1.99 | NA | $ | 261.07 | $ | 16.75 | $ | 9,015,202 | $ | 7,753,074 | $ | 83,895 | $ | 2.07 | NA | $ | 268.67 | ||||||||||||||||||||||||||||||||||||
| 18 | LPBC |
Lincoln Park Bancorp (MHC) |
Lincoln Park |
NJ |
OTC Pink |
803,435 | 999,810 | 1,803,245 | $ | 0.50 | $ | 10.45 | $ | 185.00 | $ | 11.00 | $ | 10,997,910 | $ | 9,458,203 | $ | 102,347 | $ | 0.55 | $ | 15.70 | $ | 190.24 | ||||||||||||||||||||||||||||||||||
| 19 | MSVB |
Mid-Southern Savings Bank, FSB (MHC) |
Salem |
IN |
OTC Pink |
430,322 | 1,040,750 | 1,471,072 | $ | 1.24 | $ | 16.02 | $ | 123.18 | $ | 17.95 | $ | 18,681,463 | $ | 16,066,058 | $ | 173,850 | $ | 1.36 | $ | 26.94 | $ | 134.10 | ||||||||||||||||||||||||||||||||||
| 20 | MFDB |
Mutual Federal Bancorp, Inc. (MHC) |
Chicago |
IL |
OTC Pink |
745,959 | 2,545,936 | 3,291,895 | NA | NA | $ | 24.67 | $ | 5.35 | $ | 13,620,758 | $ | 11,713,852 | $ | 126,755 | NA | NA | $ | 28.23 | ||||||||||||||||||||||||||||||||||||||
| 21 | NECB |
NorthEast Community Bancorp, Inc. (MHC) |
White Plains |
NY |
OTC Pink |
4,950,052 | 7,273,750 | 12,223,802 | $ | 0.34 | $ | 8.69 | $ | 54.07 | $ | 7.30 | $ | 53,098,375 | $ | 45,664,603 | $ | 494,133 | $ | 0.38 | $ | 12.42 | $ | 57.80 | ||||||||||||||||||||||||||||||||||
| 23 | SCAY |
Seneca-Cayuga Bancorp, Inc. (MHC) |
Seneca Falls |
NY |
OTC Pink |
1,002,345 | 1,309,275 | 2,311,620 | ($ | 0.03 | ) | $ | 10.81 | $ | 119.64 | $ | 12.00 | $ | 15,711,300 | $ | 13,511,718 | $ | 146,209 | $ | 0.04 | $ | 16.66 | $ | 125.49 | |||||||||||||||||||||||||||||||||
| 24 | WAKE |
Wake Forest Bancshares, Inc. (MHC) |
Wake Forest |
NC |
OTC Pink |
511,196 | 635,000 | 1,146,196 | $ | 0.86 | $ | 19.96 | $ | 92.50 | $ | 16.35 | $ | 10,382,250 | $ | 8,928,735 | $ | 96,617 | $ | 0.94 | $ | 27.75 | $ | 100.29 | ||||||||||||||||||||||||||||||||||
| 25 | WAWL |
Wawel Bank (MHC) |
Garfield |
NJ |
OTC Pink |
840,548 | 1,304,153 | 2,144,701 | ($ | 0.16 | ) | $ | 3.39 | $ | 34.06 | $ | 5.09 | $ | 6,638,139 | $ | 5,708,799 | $ | 61,775 | ($ | 0.14 | ) | $ | 6.05 | $ | 36.72 | ||||||||||||||||||||||||||||||||
| 26 | WMPN |
William Penn Bancorp, Inc. (MHC) |
Levittown |
PA |
OTC Pink |
944,305 | 2,548,713 | 3,493,018 | $ | 0.68 | $ | 16.76 | $ | 90.32 | $ | 20.20 | $ | 51,484,003 | $ | 44,276,242 | $ | 479,110 | $ | 0.81 | $ | 29.44 | $ | 103.00 | ||||||||||||||||||||||||||||||||||
| (1) | Gross proceeds calculated as stock price multiplied by the number of shares owned by the MHC (i.e. non-public shares). |
| (2) | Net increase in capital reflects gross proceeds less offering expenses, contra-equity account for leveraged ESOP and Restricted Stock Plan. For MHC’s with assets at the MHC level, the net increase in capital also includes consolidation of MHC assets with the capital of the institution concurrent with hypothetical second step. |
| Offering Expense Percent: |
2.00 | % | ||
| ESOP Percent Purchase: |
8.00 | % | ||
| RRP Percent Purchase: |
4.00 | % |
| (3) | Net increase in earnings reflects after-tax reinvestment income (assumes ESOP and RRP do not generate reinvestment income), less after-tax ESOP amortization and RRP vesting. |
| After-Tax Reinvestment Rate: |
3.50 | % | ||
| ESOP Loan Term (Yrs.): |
10 | |||
| Recognition Plan Vesting (Yrs.): |
5 | |||
| Effective Tax Rate: |
34.00 | % |
Source: SNL Securities, LC and RP Financial, LC. calculations.
| RP® Financial, LC. | VALUATION ANALYSIS |
IV.29
Detailed pricing characteristics of the fully-converted MHCs is shown in Table 4.8.
Table 4.9
Newton Federal Bank
Comparative MHC Pricing Data
| Publicly- Traded MHCs |
OTC MHCs |
Peer Group |
||||||||||
| Pricing Ratios (Averages)(1) |
||||||||||||
| Price/earnings (x) |
20.66x | 18.24x | 19.28x | |||||||||
| Price/tangible book (%) |
90.43 | % | 65.27 | % | 100.73 | % | ||||||
| Price/assets (%) |
20.83 | 11.41 | 15.84 | % | ||||||||
| (1) | Based on market prices as of November 25, 2016. |
It should be noted that in a comparison of the publicly-traded and OTCBB MHCs to the Company, the publicly-traded and OTCBB MHCs maintain certain inherit characteristics in support of increasing the attractiveness of their stocks relative to the Company’s stock as an MHC that will just be completing an IPO: (1) the seasoned publicly-traded MHCs are viewed as potential candidates to complete a second-step offering; (2) some of the publicly-traded MHCs have been grandfathered to waive dividend payments to the MHC pursuant to receiving an annual majority vote by the depositors to approve the waiver of dividends; and (3) given the limited recent MHC conversion offerings, there is a degree of uncertainty on how well an MHC offering will be received in the prevailing regulatory environment.
Comparison to Recent Offerings
As indicated at the beginning of this section, RP Financial’s analysis of recent conversion offering pricing characteristics at closing and in the aftermarket has been limited to a “technical” analysis and, thus, the pricing characteristics of recent conversion offerings cannot be a primary determinate of value. Particular focus was placed on the P/TB approach in this analysis, since the P/E multiples do not reflect the actual impact of reinvestment and the source of the stock proceeds (i.e., external funds vs. deposit withdrawals).
As discussed previously, the two second step conversion offerings that were completed during the past three months had an average pro forma P/TB ratio at closing of 72.5%. In comparison to the 72.5% average closing forma P/TB ratio of the two recent second step conversions, the Company’s P/TB ratio (fully-converted basis) of 59.84% at the midpoint value reflects an implied discount of 17.5%. At the top of the super range, the Company’s P/TB ratio of 67.75% reflects an implied discount of 6.6% relative to the recent second step conversions average P/TB ratio at closing.
| RP® Financial, LC. | VALUATION ANALYSIS |
IV.30
Valuation Conclusion
Based on the foregoing, it is our opinion that, as of November 25, 2016, the estimated aggregate pro forma market value of the shares to be issued immediately following the conversion, both shares issued publicly as well as to the MHC, equaled $55,000,000 at the midpoint, equal to 5,500,000 shares offered at a per share value of $10.00. Pursuant to conversion guidelines, the 15% offering range indicates a minimum value of $46,750,000 and a maximum value of $63,250,000. Based on the $10.00 per share offering price determined by the Board, this valuation range equates to total shares outstanding of 4,675,000 at the minimum and 6,325,000 at the maximum. In the event the appraised value is subject to an increase, the aggregate pro forma market value may be increased up to a super maximum value of $72,737,500 without a resolicitation. Based on the $10.00 per share offering price, the super maximum value would result in total shares outstanding of 7,273,750.
The Board of Directors has established a public offering range such that the public ownership of the Company will constitute a 46.0% ownership interest. Accordingly, the offering to the public of the minority stock will equal $21,505,000 at the minimum, $25,300,000 at the midpoint, $29,095,000 at the maximum and $33,459,250 at the super maximum of the valuation range. Based on the public offering range, the public ownership of shares will represent 46.0% of the shares issued throughout the valuation range. The pro forma valuation calculations relative to the Peer Group (fully-converted basis) are shown in Table 4.6, and are detailed in Exhibit IV-7 and Exhibit IV-8; the pro forma valuation calculations relative to the Peer Group based on reported financials are shown in Table 4.7 and are detailed in Exhibits IV-9 and IV-10.
EXHIBITS
RP® Financial, LC.
LIST OF EXHIBITS
| Exhibit |
Description | |
| I-1 | Map of Branch Office Network | |
| I-2 | Audited Financial Statements | |
| I-3 | Key Operating Ratios | |
| I-4 | Investment Securities | |
| I-5 | Yields and Costs | |
| I-6 | Loan Loss Allowance Activity | |
| I-7 | Interest Rate Risk Analysis | |
| I-8 | Fixed Rate and Adjustable Rate Loans | |
| I-9 | Loan Portfolio Composition | |
| I-10 | Contractual Maturity By Loan Type | |
| I-11 | Non-Performing Assets | |
| I-12 | Deposit Composition | |
| I-13 | CDs >$100,000 in balance by Maturity | |
| II-1 | Description of Office Facilities | |
| II-2 | Historical Interest Rates | |
| II-3 | Market Area Demographic/Economic Information | |
LIST OF EXHIBITS (continued)
| Exhibit |
Description | |
| III-1 | General Characteristics of Publicly-Traded Institutions | |
| III-2 | Public Market Pricing of Publicly-Traded Institutions – $600 Million in Assets or Less | |
| III-3 | Peer Group Summary Demographic and Deposit Market Share Data | |
| IV-1 | Thrifts Stock Prices: As of November 25, 2016 | |
| IV-2 | Historical Stock Price Indices | |
| IV-3 | Historical Thrift Stock Indices | |
| IV-4 | Market Area Acquisition Activity | |
| IV-5 | Director and Senior Management Summary Resumes | |
| IV-6 | Pro Forma Regulatory Capital Ratios | |
| IV-7 | Pro Forma Analysis Sheet – Fully Converted Basis | |
| IV-8 | Pro Forma Effect of Conversion Proceeds – Fully Converted Basis | |
| IV-9 | Pro Forma Analysis Sheet – MHC Basis | |
| IV-10 | Pro Forma Effect of Conversion Proceeds – MHC Basis | |
| V-1 | Firm Qualifications Statement | |
EXHIBIT I-1
Newton Federal Bank
Map of Branch Office Network
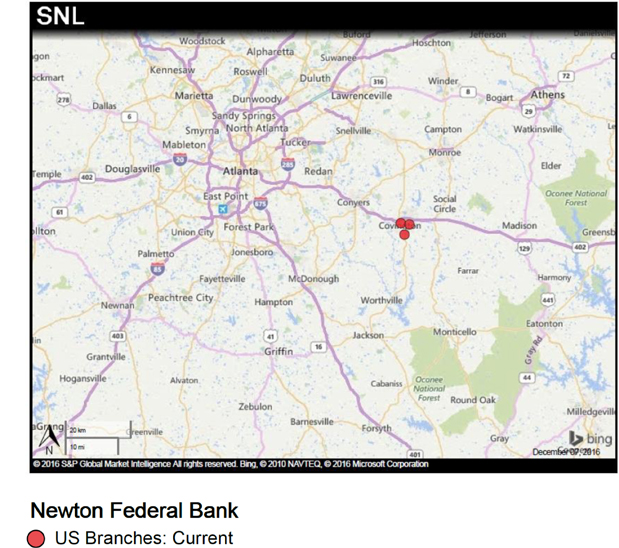
EXHIBIT I-2
Newton Federal Bank
Audited Financial Statements
(Incorporated by Reference)
EXHIBIT I-3
Newton Federal Bank
Key Operating Ratios
| At or For the Years Ended September 30, | ||||||||||||||||||||
| 2016 | 2015 | 2014 | 2013 | 2012 | ||||||||||||||||
| Performance Ratios: |
||||||||||||||||||||
| Return (loss) on average assets |
0.51 | % | 0.72 | % | 3.71 | % | (0.13 | )% | (2.68 | )% | ||||||||||
| Return (loss) on average equity |
2.60 | % | 3.83 | % | 23.39 | % | (0.88 | )% | (15.70 | )% | ||||||||||
| Interest rate spread (1) |
4.15 | % | 4.04 | % | 4.04 | % | 3.63 | % | 3.74 | % | ||||||||||
| Net interest margin (2) |
4.39 | % | 4.32 | % | 4.32 | % | 3.93 | % | 4.06 | % | ||||||||||
| Non-interest expense to average assets |
4.00 | % | 3.41 | % | 3.14 | % | 2.96 | % | 3.03 | % | ||||||||||
| Efficiency ratio (3) |
83.17 | % | 75.35 | % | 67.75 | % | 70.20 | % | 71.13 | % | ||||||||||
| Average interest-earning assets to average interest-bearing liabilities |
138.46 | % | 133.81 | % | 129.08 | % | 124.02 | % | 122.05 | % | ||||||||||
| Average equity to average assets |
19.41 | % | 18.86 | % | 15.87 | % | 14.68 | % | 17.04 | % | ||||||||||
| Capital Ratios: |
||||||||||||||||||||
| Average equity to average assets |
19.41 | % | 18.86 | % | 15.87 | % | 14.68 | % | 17.04 | % | ||||||||||
| Total capital to risk weighted assets |
32.13 | % | 36.67 | % | 33.95 | % | 29.34 | % | 28.54 | % | ||||||||||
| Tier 1 capital to risk weighted assets |
30.86 | % | 35.38 | % | 32.66 | % | 28.04 | % | 27.25 | % | ||||||||||
| Common equity tier 1 capital to risk weighted assets |
30.86 | % | 35.38 | % | N/A | N/A | N/A | |||||||||||||
| Tier 1 capital to average assets |
19.32 | % | 19.37 | % | 17.25 | % | 15.28 | % | 14.85 | % | ||||||||||
| Asset Quality Ratios: |
||||||||||||||||||||
| Allowance for loan losses as a percentage of total loans |
2.22 | % | 3.34 | % | 3.17 | % | 3.20 | % | 3.00 | % | ||||||||||
| Allowance for loan losses as a percentage of non-performing loans |
132.87 | % | 229.18 | % | 187.39 | % | 78.44 | % | 43.90 | % | ||||||||||
| Net (charge-offs) recoveries to average outstanding loans during the year |
(0.86 | )% | 0.09 | % | (0.13 | )% | (1.56 | )% | (4.24 | )% | ||||||||||
| Non-performing loans as a percentage of total loans |
1.67 | % | 1.46 | % | 1.69 | % | 4.08 | % | 6.84 | % | ||||||||||
| Non-performing loans as a percentage of total assets |
1.39 | % | 1.13 | % | 1.34 | % | 3.41 | % | 5.65 | % | ||||||||||
| Total non-performing assets as a percentage of total assets |
1.39 | % | 1.37 | % | 1.84 | % | 4.26 | % | 8.25 | % | ||||||||||
| Other: |
||||||||||||||||||||
| Number of offices |
3 | 3 | 3 | 3 | 3 | |||||||||||||||
| Number of full-time employees |
66 | 65 | 60 | 57 | 56 | |||||||||||||||
| Number of part-time employees |
||||||||||||||||||||
| (1) | Represents the difference between the weighted average yield on average interest-earning assets and the weighted average cost of interest-bearing liabilities. |
| (2) | Represents net interest income as a percentage of average interest-earning assets. |
| (3) | Represents noninterest expense divided by the sum of net interest income and noninterest income |
Source: Community First Bancshares, Inc.’s Preliminary Offering Prospectus
EXHIBIT I-4
Newton Federal Bank
Investment Securities
| At September 30, | ||||||||||||||||||||||||
| 2016 | 2015 | 2014 | ||||||||||||||||||||||
| Amortized Cost |
Estimated Fair Value |
Amortized Cost |
Estimated Fair Value |
Amortized Cost |
Estimated Fair Value |
|||||||||||||||||||
| (In thousands) | ||||||||||||||||||||||||
| U.S. Government sponsored enterprises |
$ | 7,499 | $ | 7,517 | $ | 7,492 | $ | 7,533 | $ | 6,986 | $ | 6,989 | ||||||||||||
|
|
|
|
|
|
|
|
|
|
|
|
|
|||||||||||||
| Total |
$ | 7,499 | $ | 7,517 | $ | 7,492 | $ | 7,533 | $ | 6,986 | $ | 6,989 | ||||||||||||
|
|
|
|
|
|
|
|
|
|
|
|
|
|||||||||||||
Source: Community First Bancshares, Inc.’s Preliminary Offering Prospectus
EXHIBIT I-5
Newton Federal Bank
Yields and Costs
| At September 30, 2016 |
For the Year Ended September 30, 2016 |
|||||||||||||||
| Average Yield/Rate |
Average Outstanding Balance |
Interest | Average Yield/Rate |
|||||||||||||
| (Dollars in thousands) | ||||||||||||||||
| Interest-earning assets: |
||||||||||||||||
| Loans |
5.57 | % | $ | 182,181 | $ | 10,937 | 6.00 | % | ||||||||
| Securities |
1.09 | % | 7,496 | 82 | 1.09 | % | ||||||||||
| Interest-earning deposits |
0.74 | % | 34,070 | 219 | 0.64 | % | ||||||||||
| Federal Home Loan Bank of Atlanta stock |
4.64 | % | 204 | 10 | 4.90 | % | ||||||||||
|
|
|
|
|
|||||||||||||
| Total interest-earning assets |
223,951 | 11,248 | 5.02 | % | ||||||||||||
| Non-interest-earning assets |
4,980 | |||||||||||||||
|
|
|
|||||||||||||||
| Total assets |
$ | 228,931 | ||||||||||||||
|
|
|
|||||||||||||||
| Interest-bearing liabilities: |
||||||||||||||||
| Passbook savings accounts |
0.04 | % | $ | 20,766 | 8 | 0.04 | % | |||||||||
| Interest-bearing checking accounts |
0.45 | % | 27,162 | 83 | 0.31 | % | ||||||||||
| Money market checking accounts |
0.26 | % | 22,919 | 59 | 0.26 | % | ||||||||||
| Certificates of deposit |
1.05 | % | 90,902 | 1,265 | 1.39 | % | ||||||||||
|
|
|
|
|
|||||||||||||
| Total interest-bearing deposits |
161,749 | 1,415 | 0.87 | % | ||||||||||||
|
|
|
|
|
|||||||||||||
| Total interest-bearing liabilities |
161,749 | 1,415 | 0.87 | % | ||||||||||||
|
|
|
|
|
|||||||||||||
| Non-interest-bearing liabilities |
22,736 | |||||||||||||||
| Total liabilities |
184,485 | |||||||||||||||
|
|
|
|||||||||||||||
| Total retained earnings |
$ | 44,446 | ||||||||||||||
|
|
|
|||||||||||||||
| Total liabilities and retained earnings |
$ | 228,931 | ||||||||||||||
|
|
|
|||||||||||||||
| Net interest income |
$ | 9,833 | ||||||||||||||
|
|
|
|||||||||||||||
| Net interest rate spread (1) |
4.15 | % | ||||||||||||||
| Net interest-earning assets (2) |
$ | 62,202 | ||||||||||||||
|
|
|
|||||||||||||||
| Net interest margin (3) |
4.39 | % | ||||||||||||||
| Average interest-earning assets to interest-bearing liabilities |
|
138.46 | % | |||||||||||||
| (1) | Net interest rate spread represents the difference between the weighted average yield on interest-earning assets and the weighted average rate of interest-bearing liabilities. |
| (2) | Net interest-earning assets represent total interest-earning assets less total interest-bearing liabilities. Net interest margin represents net interest income divided by average total interest-earning assets. |
Source: Community First Bancshares, Inc.’s Preliminary Offering Prospectus
EXHIBIT I-5 (continued)
Newton Federal Bank
Yields and Costs
| For the Years Ended September 30, | ||||||||||||||||||||||||
| 2015 | 2014 | |||||||||||||||||||||||
| Average Outstanding Balance |
Interest | Average Yield/Rate |
Average Outstanding Balance |
Interest | Average Yield/Rate |
|||||||||||||||||||
| (Dollars in thousands) | ||||||||||||||||||||||||
| Interest-earning assets: |
||||||||||||||||||||||||
| Loans |
$ | 177,805 | $ | 10,815 | 6.08 | % | $ | 186,610 | $ | 11,416 | 6.12 | % | ||||||||||||
| Securities |
7,781 | 89 | 1.14 | % | 5,957 | 69 | 1.16 | % | ||||||||||||||||
| Interest-earning deposits |
33,661 | 132 | 0.39 | % | 24,965 | 77 | 0.31 | % | ||||||||||||||||
| Federal Home Loan Bank of Atlanta stock |
200 | 9 | 4.50 | % | 230 | 9 | 3.91 | % | ||||||||||||||||
|
|
|
|
|
|
|
|
|
|||||||||||||||||
| Total interest-earning assets |
219,447 | 11,045 | 5.03 | % | 217,762 | 11,571 | 5.31 | % | ||||||||||||||||
| Non-interest-earning assets |
3,947 | 4,478 | ||||||||||||||||||||||
|
|
|
|
|
|||||||||||||||||||||
| Total assets |
$ | 223,394 | $ | 222,240 | ||||||||||||||||||||
|
|
|
|
|
|||||||||||||||||||||
| Interest-bearing liabilities: |
||||||||||||||||||||||||
| Passbook savings accounts |
$ | 19,933 | 8 | 0.04 | % | $ | 18,709 | 7 | 0.04 | % | ||||||||||||||
| Interest-bearing checking accounts |
20,711 | 36 | 0.17 | % | 16,738 | 7 | 0.04 | % | ||||||||||||||||
| Money market checking accounts |
22,997 | 58 | 0.25 | % | 23,321 | 64 | 0.27 | % | ||||||||||||||||
| Certificates of deposit |
100,356 | 1,711 | 1.70 | % | 109,937 | 2,078 | 1.89 | % | ||||||||||||||||
|
|
|
|
|
|
|
|
|
|||||||||||||||||
| Total interest-bearing deposits |
163,997 | 1,813 | 1.11 | % | 168,705 | 2,156 | 1.28 | % | ||||||||||||||||
|
|
|
|
|
|
|
|
|
|||||||||||||||||
| Total interest-bearing liabilities |
163,997 | 1,813 | 1.11 | % | 168,708 | 2,156 | 1.28 | % | ||||||||||||||||
|
|
|
|
|
|||||||||||||||||||||
| Non-interest-bearing liabilities |
17,258 | 18,261 | ||||||||||||||||||||||
|
|
|
|
|
|||||||||||||||||||||
| Total liabilities |
181,255 | 186,966 | ||||||||||||||||||||||
| Total retained earnings |
42,139 | 35,274 | ||||||||||||||||||||||
|
|
|
|
|
|||||||||||||||||||||
| Total liabilities and retained earnings |
$ | 223,394 | $ | 222,240 | ||||||||||||||||||||
|
|
|
|
|
|||||||||||||||||||||
| Net interest income |
$ | 9,232 | $ | 9,415 | ||||||||||||||||||||
|
|
|
|
|
|||||||||||||||||||||
| Net interest rate spread (1) |
3.93 | % | 4.04 | % | ||||||||||||||||||||
| Net interest-earning assets (2) |
$ | 55,450 | $ | 49,057 | ||||||||||||||||||||
|
|
|
|
|
|||||||||||||||||||||
| Net interest margin (3) |
4.21 | % | 4.32 | % | ||||||||||||||||||||
| Average interest-earning assets to interest-bearing liabilities |
133.81 | % | 129.08 | % | ||||||||||||||||||||
| (1) | Net interest rate spread represents the difference between the weighted average yield on interest-earning assets and the weighted average rate of interest-bearing liabilities. |
| (2) | Net interest-earning assets represent total interest-earning assets less total interest-bearing liabilities. |
| (3) | Net interest margin represents net interest income divided by average total interest-earning assets. |
Source: Community First Bancshares, Inc.’s Preliminary Offering Prospectus
EXHIBIT I-6
Newton Federal Bank
Loan Loss Allowance Activity
| Years Ended September 30, | ||||||||||||||||||||
| 2016 | 2015 | 2014 | 2013 | 2012 | ||||||||||||||||
| (Dollars in thousands) | ||||||||||||||||||||
| Allowance at beginning of year |
$ | 5,874 | $ | 5,708 | $ | 5,947 | $ | 5,694 | $ | 5,032 | ||||||||||
| Provision for loan losses |
— | — | — | 3,147 | 9,017 | |||||||||||||||
| Charge offs: |
||||||||||||||||||||
| Real estate loans: |
||||||||||||||||||||
| One- to four-family residential |
(337 | ) | (438 | ) | (1,214 | ) | (4,073 | ) | (7,018 | ) | ||||||||||
| Commercial |
(1,796 | ) | (20 | ) | (132 | ) | (386 | ) | (1,211 | ) | ||||||||||
| Construction and land |
— | — | (125 | ) | (230 | ) | (519 | ) | ||||||||||||
| Commercial and industrial loans |
— | — | (48 | ) | (243 | ) | — | |||||||||||||
| Consumer loans |
(12 | ) | (18 | ) | (1 | ) | (38 | ) | (12 | ) | ||||||||||
|
|
|
|
|
|
|
|
|
|
|
|||||||||||
| Total charge-offs |
(2,145 | ) | (476 | ) | (1,520 | ) | (4,970 | ) | (8,760 | ) | ||||||||||
|
|
|
|
|
|
|
|
|
|
|
|||||||||||
| Recoveries: |
||||||||||||||||||||
| Real estate loans: |
||||||||||||||||||||
| One- to four-family residential |
341 | 356 | 970 | 1,816 | 401 | |||||||||||||||
| Commercial |
233 | 130 | 281 | 12 | — | |||||||||||||||
| Construction and land |
— | — | 23 | 120 | — | |||||||||||||||
| Commercial and industrial loans |
— | 154 | 7 | 127 | — | |||||||||||||||
| Consumer loans |
6 | 2 | — | 1 | 4 | |||||||||||||||
|
|
|
|
|
|
|
|
|
|
|
|||||||||||
| Total recoveries |
580 | 642 | 1,281 | 2,076 | 405 | |||||||||||||||
|
|
|
|
|
|
|
|
|
|
|
|||||||||||
| Net (charge-offs) recoveries |
(1,565 | ) | 166 | (239 | ) | (2,984 | ) | (8,355 | ) | |||||||||||
|
|
|
|
|
|
|
|
|
|
|
|||||||||||
| Allowance at end of year |
$ | 4,309 | $ | 5,874 | $ | 5,708 | $ | 5,947 | $ | 5,694 | ||||||||||
|
|
|
|
|
|
|
|
|
|
|
|||||||||||
| Allowance to non-performing loans |
132.87 | % | 229.18 | % | 187.39 | % | 78.44 | % | 43.90 | % | ||||||||||
| Allowance to total loans outstanding at the end of the year |
2.22 | % | 3.34 | % | 3.17 | % | 3.20 | % | 3.00 | % | ||||||||||
| Net (charge-offs) recoveries to average loans outstanding during the year |
(0.86 | )% | 0.09 | % | (0.13 | )% | (1.56 | )% | (4.24 | )% | ||||||||||
Source: Community First Bancshares, Inc.’s Preliminary Offering Prospectus
EXHIBIT I-7
Newton Federal Bank
Interest Rate Risk Analysis
| Change in Interest Rates (basis points) (1) |
Estimated NEV (2) |
NEV as a Percentage of Present Value of Assets (3) |
||||||||||||||||||
| Estimated Increase (Decrease) in NEV |
NEV Ratio (4) |
Increase (Decrease) (basis points) |
||||||||||||||||||
| Amount | Percent | |||||||||||||||||||
| (Dollars in thousands) | ||||||||||||||||||||
| +400 |
$ | 39,368 | $ | (11,902 | ) | (23.21 | )% | 18.72 | % | (289 | ) | |||||||||
| +200 |
44,947 | (6,323 | ) | (12.33 | )% | 20.15 | % | (146 | ) | |||||||||||
| — |
51,270 | — | — | % | 21.61 | % | — | |||||||||||||
| -200 |
51,544 | 274 | 0.53 | % | 21.25 | % | (36 | ) | ||||||||||||
| -400 |
49,173 | (2,371 | ) | (4.09 | )% | 20.49 | % | (112 | ) | |||||||||||
| (1) | Assumes an immediate uniform change in interest rates at all maturities. |
| (2) | NEV is the discounted present value of expected cash flows from assets, liabilities and off-balance sheet contracts. |
| (3) | Present value of assets represents the discounted present value of incoming cash flows on interest-earning assets. |
| (4) | NEV Ratio represents NEV divided by the present value of assets. |
Source: Community First Bancshares, Inc.’s Preliminary Offering Prospectus
EXHIBIT I-8
Newton Federal Bank
Fixed Rate and Adjustable Rate Loans
| Due After September 30, 2017 | ||||||||||||
| Fixed | Adjustable | Total | ||||||||||
| (In thousands) | ||||||||||||
| Real estate loans: |
||||||||||||
| One- to four-family residential |
$ | 127,004 | $ | 1,079 | $ | 128,083 | ||||||
| Commercial |
24,130 | 2,681 | 26,811 | |||||||||
| Construction and land |
2,591 | 542 | 3,133 | |||||||||
| Commercial and industrial loans |
12,760 | 15 | 12,775 | |||||||||
| Consumer loans |
1,522 | 21 | 1,543 | |||||||||
|
|
|
|
|
|
|
|||||||
| Total loans |
$ | 168,007 | $ | 4,338 | $ | 172,345 | ||||||
|
|
|
|
|
|
|
|||||||
Source: Community First Bancshares, Inc.’s Preliminary Offering Prospectus
EXHIBIT I-9
Newton Federal Bank
Loan Portfolio Composition
| At September 30, | ||||||||||||||||||||||||||||||||||||||||
| 2016 | 2015 | 2014 | 2013 | 2012 | ||||||||||||||||||||||||||||||||||||
| Amount | Percent | Amount | Percent | Amount | Percent | Amount | Percent | Amount | Percent | |||||||||||||||||||||||||||||||
| (Dollars in thousands) | ||||||||||||||||||||||||||||||||||||||||
| Real estate loans: |
||||||||||||||||||||||||||||||||||||||||
| One- to four-family residential (1) |
$ | 132,899 | 68.54 | % | $ | 132,480 | 75.42 | % | $ | 139,977 | 77.84 | % | $ | 147,396 | 79.26 | % | $ | 154,959 | 81.71 | % | ||||||||||||||||||||
| Commercial (2) |
29,162 | 15.04 | 24,581 | 13.99 | 25,860 | 14.38 | 24,862 | 13.37 | 27,092 | 14.29 | ||||||||||||||||||||||||||||||
| Construction and land |
13,343 | 6.88 | 2,261 | 1.28 | 817 | 0.45 | 1,205 | 0.65 | 1,980 | 1.04 | ||||||||||||||||||||||||||||||
| Commercial and industrial loans |
16,221 | 8.37 | 14,333 | 8.16 | 11,639 | 6.47 | 11,067 | 5.95 | 4,160 | 2.19 | ||||||||||||||||||||||||||||||
| Consumer loans |
2,262 | 1.17 | 2,017 | 1.15 | 1,547 | 0.86 | 1,423 | 0.77 | 1,461 | 0.77 | ||||||||||||||||||||||||||||||
|
|
|
|
|
|
|
|
|
|
|
|
|
|
|
|
|
|
|
|
|
|||||||||||||||||||||
| 193,887 | 100.00 | % | 175,672 | 100.00 | % | 179,840 | 100.00 | % | 185,953 | 100.00 | % | 189,652 | 100.00 | % | ||||||||||||||||||||||||||
|
|
|
|
|
|
|
|
|
|
|
|||||||||||||||||||||||||||||||
| Less: |
||||||||||||||||||||||||||||||||||||||||
| Allowance for losses |
4,309 | 5,874 | 5,708 | 5,947 | 5,694 | |||||||||||||||||||||||||||||||||||
|
|
|
|
|
|
|
|
|
|
|
|||||||||||||||||||||||||||||||
| Total loans |
$ | 189,578 | $ | 169,798 | $ | 174,132 | $ | 180,006 | $ | 183,958 | ||||||||||||||||||||||||||||||
|
|
|
|
|
|
|
|
|
|
|
|||||||||||||||||||||||||||||||
| (1) | Includes home equity loans, which totaled $ at September 30, 2016. |
| (2) | Includes multi-family residential real estate loans, which totaled $806,000 at September 30, 2016. |
Source: Community First Bancshares, Inc.’s Preliminary Offering Prospectus
EXHIBIT I-10
Newton Federal Bank
Contractual Maturity By Loan Type
| September 30, 2016 |
One- to Four- Family Residential Real Estate |
Commercial Real Estate |
Construction and Land |
|||||||||
| (In thousands) | ||||||||||||
| Amounts due in: One year or less |
$ | 4,816 | $ | 2,351 | $ | 10,210 | ||||||
| More than one to five years |
26,742 | 13,529 | 2,019 | |||||||||
| More than five years |
101,341 | 13,282 | 1,114 | |||||||||
|
|
|
|
|
|
|
|||||||
| Total |
$ | 132,899 | $ | 29,162 | $ | 13,343 | ||||||
|
|
|
|
|
|
|
|||||||
| September 30, 2016 |
Commercial and Industrial |
Consumer | Total | |||||||||
| (In thousands) | ||||||||||||
| Amounts due in: One year or less |
$ | 3,446 | $ | 719 | $ | 21,542 | ||||||
| More than one to five years |
7,556 | 1,364 | 51,210 | |||||||||
| More than five years |
5,219 | 179 | 121,135 | |||||||||
|
|
|
|
|
|
|
|||||||
| Total |
$ | 16,221 | $ | 2,262 | $ | 193,887 | ||||||
|
|
|
|
|
|
|
|||||||
Source: Community First Bancshares, Inc.’s Preliminary Offering Prospectus
EXHIBIT I-11
Newton Federal Bank
Non-Performing Assets
| At September 30, | ||||||||||||||||||||
| 2016 | 2015 | 2014 | 2013 | 2012 | ||||||||||||||||
| (Dollars in thousands) | ||||||||||||||||||||
| Non-accrual loans: |
||||||||||||||||||||
| Real estate loans: |
||||||||||||||||||||
| One- to four-family residential |
$ | 3,013 | $ | 2,056 | $ | 2,269 | $ | 5,295 | $ | 8,365 | ||||||||||
| Commercial |
230 | 448 | 777 | 1,952 | 3,581 | |||||||||||||||
| Construction and land |
— | — | — | — | 581 | |||||||||||||||
| Commercial and industrial loans |
— | 33 | — | 335 | 434 | |||||||||||||||
| Consumer loans |
— | 26 | — | — | 8 | |||||||||||||||
|
|
|
|
|
|
|
|
|
|
|
|||||||||||
| Total non-accrual loans |
3,243 | 2,563 | 3,046 | 7,582 | 12,969 | |||||||||||||||
|
|
|
|
|
|
|
|
|
|
|
|||||||||||
| Accruing loans past due 90 days or more |
— | — | — | — | — | |||||||||||||||
| Real estate owned: |
||||||||||||||||||||
| One- to four-family |
— | — | 822 | 1,239 | 4,226 | |||||||||||||||
| Commercial |
— | 470 | — | 64 | 1,159 | |||||||||||||||
| Construction and land |
— | 62 | 307 | 577 | 577 | |||||||||||||||
| Commercial and industrial loans |
— | — | — | — | — | |||||||||||||||
| Consumer loans |
— | — | — | — | — | |||||||||||||||
|
|
|
|
|
|
|
|
|
|
|
|||||||||||
| Total real estate owned |
— | 532 | 1,129 | 1,880 | 5,962 | |||||||||||||||
|
|
|
|
|
|
|
|
|
|
|
|||||||||||
| Total non-performing assets |
$ | 3,243 | $ | 3,095 | $ | 4,175 | $ | 9,462 | $ | 18,931 | ||||||||||
|
|
|
|
|
|
|
|
|
|
|
|||||||||||
| Total accruing troubled debt restructured loans |
$ | 5,815 | $ | 4,358 | $ | 4,845 | $ | 3,730 | $ | 2,716 | ||||||||||
| Total non-performing loans to total loans |
1.71 | % | 1.51 | % | 1.75 | % | 4.21 | % | 7.05 | % | ||||||||||
| Total non-performing assets to total assets |
1.39 | % | 1.37 | % | 1.84 | % | 4.26 | % | 8.25 | % | ||||||||||
Source: Community First Bancshares, Inc.’s Preliminary Offering Prospectus
EXHIBIT I-12
Newton Federal Bank
Deposit Composition
| At September 30, | ||||||||||||||||||||||||||||||||||||
| 2016 | 2015 | 2014 | ||||||||||||||||||||||||||||||||||
| Amount | Percent | Average Rate |
Amount | Percent | Average Rate |
Amount | Percent | Average Rate |
||||||||||||||||||||||||||||
| (Dollars in thousands) | ||||||||||||||||||||||||||||||||||||
| Non-interest bearing checking accounts |
$ | 21,727 | 11.96 | % | — | % | $ | 15,132 | 8.56 | % | — | % | $ | 13,276 | 7.41 | % | — | % | ||||||||||||||||||
| Passbook savings accounts |
21,180 | 11.65 | 0.04 | % | 19,906 | 11.27 | 0.04 | % | 19,559 | 10.91 | 0.04 | % | ||||||||||||||||||||||||
| Interest-bearing checking accounts |
30,662 | 16.88 | 0.31 | % | 22,750 | 12.88 | 0.17 | % | 16,991 | 9.48 | 0.04 | % | ||||||||||||||||||||||||
| Money market checking accounts |
22,607 | 12.44 | 0.26 | % | 22,587 | 12.78 | 0.25 | % | 23,689 | 13.21 | 0.27 | % | ||||||||||||||||||||||||
| Certificates of deposit |
85,523 | 47.07 | 1.39 | % | 96,312 | 54.51 | 1.70 | % | 105,749 | 58.99 | 1.89 | % | ||||||||||||||||||||||||
|
|
|
|
|
|
|
|
|
|
|
|
|
|||||||||||||||||||||||||
| Total |
$ | 181,699 | 100.00 | % | 0.87 | % | $ | 176,687 | 100.00 | % | 1.11 | % | $ | 179,264 | 100.00 | % | 1.28 | % | ||||||||||||||||||
|
|
|
|
|
|
|
|
|
|
|
|
|
|||||||||||||||||||||||||
Source: Community First Bancshares, Inc.’s Preliminary Offering Prospectus
EXHIBIT I-13
Newton Federal Bank
CDs >$100,000 in Balance by Maturity
| At September 30, 2016 |
||||
| (In thousands) | ||||
| Maturity Period: |
||||
| Three months or less |
$ | 5,319 | ||
| Over three through six months |
2,436 | |||
| Over six through twelve months |
6,102 | |||
| Over twelve months |
21,159 | |||
|
|
|
|||
| Total |
$ | 35,016 | ||
|
|
|
|||
Source: Community First Bancshares, Inc.’s Preliminary Offering Prospectus
EXHIBIT II-1
Newton Federal Bank
Description of Office Facilities
| Location |
Leased or Owned |
Year Acquired or Leased |
Net Book Value of Real Property |
|||||||||
| (In thousands) | ||||||||||||
| Main Office: |
||||||||||||
| 3175 Highway 278 |
Owned | 1974 | $ | 1,169 | ||||||||
| Covington, Georgia 30014 |
||||||||||||
| Other Properties: |
||||||||||||
| Eastside Branch |
Owned | 2000 | 1,514 | |||||||||
| 8278 Highway 278 |
||||||||||||
| Covington, Georgia 30014 |
||||||||||||
| Southside Branch |
|
Building Owned/Land Leased |
|
2006 | 1,110 | |||||||
| Bypass Road & Highway 36 |
||||||||||||
| 10131 Carlin Avenue |
||||||||||||
| Covington, Georgia 30014 |
||||||||||||
| Loan Production Office |
Leased | 2016 | N/A | |||||||||
| 3001 Monroe Highway |
||||||||||||
| Suite 500B |
||||||||||||
| Bogart, Georgia 30622 |
||||||||||||
Source: Community First Bancshares, Inc.’s Preliminary Offering Prospectus
Exhibit II-2
Newton Federal Bank
Historical Interest Rates(1)
| Prime | 90 Day | One Year | 10 Year | |||||||||||||||
| Year/Qtr. Ended |
Rate | T-Note | T-Note | T-Note | ||||||||||||||
| 2004: | Quarter 1 |
4.00% | 0.95% | 1.20% | 3.86% | |||||||||||||
| Quarter 2 |
4.00% | 1.33% | 2.09% | 4.62% | ||||||||||||||
| Quarter 3 |
4.75% | 1.70% | 2.16% | 4.12% | ||||||||||||||
| Quarter 4 |
5.25% | 2.22% | 2.75% | 4.24% | ||||||||||||||
| 2005: | Quarter 1 |
5.75% | 2.80% | 3.43% | 4.51% | |||||||||||||
| Quarter 2 |
6.00% | 3.12% | 3.51% | 3.98% | ||||||||||||||
| Quarter 3 |
6.75% | 3.55% | 4.01% | 4.34% | ||||||||||||||
| Quarter 4 |
7.25% | 4.08% | 4.38% | 4.39% | ||||||||||||||
| 2006: | Quarter 1 |
7.75% | 4.63% | 4.82% | 4.86% | |||||||||||||
| Quarter 2 |
8.25% | 5.01% | 5.21% | 5.15% | ||||||||||||||
| Quarter 3 |
8.25% | 4.88% | 4.91% | 4.64% | ||||||||||||||
| Quarter 4 |
8.25% | 5.02% | 5.00% | 4.71% | ||||||||||||||
| 2007: | Quarter 1 |
8.25% | 5.04% | 4.90% | 4.65% | |||||||||||||
| Quarter 2 |
8.25% | 4.82% | 4.91% | 5.03% | ||||||||||||||
| Quarter 3 |
7.75% | 3.82% | 4.05% | 4.59% | ||||||||||||||
| Quarter 4 |
7.25% | 3.36% | 3.34% | 3.91% | ||||||||||||||
| 2008: | Quarter 1 |
5.25% | 1.38% | 1.55% | 3.45% | |||||||||||||
| Quarter 2 |
5.00% | 1.90% | 2.36% | 3.99% | ||||||||||||||
| Quarter 3 |
5.00% | 0.92% | 1.78% | 3.85% | ||||||||||||||
| Quarter 4 |
3.25% | 0.11% | 0.37% | 2.25% | ||||||||||||||
| 2009: | Quarter 1 |
3.25% | 0.21% | 0.57% | 2.71% | |||||||||||||
| Quarter 2 |
3.25% | 0.19% | 0.56% | 3.53% | ||||||||||||||
| Quarter 3 |
3.25% | 0.14% | 0.40% | 3.31% | ||||||||||||||
| Quarter 4 |
3.25% | 0.06% | 0.47% | 3.85% | ||||||||||||||
| 2010: | Quarter 1 |
3.25% | 0.16% | 0.41% | 3.84% | |||||||||||||
| Quarter 2 |
3.25% | 0.18% | 0.32% | 2.97% | ||||||||||||||
| Quarter 3 |
3.25% | 0.18% | 0.32% | 2.97% | ||||||||||||||
| Quarter 4 |
3.25% | 0.12% | 0.29% | 3.30% | ||||||||||||||
| 2011: | Quarter 1 |
3.25% | 0.09% | 0.30% | 3.47% | |||||||||||||
| Quarter 2 |
3.25% | 0.03% | 0.19% | 3.18% | ||||||||||||||
| Quarter 3 |
3.25% | 0.02% | 0.13% | 1.92% | ||||||||||||||
| Quarter 4 |
3.25% | 0.02% | 0.12% | 1.89% | ||||||||||||||
| 2012: | Quarter 1 |
3.25% | 0.07% | 0.19% | 2.23% | |||||||||||||
| Quarter 2 |
3.25% | 0.09% | 0.21% | 1.67% | ||||||||||||||
| Quarter 3 |
3.25% | 0.10% | 0.17% | 1.65% | ||||||||||||||
| Quarter 4 |
3.25% | 0.05% | 0.16% | 1.78% | ||||||||||||||
| 2013: | Quarter 1 |
3.25% | 0.07% | 0.14% | 1.87% | |||||||||||||
| Quarter 2 |
3.25% | 0.04% | 0.15% | 2.52% | ||||||||||||||
| Quarter 3 |
3.25% | 0.02% | 0.10% | 2.64% | ||||||||||||||
| Quarter 4 |
3.25% | 0.07% | 0.13% | 3.04% | ||||||||||||||
| 2014: | Quarter 1 |
3.25% | 0.05% | 0.13% | 2.73% | |||||||||||||
| Quarter 2 |
3.25% | 0.04% | 0.11% | 2.53% | ||||||||||||||
| Quarter 3 |
3.25% | 0.02% | 0.13% | 2.52% | ||||||||||||||
| Quarter 4 |
3.25% | 0.04% | 0.25% | 2.17% | ||||||||||||||
| 2015: | Quarter 1 |
3.25% | 0.03% | 0.26% | 1.94% | |||||||||||||
| Quarter 2 |
3.25% | 0.01% | 0.28% | 2.35% | ||||||||||||||
| Quarter 3 |
3.25% | 0.00% | 0.33% | 2.06% | ||||||||||||||
| Quarter 4 |
3.50% | 0.16% | 0.65% | 2.27% | ||||||||||||||
| 2016: | Quarter 1 |
3.50% | 0.21% | 0.59% | 1.78% | |||||||||||||
| Quarter 2 |
3.50% | 0.26% | 0.45% | 1.49% | ||||||||||||||
| Quarter 3 |
3.50% | 0.29% | 0.59% | 1.60% | ||||||||||||||
| As of Nov. 25, 2016 | 3.50% | 0.49% | 0.81% | 2.36% | ||||||||||||||
| (1) | End of period data. |
Sources: Federal Reserve and The Wall Street Journal.
EXHIBIT II-3
Newton Federal Bank
Market Area Demographic/Economic Information
Demographic Detail: US
| Base 2010 |
Current 2017 |
Projected 2022 |
% Change 2010 - 2017 |
% Change 2017 - 2022 |
||||||||||||||||
| Total Population (actual) |
308,745,538 | 325,139,271 | 337,393,057 | 5.31 | 3.77 | |||||||||||||||
| 0-14 Age Group (%) |
19.83 | 18.83 | 18.23 | 0.00 | 0.46 | |||||||||||||||
| 15-34 Age Group (%) |
27.43 | 27.12 | 26.50 | 4.13 | 1.39 | |||||||||||||||
| 35-54 Age Group (%) |
27.88 | 25.71 | 24.84 | (2.90 | ) | 0.29 | ||||||||||||||
| 55-69 Age Group (%) |
15.84 | 18.08 | 18.95 | 20.18 | 8.76 | |||||||||||||||
| 70+ Age Group (%) |
9.01 | 10.26 | 11.47 | 19.83 | 16.06 | |||||||||||||||
| Median Age (actual) |
37.10 | 38.20 | 39.20 | 2.96 | 2.62 | |||||||||||||||
| Female Population (actual) |
156,964,212 | 165,084,335 | 171,230,620 | 5.17 | 3.72 | |||||||||||||||
| Male Population (actual) |
151,781,326 | 160,054,936 | 166,162,437 | 5.45 | 3.82 | |||||||||||||||
| Population Density (#/ sq miles) |
87.50 | 92.15 | 95.62 | 5.31 | 3.77 | |||||||||||||||
| Diversity Index (actual) |
NA | NA | NA | NA | NA | |||||||||||||||
| Black (%) |
12.61 | 12.81 | 12.97 | 7.01 | 5.04 | |||||||||||||||
| Asian (%) |
4.75 | 5.56 | 6.14 | 23.10 | 14.68 | |||||||||||||||
| White (%) |
72.41 | 70.33 | 68.81 | 2.29 | 1.52 | |||||||||||||||
| Hispanic (%) |
16.35 | 18.05 | 19.27 | 16.24 | 10.80 | |||||||||||||||
| Pacific Islander (%) |
0.17 | 0.19 | 0.21 | 16.35 | 10.99 | |||||||||||||||
| American Indian/Alaska Native (%) |
0.95 | 0.98 | 1.00 | 8.65 | 6.29 | |||||||||||||||
| Multiple races (%) |
2.92 | 3.35 | 3.67 | 20.96 | 13.61 | |||||||||||||||
| Other (%) |
6.19 | 6.78 | 7.20 | 15.35 | 10.28 | |||||||||||||||
| Total Households (actual) |
116,716,292 | 123,356,629 | 128,246,828 | 5.69 | 3.96 | |||||||||||||||
| < $25K Households (%) |
NA | 21.91 | 20.30 | NA | (3.70 | ) | ||||||||||||||
| $25-49K Households (%) |
NA | 22.90 | 21.83 | NA | (0.91 | ) | ||||||||||||||
| $50-99K Households (%) |
NA | 29.47 | 29.04 | NA | 2.46 | |||||||||||||||
| $100-$199K Households (%) |
NA | 19.48 | 21.14 | NA | 12.83 | |||||||||||||||
| $200K+ Households (%) |
NA | 6.24 | 7.69 | NA | 28.21 | |||||||||||||||
| Average Household Income ($) |
NA | 80,853 | 87,464 | NA | 8.18 | |||||||||||||||
| Median Household Income ($) |
NA | 57,462 | 61,642 | NA | 7.27 | |||||||||||||||
| Per Capita Income ($) |
NA | 31,459 | 34,068 | NA | 8.29 | |||||||||||||||
| Total Owner Occupied Housing Units (actual) |
75,986,074 | 80,105,481 | 83,162,784 | 5.42 | 3.82 | |||||||||||||||
| Renter Occupied Housing Units (actual) |
40,730,218 | 43,251,148 | 45,084,044 | 6.19 | 4.24 | |||||||||||||||
| Vacant Occupied Housing Units (actual) |
14,988,438 | 15,772,131 | 16,105,948 | 5.23 | 2.12 | |||||||||||||||
Source: Nielsen
Demographic data is provided by Nielsen based primarily on US Census data. For non-census year data, Nielsen uses samples and projections to estimate the demographic data. S&P Global Market Intelligence performs calculations on the underlying data provided by Nielsen for some of the data presented on this page.
% Change values are calculated using the underlying actual data.
Demographic Detail: Georgia
| Base 2010 |
Current 2017 |
Projected 2022 |
% Change 2010 - 2017 |
% Change 2017 - 2022 |
||||||||||||||||
| Total Population (actual) |
9,687,653 | 10,375,263 | 10,911,290 | 7.10 | 5.17 | |||||||||||||||
| 0-14 Age Group (%) |
21.38 | 20.04 | 19.03 | 0.37 | (0.15 | ) | ||||||||||||||
| 15-34 Age Group (%) |
28.14 | 27.72 | 27.42 | 5.53 | 4.03 | |||||||||||||||
| 35-54 Age Group (%) |
28.79 | 26.75 | 25.60 | (0.47 | ) | 0.62 | ||||||||||||||
| 55-69 Age Group (%) |
14.72 | 16.88 | 17.93 | 22.89 | 11.70 | |||||||||||||||
| 70+ Age Group (%) |
6.98 | 8.60 | 10.02 | 31.95 | 22.54 | |||||||||||||||
| Median Age (actual) |
35.30 | 36.70 | 37.80 | 3.97 | 3.00 | |||||||||||||||
| Female Population (actual) |
4,958,482 | 5,310,064 | 5,579,569 | 7.09 | 5.08 | |||||||||||||||
| Male Population (actual) |
4,729,171 | 5,065,199 | 5,331,721 | 7.11 | 5.26 | |||||||||||||||
| Population Density (#/ sq miles) |
168.72 | 180.70 | 190.03 | 7.10 | 5.17 | |||||||||||||||
| Diversity Index (actual) |
NA | NA | NA | NA | NA | |||||||||||||||
| Black (%) |
30.46 | 31.27 | 31.96 | 9.96 | 7.49 | |||||||||||||||
| Asian (%) |
3.25 | 4.01 | 4.55 | 32.22 | 19.45 | |||||||||||||||
| White (%) |
59.74 | 57.42 | 55.67 | 2.94 | 1.95 | |||||||||||||||
| Hispanic (%) |
8.81 | 9.61 | 10.15 | 16.80 | 11.06 | |||||||||||||||
| Pacific Islander (%) |
0.07 | 0.08 | 0.09 | 24.25 | 16.15 | |||||||||||||||
| American Indian/Alaska Native (%) |
0.33 | 0.35 | 0.37 | 13.75 | 9.26 | |||||||||||||||
| Multiple races (%) |
2.14 | 2.54 | 2.83 | 27.01 | 17.12 | |||||||||||||||
| Other (%) |
4.01 | 4.33 | 4.54 | 15.42 | 10.31 | |||||||||||||||
| Total Households (actual) |
3,585,584 | 3,854,460 | 4,062,208 | 7.50 | 5.39 | |||||||||||||||
| < $25K Households (%) |
NA | 24.18 | 22.50 | NA | (1.93 | ) | ||||||||||||||
| $25-49K Households (%) |
NA | 24.11 | 22.99 | NA | 0.47 | |||||||||||||||
| $50-99K Households (%) |
NA | 29.22 | 29.08 | NA | 4.88 | |||||||||||||||
| $100-$199K Households (%) |
NA | 17.30 | 18.97 | NA | 15.61 | |||||||||||||||
| $200K+ Households (%) |
NA | 5.19 | 6.46 | NA | 31.23 | |||||||||||||||
| Average Household Income ($) |
NA | 74,512 | 80,638 | NA | 8.22 | |||||||||||||||
| Median Household Income ($) |
NA | 52,421 | 56,517 | NA | 7.81 | |||||||||||||||
| Per Capita Income ($) |
NA | 28,400 | 30,771 | NA | 8.35 | |||||||||||||||
| Total Owner Occupied Housing Units (actual) |
2,354,402 | 2,527,797 | 2,662,768 | 7.36 | 5.34 | |||||||||||||||
| Renter Occupied Housing Units (actual) |
1,231,182 | 1,326,663 | 1,399,440 | 7.76 | 5.49 | |||||||||||||||
| Vacant Occupied Housing Units (actual) |
503,217 | 528,850 | 537,404 | 5.09 | 1.62 | |||||||||||||||
Source: Nielsen
Demographic data is provided by Nielsen based primarily on US Census data. For non-census year data, Nielsen uses samples and projections to estimate the demographic data. S&P Global Market Intelligence performs calculations on the underlying data provided by Nielsen for some of the data presented on this page.
% Change values are calculated using the underlying actual data.
Demographic Detail: Newton, GA
| Base 2010 |
Current 2017 |
Projected 2022 |
% Change 2010 - 2017 |
% Change 2017 - 2022 |
||||||||||||||||
| Total Population (actual) |
99,958 | 107,577 | 113,991 | 7.62 | 5.96 | |||||||||||||||
| 0-14 Age Group (%) |
23.89 | 21.43 | 19.73 | (3.44 | ) | (2.44 | ) | |||||||||||||
| 15-34 Age Group (%) |
26.47 | 26.90 | 27.95 | 9.39 | 10.09 | |||||||||||||||
| 35-54 Age Group (%) |
29.39 | 27.36 | 25.30 | 0.17 | (2.02 | ) | ||||||||||||||
| 55-69 Age Group (%) |
13.92 | 16.00 | 17.09 | 23.71 | 13.21 | |||||||||||||||
| 70+ Age Group (%) |
6.34 | 8.31 | 9.93 | 41.21 | 26.57 | |||||||||||||||
| Median Age (actual) |
34.70 | 36.30 | 37.00 | 4.61 | 1.93 | |||||||||||||||
| Female Population (actual) |
52,332 | 56,308 | 59,599 | 7.60 | 5.84 | |||||||||||||||
| Male Population (actual) |
47,626 | 51,269 | 54,392 | 7.65 | 6.09 | |||||||||||||||
| Population Density (#/ sq miles) |
367.47 | 395.48 | 419.06 | 7.62 | 5.96 | |||||||||||||||
| Diversity Index (actual) |
NA | NA | NA | NA | NA | |||||||||||||||
| Black (%) |
40.90 | 43.39 | 45.23 | 14.18 | 10.47 | |||||||||||||||
| Asian (%) |
0.91 | 1.13 | 1.30 | 34.22 | 21.55 | |||||||||||||||
| White (%) |
53.78 | 50.50 | 48.08 | 1.07 | 0.88 | |||||||||||||||
| Hispanic (%) |
4.64 | 5.21 | 5.63 | 20.84 | 14.52 | |||||||||||||||
| Pacific Islander (%) |
0.04 | 0.07 | 0.10 | 113.51 | 45.57 | |||||||||||||||
| American Indian/Alaska Native (%) |
0.23 | 0.26 | 0.28 | 20.26 | 14.34 | |||||||||||||||
| Multiple races (%) |
2.08 | 2.34 | 2.54 | 21.03 | 14.64 | |||||||||||||||
| Other (%) |
2.07 | 2.30 | 2.47 | 19.68 | 13.90 | |||||||||||||||
| Total Households (actual) |
34,390 | 36,650 | 38,662 | 6.57 | 5.49 | |||||||||||||||
| < $25K Households (%) |
NA | 24.40 | 23.39 | NA | 1.12 | |||||||||||||||
| $25-49K Households (%) |
NA | 25.96 | 24.54 | NA | (0.28 | ) | ||||||||||||||
| $50-99K Households (%) |
NA | 31.54 | 31.91 | NA | 6.74 | |||||||||||||||
| $100-$199K Households (%) |
NA | 15.43 | 16.85 | NA | 15.17 | |||||||||||||||
| $200K+ Households (%) |
NA | 2.68 | 3.32 | NA | 30.78 | |||||||||||||||
| Average Household Income ($) |
NA | 64,936 | 68,497 | NA | 5.48 | |||||||||||||||
| Median Household Income ($) |
NA | 49,669 | 52,667 | NA | 6.04 | |||||||||||||||
| Per Capita Income ($) |
NA | 22,448 | 23,538 | NA | 4.86 | |||||||||||||||
| Total Owner Occupied Housing Units (actual) |
25,836 | 27,458 | 28,930 | 6.28 | 5.36 | |||||||||||||||
| Renter Occupied Housing Units (actual) |
8,554 | 9,192 | 9,732 | 7.46 | 5.87 | |||||||||||||||
| Vacant Occupied Housing Units (actual) |
3,952 | 4,029 | 4,072 | 1.95 | 1.07 | |||||||||||||||
Source: Nielsen
Demographic data is provided by Nielsen based primarily on US Census data. For non-census year data, Nielsen uses samples and projections to estimate the demographic data. S&P Global Market Intelligence performs calculations on the underlying data provided by Nielsen for some of the data presented on this page.
% Change values are calculated using the underlying actual data.
Demographic Detail: Gwinnett, GA
| Base 2010 |
Current 2017 |
Projected 2022 |
% Change 2010 - 2017 |
% Change 2017 - 2022 |
||||||||||||||||
| Total Population (actual) |
805,321 | 923,142 | 997,990 | 14.63 | 8.11 | |||||||||||||||
| 0-14 Age Group (%) |
24.25 | 22.01 | 20.07 | 4.04 | (1.38 | ) | ||||||||||||||
| 15-34 Age Group (%) |
27.69 | 27.44 | 27.80 | 13.58 | 9.51 | |||||||||||||||
| 35-54 Age Group (%) |
31.73 | 29.34 | 27.30 | 6.01 | 0.57 | |||||||||||||||
| 55-69 Age Group (%) |
12.07 | 15.34 | 17.41 | 45.69 | 22.65 | |||||||||||||||
| 70+ Age Group (%) |
4.26 | 5.87 | 7.43 | 57.95 | 36.81 | |||||||||||||||
| Median Age (actual) |
33.60 | 35.40 | 36.60 | 5.36 | 3.39 | |||||||||||||||
| Female Population (actual) |
408,168 | 471,256 | 509,481 | 15.46 | 8.11 | |||||||||||||||
| Male Population (actual) |
397,153 | 451,886 | 488,509 | 13.78 | 8.10 | |||||||||||||||
| Population Density (#/ sq miles) |
1,871.44 | 2,145.24 | 2,319.17 | 14.63 | 8.11 | |||||||||||||||
| Diversity Index (actual) |
NA | NA | NA | NA | NA | |||||||||||||||
| Black (%) |
23.61 | 27.21 | 29.87 | 32.08 | 18.69 | |||||||||||||||
| Asian (%) |
10.59 | 11.66 | 12.46 | 26.22 | 15.46 | |||||||||||||||
| White (%) |
53.34 | 47.93 | 43.92 | 3.00 | (0.93 | ) | ||||||||||||||
| Hispanic (%) |
20.12 | 20.76 | 21.23 | 18.28 | 10.58 | |||||||||||||||
| Pacific Islander (%) |
0.06 | 0.06 | 0.06 | 11.32 | 6.03 | |||||||||||||||
| American Indian/Alaska Native (%) |
0.50 | 0.49 | 0.48 | 11.59 | 5.88 | |||||||||||||||
| Multiple races (%) |
3.14 | 3.64 | 4.00 | 32.71 | 19.01 | |||||||||||||||
| Other (%) |
8.75 | 9.02 | 9.22 | 18.12 | 10.47 | |||||||||||||||
| Total Households (actual) |
268,519 | 303,641 | 326,638 | 13.08 | 7.57 | |||||||||||||||
| < $25K Households (%) |
NA | 16.45 | 15.17 | NA | (0.83 | ) | ||||||||||||||
| $25-49K Households (%) |
NA | 23.64 | 22.62 | NA | 2.93 | |||||||||||||||
| $50-99K Households (%) |
NA | 32.12 | 31.76 | NA | 6.37 | |||||||||||||||
| $100-$199K Households (%) |
NA | 22.28 | 23.68 | NA | 14.35 | |||||||||||||||
| $200K+ Households (%) |
NA | 5.51 | 6.77 | NA | 32.21 | |||||||||||||||
| Average Household Income ($) |
NA | 82,732 | 88,105 | NA | 6.49 | |||||||||||||||
| Median Household Income ($) |
NA | 63,148 | 66,521 | NA | 5.34 | |||||||||||||||
| Per Capita Income ($) |
NA | 27,361 | 28,974 | NA | 5.90 | |||||||||||||||
| Total Owner Occupied Housing Units (actual) |
189,167 | 214,683 | 231,346 | 13.49 | 7.76 | |||||||||||||||
| Renter Occupied Housing Units (actual) |
79,352 | 88,958 | 95,292 | 12.11 | 7.12 | |||||||||||||||
| Vacant Occupied Housing Units (actual) |
23,028 | 23,587 | 24,105 | 2.43 | 2.20 | |||||||||||||||
Source: Nielsen
Demographic data is provided by Nielsen based primarily on US Census data. For non-census year data, Nielsen uses samples and projections to estimate the demographic data. S&P Global Market Intelligence performs calculations on the underlying data provided by Nielsen for some of the data presented on this page.
% Change values are calculated using the underlying actual data.
Demographic Detail: Barrow, GA
| Base 2010 |
Current 2017 |
Projected 2022 |
% Change 2010 - 2017 |
% Change 2017 - 2022 |
||||||||||||||||
| Total Population (actual) |
69,367 | 77,898 | 84,247 | 12.30 | 8.15 | |||||||||||||||
| 0-14 Age Group (%) |
23.98 | 22.30 | 20.95 | 4.47 | 1.58 | |||||||||||||||
| 15-34 Age Group (%) |
28.08 | 26.83 | 26.35 | 7.30 | 6.24 | |||||||||||||||
| 35-54 Age Group (%) |
28.61 | 27.63 | 27.12 | 8.45 | 6.14 | |||||||||||||||
| 55-69 Age Group (%) |
13.30 | 15.48 | 16.27 | 30.71 | 13.67 | |||||||||||||||
| 70+ Age Group (%) |
6.04 | 7.76 | 9.31 | 44.35 | 29.78 | |||||||||||||||
| Median Age (actual) |
33.70 | 35.60 | 36.90 | 5.64 | 3.65 | |||||||||||||||
| Female Population (actual) |
35,159 | 39,440 | 42,636 | 12.18 | 8.10 | |||||||||||||||
| Male Population (actual) |
34,208 | 38,458 | 41,611 | 12.42 | 8.20 | |||||||||||||||
| Population Density (#/ sq miles) |
432.75 | 485.97 | 525.58 | 12.30 | 8.15 | |||||||||||||||
| Diversity Index (actual) |
NA | NA | NA | NA | NA | |||||||||||||||
| Black (%) |
11.37 | 11.45 | 11.51 | 13.08 | 8.68 | |||||||||||||||
| Asian (%) |
3.43 | 3.81 | 4.09 | 24.52 | 16.05 | |||||||||||||||
| White (%) |
78.81 | 77.30 | 76.19 | 10.16 | 6.59 | |||||||||||||||
| Hispanic (%) |
8.70 | 10.24 | 11.37 | 32.09 | 20.14 | |||||||||||||||
| Pacific Islander (%) |
0.05 | 0.08 | 0.09 | 63.89 | 35.59 | |||||||||||||||
| American Indian/Alaska Native (%) |
0.27 | 0.31 | 0.34 | 28.49 | 18.41 | |||||||||||||||
| Multiple races (%) |
2.32 | 2.68 | 2.95 | 29.98 | 19.04 | |||||||||||||||
| Other (%) |
3.75 | 4.37 | 4.83 | 30.91 | 19.53 | |||||||||||||||
| Total Households (actual) |
23,971 | 26,565 | 28,577 | 10.82 | 7.57 | |||||||||||||||
| < $25K Households (%) |
NA | 19.50 | 18.52 | NA | 2.20 | |||||||||||||||
| $25-49K Households (%) |
NA | 28.32 | 27.00 | NA | 2.58 | |||||||||||||||
| $50-99K Households (%) |
NA | 36.73 | 36.80 | NA | 7.76 | |||||||||||||||
| $100-$199K Households (%) |
NA | 14.12 | 16.00 | NA | 21.83 | |||||||||||||||
| $200K+ Households (%) |
NA | 1.33 | 1.68 | NA | 36.26 | |||||||||||||||
| Average Household Income ($) |
NA | 62,138 | 65,336 | NA | 5.15 | |||||||||||||||
| Median Household Income ($) |
NA | 52,405 | 54,971 | NA | 4.90 | |||||||||||||||
| Per Capita Income ($) |
NA | 21,267 | 22,235 | NA | 4.55 | |||||||||||||||
| Total Owner Occupied Housing Units (actual) |
18,495 | 20,466 | 22,006 | 10.66 | 7.52 | |||||||||||||||
| Renter Occupied Housing Units (actual) |
5,476 | 6,099 | 6,571 | 11.38 | 7.74 | |||||||||||||||
| Vacant Occupied Housing Units (actual) |
2,429 | 2,479 | 2,520 | 2.06 | 1.65 | |||||||||||||||
Source: Nielsen
Demographic data is provided by Nielsen based primarily on US Census data. For non-census year data, Nielsen uses samples and projections to estimate the demographic data. S&P Global Market Intelligence performs calculations on the underlying data provided by Nielsen for some of the data presented on this page.
% Change values are calculated using the underlying actual data.
Demographic Detail: Walton, GA
| Base 2010 |
Current 2017 |
Projected 2022 |
% Change 2010 - 2017 |
% Change 2017 - 2022 |
||||||||||||||||
| Total Population (actual) |
83,768 | 89,994 | 95,120 | 7.43 | 5.70 | |||||||||||||||
| 0-14 Age Group (%) |
22.27 | 20.31 | 18.72 | (2.03 | ) | (2.53 | ) | |||||||||||||
| 15-34 Age Group (%) |
24.43 | 25.51 | 26.66 | 12.19 | 10.48 | |||||||||||||||
| 35-54 Age Group (%) |
29.64 | 26.76 | 24.55 | (3.03 | ) | (3.04 | ) | |||||||||||||
| 55-69 Age Group (%) |
15.93 | 17.56 | 18.67 | 18.42 | 12.39 | |||||||||||||||
| 70+ Age Group (%) |
7.73 | 9.87 | 11.40 | 37.13 | 22.03 | |||||||||||||||
| Median Age (actual) |
37.20 | 38.40 | 39.10 | 3.23 | 1.82 | |||||||||||||||
| Female Population (actual) |
43,005 | 46,202 | 48,818 | 7.43 | 5.66 | |||||||||||||||
| Male Population (actual) |
40,763 | 43,792 | 46,302 | 7.43 | 5.73 | |||||||||||||||
| Population Density (#/ sq miles) |
257.48 | 276.62 | 292.37 | 7.43 | 5.70 | |||||||||||||||
| Diversity Index (actual) |
NA | NA | NA | NA | NA | |||||||||||||||
| Black (%) |
15.64 | 17.42 | 18.73 | 19.63 | 13.68 | |||||||||||||||
| Asian (%) |
1.14 | 1.47 | 1.71 | 38.39 | 23.20 | |||||||||||||||
| White (%) |
80.05 | 77.23 | 75.15 | 3.65 | 2.84 | |||||||||||||||
| Hispanic (%) |
3.20 | 4.35 | 5.19 | 45.81 | 26.30 | |||||||||||||||
| Pacific Islander (%) |
0.06 | 0.09 | 0.11 | 62.50 | 30.77 | |||||||||||||||
| American Indian/Alaska Native (%) |
0.27 | 0.30 | 0.33 | 23.42 | 15.69 | |||||||||||||||
| Multiple races (%) |
1.49 | 1.73 | 1.90 | 24.22 | 16.22 | |||||||||||||||
| Other (%) |
1.35 | 1.76 | 2.07 | 40.14 | 24.16 | |||||||||||||||
| Total Households (actual) |
29,583 | 31,893 | 33,756 | 7.81 | 5.84 | |||||||||||||||
| < $25K Households (%) |
NA | 21.12 | 20.05 | NA | 0.49 | |||||||||||||||
| $25-49K Households (%) |
NA | 25.44 | 24.28 | NA | 1.01 | |||||||||||||||
| $50-99K Households (%) |
NA | 33.54 | 33.45 | NA | 5.54 | |||||||||||||||
| $100-$199K Households (%) |
NA | 17.03 | 18.53 | NA | 15.21 | |||||||||||||||
| $200K+ Households (%) |
NA | 2.87 | 3.69 | NA | 35.92 | |||||||||||||||
| Average Household Income ($) |
NA | 68,008 | 72,132 | NA | 6.06 | |||||||||||||||
| Median Household Income ($) |
NA | 54,096 | 56,950 | NA | 5.28 | |||||||||||||||
| Per Capita Income ($) |
NA | 24,268 | 25,757 | NA | 6.14 | |||||||||||||||
| Total Owner Occupied Housing Units (actual) |
22,330 | 23,971 | 25,324 | 7.35 | 5.64 | |||||||||||||||
| Renter Occupied Housing Units (actual) |
7,253 | 7,922 | 8,432 | 9.22 | 6.44 | |||||||||||||||
| Vacant Occupied Housing Units (actual) |
2,852 | 2,935 | 2,978 | 2.91 | 1.47 | |||||||||||||||
Source: Nielsen
Demographic data is provided by Nielsen based primarily on US Census data. For non-census year data, Nielsen uses samples and projections to estimate the demographic data. S&P Global Market Intelligence performs calculations on the underlying data provided by Nielsen for some of the data presented on this page.
% Change values are calculated using the underlying actual data.
Demographic Detail: Jackson, GA
| Base 2010 |
Current 2017 |
Projected 2022 |
% Change 2010 - 2017 |
% Change 2017 - 2022 |
||||||||||||||||
| Total Population (actual) |
60,485 | 64,854 | 68,944 | 7.22 | 6.31 | |||||||||||||||
| 0-14 Age Group (%) |
22.24 | 20.68 | 19.43 | (0.29 | ) | (0.13 | ) | |||||||||||||
| 15-34 Age Group (%) |
24.91 | 24.74 | 25.46 | 6.46 | 9.41 | |||||||||||||||
| 35-54 Age Group (%) |
29.69 | 27.69 | 25.64 | (0.02 | ) | (1.56 | ) | |||||||||||||
| 55-69 Age Group (%) |
15.60 | 17.40 | 18.24 | 19.57 | 11.46 | |||||||||||||||
| 70+ Age Group (%) |
7.55 | 9.49 | 11.23 | 34.82 | 25.76 | |||||||||||||||
| Median Age (actual) |
36.90 | 38.40 | 39.20 | 4.07 | 2.08 | |||||||||||||||
| Female Population (actual) |
30,483 | 32,664 | 34,742 | 7.15 | 6.36 | |||||||||||||||
| Male Population (actual) |
30,002 | 32,190 | 34,202 | 7.29 | 6.25 | |||||||||||||||
| Population Density (#/ sq miles) |
178.12 | 190.99 | 203.04 | 7.22 | 6.31 | |||||||||||||||
| Diversity Index (actual) |
NA | NA | NA | NA | NA | |||||||||||||||
| Black (%) |
6.78 | 7.25 | 7.60 | 14.67 | 11.39 | |||||||||||||||
| Asian (%) |
1.71 | 1.95 | 2.13 | 22.46 | 16.13 | |||||||||||||||
| White (%) |
86.79 | 85.29 | 84.19 | 5.37 | 4.92 | |||||||||||||||
| Hispanic (%) |
6.18 | 7.16 | 7.89 | 24.28 | 17.10 | |||||||||||||||
| Pacific Islander (%) |
0.02 | 0.04 | 0.05 | 76.92 | 39.13 | |||||||||||||||
| American Indian/Alaska Native (%) |
0.21 | 0.29 | 0.35 | 50.00 | 29.03 | |||||||||||||||
| Multiple races (%) |
1.76 | 2.03 | 2.24 | 23.62 | 16.83 | |||||||||||||||
| Other (%) |
2.73 | 3.14 | 3.45 | 23.65 | 16.72 | |||||||||||||||
| Total Households (actual) |
21,343 | 22,544 | 23,804 | 5.63 | 5.59 | |||||||||||||||
| < $25K Households (%) |
NA | 21.56 | 19.66 | NA | (3.72 | ) | ||||||||||||||
| $25-49K Households (%) |
NA | 23.00 | 21.25 | NA | (2.43 | ) | ||||||||||||||
| $50-99K Households (%) |
NA | 32.44 | 32.32 | NA | 5.20 | |||||||||||||||
| $100-$199K Households (%) |
NA | 19.85 | 22.50 | NA | 19.64 | |||||||||||||||
| $200K+ Households (%) |
NA | 3.14 | 4.27 | NA | 43.44 | |||||||||||||||
| Average Household Income ($) |
NA | 70,938 | 77,511 | NA | 9.27 | |||||||||||||||
| Median Household Income ($) |
NA | 57,111 | 62,006 | NA | 8.57 | |||||||||||||||
| Per Capita Income ($) |
NA | 24,987 | 27,123 | NA | 8.55 | |||||||||||||||
| Total Owner Occupied Housing Units (actual) |
16,429 | 17,409 | 18,409 | 5.97 | 5.74 | |||||||||||||||
| Renter Occupied Housing Units (actual) |
4,914 | 5,135 | 5,395 | 4.50 | 5.06 | |||||||||||||||
| Vacant Occupied Housing Units (actual) |
2,409 | 2,517 | 2,543 | 4.48 | 1.03 | |||||||||||||||
Source: Nielsen
Demographic data is provided by Nielsen based primarily on US Census data. For non-census year data, Nielsen uses samples and projections to estimate the demographic data. S&P Global Market Intelligence performs calculations on the underlying data provided by Nielsen for some of the data presented on this page.
% Change values are calculated using the underlying actual data.
Demographic Detail: Clarke, GA
| Base 2010 |
Current 2017 |
Projected 2022 |
% Change 2010 - 2017 |
% Change 2017 - 2022 |
||||||||||||||||
| Total Population (actual) |
116,714 | 126,464 | 134,269 | 8.35 | 6.17 | |||||||||||||||
| 0-14 Age Group (%) |
15.02 | 15.37 | 15.90 | 10.83 | 9.89 | |||||||||||||||
| 15-34 Age Group (%) |
49.61 | 45.64 | 41.96 | (0.31 | ) | (2.40 | ) | |||||||||||||
| 35-54 Age Group (%) |
18.97 | 20.37 | 22.55 | 16.33 | 17.55 | |||||||||||||||
| 55-69 Age Group (%) |
10.54 | 11.84 | 11.75 | 21.80 | 5.37 | |||||||||||||||
| 70+ Age Group (%) |
5.86 | 6.78 | 7.84 | 25.38 | 22.67 | |||||||||||||||
| Median Age (actual) |
26.30 | 28.20 | 30.10 | 7.22 | 6.74 | |||||||||||||||
| Female Population (actual) |
61,326 | 66,168 | 70,050 | 7.90 | 5.87 | |||||||||||||||
| Male Population (actual) |
55,388 | 60,296 | 64,219 | 8.86 | 6.51 | |||||||||||||||
| Population Density (#/ sq miles) |
979.25 | 1,061.06 | 1,126.54 | 8.35 | 6.17 | |||||||||||||||
| Diversity Index (actual) |
NA | NA | NA | NA | NA | |||||||||||||||
| Black (%) |
26.55 | 27.59 | 28.36 | 12.60 | 9.14 | |||||||||||||||
| Asian (%) |
4.17 | 4.40 | 4.58 | 14.40 | 10.32 | |||||||||||||||
| White (%) |
61.89 | 60.04 | 58.67 | 5.12 | 3.75 | |||||||||||||||
| Hispanic (%) |
10.45 | 11.07 | 11.54 | 14.87 | 10.64 | |||||||||||||||
| Pacific Islander (%) |
0.07 | 0.08 | 0.08 | 15.48 | 11.34 | |||||||||||||||
| American Indian/Alaska Native (%) |
0.21 | 0.27 | 0.31 | 37.25 | 22.71 | |||||||||||||||
| Multiple races (%) |
2.16 | 2.40 | 2.57 | 20.00 | 13.83 | |||||||||||||||
| Other (%) |
4.94 | 5.22 | 5.43 | 14.54 | 10.41 | |||||||||||||||
| Total Households (actual) |
45,414 | 48,264 | 51,486 | 6.28 | 6.68 | |||||||||||||||
| < $25K Households (%) |
NA | 40.84 | 39.48 | NA | 3.12 | |||||||||||||||
| $25-49K Households (%) |
NA | 24.08 | 24.04 | NA | 6.50 | |||||||||||||||
| $50-99K Households (%) |
NA | 21.96 | 22.04 | NA | 7.10 | |||||||||||||||
| $100-$199K Households (%) |
NA | 10.08 | 10.99 | NA | 16.31 | |||||||||||||||
| $200K+ Households (%) |
NA | 3.05 | 3.46 | NA | 20.91 | |||||||||||||||
| Average Household Income ($) |
NA | 53,144 | 55,946 | NA | 5.27 | |||||||||||||||
| Median Household Income ($) |
NA | 32,847 | 34,181 | NA | 4.06 | |||||||||||||||
| Per Capita Income ($) |
NA | 22,369 | 23,519 | NA | 5.14 | |||||||||||||||
| Total Owner Occupied Housing Units (actual) |
19,166 | 20,237 | 21,530 | 5.59 | 6.39 | |||||||||||||||
| Renter Occupied Housing Units (actual) |
26,248 | 28,027 | 29,956 | 6.78 | 6.88 | |||||||||||||||
| Vacant Occupied Housing Units (actual) |
5,654 | 5,805 | 5,878 | 2.67 | 1.26 | |||||||||||||||
Source: Nielsen
Demographic data is provided by Nielsen based primarily on US Census data. For non-census year data, Nielsen uses samples and projections to estimate the demographic data. S&P Global Market Intelligence performs calculations on the underlying data provided by Nielsen for some of the data presented on this page.
% Change values are calculated using the underlying actual data.
Demographic Detail: Oconee, GA
| Base 2010 |
Current 2017 |
Projected 2022 |
% Change 2010 - 2017 |
% Change 2017 - 2022 |
||||||||||||||||
| Total Population (actual) |
32,808 | 37,122 | 40,135 | 13.15 | 8.12 | |||||||||||||||
| 0-14 Age Group (%) |
22.95 | 19.82 | 16.76 | (2.28 | ) | (8.55 | ) | |||||||||||||
| 15-34 Age Group (%) |
21.60 | 24.03 | 27.40 | 25.85 | 23.31 | |||||||||||||||
| 35-54 Age Group (%) |
31.74 | 27.65 | 24.04 | (1.43 | ) | (6.00 | ) | |||||||||||||
| 55-69 Age Group (%) |
16.83 | 19.13 | 20.64 | 28.55 | 16.68 | |||||||||||||||
| 70+ Age Group (%) |
6.88 | 9.38 | 11.15 | 54.34 | 28.58 | |||||||||||||||
| Median Age (actual) |
38.60 | 39.90 | 40.90 | 3.37 | 2.51 | |||||||||||||||
| Female Population (actual) |
16,801 | 18,982 | 20,547 | 12.98 | 8.24 | |||||||||||||||
| Male Population (actual) |
16,007 | 18,140 | 19,588 | 13.33 | 7.98 | |||||||||||||||
| Population Density (#/ sq miles) |
178.07 | 201.48 | 217.83 | 13.15 | 8.12 | |||||||||||||||
| Diversity Index (actual) |
NA | NA | NA | NA | NA | |||||||||||||||
| Black (%) |
4.98 | 5.36 | 5.63 | 21.59 | 13.68 | |||||||||||||||
| Asian (%) |
3.12 | 4.23 | 5.06 | 53.82 | 29.26 | |||||||||||||||
| White (%) |
88.41 | 86.26 | 84.68 | 10.41 | 6.13 | |||||||||||||||
| Hispanic (%) |
4.38 | 4.89 | 5.27 | 26.46 | 16.46 | |||||||||||||||
| Pacific Islander (%) |
0.02 | 0.02 | 0.02 | 20.00 | 33.33 | |||||||||||||||
| American Indian/Alaska Native (%) |
0.15 | 0.23 | 0.29 | 73.47 | 35.29 | |||||||||||||||
| Multiple races (%) |
1.38 | 1.73 | 1.99 | 42.26 | 24.26 | |||||||||||||||
| Other (%) |
1.95 | 2.17 | 2.33 | 25.59 | 16.27 | |||||||||||||||
| Total Households (actual) |
11,622 | 13,280 | 14,417 | 14.27 | 8.56 | |||||||||||||||
| < $25K Households (%) |
NA | 13.52 | 12.69 | NA | 1.95 | |||||||||||||||
| $25-49K Households (%) |
NA | 18.83 | 18.20 | NA | 4.92 | |||||||||||||||
| $50-99K Households (%) |
NA | 30.66 | 29.87 | NA | 5.77 | |||||||||||||||
| $100-$199K Households (%) |
NA | 27.45 | 28.20 | NA | 11.55 | |||||||||||||||
| $200K+ Households (%) |
NA | 9.55 | 11.04 | NA | 25.47 | |||||||||||||||
| Average Household Income ($) |
NA | 101,622 | 106,842 | NA | 5.14 | |||||||||||||||
| Median Household Income ($) |
NA | 76,548 | 80,089 | NA | 4.63 | |||||||||||||||
| Per Capita Income ($) |
NA | 36,468 | 38,488 | NA | 5.54 | |||||||||||||||
| Total Owner Occupied Housing Units (actual) |
9,418 | 10,794 | 11,733 | 14.61 | 8.70 | |||||||||||||||
| Renter Occupied Housing Units (actual) |
2,204 | 2,486 | 2,684 | 12.79 | 7.96 | |||||||||||||||
| Vacant Occupied Housing Units (actual) |
761 | 778 | 804 | 2.23 | 3.34 | |||||||||||||||
Source: Nielsen
Demographic data is provided by Nielsen based primarily on US Census data. For non-census year data, Nielsen uses samples and projections to estimate the demographic data. S&P Global Market Intelligence performs calculations on the underlying data provided by Nielsen for some of the data presented on this page.
% Change values are calculated using the underlying actual data.
EXHIBIT III-1
Newton Federal Bank
General Characteristics of Publicly-Traded Institutions
Exhibit III-1
Characteristics of Publicly-Traded Thrifts
November 25, 2016
| As of | ||||||||||||||||||||||||||||||
| November 25, 2016 | ||||||||||||||||||||||||||||||
| Total | Fiscal | Conv. | Stock | Market | ||||||||||||||||||||||||||
| Ticker |
Financial Institution |
Exchange |
Region |
City |
State |
Assets | Offices | Mth End |
Date | Price | Value | |||||||||||||||||||
| ($Mil) | ($) | ($Mil) | ||||||||||||||||||||||||||||
| ANCB |
Anchor Bancorp |
NASDAQ |
WE |
Lacey |
WA |
$ | 436 | 10 | Jun | 1/26/11 | $ | 25.40 | $ | 64 | ||||||||||||||||
| ASBB |
ASB Bancorp, Inc. |
NASDAQ |
SE |
Asheville |
NC |
797 | 13 | Dec | 10/12/11 | 27.80 | 105 | |||||||||||||||||||
| ACFC |
Atlantic Coast Financial Corporation |
NASDAQ |
SE |
Jacksonville |
FL |
937 | 12 | Dec | 2/4/11 | 7.06 | 109 | |||||||||||||||||||
| BCTF |
Bancorp 34, Inc. |
NASDAQ |
SW |
Alamogordo |
NM |
328 | 4 | Dec | 10/12/16 | 12.37 | 43 | |||||||||||||||||||
| BKMU |
Bank Mutual Corporation |
NASDAQ |
MW |
Milwaukee |
WI |
2,653 | 66 | Dec | 10/30/03 | 9.00 | 411 | |||||||||||||||||||
| BFIN |
BankFinancial Corporation |
NASDAQ |
MW |
Burr Ridge |
IL |
1,540 | 20 | Dec | 6/24/05 | 14.50 | 279 | |||||||||||||||||||
| BYBK |
Bay Bancorp, Inc. |
NASDAQ |
MA |
Columbia |
MD |
606 | 15 | Dec | 1/0/00 | 6.05 | 63 | |||||||||||||||||||
| BNCL |
Beneficial Bancorp, Inc. |
NASDAQ |
MA |
Philadelphia |
PA |
5,580 | 64 | Dec | 1/13/15 | 17.25 | 1,310 | |||||||||||||||||||
| BHBK |
Blue Hills Bancorp, Inc. |
NASDAQ |
NE |
Norwood |
MA |
2,314 | 12 | Dec | 7/22/14 | 18.00 | 482 | |||||||||||||||||||
| BOFI |
BofI Holding, Inc. |
NASDAQ |
WE |
San Diego |
CA |
7,855 | 2 | Jun | 3/14/05 | 24.67 | 1,562 | |||||||||||||||||||
| BYFC |
Broadway Financial Corporation |
NASDAQ |
WE |
Los Angeles |
CA |
413 | 3 | Dec | 1/9/96 | 1.59 | 34 | |||||||||||||||||||
| BLMT |
BSB Bancorp, Inc. |
NASDAQ |
NE |
Belmont |
MA |
2,074 | 7 | Dec | 10/5/11 | 26.70 | 243 | |||||||||||||||||||
| CFFN |
Capitol Federal Financial, Inc. |
NASDAQ |
MW |
Topeka |
KS |
9,267 | 47 | Sep | 12/22/10 | 15.99 | 2,198 | |||||||||||||||||||
| CARV |
Carver Bancorp, Inc. |
NASDAQ |
MA |
New York |
NY |
702 | 9 | Mar | 10/25/94 | 4.00 | 15 | |||||||||||||||||||
| CFBK |
Central Federal Corporation |
NASDAQ |
MW |
Worthington |
OH |
408 | 4 | Dec | 12/30/98 | 1.45 | 23 | |||||||||||||||||||
| CHFN |
Charter Financial Corporation |
NASDAQ |
SE |
West Point |
GA |
1,443 | 20 | Sep | 4/9/13 | 14.47 | 217 | |||||||||||||||||||
| CSBK |
Clifton Bancorp Inc. |
NASDAQ |
MA |
Clifton |
NJ |
1,312 | 12 | Mar | 4/2/14 | 16.54 | 381 | |||||||||||||||||||
| CWAY |
Coastway Bancorp, Inc. |
NASDAQ |
NE |
Warwick |
RI |
633 | 11 | Dec | 1/15/14 | 13.95 | 62 | |||||||||||||||||||
| DCOM |
Dime Community Bancshares, Inc. |
NASDAQ |
MA |
Brooklyn |
NY |
5,822 | 25 | Dec | 6/26/96 | 19.15 | 719 | |||||||||||||||||||
| ESBK |
Elmira Savings Bank |
NASDAQ |
MA |
Elmira |
NY |
567 | 13 | Dec | 3/1/85 | 19.90 | 55 | |||||||||||||||||||
| ENFC |
Entegra Financial Corp. |
NASDAQ |
SE |
Franklin |
NC |
1,218 | 16 | Dec | 10/1/14 | 19.37 | 125 | |||||||||||||||||||
| EQFN |
Equitable Financial Corp. |
NASDAQ |
MW |
Grand Island |
NE |
228 | 6 | Jun | 7/9/15 | 9.10 | 32 | |||||||||||||||||||
| ESSA |
ESSA Bancorp, Inc. |
NASDAQ |
MA |
Stroudsburg |
PA |
1,772 | 27 | Sep | 4/4/07 | 14.89 | 170 | |||||||||||||||||||
| FCAP |
First Capital, Inc. |
NASDAQ |
MW |
Corydon |
IN |
742 | 17 | Dec | 1/4/99 | 32.13 | 107 | |||||||||||||||||||
| FBNK |
First Connecticut Bancorp, Inc. |
NASDAQ |
NE |
Farmington |
CT |
2,832 | 27 | Dec | 6/30/11 | 22.40 | 354 | |||||||||||||||||||
| FDEF |
First Defiance Financial Corp. |
NASDAQ |
MW |
Defiance |
OH |
2,450 | 34 | Dec | 10/2/95 | 46.43 | 417 | |||||||||||||||||||
| FNWB |
First Northwest Bancorp |
NASDAQ |
WE |
Port Angeles |
WA |
1,049 | 11 | Jun | 1/30/15 | 14.89 | 194 | |||||||||||||||||||
| FBC |
Flagstar Bancorp, Inc. |
NYSE |
MW |
Troy |
MI |
14,273 | 99 | Dec | 4/30/97 | 27.78 | 1,573 | |||||||||||||||||||
| FSBW |
FS Bancorp, Inc. |
NASDAQ |
WE |
Mountlake Terrace |
WA |
827 | 12 | Dec | 7/10/12 | 32.65 | 100 | |||||||||||||||||||
| FSBC |
FSB Bancorp, Inc. |
NASDAQ |
MA |
Fairport |
NY |
260 | 5 | Dec | 7/14/16 | 14.50 | 28 | |||||||||||||||||||
| HBK |
Hamilton Bancorp, Inc. |
NASDAQ |
MA |
Towson |
MD |
517 | 7 | Mar | 10/10/12 | 13.98 | 48 | |||||||||||||||||||
| HIFS |
Hingham Institution for Savings |
NASDAQ |
NE |
Hingham |
MA |
1,960 | 13 | Dec | 12/20/88 | 168.32 | 359 | |||||||||||||||||||
| HMNF |
HMN Financial, Inc. |
NASDAQ |
MW |
Rochester |
MN |
686 | 13 | Dec | 6/30/94 | 16.33 | 73 | |||||||||||||||||||
| HFBL |
Home Federal Bancorp, Inc. of Louisiana |
NASDAQ |
SW |
Shreveport |
LA |
390 | 7 | Jun | 12/22/10 | 24.00 | 47 | |||||||||||||||||||
| IROQ |
IF Bancorp, Inc. |
NASDAQ |
MW |
Watseka |
IL |
589 | 6 | Jun | 7/8/11 | 19.35 | 76 | |||||||||||||||||||
| ISBC |
Investors Bancorp, Inc. |
NASDAQ |
MA |
Short Hills |
NJ |
22,536 | 151 | Dec | 5/8/14 | 14.10 | 4,361 | |||||||||||||||||||
| JXSB |
Jacksonville Bancorp, Inc. |
NASDAQ |
MW |
Jacksonville |
IL |
331 | 6 | Dec | 7/15/10 | 29.26 | 53 | |||||||||||||||||||
| KRNY |
Kearny Financial Corp. |
NASDAQ |
MA |
Fairfield |
NJ |
4,523 | 42 | Jun | 5/19/15 | 15.30 | 1,354 | |||||||||||||||||||
| MLVF |
Malvern Bancorp, Inc. |
NASDAQ |
MA |
Paoli |
PA |
821 | 9 | Sep | 10/12/12 | 20.40 | 134 | |||||||||||||||||||
| MELR |
Melrose Bancorp, Inc. |
NASDAQ |
NE |
Melrose |
MA |
267 | 1 | Dec | 10/22/14 | 15.91 | 41 | |||||||||||||||||||
| EBSB |
Meridian Bancorp, Inc. |
NASDAQ |
NE |
Peabody |
MA |
4,173 | 31 | Dec | 7/29/14 | 18.10 | 972 | |||||||||||||||||||
| CASH |
Meta Financial Group, Inc. |
NASDAQ |
MW |
Sioux Falls |
SD |
4,007 | 10 | Sep | 9/20/93 | 94.55 | 852 | |||||||||||||||||||
| MSBF |
MSB Financial Corp. |
NASDAQ |
MA |
Millington |
NJ |
434 | 5 | Dec | 7/17/15 | 13.70 | 78 | |||||||||||||||||||
| NYCB |
New York Community Bancorp, Inc. |
NYSE |
MA |
Westbury |
NY |
49,463 | 263 | Dec | 11/23/93 | 16.01 | 7,798 | |||||||||||||||||||
| NFBK |
Northfield Bancorp, Inc. |
NASDAQ |
MA |
Woodbridge |
NJ |
3,785 | 38 | Dec | 1/25/13 | 18.84 | 911 | |||||||||||||||||||
| NWBI |
Northwest Bancshares, Inc. |
NASDAQ |
MA |
Warren |
PA |
9,715 | 177 | Dec | 12/18/09 | 18.37 | 1,861 | |||||||||||||||||||
| OCFC |
OceanFirst Financial Corp. |
NASDAQ |
MA |
Toms River |
NJ |
4,151 | 51 | Dec | 7/3/96 | 23.99 | 620 | |||||||||||||||||||
| ORIT |
Oritani Financial Corp. |
NASDAQ |
MA |
Township of Washington |
NJ |
3,795 | 27 | Jun | 6/24/10 | 17.65 | 799 | |||||||||||||||||||
| OTTW |
Ottawa Bancorp, Inc. |
NASDAQ |
MW |
Ottawa |
IL |
276 | 3 | Dec | 10/12/16 | 11.73 | 41 | |||||||||||||||||||
| PBHC |
Pathfinder Bancorp, Inc. |
NASDAQ |
MA |
Oswego |
NY |
717 | 18 | Dec | 10/17/14 | 12.51 | 53 | |||||||||||||||||||
| PBBI |
PB Bancorp, Inc. |
NASDAQ |
NE |
Putnam |
CT |
506 | 8 | Jun | 1/8/16 | 9.30 | 73 | |||||||||||||||||||
Exhibit III-1
Characteristics of Publicly-Traded Thrifts
November 25, 2016
| As of | ||||||||||||||||||||||||||||||
| November 25, 2016 | ||||||||||||||||||||||||||||||
| Total | Fiscal | Conv. | Stock | Market | ||||||||||||||||||||||||||
| Ticker |
Financial Institution |
Exchange |
Region |
City |
State |
Assets | Offices | Mth End |
Date | Price | Value | |||||||||||||||||||
| ($Mil) | ($) | ($Mil) | ||||||||||||||||||||||||||||
| PBSK |
Poage Bankshares, Inc. |
NASDAQ |
MW |
Ashland |
KY |
449 | 10 | Dec | 9/13/11 | 18.95 | 70 | |||||||||||||||||||
| PROV |
Provident Financial Holdings, Inc. |
NASDAQ |
WE |
Riverside |
CA |
1,243 | 14 | Jun | 6/28/96 | 20.00 | 160 | |||||||||||||||||||
| PFS |
Provident Financial Services, Inc. |
NYSE |
MA |
Iselin |
NJ |
9,390 | 89 | Dec | 1/16/03 | 27.20 | 1,796 | |||||||||||||||||||
| PBIP |
Prudential Bancorp, Inc. |
NASDAQ |
MA |
Philadelphia |
PA |
559 | 6 | Sep | 10/10/13 | 15.81 | 127 | |||||||||||||||||||
| RNDB |
Randolph Bancorp, Inc. |
NASDAQ |
NE |
Stoughton |
MA |
490 | 6 | Dec | 7/1/16 | 15.13 | 89 | |||||||||||||||||||
| RVSB |
Riverview Bancorp, Inc. |
NASDAQ |
WE |
Vancouver |
WA |
984 | 17 | Mar | 10/1/97 | 5.99 | 135 | |||||||||||||||||||
| SVBI |
Severn Bancorp, Inc. |
NASDAQ |
MA |
Annapolis |
MD |
778 | 5 | Dec | 1/0/00 | 6.65 | 80 | |||||||||||||||||||
| SIFI |
SI Financial Group, Inc. |
NASDAQ |
NE |
Willimantic |
CT |
1,538 | 25 | Dec | 1/13/11 | 14.20 | 173 | |||||||||||||||||||
| SBCP |
Sunshine Bancorp, Inc. |
NASDAQ |
SE |
Plant City |
FL |
564 | 12 | Dec | 7/15/14 | 15.91 | 127 | |||||||||||||||||||
| TBNK |
Territorial Bancorp Inc. |
NASDAQ |
WE |
Honolulu |
HI |
1,849 | 29 | Dec | 7/13/09 | 32.06 | 313 | |||||||||||||||||||
| TSBK |
Timberland Bancorp, Inc. |
NASDAQ |
WE |
Hoquiam |
WA |
891 | 22 | Sep | 1/13/98 | 19.05 | 132 | |||||||||||||||||||
| TRST |
TrustCo Bank Corp NY |
NASDAQ |
MA |
Glenville |
NY |
4,813 | 145 | Dec | 1/0/00 | 8.35 | 799 | |||||||||||||||||||
| UCBA |
United Community Bancorp |
NASDAQ |
MW |
Lawrenceburg |
IN |
528 | 8 | Jun | 1/10/13 | 16.20 | 68 | |||||||||||||||||||
| UCFC |
United Community Financial Corp. |
NASDAQ |
MW |
Youngstown |
OH |
2,160 | 31 | Dec | 7/9/98 | 8.58 | 399 | |||||||||||||||||||
| UBNK |
United Financial Bancorp, Inc. |
NASDAQ |
NE |
Glastonbury |
CT |
6,545 | 54 | Dec | 3/4/11 | 16.84 | 851 | |||||||||||||||||||
| WSBF |
Waterstone Financial, Inc. |
NASDAQ |
MW |
Wauwatosa |
WI |
1,795 | 13 | Dec | 1/23/14 | 18.20 | 535 | |||||||||||||||||||
| WAYN |
Wayne Savings Bancshares, Inc. |
NASDAQ |
MW |
Wooster |
OH |
446 | 11 | Dec | 1/9/03 | 15.05 | 42 | |||||||||||||||||||
| WCFB |
WCF Bancorp, Inc. |
NASDAQ |
MW |
Webster City |
IA |
124 | 2 | Dec | 7/14/16 | 8.90 | 23 | |||||||||||||||||||
| WEBK |
Wellesley Bancorp, Inc. |
NASDAQ |
NE |
Wellesley |
MA |
666 | 6 | Dec | 1/26/12 | 24.45 | 60 | |||||||||||||||||||
| WBB |
Westbury Bancorp, Inc. |
NASDAQ |
MW |
West Bend |
WI |
703 | 8 | Sep | 4/10/13 | 20.04 | 82 | |||||||||||||||||||
| WNEB |
Western New England Bancorp, Inc. |
NASDAQ |
NE |
Westfield |
MA |
1,378 | 14 | Dec | 1/4/07 | 8.50 | 257 | |||||||||||||||||||
| WBKC |
Wolverine Bancorp, Inc. |
NASDAQ |
MW |
Midland |
MI |
369 | 3 | Dec | 1/20/11 | 27.97 | 59 | |||||||||||||||||||
| WSFS |
WSFS Financial Corporation |
NASDAQ |
MA |
Wilmington |
DE |
6,628 | 63 | Dec | 11/26/86 | 42.25 | 1,323 | |||||||||||||||||||
| WVFC |
WVS Financial Corp. |
NASDAQ |
MA |
Pittsburgh |
PA |
335 | 6 | Jun | 11/29/93 | 13.01 | 26 | |||||||||||||||||||
| GCBC |
Greene County Bancorp, Inc. (MHC) |
NASDAQ |
MA |
Catskill |
NY |
893 | 15 | Jun | 12/30/98 | 21.70 | 184 | |||||||||||||||||||
| HONE |
HarborOne Bancorp, Inc. (MHC) |
NASDAQ |
NE |
Brockton |
MA |
2,347 | 17 | Dec | 6/30/16 | 19.62 | 630 | |||||||||||||||||||
| KFFB |
Kentucky First Federal Bancorp (MHC) |
NASDAQ |
MW |
Frankfort |
KY |
295 | 7 | Jun | 3/3/05 | 8.65 | 73 | |||||||||||||||||||
| LSBK |
Lake Shore Bancorp, Inc. (MHC) |
NASDAQ |
MA |
Dunkirk |
NY |
478 | 11 | Dec | 4/4/06 | 14.18 | 86 | |||||||||||||||||||
| MGYR |
Magyar Bancorp, Inc. (MHC) |
NASDAQ |
MA |
New Brunswick |
NJ |
584 | 6 | Sep | 1/24/06 | 10.60 | 62 | |||||||||||||||||||
| OFED |
Oconee Federal Financial Corp. (MHC) |
NASDAQ |
SE |
Seneca |
SC |
484 | 7 | Jun | 1/14/11 | 22.05 | 128 | |||||||||||||||||||
| PVBC |
Provident Bancorp, Inc. (MHC) |
NASDAQ |
NE |
Amesbury |
MA |
768 | 8 | Dec | 7/16/15 | 17.95 | 171 | |||||||||||||||||||
| TFSL |
TFS Financial Corporation (MHC) |
NASDAQ |
MW |
Cleveland |
OH |
12,906 | 38 | Sep | 4/23/07 | 18.82 | 5,335 | |||||||||||||||||||
Source: SNL Financial, LC.
EXHIBIT III-2
Newton Federal Bank
Public Market Pricing of Publicly-Traded Institutions-
$600 Million in Assets or Less
Exhibit III-2
Public Market Pricing Versus Peer Group
Newton Federal Bank
As of November 25, 2016
| Market | Per Share Data | |||||||||||||||||||||||||||||||||||||||||||||||||||||||||||||||||||||||
| Capitalization | Core | Book | Dividends(3) |
Financial Characteristics(5) | ||||||||||||||||||||||||||||||||||||||||||||||||||||||||||||||||||||
| Price/ | Market | 12 Month | Value/ | Pricing Ratios(2) |
Amount/ | Payout | Total | Equity/ | Tang. Eq./ | NPAs/ | Reported | Core | ||||||||||||||||||||||||||||||||||||||||||||||||||||||||||||
| Share | Value | EPS(1) | Share | P/E |
P/B | P/A | P/TB | P/Core |
Share |
Yield |
Ratio(4) |
Assets | Assets | T. Assets | Assets |
ROAA | ROAE | ROAA | ROAE | |||||||||||||||||||||||||||||||||||||||||||||||||||||
| ($) | ($Mil) | ($) | ($) | (x) | (%) | (%) | (%) | (x) | ($) | (%) | (%) | ($Mil) | (%) | (%) | (%) | (%) | (%) | (%) | (%) | |||||||||||||||||||||||||||||||||||||||||||||||||||||
| All Non-MHC Public Companies(6) |
|
|||||||||||||||||||||||||||||||||||||||||||||||||||||||||||||||||||||||
| Averages |
$ | 20.55 | $ | 530.90 | $ | 1.05 | $ | 15.78 | 18.80x | 123.90 | % | 15.20 | % | 134.09 | % | 19.59x | $0.31 | 1.49% | 49.23% | $ | 3,069 | 12.71 | % | 12.15 | % | 1.13% | 0.71 | % | 5.98 | % | 0.73 | % | 6.11 | % | ||||||||||||||||||||||||||||||||||||||
| Median |
$ | 16.33 | $ | 132.28 | $ | 0.78 | $ | 14.42 | 18.77x | 121.48 | % | 14.66 | % | 127.40 | % | 19.15x | $0.24 | 1.43% | 39.21% | $ | 937 | 11.50 | % | 11.12 | % | 0.88% | 0.62 | % | 5.34 | % | 0.64 | % | 5.14 | % | ||||||||||||||||||||||||||||||||||||||
| Comparable Group |
|
|||||||||||||||||||||||||||||||||||||||||||||||||||||||||||||||||||||||
| Averages |
$ | 15.35 | $ | 57.43 | $ | 0.59 | $ | 15.43 | 16.97x | 99.68 | % | 13.66 | % | 104.16 | % | 19.50x | $0.25 | 1.21% | 55.52% | $ | 409 | 14.02 | % | 13.65 | % | 1.30% | 0.55 | % | 4.30 | % | 0.55 | % | 4.31 | % | ||||||||||||||||||||||||||||||||||||||
| Medians |
$ | 15.09 | $ | 50.17 | $ | 0.35 | $ | 15.54 | 16.79x | 98.53 | % | 14.18 | % | 99.99 | % | 18.21x | $0.18 | 1.26% | 42.93% | $ | 424 | 13.81 | % | 13.40 | % | 1.10% | 0.46 | % | 3.43 | % | 0.49 | % | 3.92 | % | ||||||||||||||||||||||||||||||||||||||
| Comparable Group |
||||||||||||||||||||||||||||||||||||||||||||||||||||||||||||||||||||||||
| ANCB |
Anchor Bancorp | WA | $ | 25.40 | $ | 63.63 | $ | 0.29 | $ | 25.46 | NM | 99.77 | % | 14.60 | % | 99.77 | % | NM | NA | NA | NM | $ | 436 | 14.63 | % | 14.63 | % | NA | 0.17 | % | 1.14 | % | 0.17 | % | 1.14 | % | ||||||||||||||||||||||||||||||||||||
| BCTF |
Bancorp 34, Inc. | NM | $ | 12.37 | $ | 42.53 | $ | 0.35 | $ | 9.01 | NM | 137.27 | % | 12.96 | % | 138.61 | % | 34.93x | $0.59 | 0.00% | NM | $ | 328 | 9.44 | % | 9.36 | % | 0.37% | 0.41 | % | 3.85 | % | 0.43 | % | 4.04 | % | ||||||||||||||||||||||||||||||||||||
| BYFC |
Broadway Financial Corporation | CA | $ | 1.59 | $ | 46.23 | $ | 0.23 | $ | 1.63 | 6.91x | 97.29 | % | 11.18 | % | 97.29 | % | 7.01x | $0.04 | 0.00% | NM | $ | 413 | 11.50 | % | 11.50 | % | 2.91% | 1.74 | % | 15.02 | % | 1.71 | % | 14.81 | % | ||||||||||||||||||||||||||||||||||||
| CFBK |
Central Federal Corporation | OH | $ | 1.45 | $ | 23.20 | $ | 0.21 | $ | 1.73 | 6.90x | 83.61 | % | 5.84 | % | 83.61 | % | 6.90x | $0.00 | 0.00% | NM | $ | 408 | 9.58 | % | 9.58 | % | 1.03% | 1.31 | % | 12.37 | % | 1.31 | % | 12.37 | % | ||||||||||||||||||||||||||||||||||||
| ESBK |
Elmira Savings Bank | NY | $ | 19.90 | $ | 54.54 | $ | 1.23 | $ | 16.80 | 15.79x | 118.47 | % | 9.78 | % | 161.90 | % | 16.23x | $0.92 | 4.62% | 73.02% | $ | 567 | 9.83 | % | 7.83 | % | NA | 0.77 | % | 7.81 | % | 0.75 | % | 7.67 | % | ||||||||||||||||||||||||||||||||||||
| EQFN |
Equitable Financial Corp. | NE | $ | 9.10 | $ | 31.64 | $ | 0.32 | $ | 10.43 | 29.35x | 87.24 | % | 13.89 | % | 87.24 | % | 28.58x | NA | NA | NM | $ | 228 | 15.92 | % | 15.92 | % | NA | 0.46 | % | 3.00 | % | 0.47 | % | 3.08 | % | ||||||||||||||||||||||||||||||||||||
| FSBC |
FSB Bancorp, Inc. | NY | $ | 14.50 | $ | 28.15 | $ | 0.28 | $ | 16.20 | NM | 89.51 | % | 10.84 | % | 89.51 | % | NM | NA | NA | NM | $ | 260 | 12.11 | % | 12.11 | % | 0.01% | 0.22 | % | 2.52 | % | 0.21 | % | 2.42 | % | ||||||||||||||||||||||||||||||||||||
| HBK |
Hamilton Bancorp, Inc. | MD | $ | 13.98 | $ | 47.71 | $ | 0.15 | $ | 18.10 | NM | 77.19 | % | 9.22 | % | 91.08 | % | NM | NA | NA | NM | $ | 517 | 11.95 | % | 10.32 | % | 1.16% | -0.01 | % | -0.04 | % | 0.11 | % | 0.78 | % | ||||||||||||||||||||||||||||||||||||
| HFBL |
Home Federal Bancorp, Inc. of Louisiana | LA | $ | 24.00 | $ | 47.19 | $ | 1.80 | $ | 22.44 | 13.33x | 106.94 | % | 12.07 | % | 106.94 | % | 13.33x | $0.36 | 1.50% | 18.89% | $ | 390 | 11.29 | % | 11.29 | % | 0.24% | 0.92 | % | 7.63 | % | 0.92 | % | 7.63 | % | ||||||||||||||||||||||||||||||||||||
| IROQ |
IF Bancorp, Inc. | IL | $ | 19.35 | $ | 76.44 | $ | 0.98 | $ | 21.12 | 17.92x | 91.60 | % | 13.04 | % | 91.60 | % | 19.77x | $0.16 | 0.83% | 14.81% | $ | 589 | 14.23 | % | 14.23 | % | 0.82% | 0.70 | % | 4.93 | % | 0.64 | % | 4.46 | % | ||||||||||||||||||||||||||||||||||||
| JXSB |
Jacksonville Bancorp, Inc. | IL | $ | 29.26 | $ | 52.63 | $ | 1.57 | $ | 26.84 | 17.21x | 109.00 | % | 15.91 | % | 115.53 | % | 18.58x | $0.40 | 1.37% | 81.18% | $ | 331 | 14.60 | % | 13.89 | % | 1.33% | 0.99 | % | 6.53 | % | 0.92 | % | 6.05 | % | ||||||||||||||||||||||||||||||||||||
| MELR |
Melrose Bancorp, Inc. | MA | $ | 15.91 | $ | 41.39 | $ | 0.28 | $ | 16.61 | NM | 95.77 | % | 15.54 | % | 95.77 | % | NM | NA | NA | NM | $ | 267 | 16.23 | % | 16.23 | % | 0.00% | 0.42 | % | 2.26 | % | 0.29 | % | 1.55 | % | ||||||||||||||||||||||||||||||||||||
| MSBF |
MSB Financial Corp. | NJ | $ | 13.70 | $ | 78.24 | $ | 0.12 | $ | 12.71 | NM | 107.81 | % | 18.04 | % | 107.81 | % | NM | $0.00 | 0.00% | NM | $ | 434 | 16.74 | % | 16.74 | % | 3.53% | 0.18 | % | 0.90 | % | 0.26 | % | 1.34 | % | ||||||||||||||||||||||||||||||||||||
| OTTW |
Ottawa Bancorp, Inc. | IL | $ | 11.73 | $ | 40.55 | $ | 0.41 | $ | 9.23 | 30.40x | 127.06 | % | 14.66 | % | 131.32 | % | 28.82x | $0.00 | 0.00% | NM | $ | 276 | 11.54 | % | 11.21 | % | 2.00% | 0.59 | % | 4.15 | % | 0.62 | % | 4.37 | % | ||||||||||||||||||||||||||||||||||||
| PBBI |
PB Bancorp, Inc. | CT | $ | 9.30 | $ | 73.29 | $ | 0.12 | $ | 10.85 | NM | 85.75 | % | 14.47 | % | 93.30 | % | NM | $0.12 | 1.29% | 91.67% | $ | 506 | 16.87 | % | 15.72 | % | NA | 0.18 | % | 1.23 | % | 0.19 | % | 1.27 | % | ||||||||||||||||||||||||||||||||||||
| PBSK |
Poage Bankshares, Inc. | KY | $ | 18.95 | $ | 70.37 | $ | 0.60 | $ | 18.78 | NM | 100.89 | % | 15.68 | % | 104.44 | % | 31.57x | $0.32 | 1.69% | 53.85% | $ | 449 | 15.54 | % | 15.09 | % | 1.78% | 0.43 | % | 2.68 | % | 0.50 | % | 3.08 | % | ||||||||||||||||||||||||||||||||||||
| PBIP |
Prudential Bancorp, Inc. | PA | $ | 15.81 | $ | 127.20 | $ | 0.35 | $ | 14.17 | NM | 111.58 | % | 22.74 | % | 111.58 | % | NM | $0.12 | 0.76% | 33.33% | $ | 559 | 20.38 | % | 20.38 | % | 3.39% | 0.51 | % | 2.36 | % | 0.49 | % | 2.29 | % | ||||||||||||||||||||||||||||||||||||
| RNDB |
Randolph Bancorp, Inc. | MA | $ | 15.13 | $ | 88.78 | NA | $ | 14.63 | NM | 103.41 | % | 18.13 | % | 103.54 | % | NM | NA | NA | NM | $ | 490 | 17.54 | % | 17.52 | % | 1.41% | NA | 2.73 | % | NA | 3.80 | % | |||||||||||||||||||||||||||||||||||||||
| SBCP |
Sunshine Bancorp, Inc. | FL | $ | 15.91 | $ | 127.20 | ($ | 0.33 | ) | $ | 13.82 | NM | 115.10 | % | 14.84 | % | 133.49 | % | NM | NA | NA | NM | $ | 564 | 12.89 | % | 11.32 | % | 0.41% | -0.26 | % | -1.85 | % | -0.29 | % | -2.04 | % | |||||||||||||||||||||||||||||||||||
| UCBA |
United Community Bancorp | IN | $ | 16.20 | $ | 68.01 | $ | 0.81 | $ | 16.83 | 18.84x | 96.23 | % | 12.88 | % | 100.20 | % | 20.07x | $0.24 | 1.48% | 27.91% | $ | 528 | 13.38 | % | 12.92 | % | 1.02% | 0.68 | % | 5.14 | % | 0.63 | % | 4.83 | % | ||||||||||||||||||||||||||||||||||||
| WAYN |
Wayne Savings Bancshares, Inc. | OH | $ | 15.05 | $ | 41.87 | $ | 0.92 | $ | 14.88 | 16.36x | 101.12 | % | 9.39 | % | 105.50 | % | 16.36x | $0.36 | 2.39% | 39.13% | $ | 446 | 9.29 | % | 8.94 | % | NA | 0.57 | % | 6.20 | % | 0.57 | % | 6.20 | % | ||||||||||||||||||||||||||||||||||||
| WCFB |
WCF Bancorp, Inc. | IA | $ | 8.90 | $ | 22.81 | $ | 0.07 | $ | 11.54 | NM | 77.12 | % | 18.39 | % | 77.30 | % | NM | $0.20 | 2.25% | 158.74% | $ | 124 | 23.85 | % | 23.80 | % | NA | 0.19 | % | 1.44 | % | 0.13 | % | 0.98 | % | ||||||||||||||||||||||||||||||||||||
| WBKC |
Wolverine Bancorp, Inc. | MI | $ | 27.97 | $ | 58.70 | $ | 2.14 | $ | 29.97 | 13.07x | 93.33 | % | 16.05 | % | 93.33 | % | 13.07x | NA | NA | 46.73% | $ | 369 | 17.20 | % | 17.20 | % | 1.92% | 1.13 | % | 7.00 | % | 1.13 | % | 7.00 | % | ||||||||||||||||||||||||||||||||||||
| WVFC |
WVS Financial Corp. | PA | $ | 13.01 | $ | 26.13 | $ | 0.73 | $ | 16.44 | 17.58x | 79.14 | % | 7.80 | % | 79.14 | % | 17.84x | $0.16 | 1.23% | 27.03% | $ | 335 | 9.85 | % | 9.85 | % | 0.08% | 0.42 | % | 4.32 | % | 0.42 | % | 4.26 | % | ||||||||||||||||||||||||||||||||||||
| (1) | Core income, on a diluted per-share basis. Core income is net income after taxes and before extraordinary items, less net income attributable to noncontrolling interest, gain on the sale of securities, amortization of intangibles, goodwill and nonrecurring items. Assumed tax rate is 35%. |
| (2) | P/E = Price to earnings; P/B = Price to book; P/A = Price to assets; P/TB = Price to tangible book value; and P/Core = Price to core earnings. P/E and P/Core =NM if the ratio is negative or above 35x. |
| (3) | Indicated 12 month dividend, based on last quarterly dividend declared. |
| (4) | Indicated 12 month dividend as a percent of trailing 12 month earnings. |
| (5) | ROAA (return on average assets) and ROAE (return on average equity) are indicated ratios based on trailing 12 month earnings and average equity and assets balances. |
| (6) | Excludes from averages and medians those companies the subject of actual or rumored acquisition activities or unusual operating characteristics. |
Source: SNL Financial, LC. and RP Financial, LC. calculations. The information provided in this report has been obtained from sources we believe are reliable, but we cannot guarantee the accuracy or completeness of such information.
Copyright (c) 2016 by RP® Financial, LC.
Exhibit III-3
Peer Group Market Area Comparative Analysis
| Proj. | Per Capita Income |
Deposit | ||||||||||||||||||||||||||||||||
| Population | Pop. | 2010-2016 | 2016-2022 | 2016 | % State | Market | ||||||||||||||||||||||||||||
| Institution |
County | 2010 | 2016 | 2022 | % Change | % Change | Amount | Average | Share(1) | |||||||||||||||||||||||||
| Anchor Bancorp - WA |
Thurston | 252,264 | 271,588 | 293,737 | 1.2 | % | 1.3 | % | 29,507 | 89.5 | % | 1.49 | % | |||||||||||||||||||||
| Equitable Financial Corp. - NE |
Hall | 58,607 | 62,421 | 64,882 | 1.1 | % | 0.6 | % | 24,046 | 82.5 | % | 5.62 | % | |||||||||||||||||||||
| IF Bancorp, Inc. - IL |
Iroquois | 29,718 | 28,599 | 27,804 | -0.6 | % | -0.5 | % | 27,730 | 87.6 | % | 25.29 | % | |||||||||||||||||||||
| Jacksonville Bancorp, Inc. - IL |
Morgan | 35,547 | 34,692 | 34,215 | -0.4 | % | -0.2 | % | 29,817 | 94.2 | % | 26.52 | % | |||||||||||||||||||||
| Melrose Bancorp, Inc. - MA |
Middlesex | 1,503,085 | 1,592,352 | 1,678,407 | 1.0 | % | 0.9 | % | 47,267 | 121.9 | % | 0.39 | % | |||||||||||||||||||||
| MSB Financial Corp. - NJ |
Morris | 492,276 | 501,318 | 507,646 | 0.3 | % | 0.2 | % | 52,009 | 138.7 | % | 0.83 | % | |||||||||||||||||||||
| Poage Bankshares, Inc. - KY |
Boyd | 49,542 | 48,562 | 47,255 | -0.3 | % | -0.5 | % | 26,801 | 105.4 | % | 20.76 | % | |||||||||||||||||||||
| Prudential Bancorp, Inc. - PA |
Philadelphia | 1,526,006 | 1,569,473 | 1,608,752 | 0.5 | % | 0.4 | % | 23,204 | 75.1 | % | 0.98 | % | |||||||||||||||||||||
| United Community Bancorp - IN |
Dearborn | 50,047 | 49,234 | 49,348 | -0.3 | % | 0.0 | % | 26,820 | 103.0 | % | 40.83 | % | |||||||||||||||||||||
| Wolverine Bancorp, Inc. - MI |
Midland | 83,629 | 83,266 | 84,018 | -0.1 | % | 0.1 | % | 30,041 | 108.2 | % | 16.04 | % | |||||||||||||||||||||
| Averages: | 408,072 | 424,151 | 439,606 | 0.2 | % | 0.3 | % | 31,724 | 100.6 | % | 13.88 | % | ||||||||||||||||||||||
| Medians: | 71,118 | 72,844 | 74,450 | 0.1 | % | 0.2 | % | 28,619 | 98.6 | % | 10.83 | % | ||||||||||||||||||||||
| Newton Federal Bank - GA |
Newton | 99,958 | 105,461 | 113,991 | 1.3 | % | 1.6 | % | 22,587 | 84.2 | % | 20.90 | % | |||||||||||||||||||||
| (1) | Total institution deposits in headquarters county as percent of total county deposits as of June 30, 2016. |
Sources: SNL Financial, LC.
EXHIBIT IV-1
Newton Federal Bank
Thrift Stock Prices: As of November 25, 2016
RP® Financial, LC.
Exhibit IV-1A
Weekly Thrift Market Line - Part One
Prices As of November 25, 2016
| Market Capitalization | Price Change Data | Current Per Share Financials | ||||||||||||||||||||||||||||||||||||||||||||||||||||||||||
| Price/ | Shares | Market | 52 Week (1) | % Change From | LTM | LTM Core | BV/ | TBV/ | Assets/ | |||||||||||||||||||||||||||||||||||||||||||||||||||
| Share(1) | Outstanding | Capitalization | High | Low | Last Wk | Last Wk | 52 Wks (2) | MRY (2) | EPS (3) | EPS (3) | Share | Share (4) | Share | |||||||||||||||||||||||||||||||||||||||||||||||
| ($) | (000) | ($Mil) | ($) | ($) | ($) | (%) | (%) | (%) | ($) | ($) | ($) | ($) | ($) | |||||||||||||||||||||||||||||||||||||||||||||||
| Companies |
||||||||||||||||||||||||||||||||||||||||||||||||||||||||||||
| ANCB |
Anchor Bancorp | WA | 25.40 | 2,505 | 63.6 | 26.39 | 22.61 | 26.00 | -2.31 | -0.39 | -1.89 | 0.29 | 0.29 | 25.46 | 25.46 | 174.02 | ||||||||||||||||||||||||||||||||||||||||||||
| ASBB |
ASB Bancorp, Inc. | NC | 27.80 | 3,787 | 105.3 | 27.80 | 24.07 | 27.45 | 1.28 | 9.17 | 7.10 | 1.47 | 1.21 | 24.12 | 24.12 | 210.50 | ||||||||||||||||||||||||||||||||||||||||||||
| ACFC |
Atlantic Coast Financial Corporation | FL | 7.06 | 15,509 | 109.5 | 7.08 | 5.03 | 6.79 | 3.98 | 17.08 | 20.48 | 0.33 | 0.27 | 5.55 | 5.55 | 60.41 | ||||||||||||||||||||||||||||||||||||||||||||
| BCTF |
Bancorp 34, Inc. | NM | 12.37 | 3,438 | 42.5 | 13.15 | 7.91 | 12.29 | 0.62 | 44.71 | 40.69 | 0.34 | 0.35 | 9.01 | 8.92 | 95.43 | ||||||||||||||||||||||||||||||||||||||||||||
| BKMU |
Bank Mutual Corporation | WI | 9.00 | 45,672 | 411.0 | 9.00 | 7.00 | 8.70 | 3.45 | 17.65 | 15.38 | 0.37 | 0.38 | 6.32 | 6.32 | 58.10 | ||||||||||||||||||||||||||||||||||||||||||||
| BFIN |
BankFinancial Corporation | IL | 14.50 | 19,271 | 279.4 | 14.60 | 11.38 | 14.25 | 1.75 | 11.62 | 14.81 | 0.38 | 0.40 | 10.57 | 10.52 | 79.93 | ||||||||||||||||||||||||||||||||||||||||||||
| BYBK |
Bay Bancorp, Inc. | MD | 6.05 | 10,370 | 62.7 | 6.20 | 4.57 | 5.95 | 1.68 | 16.35 | 19.57 | 0.14 | 0.18 | 6.28 | 5.96 | 58.47 | ||||||||||||||||||||||||||||||||||||||||||||
| BNCL |
Beneficial Bancorp, Inc. | PA | 17.25 | 75,914 | 1,309.5 | 17.25 | 12.30 | 16.65 | 3.60 | 24.46 | 29.50 | 0.31 | 0.40 | 13.41 | 11.13 | 73.51 | ||||||||||||||||||||||||||||||||||||||||||||
| BHBK |
Blue Hills Bancorp, Inc. | MA | 18.00 | 26,782 | 482.1 | 18.00 | 13.22 | 17.50 | 2.86 | 9.49 | 17.57 | 0.28 | 0.27 | 14.43 | 14.03 | 86.39 | ||||||||||||||||||||||||||||||||||||||||||||
| BOFI |
BofI Holding, Inc. | CA | 24.67 | 63,299 | 1,561.6 | 25.13 | 13.47 | 23.49 | 5.02 | 21.29 | 17.20 | 1.91 | 1.89 | 11.32 | 11.32 | 124.09 | ||||||||||||||||||||||||||||||||||||||||||||
| BYFC |
Broadway Financial Corporation | CA | 1.59 | 29,077 | 46.2 | 2.50 | 1.27 | 1.60 | -0.63 | 18.66 | 5.30 | 0.23 | 0.23 | 1.63 | 1.63 | 14.22 | ||||||||||||||||||||||||||||||||||||||||||||
| BLMT |
BSB Bancorp, Inc. | MA | 26.70 | 9,102 | 243.0 | 26.88 | 20.72 | 25.75 | 3.69 | 19.20 | 14.15 | 1.19 | NA | 17.23 | 17.23 | 227.83 | ||||||||||||||||||||||||||||||||||||||||||||
| CFFN |
Capitol Federal Financial, Inc. | KS | 15.99 | 137,486 | 2,198.4 | 16.39 | 11.39 | 16.22 | -1.42 | 25.02 | 27.31 | 0.63 | NA | 10.13 | 10.13 | 67.40 | ||||||||||||||||||||||||||||||||||||||||||||
| CARV |
Carver Bancorp, Inc. | NY | 4.00 | 3,696 | 14.8 | 5.99 | 1.92 | 4.00 | 0.00 | -33.44 | 6.67 | -0.19 | -0.42 | 2.51 | 2.51 | 189.86 | ||||||||||||||||||||||||||||||||||||||||||||
| CFBK |
Central Federal Corporation | OH | 1.45 | 16,003 | 23.2 | 1.68 | 1.10 | 1.49 | -2.68 | 4.50 | 9.85 | 0.21 | 0.21 | 1.73 | 1.73 | 25.52 | ||||||||||||||||||||||||||||||||||||||||||||
| CHFN |
Charter Financial Corporation | GA | 14.47 | 15,031 | 217.5 | 14.70 | 12.34 | 14.03 | 3.14 | 8.07 | 9.54 | 0.79 | 0.86 | 13.52 | 11.36 | 96.00 | ||||||||||||||||||||||||||||||||||||||||||||
| CSBK |
Clifton Bancorp Inc. | NJ | 16.54 | 23,046 | 381.2 | 16.73 | 13.09 | 16.54 | 0.00 | 12.14 | 15.34 | 0.19 | 0.19 | 13.12 | 13.12 | 56.94 | ||||||||||||||||||||||||||||||||||||||||||||
| CWAY |
Coastway Bancorp, Inc. | RI | 13.95 | 4,467 | 62.3 | 14.01 | 11.29 | 13.45 | 3.72 | 23.89 | 6.65 | 0.79 | 0.79 | 15.52 | 15.52 | 141.70 | ||||||||||||||||||||||||||||||||||||||||||||
| DCOM |
Dime Community Bancshares, Inc. | NY | 19.15 | 37,544 | 719.0 | 19.25 | 15.61 | 18.65 | 2.68 | 3.51 | 9.49 | 2.26 | 1.05 | 14.79 | 13.31 | 155.07 | ||||||||||||||||||||||||||||||||||||||||||||
| ESBK |
Elmira Savings Bank | NY | 19.90 | 2,741 | 54.5 | 21.50 | 16.83 | 19.34 | 2.90 | 4.74 | 0.09 | 1.26 | 1.23 | 16.80 | 12.29 | 207.03 | ||||||||||||||||||||||||||||||||||||||||||||
| ENFC |
Entegra Financial Corp. | NC | 19.37 | 6,442 | 124.8 | 19.90 | 16.11 | 19.10 | 1.44 | 5.35 | 0.09 | 0.92 | 1.04 | 21.37 | 20.90 | 189.14 | ||||||||||||||||||||||||||||||||||||||||||||
| EQFN |
Equitable Financial Corp. | NE | 9.10 | 3,477 | 31.6 | 9.25 | 8.05 | 8.88 | 2.52 | 12.07 | 3.29 | 0.31 | 0.32 | 10.43 | 10.43 | 65.53 | ||||||||||||||||||||||||||||||||||||||||||||
| ESSA |
ESSA Bancorp, Inc. | PA | 14.89 | 11,394 | 169.7 | 14.90 | 12.69 | 14.78 | 0.74 | 11.20 | 8.85 | 0.73 | 0.71 | 15.48 | 14.05 | 155.57 | ||||||||||||||||||||||||||||||||||||||||||||
| FCAP |
First Capital, Inc. | IN | 32.13 | 3,338 | 107.2 | 35.00 | 23.50 | 32.16 | -0.11 | 25.98 | 23.08 | 1.91 | 2.04 | 23.55 | 21.22 | 222.34 | ||||||||||||||||||||||||||||||||||||||||||||
| FBNK |
First Connecticut Bancorp, Inc. | CT | 22.40 | 15,809 | 354.1 | 22.50 | 14.42 | 21.15 | 5.91 | 25.56 | 28.66 | 0.89 | 0.87 | 16.17 | 16.17 | 179.13 | ||||||||||||||||||||||||||||||||||||||||||||
| FDEF |
First Defiance Financial Corp. | OH | 46.43 | 8,981 | 417.0 | 46.83 | 34.80 | 45.80 | 1.38 | 13.11 | 22.90 | 3.08 | 3.10 | 32.53 | 25.49 | 272.80 | ||||||||||||||||||||||||||||||||||||||||||||
| FNWB |
First Northwest Bancorp | WA | 14.89 | 13,008 | 193.7 | 14.92 | 11.99 | 14.79 | 0.68 | 6.05 | 5.23 | 0.29 | 0.27 | 14.60 | 14.60 | 80.61 | ||||||||||||||||||||||||||||||||||||||||||||
| FBC |
Flagstar Bancorp, Inc. | MI | 27.78 | 56,606 | 1,572.5 | 29.29 | 17.25 | 28.22 | -1.56 | 12.65 | 20.21 | 2.60 | 2.74 | 22.72 | 22.72 | 252.14 | ||||||||||||||||||||||||||||||||||||||||||||
| FSBW |
FS Bancorp, Inc. | WA | 32.65 | 3,058 | 99.8 | 32.75 | 22.05 | 32.09 | 1.72 | 25.56 | 25.58 | 3.35 | 3.58 | 26.02 | 24.65 | 270.62 | ||||||||||||||||||||||||||||||||||||||||||||
| FSBC |
FSB Bancorp, Inc. | NY | 14.50 | 1,942 | 28.2 | 14.89 | 9.19 | 14.32 | 1.26 | 46.81 | 40.28 | 0.30 | 0.28 | 16.20 | 16.20 | 133.76 | ||||||||||||||||||||||||||||||||||||||||||||
| HBK |
Hamilton Bancorp, Inc. | MD | 13.98 | 3,414 | 47.7 | 15.11 | 13.19 | 13.75 | 1.64 | -5.89 | -2.00 | -0.01 | 0.15 | 18.10 | 15.34 | 151.50 | ||||||||||||||||||||||||||||||||||||||||||||
| HIFS |
Hingham Institution for Savings | MA | 168.32 | 2,131 | 358.6 | 171.00 | 115.05 | 164.76 | 2.16 | 27.21 | 40.50 | 10.41 | 10.31 | 72.35 | 72.35 | 920.01 | ||||||||||||||||||||||||||||||||||||||||||||
| HMNF |
HMN Financial, Inc. | MN | 16.33 | 4,489 | 73.3 | 16.45 | 10.81 | 15.80 | 3.33 | 36.22 | 41.35 | 1.22 | 1.23 | 16.67 | 16.39 | 152.75 | ||||||||||||||||||||||||||||||||||||||||||||
| HFBL |
Home Federal Bancorp, Inc. of Louisiana | LA | 24.00 | 1,966 | 47.2 | 25.00 | 21.20 | 24.00 | 0.00 | 4.48 | 3.23 | 1.80 | 1.80 | 22.44 | 22.44 | 198.13 | ||||||||||||||||||||||||||||||||||||||||||||
| IROQ |
IF Bancorp, Inc. | IL | 19.35 | 3,950 | 76.4 | 19.97 | 17.25 | 19.14 | 1.10 | 10.26 | 4.59 | 1.08 | 0.98 | 21.12 | 21.12 | 149.02 | ||||||||||||||||||||||||||||||||||||||||||||
| ISBC |
Investors Bancorp, Inc. | NJ | 14.10 | 309,294 | 4,361.0 | 14.12 | 10.67 | 13.79 | 2.25 | 10.07 | 13.34 | 0.58 | 0.58 | 10.03 | 9.75 | 72.86 | ||||||||||||||||||||||||||||||||||||||||||||
| JXSB |
Jacksonville Bancorp, Inc. | IL | 29.26 | 1,799 | 52.6 | 33.08 | 23.20 | 29.89 | -2.11 | 19.23 | 11.34 | 1.70 | 1.57 | 26.84 | 25.33 | 183.88 | ||||||||||||||||||||||||||||||||||||||||||||
| KRNY |
Kearny Financial Corp. | NJ | 15.30 | 88,521 | 1,354.4 | 15.60 | 11.31 | 15.15 | 0.99 | 23.09 | 20.76 | 0.19 | 0.19 | 12.57 | 11.34 | 51.10 | ||||||||||||||||||||||||||||||||||||||||||||
| MLVF |
Malvern Bancorp, Inc. | PA | 20.40 | 6,560 | 133.8 | 20.47 | 15.00 | 19.25 | 5.97 | 26.16 | 16.17 | 1.86 | 1.80 | 14.42 | 14.42 | 125.19 | ||||||||||||||||||||||||||||||||||||||||||||
| MELR |
Melrose Bancorp, Inc. | MA | 15.91 | 2,602 | 41.4 | 17.00 | 14.60 | 16.35 | -2.72 | 7.83 | 4.09 | 0.41 | 0.28 | 16.61 | 16.61 | 102.50 | ||||||||||||||||||||||||||||||||||||||||||||
| EBSB |
Meridian Bancorp, Inc. | MA | 18.10 | 53,714 | 972.2 | 18.95 | 12.28 | 17.85 | 1.40 | 22.80 | 28.37 | 0.56 | 0.56 | 11.12 | 10.86 | 77.69 | ||||||||||||||||||||||||||||||||||||||||||||
| CASH |
Meta Financial Group, Inc. | SD | 94.55 | 9,006 | 851.5 | 95.10 | 36.22 | 90.90 | 4.02 | 112.90 | 105.86 | 3.92 | 4.65 | 39.30 | NA | 444.88 | ||||||||||||||||||||||||||||||||||||||||||||
| MSBF |
MSB Financial Corp. | NJ | 13.70 | 5,711 | 78.2 | 14.00 | 11.85 | 13.95 | -1.79 | 15.51 | 9.60 | 0.12 | 0.12 | 12.71 | 12.71 | 75.93 | ||||||||||||||||||||||||||||||||||||||||||||
| NYCB |
New York Community Bancorp, Inc. | NY | 16.01 | 487,057 | 7,797.8 | 17.05 | 13.74 | 15.87 | 0.88 | -0.93 | -1.90 | -0.08 | 1.20 | 12.50 | 7.50 | 101.55 | ||||||||||||||||||||||||||||||||||||||||||||
| NFBK |
Northfield Bancorp, Inc. | NJ | 18.84 | 48,333 | 910.6 | 18.84 | 14.31 | 18.42 | 2.28 | 18.42 | 18.34 | 0.52 | 0.58 | 12.84 | 12.00 | 78.30 | ||||||||||||||||||||||||||||||||||||||||||||
| NWBI |
Northwest Bancshares, Inc. | PA | 18.37 | 101,303 | 1,860.9 | 18.38 | 11.78 | 18.04 | 1.83 | 32.16 | 37.19 | 0.41 | 0.78 | 11.48 | 8.11 | 95.90 | ||||||||||||||||||||||||||||||||||||||||||||
| OCFC |
OceanFirst Financial Corp. | NJ | 23.99 | 25,851 | 620.2 | 24.00 | 15.98 | 23.32 | 2.87 | 22.09 | 19.77 | 1.07 | 1.41 | 16.14 | 13.42 | 160.58 | ||||||||||||||||||||||||||||||||||||||||||||
| ORIT |
Oritani Financial Corp. | NJ | 17.65 | 45,244 | 798.5 | 18.00 | 14.95 | 17.65 | 0.00 | 2.92 | 6.97 | 1.12 | 0.87 | 11.94 | 11.94 | 83.87 | ||||||||||||||||||||||||||||||||||||||||||||
| OTTW |
Ottawa Bancorp, Inc. | IL | 11.73 | 3,456 | 40.5 | 11.75 | 8.39 | 11.73 | 0.02 | 38.48 | 39.17 | 0.39 | 0.41 | 9.23 | 8.93 | 79.88 | ||||||||||||||||||||||||||||||||||||||||||||
| PBHC |
Pathfinder Bancorp, Inc. | NY | 12.51 | 4,230 | 52.9 | 13.32 | 10.76 | 12.50 | 0.08 | 1.05 | -3.06 | 0.73 | 0.65 | 13.91 | 12.79 | 169.54 | ||||||||||||||||||||||||||||||||||||||||||||
| PBBI |
PB Bancorp, Inc. | CT | 9.30 | 7,880 | 73.3 | 9.75 | 8.17 | 9.50 | -2.11 | 13.57 | 9.10 | 0.12 | 0.12 | 10.85 | 9.97 | 64.27 | ||||||||||||||||||||||||||||||||||||||||||||
| PBSK |
Poage Bankshares, Inc. | KY | 18.95 | 3,714 | 70.4 | 20.90 | 15.50 | 19.05 | -0.52 | 14.23 | 10.82 | 0.52 | 0.60 | 18.78 | 18.14 | 120.88 | ||||||||||||||||||||||||||||||||||||||||||||
| PROV |
Provident Financial Holdings, Inc. | CA | 20.00 | 7,990 | 159.8 | 20.66 | 16.73 | 20.00 | 0.00 | 9.89 | 5.88 | 0.80 | 0.81 | 16.70 | 16.70 | 155.52 | ||||||||||||||||||||||||||||||||||||||||||||
| PFS |
Provident Financial Services, Inc. | NJ | 27.20 | 66,043 | 1,796.4 | 27.26 | 17.71 | 26.91 | 1.08 | 30.77 | 34.99 | 1.37 | 1.40 | 18.84 | 12.44 | 142.18 | ||||||||||||||||||||||||||||||||||||||||||||
| PBIP |
Prudential Bancorp, Inc. | PA | 15.81 | 8,046 | 127.2 | 16.20 | 13.80 | 15.47 | 2.20 | 7.99 | 4.01 | 0.36 | 0.35 | 14.17 | 14.17 | 69.54 | ||||||||||||||||||||||||||||||||||||||||||||
| RNDB |
Randolph Bancorp, Inc. | MA | 15.13 | 5,869 | 88.8 | 15.13 | 12.06 | 14.91 | 1.46 | NA | NA | NA | NA | 14.63 | 14.61 | 83.42 | ||||||||||||||||||||||||||||||||||||||||||||
| RVSB |
Riverview Bancorp, Inc. | WA | 5.99 | 22,508 | 134.8 | 6.00 | 4.15 | 5.79 | 3.45 | 29.93 | 27.72 | 0.29 | 0.30 | 4.93 | 3.79 | 43.72 | ||||||||||||||||||||||||||||||||||||||||||||
| SVBI |
Severn Bancorp, Inc. | MD | 6.65 | 12,104 | 80.5 | 7.20 | 4.99 | 6.65 | 0.00 | 17.70 | 15.65 | 1.14 | 1.14 | 6.90 | 6.87 | 64.25 | ||||||||||||||||||||||||||||||||||||||||||||
| SIFI |
SI Financial Group, Inc. | CT | 14.20 | 12,210 | 173.4 | 14.47 | 12.30 | 14.15 | 0.35 | 9.06 | 4.03 | 0.53 | NA | 13.08 | 11.64 | 125.97 | ||||||||||||||||||||||||||||||||||||||||||||
| SBCP |
Sunshine Bancorp, Inc. | FL | 15.91 | 7,995 | 127.2 | 15.95 | 13.55 | 15.53 | 2.45 | 13.24 | 4.67 | -0.35 | -0.33 | 13.82 | 11.92 | 70.54 | ||||||||||||||||||||||||||||||||||||||||||||
| TBNK |
Territorial Bancorp Inc. | HI | 32.06 | 9,764 | 313.0 | 32.50 | 24.87 | 31.59 | 1.49 | 10.90 | 15.57 | 1.69 | 1.66 | 23.39 | 23.39 | 189.33 | ||||||||||||||||||||||||||||||||||||||||||||
| TSBK |
Timberland Bancorp, Inc. | WA | 19.05 | 6,944 | 132.3 | 19.06 | 11.60 | 18.94 | 0.58 | 49.38 | 53.51 | 1.43 | 1.42 | 13.95 | 13.13 | 128.37 | ||||||||||||||||||||||||||||||||||||||||||||
| TRST |
TrustCo Bank Corp NY | NY | 8.35 | 95,705 | 799.1 | 8.45 | 5.17 | 8.15 | 2.45 | 26.52 | 35.99 | 0.44 | 0.43 | 4.56 | 4.55 | 50.29 | ||||||||||||||||||||||||||||||||||||||||||||
| UCBA |
United Community Bancorp | IN | 16.20 | 4,198 | 68.0 | 17.00 | 12.95 | 15.82 | 2.38 | 8.14 | 8.07 | 0.86 | 0.81 | 16.83 | 16.17 | 125.78 | ||||||||||||||||||||||||||||||||||||||||||||
| UCFC |
United Community Financial Corp. | OH | 8.58 | 46,550 | 399.4 | 8.58 | 5.28 | 8.15 | 5.28 | 46.67 | 45.42 | 0.38 | 0.37 | 5.51 | 5.48 | 46.41 | ||||||||||||||||||||||||||||||||||||||||||||
| UBNK |
United Financial Bancorp, Inc. | CT | 16.84 | 50,512 | 850.6 | 17.06 | 10.28 | 16.43 | 2.50 | 21.50 | 30.75 | 0.90 | 1.02 | 13.00 | 10.60 | 129.57 | ||||||||||||||||||||||||||||||||||||||||||||
| WSBF |
Waterstone Financial, Inc. | WI | 18.20 | 29,386 | 534.8 | 18.55 | 13.30 | 18.00 | 1.11 | 32.75 | 29.08 | 0.81 | 0.81 | 13.94 | 13.92 | 61.08 | ||||||||||||||||||||||||||||||||||||||||||||
| WAYN |
Wayne Savings Bancshares, Inc. | OH | 15.05 | 2,782 | 41.9 | 15.05 | 11.90 | 14.55 | 3.44 | 18.97 | 13.93 | 0.92 | 0.92 | 14.88 | 14.27 | 160.25 | ||||||||||||||||||||||||||||||||||||||||||||
| WCFB |
WCF Bancorp, Inc. | IA | 8.90 | 2,563 | 22.8 | 10.97 | 8.15 | 8.80 | 1.14 | 0.31 | -1.74 | 0.10 | 0.07 | 11.54 | 11.51 | 48.40 | ||||||||||||||||||||||||||||||||||||||||||||
| WEBK |
Wellesley Bancorp, Inc. | MA | 24.45 | 2,459 | 60.1 | 24.80 | 18.05 | 24.40 | 0.20 | 29.45 | 28.68 | 1.33 | 1.32 | 22.52 | 22.52 | 271.01 | ||||||||||||||||||||||||||||||||||||||||||||
| WBB |
Westbury Bancorp, Inc. | WI | 20.04 | 4,098 | 82.1 | 20.26 | 17.51 | 19.81 | 1.16 | 12.69 | 11.33 | 0.93 | 0.83 | 19.43 | 19.43 | 171.45 | ||||||||||||||||||||||||||||||||||||||||||||
RP® Financial, LC.
Exhibit IV-1A
Weekly Thrift Market Line - Part One
Prices As of November 25, 2016
| Market Capitalization | Price Change Data | Current Per Share Financials | ||||||||||||||||||||||||||||||||||||||||||||||||||||||||||
| Price/ | Shares | Market | 52 Week (1) | % Change From | LTM | LTM Core | BV/ | TBV/ | Assets/ | |||||||||||||||||||||||||||||||||||||||||||||||||||
| Share(1) | Outstanding | Capitalization | High | Low | Last Wk | Last Wk | 52 Wks (2) | MRY (2) | EPS (3) | EPS (3) | Share | Share (4) | Share | |||||||||||||||||||||||||||||||||||||||||||||||
| ($) | (000) | ($Mil) | ($) | ($) | ($) | (%) | (%) | (%) | ($) | ($) | ($) | ($) | ($) | |||||||||||||||||||||||||||||||||||||||||||||||
| Companies |
||||||||||||||||||||||||||||||||||||||||||||||||||||||||||||
| WNEB |
Western New England Bancorp, Inc. | MA | 8.50 | 30,250 | 257.1 | 8.85 | 7.30 | 8.30 | 2.41 | 5.33 | 1.19 | 0.25 | 0.30 | 7.92 | 7.92 | 45.55 | ||||||||||||||||||||||||||||||||||||||||||||
| WBKC |
Wolverine Bancorp, Inc. | MI | 27.97 | 2,099 | 58.7 | 27.99 | 25.26 | 26.53 | 5.42 | 8.41 | 4.99 | 2.14 | 2.14 | 29.97 | 29.97 | 175.88 | ||||||||||||||||||||||||||||||||||||||||||||
| WSFS |
WSFS Financial Corporation | DE | 42.25 | 31,324 | 1,323.5 | 42.30 | 26.40 | 41.05 | 2.92 | 24.34 | 30.56 | 1.97 | 2.50 | 22.08 | 16.59 | 211.58 | ||||||||||||||||||||||||||||||||||||||||||||
| WVFC |
WVS Financial Corp. | PA | 13.01 | 2,008 | 26.1 | 13.07 | 10.73 | 12.61 | 3.17 | 6.55 | 5.77 | 0.74 | 0.73 | 16.44 | 16.44 | 166.85 | ||||||||||||||||||||||||||||||||||||||||||||
| MHCs |
||||||||||||||||||||||||||||||||||||||||||||||||||||||||||||
| GCBC |
Greene County Bancorp, Inc. (MHC) | NY | 21.70 | 8,493 | 184.3 | 25.20 | 14.38 | 21.90 | -0.91 | 49.66 | 35.84 | 1.10 | 1.10 | 9.00 | 9.00 | 105.16 | ||||||||||||||||||||||||||||||||||||||||||||
| HONE |
HarborOne Bancorp, Inc. (MHC) | MA | 19.62 | 32,121 | 630.2 | 19.70 | 12.53 | 18.75 | 4.64 | NA | NA | NA | NA | 10.21 | 9.79 | 73.07 | ||||||||||||||||||||||||||||||||||||||||||||
| KFFB |
Kentucky First Federal Bancorp (MHC) | KY | 8.65 | 8,440 | 73.0 | 10.21 | 8.00 | 8.59 | 0.69 | -11.01 | -7.39 | 0.16 | 0.16 | 7.96 | 6.25 | 34.97 | ||||||||||||||||||||||||||||||||||||||||||||
| LSBK |
Lake Shore Bancorp, Inc. (MHC) | NY | 14.18 | 6,098 | 86.5 | 15.10 | 12.97 | 14.20 | -0.14 | 6.36 | 5.82 | 0.71 | 0.51 | 12.68 | 12.68 | 78.46 | ||||||||||||||||||||||||||||||||||||||||||||
| MGYR |
Magyar Bancorp, Inc. (MHC) | NJ | 10.60 | 5,821 | 61.7 | 11.00 | 9.51 | 10.37 | 2.26 | 8.28 | 5.89 | 0.19 | NA | 8.20 | 8.20 | 100.40 | ||||||||||||||||||||||||||||||||||||||||||||
| OFED |
Oconee Federal Financial Corp. (MHC) | SC | 22.05 | 5,803 | 128.0 | 24.25 | 18.13 | 22.93 | -3.82 | 19.58 | 18.23 | 0.87 | 0.86 | 14.70 | 14.13 | 83.44 | ||||||||||||||||||||||||||||||||||||||||||||
| PVBC |
Provident Bancorp, Inc. (MHC) | MA | 17.95 | 9,499 | 170.5 | 17.95 | 12.51 | 17.60 | 1.99 | 44.06 | 38.18 | NA | NA | 11.41 | 11.41 | 80.87 | ||||||||||||||||||||||||||||||||||||||||||||
| TFSL |
TFS Financial Corporation (MHC) | OH | 18.82 | 283,469 | 5,334.9 | 19.42 | 15.58 | 18.75 | 0.37 | 0.11 | -0.05 | 0.28 | NA | 5.84 | 5.81 | 45.53 | ||||||||||||||||||||||||||||||||||||||||||||
| Under Acquisition |
||||||||||||||||||||||||||||||||||||||||||||||||||||||||||||
| AF |
Astoria Financial Corporation | NY | 16.30 | 101,329 | 1,651.7 | 16.65 | 13.92 | 16.15 | 0.93 | 2.13 | 2.84 | 0.64 | 0.67 | 15.57 | 13.74 | 146.20 | ||||||||||||||||||||||||||||||||||||||||||||
| EVER |
EverBank Financial Corp | FL | 19.33 | 125,445 | 2,424.8 | 19.47 | 12.32 | 19.34 | -0.05 | 12.19 | 20.96 | 0.96 | NA | 13.92 | 13.53 | 228.81 | ||||||||||||||||||||||||||||||||||||||||||||
| GTWN |
Georgetown Bancorp, Inc. | MA | 25.90 | 1,841 | 47.7 | 26.00 | 18.25 | 25.65 | 0.97 | 41.38 | 36.89 | 0.43 | 0.46 | 17.62 | 17.62 | 171.09 | ||||||||||||||||||||||||||||||||||||||||||||
| (1) | Average of High/Low or Bid/Ask price per share. |
| (2) | Or since offering price if converted of first listed in the past 52 weeks. Percent change figures are actual year-to-date and are not annualized. |
| (3) | EPS (earnings per share) is based on actual trailing 12 month data and is not shown on a pro forma basis. |
| (4) | Excludes intangibles (such as goodwill, value of core deposits, etc.). |
| (5) | ROA (return on assets) and ROE (return on equity) are indicated ratios based on trailing 12 month common earnings and average common equity and total assets balances. |
| (6) | Annualized based on last regular quarterly cash dividend announcement. |
| (7) | Indicated dividend as a percent of trailing 12 month earnings. |
| (8) | Excluded from averages due to actual or rumored acquisition activities or unusual operating characteristics. |
| (9) | For MHC institutions, market value reflects share price multiplied by public (non-MHC) shares. |
Source: SNL Financial, LC. and RP® Financial, LC. calculations. The information provided in this table has been obtained from sources we believe are reliable, but we cannot guarantee the accuracy or completeness of such information.
Copyright (c) 2016 by RP® Financial, LC.
RP® Financial, LC.
Exhibit IV-1B
Weekly Thrift Market Line - Part Two
Prices As of November 25, 2016
| Key Financial Ratios | Asset Quality Ratios | Pricing Ratios | Dividend Data (6) | |||||||||||||||||||||||||||||||||||||||||||||||||||||||||||||||||||
| Equity/ | Tang Equity/ | Reported Earnings | Core Earnings | NPAs/ | Rsvs/ | Price/ | Price/ | Price/ | Price/ | Price/ | Div/ | Dividend | Payout | |||||||||||||||||||||||||||||||||||||||||||||||||||||||||
| Assets(1) | Assets(1) | ROA(5) | ROE(5) | ROA(5) | ROE(5) | Assets | NPLs | Earnings | Book | Assets | Tang Book | Core Earnings | Share | Yield | Ratio (7) | |||||||||||||||||||||||||||||||||||||||||||||||||||||||
| (%) | (%) | (%) | (%) | (%) | (%) | (%) | (%) | (x) | (%) | (%) | (%) | (x) | ($) | (%) | (%) | |||||||||||||||||||||||||||||||||||||||||||||||||||||||
| Companies |
||||||||||||||||||||||||||||||||||||||||||||||||||||||||||||||||||||||
| ANCB |
Anchor Bancorp | WA | 14.63 | 14.63 | 0.17 | 1.14 | 0.17 | 1.14 | NA | 39.88 | NM | 99.77 | 14.60 | 99.77 | 87.59 | NA | NA | NM | ||||||||||||||||||||||||||||||||||||||||||||||||||||
| ASBB |
ASB Bancorp, Inc. | NC | 11.46 | 11.46 | 0.70 | 5.91 | 0.57 | 4.87 | 1.31 | 114.00 | 18.91 | 115.27 | 13.21 | 115.27 | 22.94 | NA | NA | NM | ||||||||||||||||||||||||||||||||||||||||||||||||||||
| ACFC |
Atlantic Coast Financial Corporation | FL | 9.19 | 9.19 | 0.59 | 6.10 | 0.48 | 4.97 | 4.29 | 21.76 | 21.39 | 127.13 | 11.69 | 127.13 | 26.33 | 0.00 | 0.00 | NM | ||||||||||||||||||||||||||||||||||||||||||||||||||||
| BCTF |
Bancorp 34, Inc. | NM | 9.44 | 9.36 | 0.41 | 3.85 | 0.43 | 4.04 | 0.37 | 179.30 | 36.18 | 137.27 | 12.96 | 138.61 | 34.93 | 0.59 | 0.00 | NM | ||||||||||||||||||||||||||||||||||||||||||||||||||||
| BKMU |
Bank Mutual Corporation | WI | 10.89 | 10.89 | 0.65 | 5.85 | 0.66 | 5.95 | 0.54 | 164.11 | 24.32 | 142.29 | 15.49 | 142.29 | 23.91 | 0.22 | 2.44 | 58.11 | ||||||||||||||||||||||||||||||||||||||||||||||||||||
| BFIN |
BankFinancial Corporation | IL | 13.22 | 13.17 | 0.49 | 3.50 | 0.51 | 3.65 | 0.55 | 203.32 | 38.16 | 137.20 | 18.14 | 137.82 | 36.61 | 0.24 | 1.66 | 55.26 | ||||||||||||||||||||||||||||||||||||||||||||||||||||
| BYBK |
Bay Bancorp, Inc. | MD | 10.76 | 10.27 | 0.33 | 2.49 | 0.41 | 3.15 | 2.19 | 21.03 | 43.21 | 96.34 | 10.34 | 101.43 | 34.43 | 0.00 | 0.00 | NM | ||||||||||||||||||||||||||||||||||||||||||||||||||||
| BNCL |
Beneficial Bancorp, Inc. | PA | 18.34 | 15.70 | 0.44 | 2.13 | 0.56 | 2.73 | 0.30 | 286.82 | 55.65 | 128.62 | 23.58 | 155.03 | 42.97 | 0.24 | 1.39 | 38.71 | ||||||||||||||||||||||||||||||||||||||||||||||||||||
| BHBK |
Blue Hills Bancorp, Inc. | MA | 16.84 | 16.45 | 0.33 | 1.78 | 0.32 | 1.73 | 0.35 | 221.90 | 64.29 | 124.70 | 21.00 | 128.27 | 66.10 | 0.12 | 0.67 | 39.29 | ||||||||||||||||||||||||||||||||||||||||||||||||||||
| BOFI |
BofI Holding, Inc. | CA | 9.19 | 9.19 | 1.70 | 18.81 | 1.68 | 18.63 | 0.56 | 89.01 | 12.92 | 217.86 | 19.89 | 217.86 | 13.04 | NA | NA | NM | ||||||||||||||||||||||||||||||||||||||||||||||||||||
| BYFC |
Broadway Financial Corporation | CA | 11.50 | 11.50 | 1.74 | 15.02 | 1.71 | 14.81 | 2.91 | 38.17 | 6.91 | 97.29 | 11.18 | 97.29 | 7.01 | 0.04 | 0.00 | NM | ||||||||||||||||||||||||||||||||||||||||||||||||||||
| BLMT |
BSB Bancorp, Inc. | MA | 7.56 | 7.56 | 0.57 | 7.15 | NA | NA | 0.41 | 152.33 | 22.44 | 154.97 | 11.72 | 154.97 | NA | NA | NA | NM | ||||||||||||||||||||||||||||||||||||||||||||||||||||
| CFFN |
Capitol Federal Financial, Inc. | KS | 15.03 | 15.03 | 0.74 | 5.95 | NA | NA | 0.60 | 16.33 | 25.38 | 157.82 | 23.72 | 157.82 | NA | 0.34 | 2.13 | 139.68 | ||||||||||||||||||||||||||||||||||||||||||||||||||||
| CARV |
Carver Bancorp, Inc. | NY | 7.75 | 7.75 | -0.06 | -0.80 | -0.18 | -2.36 | 2.45 | 29.90 | NM | 159.06 | 2.25 | 159.06 | NM | 0.00 | 0.00 | NM | ||||||||||||||||||||||||||||||||||||||||||||||||||||
| CFBK |
Central Federal Corporation | OH | 9.58 | 9.58 | 1.31 | 12.37 | 1.31 | 12.37 | 1.03 | 164.20 | 6.90 | 83.61 | 5.84 | 83.61 | 6.90 | 0.00 | 0.00 | NM | ||||||||||||||||||||||||||||||||||||||||||||||||||||
| CHFN |
Charter Financial Corporation | GA | 14.08 | 12.10 | 0.98 | 5.90 | 1.07 | 6.43 | 0.76 | 124.65 | 18.32 | 107.06 | 15.07 | 127.40 | 16.80 | 0.22 | 1.52 | 25.95 | ||||||||||||||||||||||||||||||||||||||||||||||||||||
| CSBK |
Clifton Bancorp Inc. | NJ | 23.08 | 23.08 | 0.36 | 1.40 | 0.36 | 1.38 | NA | NA | NM | 126.07 | 29.10 | 126.07 | 88.04 | 0.24 | 1.45 | 126.32 | ||||||||||||||||||||||||||||||||||||||||||||||||||||
| CWAY |
Coastway Bancorp, Inc. | RI | 10.95 | 10.95 | 0.59 | 4.83 | 0.59 | 4.83 | 2.20 | 18.19 | 17.66 | 89.89 | 9.84 | 89.89 | 17.66 | NA | NA | NM | ||||||||||||||||||||||||||||||||||||||||||||||||||||
| DCOM |
Dime Community Bancshares, Inc. | NY | 9.54 | 8.67 | 1.57 | 15.89 | 0.73 | 7.42 | 0.24 | 158.94 | 8.47 | 129.48 | 12.35 | 143.89 | 18.16 | 0.56 | 2.92 | 24.78 | ||||||||||||||||||||||||||||||||||||||||||||||||||||
| ESBK |
Elmira Savings Bank | NY | 9.83 | 7.83 | 0.77 | 7.81 | 0.75 | 7.67 | NA | NA | 15.79 | 118.47 | 9.78 | 161.90 | 16.23 | 0.92 | 4.62 | 73.02 | ||||||||||||||||||||||||||||||||||||||||||||||||||||
| ENFC |
Entegra Financial Corp. | NC | 11.34 | 11.12 | 0.54 | 4.45 | 0.62 | 5.05 | 1.78 | 53.29 | 21.06 | 90.65 | 10.28 | 92.71 | 18.59 | NA | NA | NM | ||||||||||||||||||||||||||||||||||||||||||||||||||||
| EQFN |
Equitable Financial Corp. | NE | 15.92 | 15.92 | 0.46 | 3.00 | 0.47 | 3.08 | NA | NA | 29.35 | 87.24 | 13.89 | 87.24 | 28.58 | NA | NA | NM | ||||||||||||||||||||||||||||||||||||||||||||||||||||
| ESSA |
ESSA Bancorp, Inc. | PA | 9.95 | 9.11 | 0.45 | 4.40 | 0.44 | 4.31 | NA | NA | 20.40 | 96.20 | 9.57 | 105.99 | 20.84 | 0.36 | 2.42 | 61.64 | ||||||||||||||||||||||||||||||||||||||||||||||||||||
| FCAP |
First Capital, Inc. | IN | 10.61 | 9.66 | 0.89 | 8.39 | 0.95 | 8.90 | 1.25 | 65.73 | 16.82 | 136.41 | 14.45 | 151.37 | 15.74 | 0.84 | 2.61 | 32.98 | ||||||||||||||||||||||||||||||||||||||||||||||||||||
| FBNK |
First Connecticut Bancorp, Inc. | CT | 9.03 | 9.03 | 0.49 | 5.34 | 0.48 | 5.22 | 1.01 | 73.97 | 25.17 | 138.51 | 12.50 | 138.51 | 25.75 | 0.36 | 1.61 | 34.83 | ||||||||||||||||||||||||||||||||||||||||||||||||||||
| FDEF |
First Defiance Financial Corp. | OH | 11.92 | 9.59 | 1.19 | 9.93 | 1.20 | 10.00 | 1.14 | 94.92 | 15.07 | 142.73 | 17.02 | 182.17 | 14.97 | 0.88 | 1.90 | 28.57 | ||||||||||||||||||||||||||||||||||||||||||||||||||||
| FNWB |
First Northwest Bancorp | WA | 18.05 | 18.05 | 0.34 | 1.79 | 0.32 | 1.67 | 0.83 | 89.70 | 51.34 | 102.01 | 18.42 | 102.01 | 55.34 | NA | NA | NM | ||||||||||||||||||||||||||||||||||||||||||||||||||||
| FBC |
Flagstar Bancorp, Inc. | MI | 9.01 | 9.01 | 1.30 | 11.55 | 1.17 | 10.40 | 0.92 | 123.28 | 10.68 | 122.26 | 11.02 | 122.26 | 10.12 | 0.00 | 0.00 | NM | ||||||||||||||||||||||||||||||||||||||||||||||||||||
| FSBW |
FS Bancorp, Inc. | WA | 9.61 | 9.16 | 1.32 | 13.33 | 1.41 | 14.26 | 0.08 | NM | 9.74 | 125.47 | 12.06 | 132.41 | 9.12 | 0.40 | 1.23 | 11.04 | ||||||||||||||||||||||||||||||||||||||||||||||||||||
| FSBC |
FSB Bancorp, Inc. | NY | 12.11 | 12.11 | 0.22 | 2.52 | 0.21 | 2.42 | 0.01 | NM | 49.09 | 89.51 | 10.84 | 89.51 | 51.14 | NA | NA | NM | ||||||||||||||||||||||||||||||||||||||||||||||||||||
| HBK |
Hamilton Bancorp, Inc. | MD | 11.95 | 10.32 | -0.01 | -0.04 | 0.11 | 0.78 | 1.16 | 34.98 | NM | 77.19 | 9.22 | 91.08 | 93.73 | NA | NA | NM | ||||||||||||||||||||||||||||||||||||||||||||||||||||
| HIFS |
Hingham Institution for Savings | MA | 7.86 | 7.86 | 1.21 | 15.48 | 1.20 | 15.32 | 0.28 | 193.31 | 16.17 | 232.66 | 18.30 | 232.66 | 16.33 | 1.28 | 0.76 | 20.75 | ||||||||||||||||||||||||||||||||||||||||||||||||||||
| HMNF |
HMN Financial, Inc. | MN | 10.91 | 10.75 | 0.89 | 8.02 | 0.90 | 8.10 | 1.04 | 162.38 | 13.38 | 97.93 | 10.69 | 99.63 | 13.25 | 0.00 | 0.00 | NM | ||||||||||||||||||||||||||||||||||||||||||||||||||||
| HFBL |
Home Federal Bancorp, Inc. of Louisiana | LA | 11.29 | 11.29 | 0.92 | 7.63 | 0.92 | 7.63 | 0.24 | 331.61 | 13.33 | 106.94 | 12.07 | 106.94 | 13.33 | 0.36 | 1.50 | 18.89 | ||||||||||||||||||||||||||||||||||||||||||||||||||||
| IROQ |
IF Bancorp, Inc. | IL | 14.23 | 14.23 | 0.70 | 4.93 | 0.64 | 4.46 | 0.82 | 118.60 | 17.92 | 91.60 | 13.04 | 91.60 | 19.77 | 0.16 | 0.83 | 14.81 | ||||||||||||||||||||||||||||||||||||||||||||||||||||
| ISBC |
Investors Bancorp, Inc. | NJ | 13.82 | 13.49 | 0.83 | 5.44 | 0.83 | 5.44 | 0.49 | 210.34 | 24.31 | 140.56 | 19.43 | 144.63 | 24.32 | 0.32 | 2.27 | 44.83 | ||||||||||||||||||||||||||||||||||||||||||||||||||||
| JXSB |
Jacksonville Bancorp, Inc. | IL | 14.60 | 13.89 | 0.99 | 6.53 | 0.92 | 6.05 | 1.33 | 71.34 | 17.21 | 109.00 | 15.91 | 115.53 | 18.58 | 0.40 | 1.37 | 81.18 | ||||||||||||||||||||||||||||||||||||||||||||||||||||
| KRNY |
Kearny Financial Corp. | NJ | 24.75 | 22.89 | 0.39 | 1.51 | 0.39 | 1.52 | NA | NA | NM | 121.73 | 30.13 | 134.86 | 80.05 | 0.08 | 0.52 | 42.11 | ||||||||||||||||||||||||||||||||||||||||||||||||||||
| MLVF |
Malvern Bancorp, Inc. | PA | 11.52 | 11.52 | 1.59 | 14.05 | 1.54 | 13.62 | 0.45 | 148.63 | 10.97 | 141.49 | 16.30 | 141.49 | 11.32 | 0.11 | 0.00 | NM | ||||||||||||||||||||||||||||||||||||||||||||||||||||
| MELR |
Melrose Bancorp, Inc. | MA | 16.23 | 16.23 | 0.42 | 2.26 | 0.29 | 1.55 | 0.00 | NM | 38.79 | 95.77 | 15.54 | 95.77 | 56.78 | NA | NA | NM | ||||||||||||||||||||||||||||||||||||||||||||||||||||
| EBSB |
Meridian Bancorp, Inc. | MA | 14.31 | 14.03 | 0.80 | 5.05 | 0.79 | 5.02 | 0.69 | 134.22 | 32.32 | 162.84 | 23.30 | 166.66 | 32.56 | 0.12 | 0.66 | 21.43 | ||||||||||||||||||||||||||||||||||||||||||||||||||||
| CASH |
Meta Financial Group, Inc. | SD | 8.36 | NA | 1.10 | 10.79 | 1.31 | 12.79 | NA | NA | 24.12 | 240.59 | 20.11 | 303.37 | 20.34 | 0.52 | 0.55 | 9.95 | ||||||||||||||||||||||||||||||||||||||||||||||||||||
| MSBF |
MSB Financial Corp. | NJ | 16.74 | 16.74 | 0.18 | 0.90 | 0.26 | 1.34 | 3.53 | 26.42 | NM | 107.81 | 18.04 | 107.81 | 114.17 | 0.00 | 0.00 | NM | ||||||||||||||||||||||||||||||||||||||||||||||||||||
| NYCB |
New York Community Bancorp, Inc. | NY | 12.31 | 7.77 | -0.05 | -0.39 | 1.16 | 9.56 | 0.12 | 380.89 | NM | 128.03 | 15.77 | 213.42 | 13.39 | 0.68 | 4.25 | NM | ||||||||||||||||||||||||||||||||||||||||||||||||||||
| NFBK |
Northfield Bancorp, Inc. | NJ | 16.40 | 15.50 | 0.66 | 3.93 | 0.74 | 4.41 | 0.83 | 77.25 | 36.23 | 146.76 | 24.06 | 156.95 | 32.39 | 0.32 | 1.70 | 59.62 | ||||||||||||||||||||||||||||||||||||||||||||||||||||
| NWBI |
Northwest Bancshares, Inc. | PA | 11.97 | 8.76 | 0.46 | 3.57 | 0.88 | 6.79 | 1.24 | 54.76 | 44.80 | 159.98 | 19.15 | 226.54 | 23.53 | 0.60 | 3.27 | 146.34 | ||||||||||||||||||||||||||||||||||||||||||||||||||||
| OCFC |
OceanFirst Financial Corp. | NJ | 10.05 | 8.50 | 0.69 | 6.95 | 0.91 | 9.22 | 1.25 | 36.40 | 22.42 | 148.63 | 14.94 | 178.73 | 17.07 | 0.60 | 2.50 | 50.47 | ||||||||||||||||||||||||||||||||||||||||||||||||||||
| ORIT |
Oritani Financial Corp. | NJ | 14.22 | 14.22 | 1.37 | 9.19 | 1.07 | 7.19 | 0.30 | 273.73 | 15.76 | 147.79 | 21.02 | 147.79 | 20.20 | 0.70 | 3.97 | 107.14 | ||||||||||||||||||||||||||||||||||||||||||||||||||||
| OTTW |
Ottawa Bancorp, Inc. | IL | 11.54 | 11.21 | 0.59 | 4.15 | 0.62 | 4.37 | 2.00 | 42.36 | 30.40 | 127.06 | 14.66 | 131.32 | 28.82 | 0.00 | 0.00 | NM | ||||||||||||||||||||||||||||||||||||||||||||||||||||
| PBHC |
Pathfinder Bancorp, Inc. | NY | 8.27 | 7.66 | 0.48 | 4.88 | 0.43 | 4.41 | 0.89 | 106.87 | 17.14 | 89.92 | 7.38 | 97.80 | 19.15 | 0.20 | 1.60 | 27.40 | ||||||||||||||||||||||||||||||||||||||||||||||||||||
| PBBI |
PB Bancorp, Inc. | CT | 16.87 | 15.72 | 0.18 | 1.23 | 0.19 | 1.27 | NA | NA | NM | 85.75 | 14.47 | 93.30 | 75.10 | 0.12 | 1.29 | 91.67 | ||||||||||||||||||||||||||||||||||||||||||||||||||||
| PBSK |
Poage Bankshares, Inc. | KY | 15.54 | 15.09 | 0.43 | 2.68 | 0.50 | 3.08 | 1.78 | 33.13 | 36.44 | 100.89 | 15.68 | 104.44 | 31.57 | 0.32 | 1.69 | 53.85 | ||||||||||||||||||||||||||||||||||||||||||||||||||||
| PROV |
Provident Financial Holdings, Inc. | CA | 10.72 | 10.72 | 0.56 | 4.88 | 0.57 | 4.93 | 1.09 | 87.14 | 25.00 | 119.77 | 12.84 | 119.77 | 24.75 | 0.52 | 2.60 | 62.50 | ||||||||||||||||||||||||||||||||||||||||||||||||||||
| PFS |
Provident Financial Services, Inc. | NJ | 13.25 | 9.16 | 0.96 | 7.12 | 0.98 | 7.28 | 0.76 | 99.95 | 19.85 | 144.34 | 19.13 | 218.63 | 19.41 | 0.72 | 2.65 | 51.82 | ||||||||||||||||||||||||||||||||||||||||||||||||||||
| PBIP |
Prudential Bancorp, Inc. | PA | 20.38 | 20.38 | 0.51 | 2.36 | 0.49 | 2.29 | 3.39 | 17.79 | 43.92 | 111.58 | 22.74 | 111.58 | 45.20 | 0.12 | 0.76 | 33.33 | ||||||||||||||||||||||||||||||||||||||||||||||||||||
| RNDB |
Randolph Bancorp, Inc. | MA | 17.54 | 17.52 | NA | 2.73 | NA | 3.80 | 1.41 | 47.29 | NA | 103.41 | 18.13 | 103.54 | NA | NA | NA | NA | ||||||||||||||||||||||||||||||||||||||||||||||||||||
| RVSB |
Riverview Bancorp, Inc. | WA | 11.28 | 8.91 | 0.71 | 5.94 | 0.72 | 6.11 | 1.48 | 71.92 | 20.66 | 121.48 | 13.70 | 157.85 | 20.24 | 0.08 | 1.34 | 26.72 | ||||||||||||||||||||||||||||||||||||||||||||||||||||
| SVBI |
Severn Bancorp, Inc. | MD | 11.16 | 11.12 | 2.00 | 17.36 | 2.00 | 17.36 | 4.11 | 29.33 | 5.83 | 96.37 | 10.39 | 96.75 | 5.83 | 0.00 | 0.00 | NM | ||||||||||||||||||||||||||||||||||||||||||||||||||||
| SIFI |
SI Financial Group, Inc. | CT | 10.39 | 9.35 | 0.42 | 3.98 | NA | NA | 1.13 | 72.00 | 26.79 | 108.54 | 11.28 | 122.00 | NA | 0.16 | 1.13 | 30.19 | ||||||||||||||||||||||||||||||||||||||||||||||||||||
| SBCP |
Sunshine Bancorp, Inc. | FL | 12.89 | 11.32 | -0.26 | -1.85 | -0.29 | -2.04 | 0.41 | 126.26 | NM | 115.10 | 14.84 | 133.49 | NM | NA | NA | NM | ||||||||||||||||||||||||||||||||||||||||||||||||||||
| TBNK |
Territorial Bancorp Inc. | HI | 12.36 | 12.36 | 0.85 | 7.00 | 0.84 | 6.86 | 0.38 | 39.11 | 18.97 | 137.05 | 16.93 | 137.05 | 19.35 | 0.72 | 2.25 | 48.52 | ||||||||||||||||||||||||||||||||||||||||||||||||||||
| TSBK |
Timberland Bancorp, Inc. | WA | 10.86 | 10.29 | 1.19 | 11.00 | 1.19 | 10.93 | 1.72 | 93.56 | 13.32 | 136.61 | 14.84 | 145.07 | 13.40 | 0.36 | 1.89 | 23.78 | ||||||||||||||||||||||||||||||||||||||||||||||||||||
| TRST |
TrustCo Bank Corp NY | NY | 9.05 | 9.04 | 0.88 | 9.92 | 0.87 | 9.82 | 0.88 | 117.51 | 19.02 | 183.28 | 16.59 | 183.51 | 19.22 | 0.26 | 3.14 | 59.79 | ||||||||||||||||||||||||||||||||||||||||||||||||||||
| UCBA |
United Community Bancorp | IN | 13.38 | 12.92 | 0.68 | 5.14 | 0.63 | 4.83 | 1.02 | 84.53 | 18.84 | 96.23 | 12.88 | 100.20 | 20.07 | 0.24 | 1.48 | 27.91 | ||||||||||||||||||||||||||||||||||||||||||||||||||||
| UCFC |
United Community Financial Corp. | OH | 11.87 | 11.81 | 0.89 | 7.33 | 0.87 | 7.11 | 1.96 | 44.97 | 22.58 | 155.74 | 18.49 | 156.69 | 23.30 | 0.12 | 1.40 | 28.95 | ||||||||||||||||||||||||||||||||||||||||||||||||||||
| UBNK |
United Financial Bancorp, Inc. | CT | 10.03 | 8.32 | 0.72 | 7.12 | 0.82 | 8.08 | 0.84 | 78.87 | 18.71 | 129.49 | 12.98 | 158.94 | 16.48 | 0.48 | 2.85 | 53.33 | ||||||||||||||||||||||||||||||||||||||||||||||||||||
| WSBF |
Waterstone Financial, Inc. | WI | 22.82 | 22.79 | 1.26 | 5.59 | 1.26 | 5.59 | NA | 90.49 | 22.47 | 130.59 | 29.79 | 130.78 | 22.47 | 0.32 | 1.76 | 32.10 | ||||||||||||||||||||||||||||||||||||||||||||||||||||
| WAYN |
Wayne Savings Bancshares, Inc. | OH | 9.29 | 8.94 | 0.57 | 6.20 | 0.57 | 6.20 | NA | NA | 16.36 | 101.12 | 9.39 | 105.50 | 16.36 | 0.36 | 2.39 | 39.13 | ||||||||||||||||||||||||||||||||||||||||||||||||||||
| WCFB |
WCF Bancorp, Inc. | IA | 23.85 | 23.80 | 0.19 | 1.44 | 0.13 | 0.98 | NA | 105.80 | NM | 77.12 | 18.39 | 77.30 | 128.14 | 0.20 | 2.25 | 158.74 | ||||||||||||||||||||||||||||||||||||||||||||||||||||
| WEBK |
Wellesley Bancorp, Inc. | MA | 8.31 | 8.31 | 0.50 | 5.81 | 0.50 | 5.79 | NA | NA | 18.38 | 108.56 | 9.02 | 108.56 | 18.45 | 0.16 | 0.65 | 11.28 | ||||||||||||||||||||||||||||||||||||||||||||||||||||
| WBB |
Westbury Bancorp, Inc. | WI | 11.33 | 11.33 | 0.51 | 4.46 | 0.46 | 3.99 | NA | NA | 21.55 | 103.14 | 11.69 | 103.14 | 24.06 | NA | NA | NM | ||||||||||||||||||||||||||||||||||||||||||||||||||||
RP® Financial, LC.
Exhibit IV-1B
Weekly Thrift Market Line - Part Two
Prices As of November 25, 2016
| Key Financial Ratios | Asset Quality Ratios | Pricing Ratios | Dividend Data (6) | |||||||||||||||||||||||||||||||||||||||||||||||||||||||||||||||||||
| Equity/ | Tang Equity/ | Reported Earnings | Core Earnings | NPAs/ | Rsvs/ | Price/ | Price/ | Price/ | Price/ | Price/ | Div/ | Dividend | Payout | |||||||||||||||||||||||||||||||||||||||||||||||||||||||||
| Assets(1) | Assets(1) | ROA(5) | ROE(5) | ROA(5) | ROE(5) | Assets | NPLs | Earnings | Book | Assets | Tang Book | Core Earnings | Share | Yield | Ratio (7) | |||||||||||||||||||||||||||||||||||||||||||||||||||||||
| (%) | (%) | (%) | (%) | (%) | (%) | (%) | (%) | (x) | (%) | (%) | (%) | (x) | ($) | (%) | (%) | |||||||||||||||||||||||||||||||||||||||||||||||||||||||
| Companies |
||||||||||||||||||||||||||||||||||||||||||||||||||||||||||||||||||||||
| WNEB |
Western New England Bancorp, Inc. | MA | 10.54 | 10.54 | 0.33 | 3.11 | 0.39 | 3.71 | 0.59 | 122.46 | 34.00 | 107.29 | 11.31 | 107.29 | 28.51 | 0.12 | 1.41 | 48.00 | ||||||||||||||||||||||||||||||||||||||||||||||||||||
| WBKC |
Wolverine Bancorp, Inc. | MI | 17.20 | 17.20 | 1.13 | 7.00 | 1.13 | 7.00 | 1.92 | 132.93 | 13.07 | 93.33 | 16.05 | 93.33 | 13.07 | NA | NA | 46.73 | ||||||||||||||||||||||||||||||||||||||||||||||||||||
| WSFS |
WSFS Financial Corporation | DE | 10.44 | 8.05 | 1.04 | 9.85 | 1.33 | 12.50 | 0.61 | 104.48 | 21.45 | 191.31 | 19.98 | 254.70 | 16.93 | 0.28 | 0.66 | 12.69 | ||||||||||||||||||||||||||||||||||||||||||||||||||||
| WVFC |
WVS Financial Corp. | PA | 9.85 | 9.85 | 0.42 | 4.32 | 0.42 | 4.26 | 0.08 | 149.21 | 17.58 | 79.14 | 7.80 | 79.14 | 17.84 | 0.16 | 1.23 | 27.03 | ||||||||||||||||||||||||||||||||||||||||||||||||||||
| MHCs |
||||||||||||||||||||||||||||||||||||||||||||||||||||||||||||||||||||||
| GCBC |
Greene County Bancorp, Inc. (MHC) | NY | 8.56 | 8.56 | 1.12 | 12.84 | 1.12 | 12.84 | 0.61 | 193.63 | 19.73 | 241.03 | 20.62 | 241.03 | 19.73 | 0.38 | 1.75 | 34.09 | ||||||||||||||||||||||||||||||||||||||||||||||||||||
| HONE |
HarborOne Bancorp, Inc. (MHC) | MA | 13.97 | 13.47 | 0.20 | 1.99 | 0.34 | 3.29 | 2.17 | 32.29 | NA | 192.19 | 26.85 | 200.51 | NA | NA | NA | NA | ||||||||||||||||||||||||||||||||||||||||||||||||||||
| KFFB |
Kentucky First Federal Bancorp (MHC) | KY | 22.87 | 18.88 | 0.43 | 1.86 | 0.43 | 1.86 | NA | NA | 54.06 | 108.74 | 24.87 | 138.51 | 54.06 | 0.40 | 4.62 | 250.00 | ||||||||||||||||||||||||||||||||||||||||||||||||||||
| LSBK |
Lake Shore Bancorp, Inc. (MHC) | NY | 16.16 | 16.16 | 0.88 | 5.56 | 0.64 | 4.03 | 1.38 | 36.15 | 19.97 | 111.82 | 18.07 | 111.82 | 27.54 | 0.28 | 1.97 | 39.44 | ||||||||||||||||||||||||||||||||||||||||||||||||||||
| MGYR |
Magyar Bancorp, Inc. (MHC) | NJ | 8.17 | 8.17 | 0.19 | 2.32 | NA | NA | NA | NA | 55.79 | 129.28 | 10.56 | 129.28 | NA | NA | NA | NM | ||||||||||||||||||||||||||||||||||||||||||||||||||||
| OFED |
Oconee Federal Financial Corp. (MHC) | SC | 17.59 | 17.03 | 1.05 | 6.21 | 1.04 | 6.16 | 1.15 | 19.69 | 25.34 | 149.99 | 26.39 | 156.05 | 25.56 | 0.40 | 1.81 | 45.98 | ||||||||||||||||||||||||||||||||||||||||||||||||||||
| PVBC |
Provident Bancorp, Inc. (MHC) | MA | 14.10 | 14.10 | 0.82 | 5.71 | 0.78 | 5.42 | 0.65 | 168.33 | NA | 157.37 | 22.19 | 157.37 | NA | NA | NA | NA | ||||||||||||||||||||||||||||||||||||||||||||||||||||
| TFSL |
TFS Financial Corporation (MHC) | OH | 12.87 | 12.80 | 0.65 | 4.73 | NA | NA | 1.58 | 31.39 | 67.21 | 322.14 | 41.45 | 324.04 | NA | 0.50 | 2.66 | 116.07 | ||||||||||||||||||||||||||||||||||||||||||||||||||||
| Under Acquisition |
||||||||||||||||||||||||||||||||||||||||||||||||||||||||||||||||||||||
| AF |
Astoria Financial Corporation | NY | 11.53 | 10.41 | 0.49 | 4.41 | 0.51 | 4.56 | 1.69 | 37.20 | 25.47 | 104.68 | 11.25 | 118.59 | 24.50 | 0.16 | 0.98 | 25.00 | ||||||||||||||||||||||||||||||||||||||||||||||||||||
| EVER |
EverBank Financial Corp | FL | 6.60 | 6.45 | 0.49 | 7.07 | NA | NA | 0.74 | 45.16 | 20.14 | 138.91 | 8.49 | 142.84 | NA | 0.24 | 1.24 | 25.00 | ||||||||||||||||||||||||||||||||||||||||||||||||||||
| GTWN |
Georgetown Bancorp, Inc. | MA | 10.30 | 10.30 | 0.25 | 2.39 | 0.27 | 2.55 | NA | NA | 60.23 | 146.98 | 15.14 | 146.98 | 56.51 | 0.20 | 0.77 | 45.93 | ||||||||||||||||||||||||||||||||||||||||||||||||||||
| (1) | Average of High/Low or Bid/Ask price per share. |
| (2) | Or since offering price if converted of first listed in the past 52 weeks. Percent change figures are actual year-to-date and are not annualized. |
| (3) | EPS (earnings per share) is based on actual trailing 12 month data and is not shown on a pro forma basis. |
| (4) | Exludes intangibles (such as goodwill, value of core deposits, etc.). |
| (5) | ROA (return on assets) and ROE (return on equity) are indicated ratios based on trailing 12 month common earnings and average common equity and total assets balances. |
| (6) | Annualized based on last regular quarterly cash dividend announcement. |
| (7) | Indicated dividend as a percent of trailing 12 month earnings. |
| (8) | Excluded from averages due to actual or rumored acquisition activities or unusual operating characteristics. |
| (9) | For MHC institutions, market value reflects share price multiplied by public (non-MHC) shares. |
Source: SNL Financial, LC. and RP® Financial, LC. calculations. The information provided in this table has been obtained from sources we believe are reliable, but we cannot guarantee the accuracy or completeness of such information.
Copyright (c) 2016 by RP® Financial, LC.
EXHIBIT IV-2
Newton Federal Bank
Historical Stock Price Indices
Exhibit IV-2
Newton Federal Bank
Historical Stock Price Indices(1)
| SNL | SNL | |||||||||||||||||||||
| NASDAQ | Thrift | Bank | ||||||||||||||||||||
| Year/Qtr. Ended |
DJIA | S&P 500 | Composite | Index | Index | |||||||||||||||||
| 2004: |
Quarter 1 |
10357.7 | 1126.2 | 1994.2 | 1585.3 | 562.20 | ||||||||||||||||
| Quarter 2 |
10435.5 | 1140.8 | 2047.8 | 1437.8 | 546.62 | |||||||||||||||||
| Quarter 3 |
10080.3 | 1114.6 | 1896.8 | 1495.1 | 556.00 | |||||||||||||||||
| Quarter 4 |
10783.0 | 1211.9 | 2175.4 | 1605.6 | 595.10 | |||||||||||||||||
| 2005: |
Quarter 1 |
10503.8 | 1180.6 | 1999.2 | 1516.6 | 551.00 | ||||||||||||||||
| Quarter 2 |
10275.0 | 1191.3 | 2057.0 | 1577.1 | 563.27 | |||||||||||||||||
| Quarter 3 |
10568.7 | 1228.8 | 2151.7 | 1527.2 | 546.30 | |||||||||||||||||
| Quarter 4 |
10717.5 | 1248.3 | 2205.3 | 1616.4 | 582.80 | |||||||||||||||||
| 2006: |
Quarter 1 |
11109.3 | 1294.8 | 2339.8 | 1661.1 | 595.50 | ||||||||||||||||
| Quarter 2 |
11150.2 | 1270.2 | 2172.1 | 1717.9 | 601.14 | |||||||||||||||||
| Quarter 3 |
11679.1 | 1335.9 | 2258.4 | 1727.1 | 634.00 | |||||||||||||||||
| Quarter 4 |
12463.2 | 1418.3 | 2415.3 | 1829.3 | 658.60 | |||||||||||||||||
| 2007: |
Quarter 1 |
12354.4 | 1420.9 | 2421.6 | 1703.6 | 634.40 | ||||||||||||||||
| Quarter 2 |
13408.6 | 1503.4 | 2603.2 | 1645.9 | 622.63 | |||||||||||||||||
| Quarter 3 |
13895.6 | 1526.8 | 2701.5 | 1523.3 | 595.80 | |||||||||||||||||
| Quarter 4 |
13264.8 | 1468.4 | 2652.3 | 1058.0 | 492.85 | |||||||||||||||||
| 2008: |
Quarter 1 |
12262.9 | 1322.7 | 2279.1 | 1001.5 | 442.5 | ||||||||||||||||
| Quarter 2 |
11350.0 | 1280.0 | 2293.0 | 822.6 | 332.2 | |||||||||||||||||
| Quarter 3 |
10850.7 | 1166.4 | 2082.3 | 760.1 | 414.8 | |||||||||||||||||
| Quarter 4 |
8776.4 | 903.3 | 1577.0 | 653.9 | 268.3 | |||||||||||||||||
| 2009: |
Quarter 1 |
7608.9 | 797.9 | 1528.6 | 542.8 | 170.1 | ||||||||||||||||
| Quarter 2 |
8447.0 | 919.3 | 1835.0 | 538.8 | 227.6 | |||||||||||||||||
| Quarter 3 |
9712.3 | 1057.1 | 2122.4 | 561.4 | 282.9 | |||||||||||||||||
| Quarter 4 |
10428.1 | 1115.1 | 2269.2 | 587.0 | 260.8 | |||||||||||||||||
| 2010: |
Quarter 1 |
10856.6 | 1169.4 | 2398.0 | 626.3 | 301.1 | ||||||||||||||||
| Quarter 2 |
9744.0 | 1030.7 | 2109.2 | 564.5 | 257.2 | |||||||||||||||||
| Quarter 3 |
9744.0 | 1030.7 | 2109.2 | 564.5 | 257.2 | |||||||||||||||||
| Quarter 4 |
11577.5 | 1257.6 | 2652.9 | 592.2 | 290.1 | |||||||||||||||||
| 2011: |
Quarter 1 |
12319.7 | 1325.8 | 2781.1 | 578.1 | 293.1 | ||||||||||||||||
| Quarter 2 |
12414.3 | 1320.6 | 2773.5 | 540.8 | 266.8 | |||||||||||||||||
| Quarter 3 |
10913.4 | 1131.4 | 2415.4 | 443.2 | 198.9 | |||||||||||||||||
| Quarter 4 |
12217.6 | 1257.6 | 2605.2 | 481.4 | 221.3 | |||||||||||||||||
| 2012: |
Quarter 1 |
13212.0 | 1408.5 | 3091.6 | 529.3 | 284.9 | ||||||||||||||||
| Quarter 2 |
12880.1 | 1362.2 | 2935.1 | 511.6 | 257.3 | |||||||||||||||||
| Quarter 3 |
13437.1 | 1440.7 | 3116.2 | 557.6 | 276.8 | |||||||||||||||||
| Quarter 4 |
13104.1 | 1426.2 | 3019.5 | 565.8 | 292.7 | |||||||||||||||||
| 2013: |
Quarter 1 |
14578.5 | 1569.2 | 3267.5 | 602.3 | 318.9 | ||||||||||||||||
| Quarter 2 |
14909.6 | 1606.3 | 3404.3 | 625.3 | 346.7 | |||||||||||||||||
| Quarter 3 |
15129.7 | 1681.6 | 3771.5 | 650.8 | 354.4 | |||||||||||||||||
| Quarter 4 |
16576.7 | 1848.4 | 4176.6 | 706.5 | 394.4 | |||||||||||||||||
| 2014: |
Quarter 1 |
16457.7 | 1872.3 | 4199.0 | 718.9 | 410.8 | ||||||||||||||||
| Quarter 2 |
16826.6 | 1960.2 | 4408.2 | 723.9 | 405.2 | |||||||||||||||||
| Quarter 3 |
17042.9 | 1972.3 | 4493.4 | 697.7 | 411.0 | |||||||||||||||||
| Quarter 4 |
17823.1 | 2058.9 | 4736.1 | 738.7 | 432.8 | |||||||||||||||||
| 2015: |
Quarter 1 |
17776.1 | 2067.9 | 4900.9 | 749.3 | 418.8 | ||||||||||||||||
| Quarter 2 |
17619.5 | 2063.1 | 4986.9 | 795.7 | 448.4 | |||||||||||||||||
| Quarter 3 |
16284.7 | 1920.0 | 4620.2 | 811.7 | 409.4 | |||||||||||||||||
| Quarter 4 |
17425.0 | 2043.9 | 5007.4 | 809.1 | 431.5 | |||||||||||||||||
| 2016: |
Quarter 1 |
17685.1 | 2059.7 | 4869.9 | 788.1 | 381.4 | ||||||||||||||||
| Quarter 2 |
17930.0 | 2098.9 | 4842.7 | 780.9 | 385.6 | |||||||||||||||||
| Quarter 3 |
18308.2 | 2168.3 | 5312.0 | 827.2 | 413.7 | |||||||||||||||||
| As of Nov. 25, 2016 |
19152.1 | 2213.4 | 5398.9 | 932.5 | 502.6 | |||||||||||||||||
| (1) | End of period data. |
Sources: SNL Financial and The Wall Street Journal.
EXHIBIT IV-3
Newton Federal Bank
Historical Thrift Stock Indices
Industry: Savings Bank/Thrift/Mutual
Geography: United States and Canada
| Close | Last Update | Change (%) | Price / Earnings (x) |
|||||||||||||||||||||||||||||||||||||
| 1 Day | 1 Week | MTD | QTD | YTD | 1 Year | 3 Years | ||||||||||||||||||||||||||||||||||
| SNL Custom** Indexes |
| |||||||||||||||||||||||||||||||||||||||
| SNL Banking Indexes |
||||||||||||||||||||||||||||||||||||||||
| SNL U.S. Bank and Thrift |
482.31 | 11/25/2016 | 0.36 | 1.58 | 16.72 | 21.23 | 16.46 | 12.37 | 29.43 | 16.0 | ||||||||||||||||||||||||||||||
| SNL U.S. Thrift |
932.54 | 11/25/2016 | 0.46 | 1.40 | 11.94 | 12.74 | 15.26 | 13.83 | 35.13 | 30.7 | ||||||||||||||||||||||||||||||
| SNL TARP Participants |
89.24 | 11/25/2016 | (2.29 | ) | (1.29 | ) | 20.72 | 19.32 | 70.67 | 52.08 | 17.35 | 16.1 | ||||||||||||||||||||||||||||
| S&P 500 Bank |
267.61 | 11/25/2016 | 0.47 | 1.56 | 16.84 | 22.34 | 14.25 | 11.55 | 30.98 | NA | ||||||||||||||||||||||||||||||
| NASDAQ Bank |
3,628.06 | 11/25/2016 | 0.07 | 2.17 | 19.25 | 20.93 | 27.16 | 19.85 | 42.65 | NA | ||||||||||||||||||||||||||||||
| SNL Asset Size Indexes |
||||||||||||||||||||||||||||||||||||||||
| SNL U.S. Thrift < $250M |
1,077.65 | 11/25/2016 | 0.24 | 1.94 | 4.63 | (3.14 | ) | (0.40 | ) | 4.76 | 22.85 | 29.4 | ||||||||||||||||||||||||||||
| SNL U.S. Thrift $250M-$500M |
5,541.09 | 11/25/2016 | (0.06 | ) | (0.33 | ) | 2.26 | 3.67 | 9.53 | 11.53 | 42.15 | 28.5 | ||||||||||||||||||||||||||||
| SNL U.S. Thrift < $500M |
1,883.02 | 11/25/2016 | (0.04 | ) | (0.23 | ) | 2.33 | 3.14 | 8.97 | 11.12 | 41.41 | 28.5 | ||||||||||||||||||||||||||||
| SNL U.S. Thrift $500M-$1B |
2,621.16 | 11/25/2016 | 0.70 | 1.70 | 8.51 | 10.48 | 16.15 | 18.74 | 59.21 | 20.5 | ||||||||||||||||||||||||||||||
| SNL U.S. Thrift $1B-$5B |
3,432.34 | 11/25/2016 | 0.40 | 2.23 | 14.39 | 16.98 | 25.70 | 23.83 | 56.87 | 26.6 | ||||||||||||||||||||||||||||||
| SNL U.S. Thrift $5B-$10B |
1,029.92 | 11/25/2016 | 0.76 | 1.91 | 18.10 | 16.99 | 28.41 | 25.37 | 25.75 | 27.4 | ||||||||||||||||||||||||||||||
| SNL U.S. Thrift > $10B |
170.71 | 11/25/2016 | 0.34 | 0.75 | 8.68 | 9.30 | 4.90 | 3.54 | 21.78 | 37.3 | ||||||||||||||||||||||||||||||
| SNL Market Cap Indexes |
||||||||||||||||||||||||||||||||||||||||
| SNL Micro Cap U.S. Thrift |
950.58 | 11/25/2016 | 0.27 | 1.20 | 5.20 | 6.88 | 8.60 | 9.37 | 42.01 | 22.5 | ||||||||||||||||||||||||||||||
| SNL Micro Cap U.S. Bank & Thrift |
635.60 | 11/25/2016 | 0.35 | 1.81 | 6.54 | 7.06 | 12.31 | 13.17 | 39.73 | 17.1 | ||||||||||||||||||||||||||||||
| SNL Small Cap U.S. Thrift |
754.61 | 11/25/2016 | 0.48 | 2.28 | 15.47 | 18.00 | 28.15 | 24.32 | 51.54 | 24.6 | ||||||||||||||||||||||||||||||
| SNL Small Cap U.S. Bank & Thrift |
632.37 | 11/25/2016 | 0.23 | 2.09 | 17.02 | 17.23 | 27.13 | 21.21 | 46.24 | 20.6 | ||||||||||||||||||||||||||||||
| SNL Mid Cap U.S. Thrift |
362.32 | 11/25/2016 | 0.63 | 1.31 | 12.58 | 12.63 | 20.43 | 17.23 | 35.50 | 25.4 | ||||||||||||||||||||||||||||||
| SNL Mid Cap U.S. Bank & Thrift |
412.15 | 11/25/2016 | 0.06 | 2.15 | 19.48 | 20.37 | 27.49 | 17.63 | 37.82 | 21.2 | ||||||||||||||||||||||||||||||
| SNL Large Cap U.S. Thrift |
163.59 | 11/25/2016 | 0.21 | 0.67 | 8.36 | 8.96 | (3.21 | ) | (2.58 | ) | 9.91 | 67.2 | ||||||||||||||||||||||||||||
| SNL Large Cap U.S. Bank & Thrift |
310.54 | 11/25/2016 | 0.41 | 1.44 | 16.29 | 21.69 | 14.16 | 10.86 | 26.99 | 14.9 | ||||||||||||||||||||||||||||||
| SNL Geographic Indexes |
||||||||||||||||||||||||||||||||||||||||
| SNL Mid-Atlantic U.S. Thrift |
3,542.63 | 11/25/2016 | 0.49 | 1.59 | 14.05 | 15.32 | 12.82 | 11.48 | 26.30 | 27.6 | ||||||||||||||||||||||||||||||
| SNL Midwest U.S. Thrift |
3,307.93 | 11/25/2016 | 0.28 | 0.43 | 8.00 | 9.29 | 15.15 | 14.31 | 58.33 | 40.5 | ||||||||||||||||||||||||||||||
| SNL New England U.S. Thrift |
2,885.04 | 11/25/2016 | 0.79 | 2.63 | 13.72 | 18.16 | 28.24 | 24.56 | 47.05 | 29.9 | ||||||||||||||||||||||||||||||
| SNL Southeast U.S. Thrift |
394.13 | 11/25/2016 | 0.25 | 0.33 | 1.78 | 1.45 | 18.14 | 12.11 | 23.68 | 20.3 | ||||||||||||||||||||||||||||||
| SNL Southwest U.S. Thrift |
735.84 | 11/25/2016 | 0.00 | 0.29 | (0.13 | ) | 6.90 | 7.31 | 7.96 | 45.47 | 24.2 | |||||||||||||||||||||||||||||
| SNL Western U.S. Thrift |
129.20 | 11/25/2016 | 0.66 | 3.29 | 21.98 | 9.87 | 18.30 | 20.65 | 41.00 | 17.4 | ||||||||||||||||||||||||||||||
| SNL Stock Exchange Indexes |
||||||||||||||||||||||||||||||||||||||||
| SNL U.S. Thrift NYSE |
147.94 | 11/25/2016 | 0.38 | 0.50 | 9.27 | 10.36 | 7.34 | 5.70 | 10.26 | 19.3 | ||||||||||||||||||||||||||||||
| SNL U.S. Thrift NASDAQ |
2,746.25 | 11/25/2016 | 0.49 | 1.79 | 13.13 | 13.78 | 18.93 | 17.61 | 46.53 | 33.3 | ||||||||||||||||||||||||||||||
| SNL U.S. Thrift Pink |
275.08 | 11/25/2016 | 0.15 | 0.17 | (0.70 | ) | 2.66 | 7.20 | 4.27 | 43.18 | 17.2 | |||||||||||||||||||||||||||||
| SNL Other Indexes |
||||||||||||||||||||||||||||||||||||||||
| SNL U.S. Thrift MHCs |
6,372.51 | 11/25/2016 | 0.12 | 0.70 | 6.73 | 7.72 | 4.63 | 4.94 | 61.28 | 63.8 | ||||||||||||||||||||||||||||||
| Broad Market Indexes |
||||||||||||||||||||||||||||||||||||||||
| DJIA |
19,152.14 | 11/25/2016 | 0.36 | 1.51 | 5.57 | 4.61 | 9.91 | 7.52 | 19.16 | NA | ||||||||||||||||||||||||||||||
| S&P 500 |
2,213.35 | 11/25/2016 | 0.39 | 1.44 | 4.10 | 2.08 | 8.29 | 5.96 | 22.79 | NA | ||||||||||||||||||||||||||||||
| S&P Mid-Cap |
1,640.81 | 11/25/2016 | 0.32 | 2.17 | 8.70 | 5.70 | 17.32 | 12.06 | 25.66 | NA | ||||||||||||||||||||||||||||||
| S&P Small-Cap |
825.28 | 11/25/2016 | 0.44 | 2.77 | 14.21 | 9.03 | 22.86 | 16.69 | 27.47 | NA | ||||||||||||||||||||||||||||||
| S&P 500 Financials |
371.95 | 11/25/2016 | 0.25 | 1.22 | 13.49 | 15.94 | 15.61 | 12.94 | 28.57 | NA | ||||||||||||||||||||||||||||||
| SNL U.S. Financial Institutions |
813.50 | 11/25/2016 | 0.23 | 1.54 | 14.02 | 15.67 | 14.74 | 11.16 | 25.99 | 17.2 | ||||||||||||||||||||||||||||||
| MSCI US IMI Financials |
1,389.33 | 11/25/2016 | 0.25 | 1.33 | 13.59 | 15.51 | 17.27 | 14.14 | 29.23 | NA | ||||||||||||||||||||||||||||||
| NASDAQ |
5,398.92 | 11/25/2016 | 0.34 | 1.45 | 4.04 | 1.64 | 7.82 | 5.53 | 35.16 | NA | ||||||||||||||||||||||||||||||
| NASDAQ Finl |
3,860.87 | 11/25/2016 | 0.15 | 1.65 | 12.95 | 11.26 | 19.11 | 13.81 | 27.68 | NA | ||||||||||||||||||||||||||||||
| NYSE |
10,878.09 | 11/25/2016 | 0.39 | 1.57 | 3.78 | 1.46 | 7.24 | 4.09 | 6.90 | NA | ||||||||||||||||||||||||||||||
| Russell 1000 |
1,229.11 | 11/25/2016 | 0.39 | 1.50 | 4.41 | 2.23 | 8.59 | 6.02 | 22.57 | NA | ||||||||||||||||||||||||||||||
| Russell 2000 |
1,347.20 | 11/25/2016 | 0.38 | 2.40 | 13.08 | 7.63 | 18.60 | 12.45 | 19.78 | NA | ||||||||||||||||||||||||||||||
| Russell 3000 |
1,318.56 | 11/25/2016 | 0.39 | 1.57 | 5.05 | 2.64 | 9.32 | 6.50 | 22.31 | NA | ||||||||||||||||||||||||||||||
| S&P TSX Composite |
15,075.44 | 11/25/2016 | 0.00 | 1.42 | 1.95 | 2.37 | 15.88 | 12.47 | 11.90 | NA | ||||||||||||||||||||||||||||||
| MSCI AC World (USD) |
414.96 | 11/25/2016 | 0.44 | 1.38 | 0.96 | (0.83 | ) | 3.91 | 1.47 | 3.57 | NA | |||||||||||||||||||||||||||||
| MSCI World (USD) |
1,720.84 | 11/25/2016 | 0.44 | 1.38 | 1.77 | (0.28 | ) | 3.49 | 1.36 | 5.98 | NA | |||||||||||||||||||||||||||||
| Bermuda Royal Gazette/BSX |
1,766.32 | 11/25/2016 | 0.00 | (0.45 | ) | 9.22 | 12.88 | 35.45 | 32.81 | 50.99 | NA | |||||||||||||||||||||||||||||
Intraday data is available for certain exchanges. In all cases, the data is at least 15 minutes delayed.
| **- | Non-publicly traded institutions and institutions outside of your current subscription are not included in custom indexes. Custom indexes including foreign institutions do not take into account currency translations. Data is as of the previous close. |
All SNL indexes are market-value weighted; i.e., an institution’s effect on an index is proportional to that institution’s market capitalization.
Source: MSCI. MSCI makes no express or implied warranties or representations and shall have no liability whatsoever with respect to any MSCI data contained herein. The MSCI data may not be further redistributed or used as a basis for other indices or any securities or financial products.
Mid-Atlantic: DE, DC, MD, NJ, NY, PA, PR Midwest: IA, IN, IL, KS, KY, MI, MN, MO, ND, NE, OH, SD, WI
New England: CT, ME, MA, NH, RI, VT Southeast: AL, AR, FL, GA, MS, NC, SC, TN, VA, WV
Southwest: CO, LA, NM, OK, TX, UT West: AZ, AK, CA, HI, ID, MT, NV, OR, WA, WY
EXHIBIT IV-4
Newton Federal Bank
Market Area Acquisition Activity
Exhibit IV-4
Georgia Thrift Acquisitions 2000 - Present
| Target Financials at Announcement | Deal Terms and Pricing at Announcement | |||||||||||||||||||||||||||||||||||||||||||||||||||||||||||||||||
| Announce Date |
Complete |
Buyer Short Name |
Target Name |
Total Assets ($000) |
E/A (%) |
TE/A (%) |
LTM ROAA (%) |
LTM ROAE (%) |
NPAs/ Assets (%) |
Rsrvs/ NPLs (%) |
Deal Value ($M) |
Value/ Share ($) |
P/B (%) |
P/TB (%) |
P/E (x) |
P/A (%) |
Prem/ Cdeps (%) |
|||||||||||||||||||||||||||||||||||||||||||||||||
| 12/10/2014 |
07/01/2015 | Renasant Corp. |
MS |
Heritage Financial Group, Inc. |
GA | 1,755,534 | 9.11 | 8.44 | 0.60 | 6.60 | 0.88 | 85.65 | 254.4 | 27.576 | 158.33 | 172.10 | 24.62 | 15.08 | 10.90 | |||||||||||||||||||||||||||||||||||||||||||||||
| 02/27/2014 |
12/01/2014 | Oconee Federal Financial Corp. |
SC |
Stephens Federal Bank |
GA | 158,267 | 4.19 | 4.19 | -0.39 | -9.32 | 12.40 | 43.88 | NA | NA | NA | NA | NA | NA | NA | |||||||||||||||||||||||||||||||||||||||||||||||
| 08/28/2005 |
03/14/2006 | RLJ Companies LLC |
MD |
Worldwide Financial Investors Inc. |
GA | 9,806 | 35.58 | 34.82 | -5.97 | -14.41 | 1.35 | 135.61 | NA | NA | NA | NA | NA | NA | NA | |||||||||||||||||||||||||||||||||||||||||||||||
| 03/31/2005 |
07/01/2005 | Omni Financial Services |
GA |
Georgia Community Bancshares, Inc. |
GA | 45,088 | 2.67 | 2.54 | -8.06 | -160.78 | 9.15 | 74.02 | 2.0 | NA | 168.05 | 176.86 | NM | 4.49 | 2.01 | |||||||||||||||||||||||||||||||||||||||||||||||
| 03/16/2004 |
06/01/2004 | United Community Banks Inc. |
GA |
Fairbanco Holding Company, Inc. |
GA | 191,660 | 9.42 | 9.42 | 0.82 | 9.01 | 1.60 | 229.11 | 23.6 | 30.379 | 130.94 | 130.94 | 14.70 | 12.33 | 5.75 | |||||||||||||||||||||||||||||||||||||||||||||||
| 03/26/2002 |
07/22/2002 | Royal Bank of Canada |
0 | Eagle Bancshares, Inc. |
GA | 1,148,807 | 7.29 | 7.29 | NA | NA | 1.40 | 65.12 | 154.2 | 26.000 | 176.15 | 176.15 | NM | 13.42 | 12.58 | |||||||||||||||||||||||||||||||||||||||||||||||
| 10/23/2001 |
03/29/2002 | Colony Bankcorp Inc. |
GA |
Quitman Bancorp, Inc. |
GA | 65,258 | 9.90 | 9.90 | NA | NA | 0.47 | 169.29 | 7.2 | 13.460 | 105.73 | 105.73 | 28.04 | 11.09 | 1.62 | |||||||||||||||||||||||||||||||||||||||||||||||
| 01/18/2001 |
05/23/2001 | Community First Banking Co. |
GA |
First Deposit Bancshares, Inc. |
GA | 138,779 | 17.54 | 17.54 | NA | NA | 0.16 | 505.43 | 30.6 | 19.375 | 119.60 | 119.60 | 18.45 | 22.02 | 9.47 | |||||||||||||||||||||||||||||||||||||||||||||||
|
|
|
|
|
|
|
|
|
|
|
|
|
|
|
|
|
|
|
|
|
|
|
|
|
|||||||||||||||||||||||||||||||||||||||||||
| Average: |
439,150 | 11.96 | 11.77 | -2.60 | -33.78 | 3.43 | 163.51 | 143.13 | 146.90 | 21.45 | 13.07 | 7.06 | ||||||||||||||||||||||||||||||||||||||||||||||||||||||
| Median: |
148,523 | 9.26 | 8.93 | -0.39 | -9.32 | 1.37 | 110.63 | 144.64 | 151.52 | 21.54 | 12.88 | 7.61 | ||||||||||||||||||||||||||||||||||||||||||||||||||||||
Source: SNL Financial, LC.
EXHIBIT IV-5
Newton Federal Bank
Director and Senior Management Summary Resumes
Troy B. Brooks is the Chief Financial Officer of Piedmont Newton Hospital, Inc., located in Covington, Georgia, where he has worked since 1986. Previously, Mr. Brooks was Chief Financial Officer at Healthcare Management Corporation in Columbus, Georgia; Chief Financial Officer at Upson Regional Medical Center in Thomaston, Georgia, and Assistant Controller at Humana Shoals Hospital in Sheffield, Alabama. He is a long-time member of the Georgia Chapter of the Healthcare Financial Management Association. Mr. Brooks has served as President of the Covington-Newton County Chamber of Commerce and served on the Executive Committee of that board for eight years. He has served as the Chairman of the Board of the Covington Family YMCA and also served as President of the Rockdale Swim League.
William D. Fortson, Jr. has over 47 years’ experience in the automobile industry, and has been the owner of Ginn Motor Company, located in Covington, Georgia, since 1987. Mr. Fortson has also served as member/manager of Ginn Chrysler, Jeep, Dodge, LLC since 2009. Mr. Fortson has strong marketing, sales, and customer service assessment skills, as well as significant experience in employee development, training, and business management.
Marshall L. Ginn has been a licensed real estate broker since 1996, and is an Associate Broker with RE/MAX Agents Realty, located in Covington, Georgia. Mr. Ginn assists in the purchase and sale of residential, commercial and industrial properties as well as raw land. Prior to joining RE/MAX, Mr. Ginn was co-founder of Medical Services South and founder of ELCO Medical, privately held corporations specializing in the marketing and sale of orthopedic implants and products. He has served as President of the East Metro Board of Realtors and Chairman of the Newton County Chamber of Commerce. Mr. Ginn brings the board of directors a unique perspective of the community in areas of economic development, residential housing and commercial opportunities.
Bob W. Richardson was a licensed pharmacist for 40 years until his retirement in 2010. Mr. Richardson was the owner and manager of People’s Drug Store, located in Athens, Georgia, beginning in 1979. Mr. Richardson is also the co-owner of Taziki’s Mediterranean Cafe, located in Athens, Georgia, which opened in 2014. Mr. Richardson’s experience as a small business owner gives him extensive insight into the customers who live in our market areas and economic developments affecting the communities in which we operate, as well as the challenges facing small businesses in our market area.
Johnny S. Smith has served as the President and Chief Executive Officer of Newton Federal Bank since February 2016, having joined Newton Federal Bank in 1992 as Comptroller. Mr. Smith served as an elected board member of the Newton County School System and is the Chairman of the Board of the Rotary Club of Covington’s foundation. Mr. Smith’s positions as President and Chief Executive Officer foster clear accountability, effective decision-making, a clear and direct channel of communication from senior management to the full board of directors, and alignment on corporate strategy.
EXHIBIT IV-5 (continued)
Newton Federal Bank
Director and Senior Management Summary Resumes
Gregory J. Proffitt, age 48, was appointed our Executive Vice President and Chief Operations Officer in February 2016. Mr. Proffitt has been employed with Newton Federal Bank since 2005, serving as Senior Vice President and Chief Operations Officer beginning in November 2013 and as Controller and Compliance Officer. Prior to being employed with Newton Federal Bank, Mr. Proffitt has served in various roles with other companies including SunTrust Bank, The Federal Reserve Bank of Atlanta, John H. Harland Company, The Original Honey Baked Ham Company, Allied Automotive Group, and Blue Cross Blue Shield of Georgia.
Kenneth D. Lumpkin, age 51, is our Executive Vice President and Chief Lending and Marketing Officer, and has served in those positions since February 2016. Mr. Lumpkin previously served as our Vice President and Director of Sales and marketing, and joined Newton Federal Bank as a consultant in June 2014. From December 2012 to June 2014, Mr. Lumpkin was a licensed real estate agent for Progressive Realty LLC, located in Winder, Georgia. Mr. Lumpkin was not employed from June 2011 to December 2012, but previously worked at The Peoples Bank of Winder, Winder, Georgia, from 1998 to 2011, most recently as Executive Vice President and head of production. Prior to joining The Peoples Bank of Winder, Mr. Lumpkin served as Vice President and Commercial Lender at Regions Bank. He began his banking career in 1988 with Bank of America (formerly known as Bank South and Nations Bank).
Tessa M. Nolan, age 31, was named our Senior Vice President and Chief Financial Officer in March 2014, and served as our controller beginning in March 2014. Ms. Nolan joined Newton Federal Bank in August 2005.
Tara T. Williams, age 36, is our Senior Vice President and Chief Credit Officer. Ms. Williams joined Newton Federal Bank in 2014 as a Senior Credit Analyst in 2014, and was named Chief Credit Officer in 2015. Ms. Williams was previously a Business Credit Underwriter at First Citizens Bank, Columbia, South Carolina, where she began working in 2007.
Source: Community First Bancshares, Inc.’s Preliminary Offering Prospectus
Exhibit IV-6
| Pro Forma at September 30, 2016 | ||||||||||||||||||||||||||||||||||||||||
| Actual, As of Sept. 30, 2016 |
Minimum 21,505,000 | Midpoint 25,300,000 | Maximum 29,095,000 |
Maximum As Adjusted 33,459,250 |
||||||||||||||||||||||||||||||||||||
| Amount | Percent of Assets |
Amount | Percent of Assets |
Amount | Percent of Assets |
Amount | Percent of Assets |
Amount | Percent of Assets |
|||||||||||||||||||||||||||||||
| (Dollars in Thousands) | ||||||||||||||||||||||||||||||||||||||||
| Capital and Retained Earnings Under GAAP |
||||||||||||||||||||||||||||||||||||||||
| BANK LEVEL |
$ | 45,081 | 19.36 | % | $ | 52,446 | 21.59 | % | $ | 53,842 | 21.99 | % | $ | 55,236 | 22.39 | % | $ | 56,841 | 22.84 | % | ||||||||||||||||||||
|
|
|
|
|
|
|
|
|
|
|
|
|
|
|
|
|
|
|
|
|
|||||||||||||||||||||
| Tier 1 Capital (Leverage) |
$ | 44,801 | 19.32 | % | $ | 52,166 | 21.56 | % | $ | 53,562 | 21.97 | % | $ | 54,956 | 22.36 | % | $ | 56,561 | 22.82 | % | ||||||||||||||||||||
| Requirement |
11,593 | 5.00 | % | 12,099 | 5.00 | % | 12,193 | 5.00 | % | 12,287 | 5.00 | % | 12,395 | 5.00 | % | |||||||||||||||||||||||||
|
|
|
|
|
|
|
|
|
|
|
|
|
|
|
|
|
|
|
|
|
|||||||||||||||||||||
| Excess |
$ | 33,208 | 14.32 | % | $ | 40,067 | 16.56 | % | $ | 41,369 | 16.97 | % | $ | 42,669 | 17.36 | % | $ | 44,166 | 17.82 | % | ||||||||||||||||||||
|
|
|
|
|
|
|
|
|
|
|
|
|
|
|
|
|
|
|
|
|
|||||||||||||||||||||
| Tier I Risk Based |
$ | 44,801 | 30.86 | % | $ | 52,166 | 35.44 | % | $ | 53,562 | 36.30 | % | $ | 54,956 | 37.15 | % | $ | 56,561 | 38.12 | % | ||||||||||||||||||||
| Requirement |
11,614 | 8.00 | % | 11,776 | 8.00 | % | 11,806 | 8.00 | % | 11,836 | 8.00 | % | 11,870 | 8.00 | % | |||||||||||||||||||||||||
|
|
|
|
|
|
|
|
|
|
|
|
|
|
|
|
|
|
|
|
|
|||||||||||||||||||||
| Excess |
$ | 33,187 | 22.86 | % | $ | 40,390 | 27.44 | % | $ | 41,756 | 28.30 | % | $ | 43,120 | 29.15 | % | $ | 44,691 | 30.12 | % | ||||||||||||||||||||
| Total Risk-Based |
$ | 46,647 | 32.13 | % | $ | 54,012 | 36.69 | % | $ | 55,408 | 37.55 | % | $ | 56,802 | 38.39 | % | $ | 58,407 | 39.36 | % | ||||||||||||||||||||
| Risk-Based Requirement |
14,517 | 10.00 | % | 14,720 | 10.00 | % | 14,757 | 10.00 | % | 14,795 | 10.00 | % | 14,838 | 10.00 | % | |||||||||||||||||||||||||
|
|
|
|
|
|
|
|
|
|
|
|
|
|
|
|
|
|
|
|
|
|||||||||||||||||||||
| Excess |
$ | 32,130 | 22.13 | % | $ | 39,292 | 26.69 | % | $ | 40,651 | 27.55 | % | $ | 42,007 | 28.39 | % | $ | 43,569 | 29.36 | % | ||||||||||||||||||||
|
|
|
|
|
|
|
|
|
|
|
|
|
|
|
|
|
|
|
|
|
|||||||||||||||||||||
| Common Eq. Tier 1 RB Capital |
$ | 44,801 | 30.86 | % | $ | 52,166 | 35.44 | % | $ | 53,562 | 36.30 | % | $ | 54,956 | 37.15 | % | $ | 56,561 | 38.12 | % | ||||||||||||||||||||
| Requirement |
9,436 | 6.50 | % | 9,568 | 6.50 | % | 9,592 | 6.50 | % | 9,617 | 6.50 | % | 9,645 | 6.50 | % | |||||||||||||||||||||||||
|
|
|
|
|
|
|
|
|
|
|
|
|
|
|
|
|
|
|
|
|
|||||||||||||||||||||
| Excess |
$ | 35,365 | 24.36 | % | $ | 42,598 | 28.94 | % | $ | 43,970 | 29.80 | % | $ | 45,339 | 30.65 | % | $ | 46,916 | 31.62 | % | ||||||||||||||||||||
|
|
|
|
|
|
|
|
|
|
|
|
|
|
|
|
|
|
|
|
|
|||||||||||||||||||||
| Reconciliation of capital infused into Newton Federal Bank |
|
|||||||||||||||||||||||||||||||||||||||
| Net Offering Proceeds |
|
$ | 20,228 | $ | 23,989 | $ | 27,749 | $ | 32,073 | |||||||||||||||||||||||||||||||
| Proceeds to Newton FB (50%) |
|
$ | 10,114 | $ | 11,995 | $ | 13,875 | $ | 16,037 | |||||||||||||||||||||||||||||||
| Proceeds to MHC |
|
$ | 0 | $ | 0 | $ | 0 | $ | 0 | |||||||||||||||||||||||||||||||
| Less: ESOP |
|
(1,833 | ) | (2,156 | ) | (2,479 | ) | (2,851 | ) | |||||||||||||||||||||||||||||||
| Less: MRP |
|
(916 | ) | (1,078 | ) | (1,240 | ) | (1,426 | ) | |||||||||||||||||||||||||||||||
| Less: Cash Contribution to Foundation |
|
0 | 0 | 0 | 0 | |||||||||||||||||||||||||||||||||||
|
|
|
|
|
|
|
|
|
|||||||||||||||||||||||||||||||||
| Pro Forma Increase |
|
$ | 7,365 | $ | 8,761 | $ | 10,156 | $ | 11,760 | |||||||||||||||||||||||||||||||
EXHIBIT IV-7
Newton Federal Bank
Pro Forma Analysis Sheet- Fully Converted Basis
EXHIBIT IV-7
PRO FORMA ANALYSIS SHEET-FULLY CONVERTED BASIS
COMMUNITY FIRST BANCSHARES, INC.
Prices as of November 25, 2016
| Subject at Midpoint |
Peer Group | Georgia Companies | All Public Thrifts | |||||||||||||||||||||||||||||||||||
| Valuation Pricing Multiples |
Symbol | Mean | Median | Mean | Median | Mean | Median | |||||||||||||||||||||||||||||||
| Price-earnings multiple |
= | P/E | 63.00 | x | 19.28 | x | 17.92 | x | 18.32 | x | 18.32 | x | 18.80 | x | 18.77 | x | ||||||||||||||||||||||
| Price-core earnings multiple |
= | P/CE | 53.47 | x | 21.94 | x | 19.92 | x | 16.80 | x | 16.80 | x | 19.59 | x | 19.15 | x | ||||||||||||||||||||||
| Price-book ratio |
= | P/B | 59.84 | % | 99.32 | % | 98.00 | % | 107.06 | % | 107.06 | % | 123.90 | % | 121.48 | % | ||||||||||||||||||||||
| Price-tangible book ratio |
= | P/TB | 59.84 | % | 100.73 | % | 99.99 | % | 127.40 | % | 127.40 | % | 134.09 | % | 127.40 | % | ||||||||||||||||||||||
| Price-assets ratio |
= | P/A | 19.67 | % | 15.84 | % | 15.61 | % | 15.07 | % | 15.07 | % | 15.20 | % | 14.66 | % | ||||||||||||||||||||||
| Valuation Parameters |
% of Offering |
% of Offering + Foundation |
||||||||||||||||
| Pre-Conversion Earnings (Y) |
$ | 1,157,000 | (12 Mths 9/16) | ESOP Stock as % of Offering (E) | 8.0000 | % | 8.0000 | % | ||||||||||
| Pre-Conversion Core Earnings |
$ | 1,312,620 | (12 Mths 9/16) | Cost of ESOP Borrowings (S) | 0.00 | % | ||||||||||||
| Pre-Conversion Book Value (B) |
$ | 45,081,000 | (9/16) | ESOP Amortization (T) | 25.00 years | |||||||||||||
| Intangibles |
$ | 0 | (9/16) | RRP Stock as % of Offering (M) | 4.0000 | % | 4.0000 | % | ||||||||||
| Pre-Conv. Tang. Book Value (B) |
$ | 45,081,000 | (9/16) | Stock Programs Vesting (N) | 5.00 years | |||||||||||||
| Pre-Conversion Assets (A) |
$ | 232,832,000 | (9/16) | Fixed Expenses | $ | 1,105,000 | ||||||||||||
| Reinv. Rate: (5 Yr Treas)@9/2016 |
1.140 | % | Subscr/Dir Comm Exp (Mdpnt) | $ | 481,000 | 1.00 | % | |||||||||||
| Tax rate (TAX) |
38.00 | % | Total Expenses (Midpoint) | $ | 1,586,000 | |||||||||||||
| A-T Reinvestment Rate(R) |
0.707 | % | Syndicate Expenses (Mdpnt) | $ | 0 | 0.00 | % | |||||||||||
| Est. Conversion Expenses (1)(X) |
2.88 | % | Syndicate Amount | $ | 0 | |||||||||||||
| Insider Purchases ($) |
$ | 2,500,000 | Percent Sold (PCT) | 100.00 | % | |||||||||||||
| Price/Share |
$ | 10.00 | MHC Assets | $ | 100,000 | |||||||||||||
| Foundation Cash Contrib. (FC) |
$ | 0 | Options as % of Offering (O1) | 10.0000 | % | 10.00 | % | |||||||||||
| Found. Stk Contrib (% of Total Shrs (FS) |
0.0000 | % | Estimated Option Value (O2) | 23.40 | % | |||||||||||||
| Foundation Tax Benefit (Z) |
$ | 0 | Option Vesting Period (O3) | 5.00 years | ||||||||||||||
| Foundation Amount (Mdpt.) |
$ | 0 | % of Options taxable (O4) | 25.00 | % | |||||||||||||
| Calculation of Pro Forma Value After Conversion |
||||||||||||
| 1. V= |
P/E * (Y) | V= | $ | 55,000,000 | ||||||||
| 1 - P/E * PCT * ((1-X-E-M-FC-FS)*R - (1-TAX)*E/T - (1-TAX)*M/N)-(1-(TAX*O4))*(O1*O2)/O3) | ||||||||||||
| 1. V= |
P/E * (Y) | V= | $ | 55,000,000 | ||||||||
| 1 - P/Core E * PCT * ((1-X-E-M-FC-FS)*R - (1-TAX)*E/T - (1-TAX)*M/N)-(1-(TAX*O4))*(O1*O2)/O3) | ||||||||||||
| 2. V= |
P/B * (B+Z) | V= | $ | 55,000,000 | ||||||||
| 1 - P/B * PCT * (1-X-E-M-FC-FS) | ||||||||||||
| 2. V= |
P/TB * (TB+Z) | V= | $ | 55,000,000 | ||||||||
| 1 - P/TB * PCT * (1-X-E-M-FC-FS) | ||||||||||||
| 3. V= |
P/A * (A+Z+PA) | V= | $ | 55,000,000 | ||||||||
| 1 - P/A * PCT * (1-X-E-M-FC-FS) | ||||||||||||
| Valuation Conclusion |
Shares Issued to MHC |
Shares Sold to Public |
Foundation Shares |
Total Shares Issued |
Price Per Share |
Market Value of Stock Sold in Offering |
Market Value of Stock Issued in Reorganization |
|||||||||||||||||||||
| Supermaximum |
0 | 7,273,750 | 0 | 7,273,750 | $ | 10.00 | $ | 72,737,500 | $ | 72,737,500 | ||||||||||||||||||
| Maximum |
0 | 6,325,000 | 0 | 6,325,000 | 10.00 | 63,250,000 | $ | 63,250,000 | ||||||||||||||||||||
| Midpoint |
0 | 5,500,000 | 0 | 5,500,000 | 10.00 | 55,000,000 | $ | 55,000,000 | ||||||||||||||||||||
| Minimum |
0 | 4,675,000 | 0 | 4,675,000 | 10.00 | 46,750,000 | $ | 46,750,000 | ||||||||||||||||||||
| Valuation Conclusion |
Shares Issued to MHC |
Shares Sold to Public |
Foundation Shares |
Total Shares Issued |
||||||||||||||||||||||||
| Supermaximum |
0.000 | % | 100.000 | % | 0.000 | % | 100.000 | % | ||||||||||||||||||||
| Maximum |
0.000 | % | 100.000 | % | 0.000 | % | 100.000 | % | ||||||||||||||||||||
| Midpoint |
0.000 | % | 100.000 | % | 0.000 | % | 100.000 | % | ||||||||||||||||||||
| Minimum |
0.000 | % | 100.000 | % | 0.000 | % | 100.000 | % | ||||||||||||||||||||
| (1) | Estimated offering expenses at midpoint of the offering. |
EXHIBIT IV-8
Newton Federal Bank
Pro Forma Effect of Conversion Proceeds – Fully Converted Basis
Exhibit IV-8
PRO FORMA EFFECT OF CONVERSION PROCEEDS
COMMUNITY FIRST BANCSHARES, INC.
At the Minimum of the Range
| 1. | Market Value of Shares Sold In Offering: |
$ | 46,750,000 | |||
| Market Value of Shares Issued to Foundation: |
0 | |||||
|
|
|
|||||
| Total Market Value of Company: |
$ | 46,750,000 | ||||
| 2. | Offering Proceeds of Shares Sold In Offering |
$ | 46,750,000 | |||
| Less: Estimated Offering Expenses |
1,510,100 | |||||
|
|
|
|||||
| Net Conversion Proceeds |
$ | 45,239,900 | ||||
| 3. | Estimated Additional Equity and Income from Offering Proceeds |
|||||
| Net Conversion Proceeds |
$ | 45,239,900 | ||||
| Less: Cash Contribution to Foundation |
0 | |||||
| Less: Non-Cash ESOP Stock Purchases (1) |
(3,740,000 | ) | ||||
| Less: Non-Cash MRP Stock Purchases (2) |
(1,870,000 | ) | ||||
|
|
|
|||||
| Net Conversion Proceeds Reinvested |
$ | 39,629,900 | ||||
| Estimated After-Tax Reinvestment Rate |
0.71 | % | ||||
|
|
|
|||||
| Earnings from Reinvestment of Proceeds |
$ | 280,104 | ||||
| Less: Estimated cost of ESOP borrowings(1) |
0 | |||||
| Less: Amortization of ESOP borrowings(1) |
(92,752 | ) | ||||
| Less: Stock Programs Vesting (2) |
(231,880 | ) | ||||
| Less: Option Plan Vesting (3) |
(198,005 | ) | ||||
|
|
|
|||||
| Net Earnings Increase |
($ | 242,533 | ) | |||
| Before Conversion |
Net Earnings Increase |
After Conversion |
||||||||||||||||
| 4. |
Pro Forma Earnings |
|
||||||||||||||||
| 12 Months ended September 30, 2016 (reported) |
$ | 1,157,000 | ($ | 242,533 | ) | $ | 914,467 | |||||||||||
| 12 Months ended September 30, 2016 (core) |
$ | 1,312,620 | ($ | 242,533 | ) | $ | 1,070,087 | |||||||||||
| Before Conversion |
Net Equity Proceeds |
Tax Benefit of Foundation |
After Conversion |
|||||||||||||||
| 5. |
Pro Forma Net Worth |
|||||||||||||||||
| September 30, 2016 |
$ | 45,081,000 | $ | 39,629,900 | $ | 0 | $ | 84,710,900 | ||||||||||
| September 30, 2016 (Tangible) |
$ | 45,081,000 | $ | 39,629,900 | $ | 0 | $ | 84,710,900 | ||||||||||
| Before Conversion |
Net Cash Proceeds |
Tax Benefit of Foundation |
After Conversion |
|||||||||||||||
| 6. |
Pro Forma Assets |
|||||||||||||||||
| September 30, 2016 |
$ | 232,832,000 | $ | 39,629,900 | $ | 0 | $ | 272,461,900 | ||||||||||
| (1) | ESOP stock (3.92% of total shares issued in conversion) amortized over 25 years, amortization expense is tax effected at 38%. |
| (2) | Restricted stock program (1.96% of total shares issued in conversion) amortized over 5 years, amortization expense is tax effected at 38%. |
| (3) | Option valuation based on Black-Scholes model, 5 year vesting, and assuming 25% taxable. |
Exhibit IV-8
PRO FORMA EFFECT OF CONVERSION PROCEEDS
COMMUNITY FIRST BANCSHARES, INC.
At the Midpoint of the Range
| 1. |
Market Value of Shares Sold In Offering: | $ | 55,000,000 | |||||||||||||||
| Market Value of Shares Issued to Foundation: | 0 | |||||||||||||||||
|
|
|
|||||||||||||||||
| Total Market Value of Company: |
$ | 55,000,000 | ||||||||||||||||
| 2. |
Offering Proceeds of Shares Sold In Offering | $ | 55,000,000 | |||||||||||||||
| Less: Estimated Offering Expenses |
1,586,000 | |||||||||||||||||
|
|
|
|||||||||||||||||
| Net Conversion Proceeds | $ | 53,414,000 | ||||||||||||||||
| 3. |
Estimated Additional Equity and Income from Offering Proceeds | |||||||||||||||||
| Net Conversion Proceeds | $ | 53,414,000 | ||||||||||||||||
| Less: Cash Contribution to Foundation |
0 | |||||||||||||||||
| Less: Non-Cash ESOP Stock Purchases (1) |
(4,400,000 | ) | ||||||||||||||||
| Less: Non-Cash MRP Stock Purchases (2) |
(2,200,000 | ) | ||||||||||||||||
|
|
|
|||||||||||||||||
| Net Conversion Proceeds Reinvested | $ | 46,814,000 | ||||||||||||||||
| Estimated After-Tax Reinvestment Rate | 0.71 | % | ||||||||||||||||
|
|
|
|||||||||||||||||
| Earnings from Reinvestment of Proceeds |
$ | 330,881 | ||||||||||||||||
| Less: Estimated cost of ESOP borrowings(1) |
0 | |||||||||||||||||
| Less: Amortization of ESOP borrowings(1) |
(109,120 | ) | ||||||||||||||||
| Less: Stock Programs Vesting (2) |
(272,800 | ) | ||||||||||||||||
| Less: Option Plan Vesting (3) |
(232,947 | ) | ||||||||||||||||
|
|
|
|||||||||||||||||
| Net Earnings Increase | ($ | 283,986 | ) | |||||||||||||||
| Before Conversion |
Net Earnings Increase |
After Conversion | ||||||||||||||||
| 4. |
Pro Forma Earnings | |||||||||||||||||
| 12 Months ended September 30, 2016 (reported) | $ | 1,157,000 | ($ | 283,986 | ) | $ | 873,014 | |||||||||||
| 12 Months ended September 30, 2016 (core) | $ | 1,312,620 | ($ | 283,986 | ) | $ | 1,028,634 | |||||||||||
| Before Conversion |
Net Capital Proceeds |
Tax Benefit of Foundation |
After Conversion | |||||||||||||||
| 5. |
Pro Forma Net Worth | |||||||||||||||||
| September 30, 2016 | $ | 45,081,000 | $ | 46,814,000 | $ | 0 | $ | 91,895,000 | ||||||||||
| September 30, 2016 (Tangible) | $ | 45,081,000 | $ | 46,814,000 | $ | 0 | $ | 91,895,000 | ||||||||||
| Before Conversion |
Net Cash Proceeds |
Tax Benefit of Foundation |
After Conversion | |||||||||||||||
| 6. |
Pro Forma Assets | |||||||||||||||||
| September 30, 2016 | $ | 232,832,000 | $ | 46,814,000 | $ | 0 | $ | 279,646,000 | ||||||||||
| (1) | ESOP stock (3.92% of total shares issued in conversion) amortized over 25 years, amortization expense is tax effected at 38%. |
| (2) | Restricted stock program (1.96% of total shares issued in conversion) amortized over 5 years, amortization expense is tax effected at 38%. |
| (3) | Option valuation based on Black-Scholes model, 5 year vesting, and assuming 25% taxable. |
Exhibit IV-8
PRO FORMA EFFECT OF CONVERSION PROCEEDS
COMMUNITY FIRST BANCSHARES, INC.
At the Maximum of the Range
| 1. |
Market Value of Shares Sold In Offering: |
$ | 63,250,000 | |||||||||||||||
| Market Value of Shares Issued to Foundation: |
0 | |||||||||||||||||
|
|
|
|||||||||||||||||
| Total Market Value of Company: |
$ | 63,250,000 | ||||||||||||||||
| 2. |
Offering Proceeds of Shares Sold In Offering |
$ | 63,250,000 | |||||||||||||||
| Less: Estimated Offering Expenses |
1,661,900 | |||||||||||||||||
|
|
|
|||||||||||||||||
| Net Conversion Proceeds |
$ | 61,588,100 | ||||||||||||||||
| 3. |
Estimated Additional Equity and Income from Offering Proceeds |
|
||||||||||||||||
| Net Conversion Proceeds |
$ | 61,588,100 | ||||||||||||||||
| Less: Cash Contribution to Foundation |
0 | |||||||||||||||||
| Less: Non-Cash ESOP Stock Purchases (1) |
(5,060,000 | ) | ||||||||||||||||
| Less: Non-Cash MRP Stock Purchases (2) |
(2,530,000 | ) | ||||||||||||||||
|
|
|
|||||||||||||||||
| Net Conversion Proceeds Reinvested |
$ | 53,998,100 | ||||||||||||||||
| Estimated After-Tax Reinvestment Rate |
0.71 | % | ||||||||||||||||
|
|
|
|||||||||||||||||
| Earnings from Reinvestment of Proceeds |
$ | 381,659 | ||||||||||||||||
| Less: Estimated cost of ESOP borrowings(1) |
0 | |||||||||||||||||
| Less: Amortization of ESOP borrowings(1) |
(125,488 | ) | ||||||||||||||||
| Less: Stock Programs Vesting (2) |
(313,720 | ) | ||||||||||||||||
| Less: Option Plan Vesting (3) |
(267,889 | ) | ||||||||||||||||
|
|
|
|||||||||||||||||
| Net Earnings Increase |
($ | 325,438 | ) | |||||||||||||||
| Before Conversion |
Net Earnings Increase |
After Conversion | ||||||||||||||||
| 4. |
Pro Forma Earnings |
|||||||||||||||||
| 12 Months ended September 30, 2016 (reported) |
$ | 1,157,000 | ($ | 325,438 | ) | $ | 831,562 | |||||||||||
| 12 Months ended September 30, 2016 (core) |
$ | 1,312,620 | ($ | 325,438 | ) | $ | 987,182 | |||||||||||
| Before Conversion |
Net Capital Proceeds |
Tax Benefit of Foundation |
After Conversion | |||||||||||||||
| 5. |
Pro Forma Net Worth |
|||||||||||||||||
| September 30, 2016 |
$ | 45,081,000 | $ | 53,998,100 | $ | 0 | $ | 99,079,100 | ||||||||||
| September 30, 2016 (Tangible) |
$ | 45,081,000 | $ | 53,998,100 | $ | 0 | $ | 99,079,100 | ||||||||||
| Before Conversion |
Net Cash Proceeds |
Tax Benefit of Foundation |
After Conversion | |||||||||||||||
| 6. |
Pro Forma Assets |
|||||||||||||||||
| September 30, 2016 |
$ | 232,832,000 | $ | 53,998,100 | $ | 0 | $ | 286,830,100 | ||||||||||
| (1) | ESOP stock (3.92% of total shares issued in conversion) amortized over 25 years, amortization expense is tax effected at 38%. |
| (2) | Restricted stock program (1.96% of total shares issued in conversion) amortized over 5 years, amortization expense is tax effected at 38%. |
| (3) | Option valuation based on Black-Scholes model, 5 year vesting, and assuming 25% taxable. |
Exhibit IV-8
PRO FORMA EFFECT OF CONVERSION PROCEEDS
COMMUNITY FIRST BANCSHARES, INC.
At the Supermaximum Value
| 1. |
Market Value of Shares Sold In Offering: |
$ | 72,737,500 | |||||||||||||||
| Market Value of Shares Issued to Foundation: |
0 | |||||||||||||||||
|
|
|
|||||||||||||||||
| Total Market Value of Company: |
$ | 72,737,500 | ||||||||||||||||
| 2. |
Offering Proceeds of Shares Sold In Offering |
$ | 72,737,500 | |||||||||||||||
| Less: Estimated Offering Expenses |
1,749,185 | |||||||||||||||||
|
|
|
|||||||||||||||||
| Net Conversion Proceeds |
$ | 70,988,315 | ||||||||||||||||
| 3. |
Estimated Additional Equity and Income from Offering Proceeds |
|
||||||||||||||||
| Net Conversion Proceeds |
$ | 70,988,315 | ||||||||||||||||
| Less: Cash Contribution to Foundation |
0 | |||||||||||||||||
| Less: Non-Cash ESOP Stock Purchases (1) |
(5,819,000 | ) | ||||||||||||||||
| Less: Non-Cash MRP Stock Purchases (2) |
(2,909,500 | ) | ||||||||||||||||
|
|
|
|||||||||||||||||
| Net Conversion Proceeds Reinvested |
$ | 62,259,815 | ||||||||||||||||
| Estimated After-Tax Reinvestment Rate |
0.71 | % | ||||||||||||||||
|
|
|
|||||||||||||||||
| Earnings from Reinvestment of Proceeds |
$ | 440,052 | ||||||||||||||||
| Less: Estimated cost of ESOP borrowings(1) |
0 | |||||||||||||||||
| Less: Amortization of ESOP borrowings(1) |
(144,311 | ) | ||||||||||||||||
| Less: Stock Programs Vesting (2) |
(360,778 | ) | ||||||||||||||||
| Less: Option Plan Vesting (3) |
(308,072 | ) | ||||||||||||||||
|
|
|
|||||||||||||||||
| Net Earnings Increase |
($ | 373,109 | ) | |||||||||||||||
| Before Conversion |
Net Earnings Increase |
After Conversion | ||||||||||||||||
| 4. |
Pro Forma Earnings |
|||||||||||||||||
| 12 Months ended September 30, 2016 (reported) |
$ | 1,157,000 | ($ | 373,109 | ) | $ | 783,891 | |||||||||||
| 12 Months ended September 30, 2016 (core) |
$ | 1,312,620 | ($ | 373,109 | ) | $ | 939,511 | |||||||||||
| Before Conversion |
Net Capital Proceeds |
Tax Benefit of Foundation |
After Conversion | |||||||||||||||
| 5. |
Pro Forma Net Worth |
|||||||||||||||||
| September 30, 2016 |
$ | 45,081,000 | $ | 62,259,815 | $ | 0 | $ | 107,340,815 | ||||||||||
| September 30, 2016 (Tangible) |
$ | 45,081,000 | $ | 62,259,815 | $ | 0 | $ | 107,340,815 | ||||||||||
| Before Conversion |
Net Cash Proceeds |
Tax Benefit of Foundation |
After Conversion | |||||||||||||||
| 6. |
Pro Forma Assets |
|||||||||||||||||
| September 30, 2016 |
$ | 232,832,000 | $ | 62,259,815 | $ | 0 | $ | 295,091,815 | ||||||||||
| (1) | ESOP stock (3.92% of total shares issued in conversion) amortized over 25 years, amortization expense is tax effected at 38%. |
| (2) | Restricted stock program (1.96% of total shares issued in conversion) amortized over 5 years, amortization expense is tax effected at 38%. |
| (3) | Option valuation based on Black-Scholes model, 5 year vesting, and assuming 25% taxable. |
EXHIBIT IV-9
Newton Federal Bank
Pro Forma Analysis Sheet- MHC Basis
EXHIBIT IV-9
PRO FORMA ANALYSIS SHEET - MHC BASIS
COMMUNITY FIRST BANCSHARES, INC.
Prices as of November 25, 2016
| Subject at | Peer Group | Georgia Companies | All Public Thrifts | |||||||||||||||||||||||||||||||
| Final Valuation Pricing Multiples |
Symbol | Midpoint | Mean | Median | Mean | Median | Mean | Median | ||||||||||||||||||||||||||
| Price-earnings multiple |
= | P/E | 54.91x | 19.28x | 17.92x | 18.32x | 18.32x | 18.80x | 18.77x | |||||||||||||||||||||||||
| Price-core earnings multiple |
= | P/CE | 47.52x | 21.94x | 19.92x | 16.80x | 16.80x | 19.59x | 19.15x | |||||||||||||||||||||||||
| Price-book ratio |
= | P/B | 83.67 | % | 99.32 | % | 98.00 | % | 107.06 | % | 107.06 | % | 123.90 | % | 121.48 | % | ||||||||||||||||||
| Price-tangible book ratio |
= | P/TB | 83.67 | % | 100.73 | % | 99.99 | % | 127.40 | % | 127.40 | % | 134.09 | % | 127.40 | % | ||||||||||||||||||
| Price-assets ratio |
= | P/A | 21.70 | % | 15.84 | % | 15.61 | % | 15.07 | % | 15.07 | % | 15.20 | % | 14.66 | % | ||||||||||||||||||
| Valuation Parameters (2) | As a % of Offering | |||||||||||||||||||
| + Foundation | ||||||||||||||||||||
| Pre-Conversion Earnings (Y) |
$ | 1,157,000 | (12 Mths 9/16) | ESOP Stock Purchases (E) | 8.52 | % | 8.52 | % | ||||||||||||
| Pre-Conversion Core Earnings |
$ | 1,312,620 | (12 Mths 9/16) | Cost of ESOP Borrowings (S) | 0.00 | % | ||||||||||||||
| Pre-Conversion Book Value (B) |
$ | 45,081,000 | ESOP Amortization (T) | 25.00 years | ||||||||||||||||
| Pre-Conv. Tang. Book Value (B) |
$ | 45,081,000 | Stock Programs Amount (M) | 4.261 | % | 4.26 | % | |||||||||||||
| Pre-Conversion Assets (A) |
$ | 232,832,000 | Stock Programs Vesting (N) | 5.00 years | ||||||||||||||||
| Reinvestment Rate: |
1.14 | % | Fixed Expenses | $ | 1,105,000 | |||||||||||||||
| Tax rate (TAX) |
38.00 | % | Variable Expenses | 1.00 | % | |||||||||||||||
| A-T Reinvestment Rate(R) |
0.71 | % | Percent Sold (PCT) | 46.0000 | % | |||||||||||||||
| Est. Conversion Expenses (1)(X) |
5.18 | % | MHC Assets | $ | 0 | |||||||||||||||
| Insider Purchases |
$ | 2,500,000 | Options as % of Offering (O1) | 10.65 | % | 10.65 | % | |||||||||||||
| Price/Share |
$ | 10.00 | Estimated Option Value (O2) | 23.40 | % | |||||||||||||||
| Foundation Cash Contrib. (FC) |
$ | 0 | Option Vesting Period (O3) | 5.00 years | ||||||||||||||||
| Foundation Stock Contrib. (FS) |
0.00 | % | % of Options taxable (O4) | 25.00 | % | |||||||||||||||
| Foundation Tax Benefit (Z) |
$ | 0 | ||||||||||||||||||
| Calculation of Pro Forma Value After Conversion | ||||||||||||||||||
| 1. | V= | P/E * (Y) |
V= | $55,000,000 | ||||||||||||||
| 1 - P/E * PCT * ((1-X-E-M-C-D)*R - (1-TAX)*E/T - (1-TAX)*M/N) | ||||||||||||||||||
| 1. | V= | P/E * (Y) |
V= | $55,000,000 | ||||||||||||||
| 1 - P/Core E * PCT * ((1-X-E-M-FC-FS)*R - (1-TAX)*E/T - (1-TAX)*M/N)-(1-(TAX*O4))*(O1*O2)/O3) | ||||||||||||||||||
| 2. | V= | P/B * B |
V= | $55,000,000 | ||||||||||||||
| 1 - P/B * PCT * (1-X-E-M-FC-FS) | ||||||||||||||||||
| 2. | V= | P/TB * TB |
V= | $55,000,000 | ||||||||||||||
| 1 - P/B * PCT * (1-X-E-M-FC-FS) | ||||||||||||||||||
| 3. | V= | P/A * (A+Z) |
V= | $55,000,000 | ||||||||||||||
| 1 - P/A * PCT * (1-X-E-M-FC-FS) | ||||||||||||||||||
| Valuation Conclusion |
Shares Issued to MHC |
Shares Sold to Public |
Foundation Shares |
Total Shares Issued |
Price Per Share |
Mark. Val of Stock Sold in Offering+Issued to Foundation |
Full Value of Total Shares |
|||||||||||||||||||||
| Supermaximum |
3,927,825 | 3,345,925 | 0 | 7,273,750 | $ | 10.00 | $ | 33,459,250 | $ | 72,737,507 | ||||||||||||||||||
| Maximum |
3,415,500 | 2,909,500 | 0 | 6,325,000 | 10.00 | 29,095,000 | $ | 63,249,997 | ||||||||||||||||||||
| Midpoint |
2,970,000 | 2,530,000 | 0 | 5,500,000 | 10.00 | 25,300,000 | $ | 55,000,000 | ||||||||||||||||||||
| Minimum |
2,524,500 | 2,150,500 | 0 | 4,675,000 | 10.00 | 21,505,000 | $ | 46,750,003 | ||||||||||||||||||||
| Valuation Conclusion |
Shares Issued to MHC |
Shares Sold to Public |
Foundation Shares |
Total Shares Issued |
||||||||||||||||||||||||
| Supermaximum |
54.000 | % | 46.000 | % | 0.000 | % | 100.000 | % | ||||||||||||||||||||
| Maximum |
54.000 | % | 46.000 | % | 0.000 | % | 100.000 | % | ||||||||||||||||||||
| Midpoint |
54.000 | % | 46.000 | % | 0.000 | % | 100.000 | % | ||||||||||||||||||||
| Minimum |
54.000 | % | 46.000 | % | 0.000 | % | 100.000 | % | ||||||||||||||||||||
| (1) | Estimated offering expenses at midpoint of the offering. |
| (2) | Reflects reduction in earnings, equity and assets due to $100,000 contributed to the MHC. |
EXHIBIT IV-10
Newton Federal Bank
Pro Forma Effect of Conversion Proceeds – MHC Basis
Exhibit IV-10
PRO FORMA EFFECT OF CONVERSION PROCEEDS
COMMUNITY FIRST BANCSHARES, INC.
At the Minimum of the Range
| 1. |
Market Value of Shares Sold In Offering: |
$ | 21,505,000 | |||||||||||||
| Market Value of Shares Issued to Foundation: |
0 | |||||||||||||||
| Market Value of Shares Issued to MHC: |
25,245,000 | |||||||||||||||
|
|
|
|||||||||||||||
| Total Market Value of Company: |
$ | 46,750,000 | ||||||||||||||
| 2. |
Offering Proceeds of Shares Sold In Offering |
$ | 21,505,000 | |||||||||||||
| Less: Estimated Offering Expenses |
1,276,717 | |||||||||||||||
|
|
|
|||||||||||||||
| Net Conversion Proceeds |
$ | 20,228,283 | ||||||||||||||
| 3. |
Estimated Additional Equity and Income from Offering Proceeds |
|||||||||||||||
| Net Conversion Proceeds |
$ | 20,228,283 | ||||||||||||||
| Less: Cash Contribution to Foundation |
0 | |||||||||||||||
| Less: Cash for Capitalization of the MHC |
(100,000 | ) | ||||||||||||||
| Less: Non-Cash ESOP/MRP Purchases (1) |
(2,748,900 | ) | ||||||||||||||
|
|
|
|||||||||||||||
| Net Proceeds Reinvested |
$ | 17,379,383 | ||||||||||||||
| Estimated net incremental rate of return |
0.71 | % | ||||||||||||||
|
|
|
|||||||||||||||
| Earnings Increase |
$ | 122,837 | ||||||||||||||
| Less: Estimated cost of ESOP borrowings |
0 | |||||||||||||||
| Less: Amortization of ESOP borrowings(2) |
(45,448 | ) | ||||||||||||||
| Less: Stock Programs Vesting (3) |
(113,621 | ) | ||||||||||||||
| Less: Option Plan Vesting (4) |
(97,022 | ) | ||||||||||||||
|
|
|
|||||||||||||||
| Net Earnings Increase |
($ | 133,255 | ) | |||||||||||||
| Before Conversion |
Net Earnings Increase |
After Conversion | ||||||||||||||
| 4. |
Pro Forma Earnings |
|||||||||||||||
| 12 Months ended September 30, 2016 (reported) |
$ | 1,157,000 | ($ | 133,255 | ) | $ | 1,023,745 | |||||||||
| 12 Months ended September 30, 2016 (core) |
$ | 1,312,620 | ($ | 133,255 | ) | $ | 1,179,365 | |||||||||
| Before Conversion |
Net Cash Proceeds |
Tax Benefit of Foundation |
After Conversion | |||||||||||||
| 5. |
Pro Forma Net Worth |
|||||||||||||||
| September 30, 2016 |
$45,081,000 | $ | 17,379,383 | $ | 0 | $ | 62,460,383 | |||||||||
| September 30, 2016 (Tangible) |
$45,081,000 | $ | 17,379,383 | $ | 0 | $ | 62,460,383 | |||||||||
| Before Conversion |
Net Cash Proceeds |
Tax Benefit of Foundation |
After Conversion | |||||||||||||
| 6. |
Pro Forma Assets |
|||||||||||||||
| September 30, 2016 |
$232,832,000 | $ | 17,379,383 | $ | 0 | $ | 250,211,383 | |||||||||
| (1) | Includes ESOP purchases equal to 3.92% of total shares issued in the conversion, and stock program purchases equal to 1.96% of total shares issued in the conversion. |
| (2) | ESOP stock amortized over 25 years, and amortization expense is tax effected at 38%. |
| (3) | Stock programs amortized over 5 years, and amortization expense is tax effected at 38%. |
| (4) | Option valuation based on Black-Scholes model, 10 year vesting, and assuming 25% taxable. |
Exhibit IV-10
PRO FORMA EFFECT OF CONVERSION PROCEEDS
COMMUNITY FIRST BANCSHARES, INC.
At the Midpoint of the Range
| 1. |
Market Value of Shares Sold In Offering: |
$ | 25,300,000 | |||||||||||||||
| Market Value of Shares Issued to Foundation: |
0 | |||||||||||||||||
| Market Value of Shares Issued to MHC: |
29,700,000 | |||||||||||||||||
|
|
|
|||||||||||||||||
| Total Market Value of Company: |
$ | 55,000,000 | ||||||||||||||||
| 2. |
Offering Proceeds of Shares Sold In Offering |
$ | 25,300,000 | |||||||||||||||
| Less: Estimated Offering Expenses |
1,311,440 | |||||||||||||||||
|
|
|
|||||||||||||||||
| Net Conversion Proceeds |
$ | 23,988,560 | ||||||||||||||||
| 3. |
Estimated Additional Equity and Income from Offering Proceeds |
|||||||||||||||||
| Net Conversion Proceeds |
$ | 23,988,560 | ||||||||||||||||
| Less: Cash Contribution to Foundation |
0 | |||||||||||||||||
| Less: Cash for Capitalization of the MHC |
(100,000 | ) | ||||||||||||||||
| Less: Non-Cash ESOP/MRP Purchases (1) |
(3,234,000 | ) | ||||||||||||||||
|
|
|
|||||||||||||||||
| Net Proceeds Reinvested |
$ | 20,654,560 | ||||||||||||||||
| Estimated net incremental rate of return |
0.71 | % | ||||||||||||||||
|
|
|
|||||||||||||||||
| Earnings Increase |
$ | 145,986 | ||||||||||||||||
| Less: Estimated cost of ESOP borrowings |
0 | |||||||||||||||||
| Less: Amortization of ESOP borrowings(2) |
(53,469 | ) | ||||||||||||||||
| Less: Stock Programs Vesting (3) |
(133,672 | ) | ||||||||||||||||
| Less: Option Plan Vesting (4) |
(114,144 | ) | ||||||||||||||||
|
|
|
|||||||||||||||||
| Net Earnings Increase |
($ | 155,298 | ) | |||||||||||||||
| Before Conversion |
Net Earnings Increase |
After Conversion | ||||||||||||||||
| 4. |
Pro Forma Earnings |
|||||||||||||||||
| 12 Months ended September 30, 2016 (reported) |
$ | 1,157,000 | ($ | 155,298 | ) | $ | 1,001,702 | |||||||||||
| 12 Months ended September 30, 2016 (core) |
$ | 1,312,620 | ($ | 155,298 | ) | $ | 1,157,322 | |||||||||||
| Before Conversion |
Net Cash Proceeds |
Tax Benefit of Foundation |
After Conversion | |||||||||||||||
| 5. |
Pro Forma Net Worth |
|||||||||||||||||
| September 30, 2016 |
$ | 45,081,000 | $ | 20,654,560 | $ | 0 | $ | 65,735,560 | ||||||||||
| September 30, 2016 (Tangible) |
$ | 45,081,000 | $ | 20,654,560 | $ | 0 | $ | 65,735,560 | ||||||||||
| Before Conversion |
Net Cash Proceeds |
Tax Benefit of Foundation |
After Conversion | |||||||||||||||
| 6. |
Pro Forma Assets |
|||||||||||||||||
| September 30, 2016 |
$ | 232,832,000 | $ | 20,654,560 | $ | 0 | $ | 253,486,560 | ||||||||||
| (1) | Includes ESOP purchases equal to 3.92% of total shares issued in the conversion, and stock program purchases equal to 1.96% of total shares issued in the conversion. |
| (2) | ESOP stock amortized over 25 years, and amortization expense is tax effected at 38%. |
| (3) | Stock programs amortized over 5 years, and amortization expense is tax effected at 38%. |
| (4) | Option valuation based on Black-Scholes model, 10 year vesting, and assuming 25% taxable. |
Exhibit IV-10
PRO FORMA EFFECT OF CONVERSION PROCEEDS
COMMUNITY FIRST BANCSHARES, INC.
At the Maximum of the Range
| 1. |
Market Value of Shares Sold In Offering: |
|
$ | 29,095,000 | ||||||||||||||
| Market Value of Shares Issued to Foundation: |
|
0 | ||||||||||||||||
| Market Value of Shares Issued to MHC: |
|
34,155,000 | ||||||||||||||||
|
|
|
|||||||||||||||||
| Total Market Value of Company: |
$ | 63,250,000 | ||||||||||||||||
| 2. |
Offering Proceeds of Shares Sold In Offering |
|
$ | 29,095,000 | ||||||||||||||
| Less: Estimated Offering Expenses |
1,346,163 | |||||||||||||||||
|
|
|
|||||||||||||||||
| Net Conversion Proceeds |
$ | 27,748,837 | ||||||||||||||||
| 3. |
Estimated Additional Equity and Income from Offering Proceeds |
|
||||||||||||||||
| Net Conversion Proceeds |
$ | 27,748,837 | ||||||||||||||||
| Less: Cash Contribution to Foundation |
|
0 | ||||||||||||||||
| Less: Cash for Capitalization of the MHC |
|
(100,000 | ) | |||||||||||||||
| Less: Non-Cash ESOP/MRP Purchases (1) |
|
(3,719,100 | ) | |||||||||||||||
|
|
|
|||||||||||||||||
| Net Proceeds Reinvested |
$ | 23,929,737 | ||||||||||||||||
| Estimated net incremental rate of return |
|
0.71 | % | |||||||||||||||
|
|
|
|||||||||||||||||
| Earnings Increase |
$ | 169,135 | ||||||||||||||||
| Less: Estimated cost of ESOP borrowings |
|
0 | ||||||||||||||||
| Less: Amortization of ESOP borrowings(2) |
|
(61,489 | ) | |||||||||||||||
| Less: Stock Programs Vesting (3) |
|
(153,723 | ) | |||||||||||||||
| Less: Option Plan Vesting (4) |
|
(131,266 | ) | |||||||||||||||
|
|
|
|||||||||||||||||
| Net Earnings Increase |
($ | 177,342 | ) | |||||||||||||||
| Before Conversion |
Net Earnings Increase |
After Conversion |
||||||||||||||||
| 4. |
Pro Forma Earnings |
|||||||||||||||||
| 12 Months ended September 30, 2016 (reported) |
|
$ | 1,157,000 | ($ | 177,342 | ) | $ | 979,658 | ||||||||||
| 12 Months ended September 30, 2016 (core) |
|
$ | 1,312,620 | ($ | 177,342 | ) | $ | 1,135,278 | ||||||||||
| Before Conversion |
Net Cash Proceeds |
Tax Benefit of Foundation |
After Conversion |
|||||||||||||||
| 5. |
Pro Forma Net Worth |
|||||||||||||||||
| September 30, 2016 |
$ | 45,081,000 | $ | 23,929,737 | $ | 0 | $ | 69,010,737 | ||||||||||
| September 30, 2016 (Tangible) |
$ | 45,081,000 | $ | 23,929,737 | $ | 0 | $ | 69,010,737 | ||||||||||
| Before Conversion |
Net Cash Proceeds |
Tax Benefit of Foundation |
After Conversion |
|||||||||||||||
| 6. |
Pro Forma Assets |
|||||||||||||||||
| September 30, 2016 |
$ | 232,832,000 | $ | 23,929,737 | $ | 0 | $ | 256,761,737 | ||||||||||
| (1) | Includes ESOP purchases equal to 3.92% of total shares issued in the conversion, and stock program purchases equal to 1.96% of total shares issued in the conversion. |
| (2) | ESOP stock amortized over 25 years, and amortization expense is tax effected at 38%. |
| (3) | Stock programs amortized over 5 years, and amortization expense is tax effected at 38%. |
| (4) | Option valuation based on Black-Scholes model, 10 year vesting, and assuming 25% taxable. |
Exhibit IV-10
PRO FORMA EFFECT OF CONVERSION PROCEEDS
COMMUNITY FIRST BANCSHARES, INC.
At the Supermaximum Value
| 1. |
Market Value of Shares Sold In Offering: |
$ | 33,459,255 | |||||||||||||||
| Market Value of Shares Issued to Foundation: |
0 | |||||||||||||||||
| Market Value of Shares Issued to MHC: |
39,278,255 | |||||||||||||||||
|
|
|
|||||||||||||||||
| Total Market Value of Company: |
$ | 72,737,510 | ||||||||||||||||
| 2. |
Offering Proceeds of Shares Sold In Offering |
$ | 33,459,255 | |||||||||||||||
| Less: Estimated Offering Expenses |
1,386,095 | |||||||||||||||||
|
|
|
|||||||||||||||||
| Net Conversion Proceeds |
$ | 32,073,160 | ||||||||||||||||
| 3. |
Estimated Additional Equity and Income from Offering Proceeds |
|||||||||||||||||
| Net Conversion Proceeds |
$ | 32,073,160 | ||||||||||||||||
| Less: Cash Contribution to Foundation |
0 | |||||||||||||||||
| Less: Cash for Capitalization of the MHC |
(100,000 | ) | ||||||||||||||||
| Less: Non-Cash ESOP/MRP Purchases (1) |
(4,276,966 | ) | ||||||||||||||||
|
|
|
|||||||||||||||||
| Net Proceeds Reinvested |
$ | 27,696,194 | ||||||||||||||||
| Estimated net incremental rate of return |
0.71 | % | ||||||||||||||||
|
|
|
|||||||||||||||||
| Earnings Increase |
$ | 195,757 | ||||||||||||||||
| Less: Estimated cost of ESOP borrowings |
0 | |||||||||||||||||
| Less: Amortization of ESOP borrowings(2) |
(70,712 | ) | ||||||||||||||||
| Less: Stock Programs Vesting (3) |
(176,781 | ) | ||||||||||||||||
| Less: Option Plan Vesting (4) |
(150,956 | ) | ||||||||||||||||
|
|
|
|||||||||||||||||
| Net Earnings Increase |
($ | 202,693 | ) | |||||||||||||||
| Before Conversion |
Net Earnings Increase |
After Conversion |
||||||||||||||||
| 4. |
Pro Forma Earnings |
|||||||||||||||||
| 12 Months ended September 30, 2016 (reported) |
$ | 1,157,000 | ($ | 202,693 | ) | $ | 954,307 | |||||||||||
| 12 Months ended September 30, 2016 (core) |
$ | 1,312,620 | ($ | 202,693 | ) | $ | 1,109,927 | |||||||||||
| Before Conversion |
Net Cash Proceeds |
Tax Benefit of Foundation |
After Conversion |
|||||||||||||||
| 5. |
Pro Forma Net Worth |
|||||||||||||||||
| September 30, 2016 |
$ | 45,081,000 | $ | 27,696,194 | $ | 0 | $ | 72,777,194 | ||||||||||
| September 30, 2016 (Tangible) |
$ | 45,081,000 | $ | 27,696,194 | $ | 0 | $ | 72,777,194 | ||||||||||
| Before Conversion |
Net Cash Proceeds |
Tax Benefit of Foundation |
After Conversion |
|||||||||||||||
| 6. |
Pro Forma Assets |
|||||||||||||||||
| September 30, 2016 |
$ | 232,832,000 | $ | 27,696,194 | $ | 0 | $ | 260,528,194 | ||||||||||
| (1) | Includes ESOP purchases equal to 3.92% of total shares issued in the conversion, and stock program purchases equal to 1.96% of total shares issued in the conversion. |
| (2) | ESOP stock amortized over 25 years, and amortization expense is tax effected at 38%. |
| (3) | Stock programs amortized over 5 years, and amortization expense is tax effected at 38%. |
| (4) | Option valuation based on Black-Scholes model, 10 year vesting, and assuming 25% taxable. |
EXHIBIT V-1
RP® Financial, LC.
Firm Qualifications Statement

FIRM QUALIFICATION STATEMENT
RP® Financial (“RP®) provides financial and management consulting, merger advisory and valuation services to the financial services industry nationwide. We offer a broad array of services, high quality and prompt service, hands-on involvement by principals and senior staff, careful structuring of strategic initiatives and sophisticated valuation and other analyses consistent with industry practices and regulatory requirements. Our staff maintains extensive background in financial and management consulting, valuation and investment banking. Our clients include commercial banks, thrifts, credit unions, mortgage companies, insurance companies and other financial services companies.
STRATEGIC PLANNING SERVICES
RP®’s strategic planning services are designed to provide effective feasible plans with quantifiable results. We analyze strategic options to enhance shareholder value, achieve regulatory approval or realize other objectives. Such services involve conducting situation analyses; establishing mission/vision statements, developing strategic goals and objectives; and identifying strategies to enhance franchise and/or market value, capital management, earnings enhancement, operational matters and organizational issues. Strategic recommendations typically focus on: capital formation and management, asset/liability targets, profitability, return on equity and stock pricing. Our proprietary financial simulation models provide the basis for evaluating the impact of various strategies and assessing their feasibility and compatibility with regulations.
MERGER ADVISORY SERVICES
RP®’s merger advisory services include targeting potential buyers and sellers, assessing acquisition merit, conducting due diligence, negotiating and structuring merger transactions, preparing merger business plans and financial simulations, rendering fairness opinions, preparing mark-to-market analyses, valuing intangible assets and supporting the implementation of post-acquisition strategies. Our merger advisory services involve transactions of financially healthy companies and failed bank deals. RP® is also expert in de novo charters and shelf charters. Through financial simulations, comprehensive data bases, valuation proficiency and regulatory familiarity, RP®’s merger advisory services center on enhancing shareholder returns.
VALUATION SERVICES
RP®’s extensive valuation practice includes bank and thrift mergers, thrift mutual-to-stock conversions, goodwill impairment, insurance company demutualizations, ESOPs, subsidiary companies, merger accounting and other purposes. We are highly experienced in performing appraisals which conform to regulatory guidelines and appraisal standards. RP® is the nation’s leading valuation firm for thrift mutual-to-stock conversions, with appraised values ranging up to $4 billion.
OTHER CONSULTING SERVICES
RP® offers other consulting services including evaluating the impact of regulatory changes (TARP, etc.), branching and diversification strategies, feasibility studies and special research. We assist banks/thrifts in preparing CRA plans and evaluating wealth management activities on a de novo or merger basis. Our other consulting services are facilitated by proprietary valuation and financial simulation models.
KEY PERSONNEL (Years of Relevant Experience & Contact Information)
| Ronald S. Riggins, Managing Director (36) | (703) 647-6543 | rriggins@rpfinancial.com | ||
| William E. Pommerening, Managing Director (32) | (703) 647-6546 | wpommerening@rpfinancial.com | ||
| Marcus Faust, Managing Director (28) | (703) 647-6553 | mfaust@rpfinancial.com | ||
| Gregory E. Dunn, Director (32) | (703) 647-6548 | gdunn@rpfinancial.com | ||
| James P. Hennessey, Director (29) | (703) 647-6544 | jhennessey@rpfinancial.com | ||
| James J. Oren, Director (28) | (703) 647-6549 | joren@rpfinancial.com | ||
| Carla Pollard, Senior Vice President (26) | (703) 647-6556 | cpollard@rpfinancial.com |
Washington Headquarters
| Three Ballston Plaza | Telephone: (703) 528-1700 | |
| 1100 North Glebe Road, Suite 600 | Fax No.: (703) 528-1788 | |
| Arlington, VA 22201 | Toll-Free No.: (866) 723-0594 | |
| www.rpfinancial.com | E-Mail: mail@rpfinancial.com |