Attached files
| file | filename |
|---|---|
| 8-K - 8-K - Zendesk, Inc. | zen_8-kxq4x2016xfinal.htm |
| EX-99.3 - EXHIBIT 99.3 - Zendesk, Inc. | q416tweetsec02.htm |
| EX-99.1 - EXHIBIT 99.1 - Zendesk, Inc. | zen_8-kxq4x2016xex991.htm |
Shareholder Letter
Fourth Quarter 2016
February 08, 2017
Exhibit 99.2
Zendesk Sharehoder Letter Q4 2016 - 2
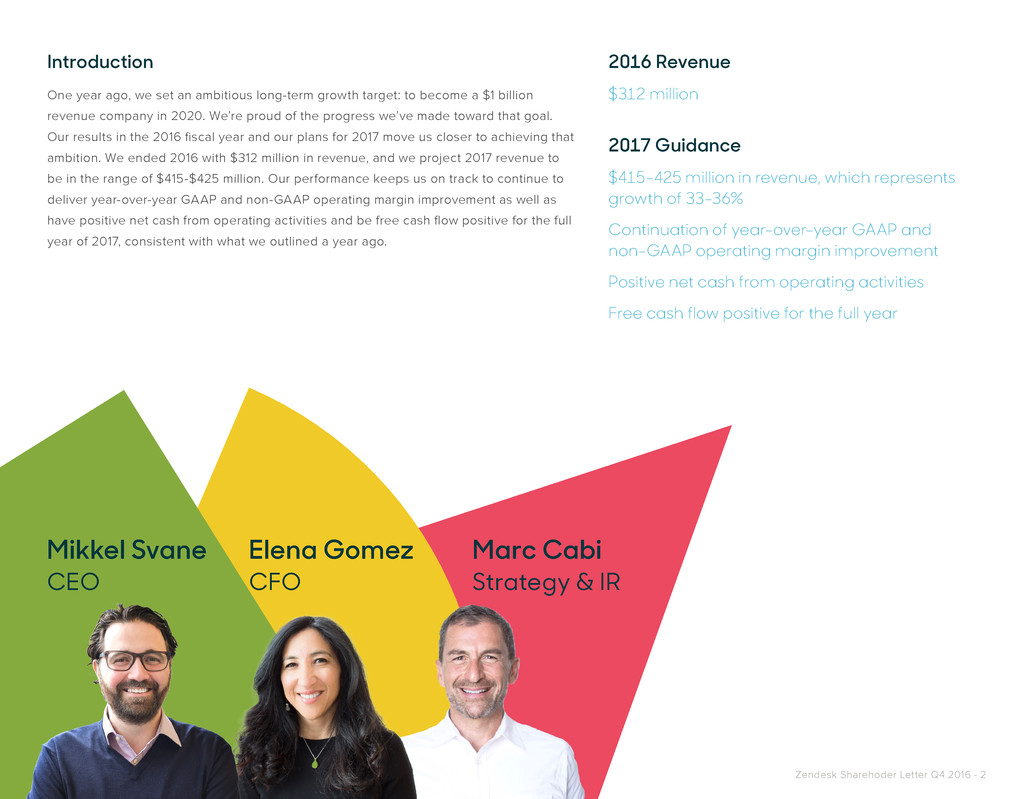
Introduction
One year ago, we set an ambitious long-term growth target: to become a $1 billion
revenue company in 2020. We’re proud of the progress we’ve made toward that goal.
Our results in the 2016 fiscal year and our plans for 2017 move us closer to achieving that
ambition. We ended 2016 with $312 million in revenue, and we project 2017 revenue to
be in the range of $415-$425 million. Our performance keeps us on track to continue to
deliver year-over-year GAAP and non-GAAP operating margin improvement as well as
have positive net cash from operating activities and be free cash flow positive for the full
year of 2017, consistent with what we outlined a year ago.
2016 Revenue
$312 million
2017 Guidance
$415-425 million in revenue, which represents
growth of 33-36%
Continuation of year-over-year GAAP and
non-GAAP operating margin improvement
Positive net cash from operating activities
Free cash flow positive for the full year
Mikkel Svane
CEO
Elena Gomez
CFO
Marc Cabi
Strategy & IR
Zendesk Sharehoder Letter Q4 2016 - 3
2016 Review
Reaching our $1 billion goal requires us to think more boldly and more
broadly about our business and the products we build. Above all else, we
must expand beyond our success in our core customer service business to
more broadly address the entire customer relationship. We want to help
organizations of all sizes not only support their customers but also build
better, long-term relationships with them. We view 2016 as a critical year
in that transition as we elevated our brand, became a multi-product
company, and further grew our reach in mid-size and enterprise
businesses. It was a year of rapid change and momentum for us.
Throughout its history, the Zendesk brand was synonymous with our
customer service product and was perhaps best known for the smiling,
headset-wearing monk figure—known as the Mentor—that symbolized our
beautifully simple approach to software. Today, our brand is dynamic and
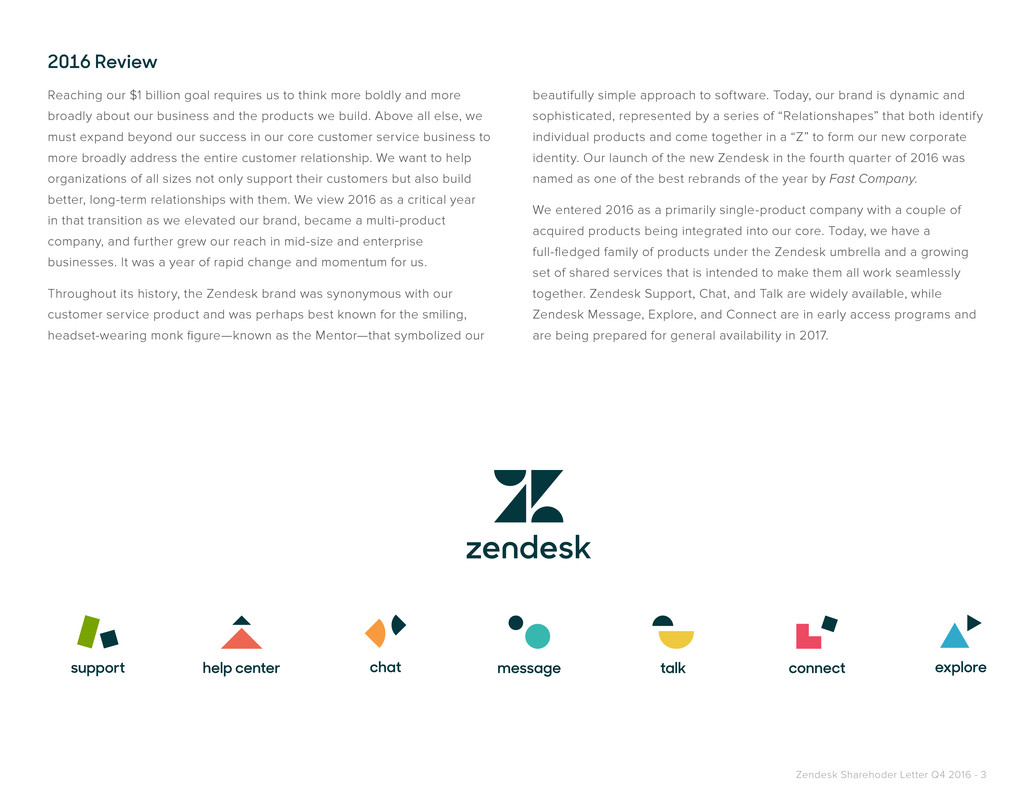
sophisticated, represented by a series of “Relationshapes” that both identify
individual products and come together in a “Z” to form our new corporate
identity. Our launch of the new Zendesk in the fourth quarter of 2016 was
named as one of the best rebrands of the year by Fast Company.
We entered 2016 as a primarily single-product company with a couple of
acquired products being integrated into our core. Today, we have a
full-fledged family of products under the Zendesk umbrella and a growing
set of shared services that is intended to make them all work seamlessly
together. Zendesk Support, Chat, and Talk are widely available, while
Zendesk Message, Explore, and Connect are in early access programs and
are being prepared for general availability in 2017.
Zendesk Sharehoder Letter Q4 2016 - 4
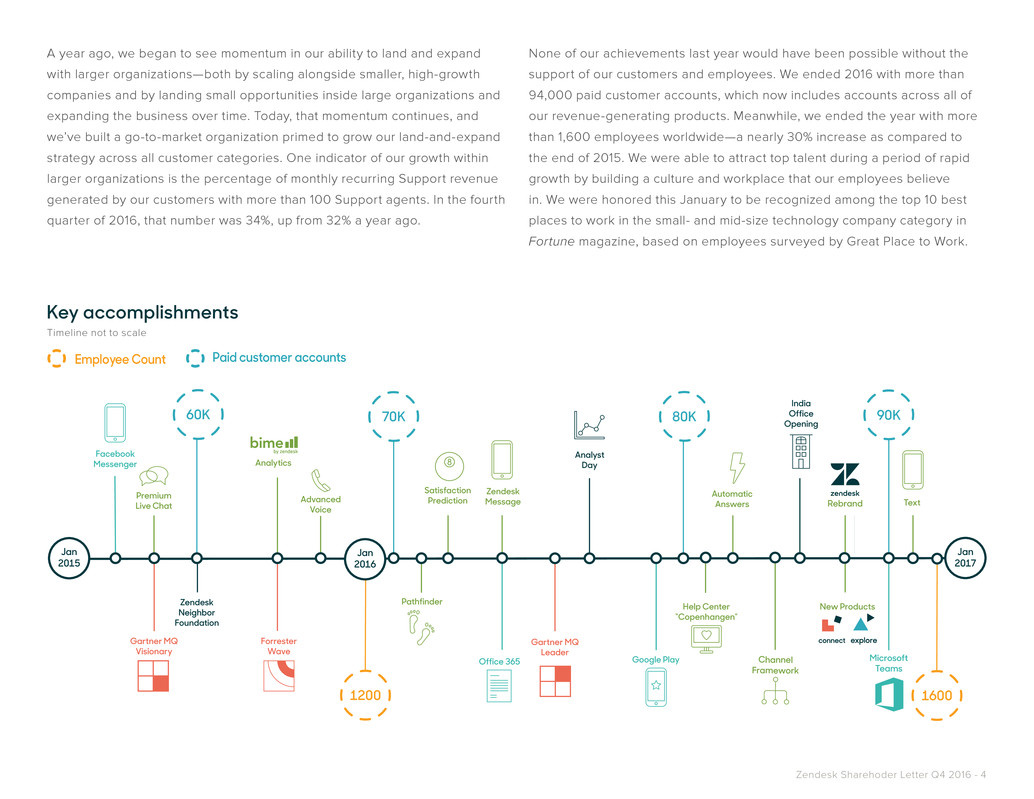
A year ago, we began to see momentum in our ability to land and expand
with larger organizations—both by scaling alongside smaller, high-growth
companies and by landing small opportunities inside large organizations and
expanding the business over time. Today, that momentum continues, and
we’ve built a go-to-market organization primed to grow our land-and-expand
strategy across all customer categories. One indicator of our growth within
larger organizations is the percentage of monthly recurring Support revenue
generated by our customers with more than 100 Support agents. In the fourth
quarter of 2016, that number was 34%, up from 32% a year ago.
None of our achievements last year would have been possible without the
support of our customers and employees. We ended 2016 with more than
94,000 paid customer accounts, which now includes accounts across all of
our revenue-generating products. Meanwhile, we ended the year with more
than 1,600 employees worldwide—a nearly 30% increase as compared to
the end of 2015. We were able to attract top talent during a period of rapid
growth by building a culture and workplace that our employees believe
in. We were honored this January to be recognized among the top 10 best
places to work in the small- and mid-size technology company category in
Fortune magazine, based on employees surveyed by Great Place to Work.
Help Center
“Copenhangen”
Advanced
Voice
Automatic
Answers
Channel
Framework
80K
Zendesk
Message
Satisfaction
Prediction
70K
Premium
Live Chat
60K
Facebook
Messenger Analytics
Analyst
Day
Text
Microsoft
Teams
Rebrand
90K
1600
Google Play
New Products
Gartner MQ
Leader
Office 365
Pathfinder
Gartner MQ
Visionary
1200
Forrester
Wave
Zendesk
Neighbor
Foundation
India
Office
Opening
Jan
2015
Jan
2016
Jan
2017
Key accomplishments
Employee Count Paid customer accounts
Timeline not to scale
Zendesk Sharehoder Letter Q4 2016 - 5
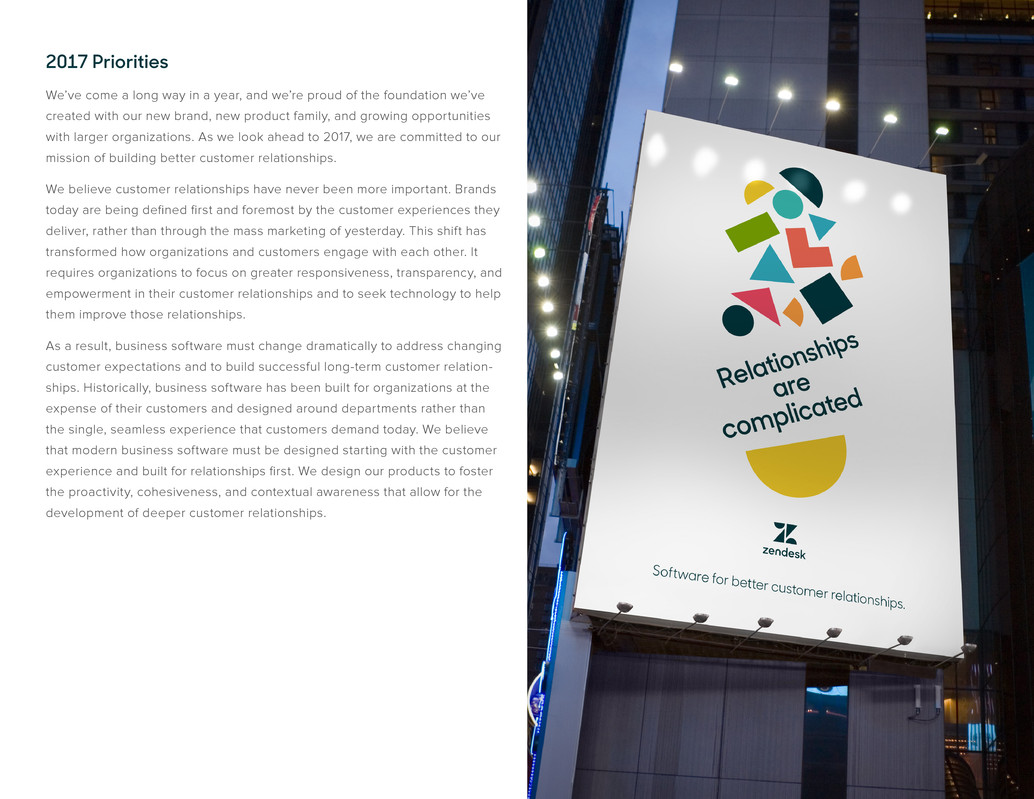
2017 Priorities
We’ve come a long way in a year, and we’re proud of the foundation we’ve
created with our new brand, new product family, and growing opportunities
with larger organizations. As we look ahead to 2017, we are committed to our
mission of building better customer relationships.
We believe customer relationships have never been more important. Brands
today are being defined first and foremost by the customer experiences they
deliver, rather than through the mass marketing of yesterday. This shift has
transformed how organizations and customers engage with each other. It
requires organizations to focus on greater responsiveness, transparency, and
empowerment in their customer relationships and to seek technology to help
them improve those relationships.
As a result, business software must change dramatically to address changing
customer expectations and to build successful long-term customer relation-
ships. Historically, business software has been built for organizations at the
expense of their customers and designed around departments rather than
the single, seamless experience that customers demand today. We believe
that modern business software must be designed starting with the customer
experience and built for relationships first. We design our products to foster
the proactivity, cohesiveness, and contextual awareness that allow for the
development of deeper customer relationships.
PLACEHOLDER FOR GRAPHIC
Zendesk Sharehoder Letter Q4 2016 - 6
For 2017, we are redoubling our efforts to improve customer relationships for
organizations of all sizes by focusing on key growth drivers for our business.
Building out an expansive and cohesive product family
Continuing to expand our family of products to serve other aspects of the
customer relationship is an important part of our growth. We will continue
to build and release new products in 2017, as well as broaden the shared
services that underpin them so our products both work well together and
offer organizations a unified view of their customers. A major focus for 2017
is expanding the adoption of multiple products among our customer base.
Enabling customer innovation
Our customers are transforming their relationships with their customers
through innovations in the customer experiences they deliver. Our products
and developer platform are powering that innovation and providing the
scalability and flexibility needed for companies at any stage of their growth
and maturity. We have invested in a highly extendable developer platform
to drive further innovation through our technology. Our powerful and open
APIs, substantial library of ready-to-deploy integrations, and Embeddables
continue to empower our customers to develop new and innovative ways to
transform the customer experience.
Expanding our markets
We built Zendesk on the premise that our products should be easy to
discover, deploy, and purchase so that any organization—from startup to
large enterprise—can realize its value. That principle of democratizing
software has developed into a highly efficient business model represented
by short sales cycles, significant expansion within customer accounts,
and organic growth through promotion by our customers. Over the years
we have built a compelling brand and leadership position among both
small-to-medium sized organizations and larger enterprises for which our
ease of use, quick return on investment, and flexible pricing are important
differentiators. Ultimately, we believe that more and more of the enterprise
software market will be served by this type of democratized approach. We
work with a growing number of forward-thinking enterprises looking to
more broadly transform their customer experiences across a broad range
of potential use cases. In 2017, we intend to focus on building out our core
transactional sales and marketing strategies while capitalizing on these
significant opportunities within larger organizations as the market increas-
ingly embraces this democratized model.
Zendesk Sharehoder Letter Q4 2016 - 7
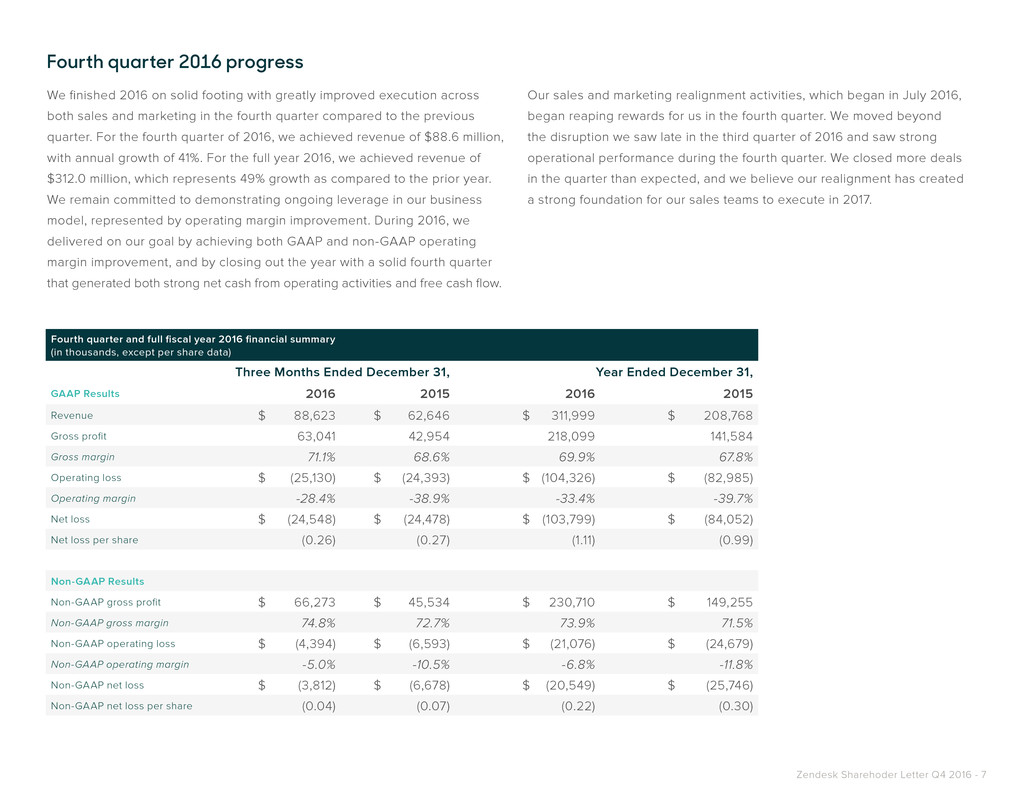
Fourth quarter 2016 progress
We finished 2016 on solid footing with greatly improved execution across
both sales and marketing in the fourth quarter compared to the previous
quarter. For the fourth quarter of 2016, we achieved revenue of $88.6 million,
with annual growth of 41%. For the full year 2016, we achieved revenue of
$312.0 million, which represents 49% growth as compared to the prior year.
We remain committed to demonstrating ongoing leverage in our business
model, represented by operating margin improvement. During 2016, we
delivered on our goal by achieving both GAAP and non-GAAP operating
margin improvement, and by closing out the year with a solid fourth quarter
that generated both strong net cash from operating activities and free cash flow.
Our sales and marketing realignment activities, which began in July 2016,
began reaping rewards for us in the fourth quarter. We moved beyond
the disruption we saw late in the third quarter of 2016 and saw strong
operational performance during the fourth quarter. We closed more deals
in the quarter than expected, and we believe our realignment has created
a strong foundation for our sales teams to execute in 2017.
Fourth quarter and full fiscal year 2016 financial summary
(in thousands, except per share data)
Three Months Ended December 31, Year Ended December 31,
GAAP Results 2016 2015 2016 2015
Revenue $ 88,623 $ 62,646 $ 311,999 $ 208,768
Gross profit 63,041 42,954 218,099 141,584
Gross margin 71.1% 68.6% 69.9% 67.8%
Operating loss $ (25,130) $ (24,393) $ (104,326) $ (82,985)
Operating margin -28.4% -38.9% -33.4% -39.7%
Net loss $ (24,548) $ (24,478) $ (103,799) $ (84,052)
Net loss per share (0.26) (0.27) (1.11) (0.99)
Non-GAAP Results
Non-GAAP gross profit $ 66,273 $ 45,534 $ 230,710 $ 149,255
Non-GAAP gross margin 74.8% 72.7% 73.9% 71.5%
Non-GAAP operating loss $ (4,394) $ (6,593) $ (21,076) $ (24,679)
Non-GAAP operating margin -5.0% -10.5% -6.8% -11.8%
Non-GAAP net loss $ (3,812) $ (6,678) $ (20,549) $ (25,746)
Non-GAAP net loss per share (0.04) (0.07) (0.22) (0.30)
Zendesk Sharehoder Letter Q4 2016 - 8
• Text, the new SMS feature of Zendesk Talk,
became generally available in the fourth quarter
after a successful early access program, and
hundreds of customer service teams are now
using Text to support their customers via SMS
from within Zendesk Support.
• Use of Talk was strong in the fourth quarter.
We reached a new milestone over the holiday
season in 2016 during which we had weeks
where Talk was handling more than 1 million
calls per week.
• In November, we announced an integration of
Zendesk Support and Microsoft Teams—the
new chat-based workspace in Office 365—
allowing teams to collaborate to solve
customer inquiries more quickly and
share customer feedback.
• The Apps Marketplace continues to grow in
popularity. In the fourth quarter, Zendesk and
our partners added almost 40 new apps to the
marketplace, bringing the total number to 555
at the end of the year. Among the new additions
is a YouTube channel integration—built on our
Channel Framework announced in the third
quarter—which allows customers to pull channel
and video comments into Zendesk tickets.
• Our customers using Zendesk Help Center set
new records in 2016, creating almost 1.3 million
articles for their end customers, with nearly 1.7
billion article views last year.
• Looking at Embeddables momentum, mobile
chat adoption in particular continues to grow
at an impressive rate. In January 2017 our Chat
mobile SDK served more than seven times as
many chats as it did in January 2016, reflecting
worldwide trends of increasing mobile Internet
usage and chat popularity.
• More than 30% of our Support customer base is
now using the Web Widget on a monthly basis,
and in the fourth quarter, we surpassed 1,000
monthly active customers using the Support
mobile SDK.
From a product perspective, we had many new exciting developments in the fourth quarter following our
rebrand and announcement of Zendesk Explore and Connect in October.
Zendesk Sharehoder Letter Q4 2016 - 9
We finished the year with increased momentum in
cross-selling additional products to our existing
customer base. Heading into 2017, our evolution
into a multi-product company is well underway,
and we expect multi-product adoption to continue
growing as we release more products throughout
the year. We are working with many key custom-
ers in early access programs (EAPs) for Zendesk
Explore, Connect, and Message, all of whom
are providing us with valuable feedback that is
helping to refine our product development.
The EAP for Explore is generating broad interest,
and we are continuing to work with our EAP
customers to fully develop our offering before
making it generally available. We’re making great
strides with our existing EAP participants, gaining
a deeper understanding of where they place
value and ensuring that the product can scale
and serve our large customer base. We intend to
continue growing the number of customers on our
Explore EAP and to expand our inputs from
customers. While we are extending the EAP
program, we continue to target general availability
in 2017.
The EAP for Connect has also generated high
interest from our customers. Connect will initially
provide new segmentation and customer activity
history for our Support customers and provide
tools to upsell through proactive customer service
campaigns via email and through in-product
messaging on the web or natively on mobile.
We expect Connect to be generally available in
the summer of 2017. Additionally, we continue
to see good customer traction with the EAP for
Message, which we also expect to be generally
available in the summer of 2017, with plans to first
offer integration with Facebook and Twitter—and
eventually Line and WeChat.
Zendesk Sharehoder Letter Q4 2016 - 10
Customers
Our customers’ success was highlighted by
Forrester Consulting in December, when the firm
published The Total Economic Impact™ of
Zendesk. The Zendesk-commissioned study—
based on Forrester’s interviews with five custom-
ers and subsequent financial analysis—examined
the potential return on investment (ROI) that
organizations may realize by using Zendesk to
improve customer interactions. The study pointed
to average benefits of more than $3.1 million
versus costs of $0.7 million and an ROI of 365%
over three years.
2016 was also an exciting year for customer wins
and expansions, as we continued to build great
relationships with forward-thinking brands. These
companies are using us in many different and
innovative ways and are constantly challenging
us to think differently, improve our products,
and make our technology better. A few of the
many brands that recently joined us or continued
expanding with us include the companies on
this page.
Clover Health
A health insurance provider for seniors
Cook Children’s Health Care System
A Texas-based, not-for-profit pediatric
health care organization
Credit Karma
A free credit score, reports, and insights company
DreamHost
A web hosting provider and domain
name registrar
GO-JEK
An Indonesian transportation, delivery, logistics,
and payments company
Ola
An Indian online transportation network company
Rakuten
A Japanese electronic commerce and
Internet company
Selfit
A Brazilian chain of fitness centers
Slack
A popular work communication channel
Squarespace
An all-in-one platform for building and hosting
custom websites
Stripe
A software platform powering payments for online
businesses and marketplaces around the world,
including our own Apps Marketplace
Zendesk Sharehoder Letter Q4 2016 - 11
Growing our customer base
During the second half of 2016, we successfully improved the rate of growth
and predictability of our low-touch, high-velocity business. The full-featured
trial of our products is a key component of our success, and the low-touch
nature of this category yields favorable customer acquisition costs.
Our sales-driven approach to larger opportunities in the mid-market and
enterprise segment continues to expand and evolve. Our family of products
resonates with a broad set of customers, and we work with a growing
number of forward-thinking enterprises looking to transform their customer
experience across a wide range of potential use cases. The fact that it’s easy
to trial and purchase our products allows large enterprises to realize their
value and grow with us more efficiently. We intend to focus on building out
our enterprise sales and marketing strategies within larger organizations as
they—like their more agile small-company counterparts—increasingly seek
software that is easy to deploy and use, offers flexible pricing, and provides
a quick ROI.
As a proxy of our continued success within these larger opportunities, we
measure our number of contracts signed with an annual value of $50,000 or
greater. In the fourth quarter, we closed 19% more of these contracts versus
a year ago. We saw a decrease in the average size of these transactions as
compared to the same period last year, which is impacted by the anniversary
of some outsized wins in the fourth quarter of 2015. However, we saw more
than a 60% quarter-over-quarter increase in the average contract value when
compared to the third quarter of 2016.
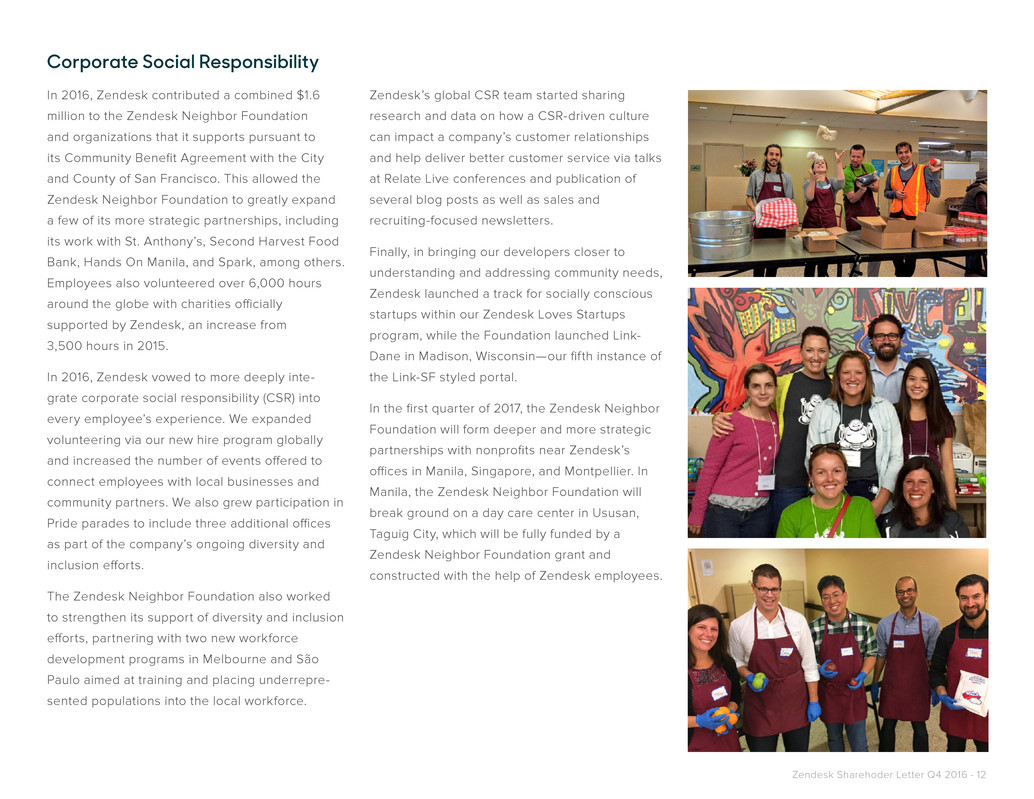
Another metric we use to gauge our penetration within larger organizations
is represented by the percentage of monthly recurring Support revenue
generated by customers with more than 100 Support agents, which—as we
mentioned earlier—was 34% in the fourth quarter versus 32% in the same
period a year ago and 33% in the third quarter of 2016. We expect this metric
to continue to expand gradually over time.
And finally, we measure our ability to both retain our customers and expand
with them using our dollar-based net expansion rate. In the fourth quarter,
our dollar-based net expansion rate was 115%, as compared to 123% in the
same period last year, and 114% in the third quarter of 2016. This result is in
line with our expectations, and we still expect our dollar-based net expan-
sion rate to range between 110-120% over the next several quarters.
% of total quarter-ending Support MRR
from paid customer accounts with 100+ Support agents
Zendesk Sharehoder Letter Q4 2016 - 12
Corporate Social Responsibility
In 2016, Zendesk contributed a combined $1.6
million to the Zendesk Neighbor Foundation
and organizations that it supports pursuant to
its Community Benefit Agreement with the City
and County of San Francisco. This allowed the
Zendesk Neighbor Foundation to greatly expand
a few of its more strategic partnerships, including
its work with St. Anthony’s, Second Harvest Food
Bank, Hands On Manila, and Spark, among others.
Employees also volunteered over 6,000 hours
around the globe with charities officially
supported by Zendesk, an increase from
3,500 hours in 2015.
In 2016, Zendesk vowed to more deeply inte-
grate corporate social responsibility (CSR) into
every employee’s experience. We expanded
volunteering via our new hire program globally
and increased the number of events offered to
connect employees with local businesses and
community partners. We also grew participation in
Pride parades to include three additional offices
as part of the company’s ongoing diversity and
inclusion efforts.
The Zendesk Neighbor Foundation also worked
to strengthen its support of diversity and inclusion
efforts, partnering with two new workforce
development programs in Melbourne and São
Paulo aimed at training and placing underrepre-
sented populations into the local workforce.
Zendesk’s global CSR team started sharing
research and data on how a CSR-driven culture
can impact a company’s customer relationships
and help deliver better customer service via talks
at Relate Live conferences and publication of
several blog posts as well as sales and
recruiting-focused newsletters.
Finally, in bringing our developers closer to
understanding and addressing community needs,
Zendesk launched a track for socially conscious
startups within our Zendesk Loves Startups
program, while the Foundation launched Link-
Dane in Madison, Wisconsin—our fifth instance of
the Link-SF styled portal.
In the first quarter of 2017, the Zendesk Neighbor
Foundation will form deeper and more strategic
partnerships with nonprofits near Zendesk’s
offices in Manila, Singapore, and Montpellier. In
Manila, the Zendesk Neighbor Foundation will
break ground on a day care center in Ususan,
Taguig City, which will be fully funded by a
Zendesk Neighbor Foundation grant and
constructed with the help of Zendesk employees.
Zendesk Sharehoder Letter Q4 2016 - 13
Financial measures and cash flows
We are proud of the financial progress we have made in 2016. While demon-
strating solid revenue growth, as indicated earlier, we continued to scale
our business by delivering year-over-year operating margin improvement. In
both the fourth quarter and full year 2016, we achieved GAAP and non-GAAP
operating margin expansion based on continued improvements across all of
our cost categories. We continue to focus on delivering high revenue growth
and achieving further scale.
Fourth quarter results
GAAP gross margin increased to 71.1% in the fourth quarter of 2016 compared
to 70.4% in the third quarter of 2016. GAAP gross margin in the fourth quarter
of 2015 was 68.6%. Non-GAAP gross margin increased to 74.8% in the fourth
quarter of 2016 compared to 74.4% in the third quarter of 2016. Non-GAAP
gross margin in the fourth quarter of 2015 was 72.7%.
GAAP operating loss for the fourth quarter of 2016 was $25.1 million
compared to GAAP operating loss for the third quarter of 2016 of $26.2
million. GAAP operating loss for the fourth quarter of 2015 was $24.4 million.
Non-GAAP operating loss for the fourth quarter of 2016 was $4.4 million,
compared to non-GAAP operating loss for the third quarter of 2016
of $4.3 million. Non-GAAP operating loss for the fourth quarter of 2015 was
$6.6 million.
GAAP operating margin improvement is attributed to improvements in gross
margin, and overall productivity gains in our operations. GAAP operating
margin for the fourth quarter of 2016 improved to -28.4% from -32.5% in the
third quarter of 2016. GAAP operating margin was -38.9% in the fourth quarter
of 2015. Non-GAAP operating margin improved to -5.0% in the fourth quarter
of 2016 from -5.3% in the third quarter of 2016. Non-GAAP operating margin
was -10.5% in the fourth quarter of 2015.
GAAP net loss for the fourth quarter of 2016 was $24.5 million or $0.26 per
share compared to GAAP net loss of $25.8 million or $0.27 per share for the
third quarter of 2016. GAAP net loss was $24.5 million or $0.27 per share for
the fourth quarter of 2015.
Non-GAAP net loss for the fourth quarter of 2016 was $3.8 million or $0.04
per share compared to non-GAAP net loss of $3.9 million or $0.04 per share
for the third quarter of 2016. Non-GAAP net loss was $6.7 million or $0.07
per share for the fourth quarter of 2015. Weighted average shares used to
compute both GAAP and non-GAAP net loss per share for the fourth quarter
of 2016 was 95.8 million.
Non-GAAP results for the fourth quarter of 2016 exclude $19.8 million in
share-based compensation and related expenses (including $1.8 million of
employer tax related to employee stock transactions and $0.6 million of
amortized share-based compensation capitalized in internal-use software),
and $0.9 million of amortization of purchased intangibles. Non-GAAP
results for the third quarter of 2016 exclude $21.0 million in share-based
compensation and related expenses (including $0.6 million of employer tax
related to employee stock transactions and $0.4 million of amortized share-
based compensation capitalized in internal-use software), and $1.0 million
of amortization of purchased intangibles. Non-GAAP results for the fourth
quarter of 2015 exclude $16.2 million in share-based compensation and
related expenses (including $0.3 million of employer tax related to employee
stock transactions and $0.3 million of amortized share-based compensation
capitalized in internal-use software), $0.7 million of acquisition related costs,
and $0.9 million of amortization of purchased intangibles.
During the fourth quarter of 2016, net cash from operating activities was
$20.5 million, and we achieved positive free cash flow of $10.4 million. We
ended the fourth quarter of 2016 with $93.7 million of cash and equivalents,
and we had an additional $131.2 million of short-term marketable securities
and $75.2 million in long-term marketable securities.
Zendesk Sharehoder Letter Q4 2016 - 14
Full year 2016 results
GAAP gross margin increased to 69.9% in 2016 compared to 67.8% in 2015.
Non-GAAP gross margin increased to 73.9% in 2016 compared to 71.5%
in 2015.
GAAP operating loss for 2016 was $104.3 million compared to GAAP
operating loss for 2015 of $83.0 million. Non-GAAP operating loss for 2016
was $21.1 million, compared to non-GAAP operating loss for 2015 of $24.7
million.
GAAP operating margin in 2016 improved to -33.4% from -39.7% in 2015.
Non-GAAP operating margin improved to -6.8% in 2016 from -11.8% in 2015.
GAAP net loss in 2016 was $103.8 million or $1.11 per share compared to
GAAP net loss of $84.1 million or $0.99 per share for 2015. Non-GAAP net
loss in 2016 was $20.5 million or $0.22 per share compared to non-GAAP
net loss of $25.7 million or $0.30 per share in 2015. Weighted average shares
used to compute both GAAP and non-GAAP net loss per share for 2016 was
93.2 million.
Non-GAAP results for 2016 exclude $79.5 million in share-based compen-
sation and related expenses (including $3.9 million of employer tax related
to employee stock transactions and $1.8 million of amortized share-based
compensation capitalized in internal-use software), and $3.8 million of
amortization of purchased intangibles. Non-GAAP results for 2015 exclude
$55.1 million in share-based compensation and related expenses (including
$1.5 million of employer tax related to employee stock transactions and $1.1
million of amortized share-based compensation capitalized in internal-use
software), $1.0 million of acquisition related costs, and $2.2 million of
amortization of purchased intangibles.
For the full year 2016, net cash from operating activities was $24.5 million,
and we approached free cash flow breakeven at -$2.4 million.
Zendesk Sharehoder Letter Q4 2016 - 15
Guidance
For the first quarter of 2017, we expect revenue to range between $91.0 and
$93.0 million and we expect our GAAP operating loss to range between
$28.0 and $29.0 million. We expect our non-GAAP operating loss for the first
quarter of 2017 to range between $6.0 and $7.0 million. Our GAAP operating
loss for the first quarter of 2017 is estimated to include share-based compen-
sation and related expenses of approximately $21.1 million, and amortization
of purchased intangibles of approximately $0.9 million.
For the full year of 2017, we expect revenue to range between $415.0 and
$425.0 million, representing growth between 33% and 36% year-over-
year. We expect our GAAP operating loss for the full year of 2017 to range
between $109.0 and $113.0 million, and we expect our non-GAAP operating
loss to range between $16.0 and $20.0 million. Our GAAP operating loss
for the full year of 2017 is estimated to include share-based compensation
and related expenses of approximately $89.8 million, and amortization of
purchased intangibles of approximately $3.2 million.
Our full year guidance reflects our confidence in maintaining a high growth
rate in 2017. We note, however, that several recurring factors affect our
revenue recognition in the first half of the year compared to the second half
of the year, as evidenced by our first quarter 2017 guidance. Because of the
flexibility and scalability we provide in our products and customer contracts,
we saw impacts from seasonality in 2016 that we expect to continue.
We have a small, yet growing, number of customers on contracts requiring
additional payment if they exceed their expected monthly agent usage,
and we had some revenue from these contracts in the fourth quarter that is
non-recurring. We also have customers who add flexible agents when they
need more capacity during busy periods, especially in the fourth quarter,
and then scale back again at the start of a new year. Though it is difficult to
forecast, we believe that this seasonality will increase as we mature.
We expect net cash from operating activities to be positive for the first half
of the year, whereas we expect free cash flow to be negative during first
half of the year. We estimate our net cash from operating activities and free
cash flow to be positive for the full year 2017.
This target regarding free cash flow includes cash used for purchases of
property and equipment and internal-use software development costs.
We have not reconciled free cash flow guidance to net cash from operating
activities for this future period because we do not provide guidance on the
reconciling items between net cash from operating activities and free cash
flow, as a result of the uncertainty regarding, and the potential variability
of, these items. The actual amount of such reconciling items will have a
significant impact on our free cash flow and, accordingly, a reconciliation
of net cash from operating activities to free cash flow for the period is not
available without unreasonable effort.
Finally, we estimate we will have approximately 97.3 million weighted
average shares outstanding for the first quarter of 2017 and 99.3 million
weighted average shares outstanding for the full year of 2017, each based
only on current shares outstanding and anticipated activity associated with
equity incentive plans.
Zendesk Sharehoder Letter Q4 2016 - 16
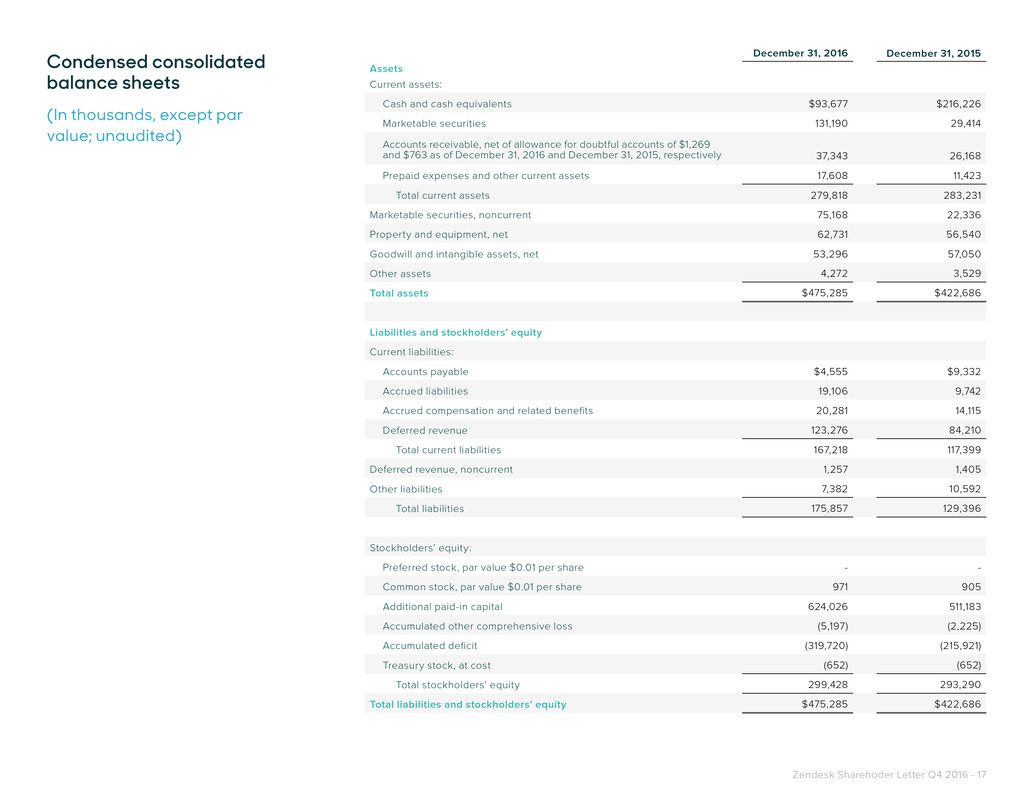
Condensed
consolidated statements
of operations
(In thousands, except per
share data; unaudited)
Three Months Ended
December 31,
Year Ended
December 31,
2016 2015 2016 2015
Revenue $88,623 $62,646 $311,999 $208,768
Cost of revenue 25,582 19,693 93,900 67,184
Gross profit 63,041 42,954 218,099 141,584
Operating expenses:
Research and development 24,383 19,098 91,067 62,615
Sales and marketing 47,566 34,328 166,987 114,052
General and administrative 16,222 13,920 64,371 47,902
Total operating expenses 88,171 67,346 322,425 224,569
Operating loss (25,130) (24,392) (104,326) (82,985)
Other income (expense), net 775 (302) 1,520 (729)
Loss before provision for (benefit from) income taxes (24,355) (24,694) (102,806) (83,714)
Provision for (benefit from) income taxes 193 (216) 993 338
Net loss $(24,548) $(24,478) $(103,799) $(84,052)
Net loss per share, basic and diluted $(0.26) $(0.27) $(1.11) $(0.99)
Weighted-average shares used to compute
net loss per share, basic and diluted 95,793 89,073 93,161 84,926
Zendesk Sharehoder Letter Q4 2016 - 17
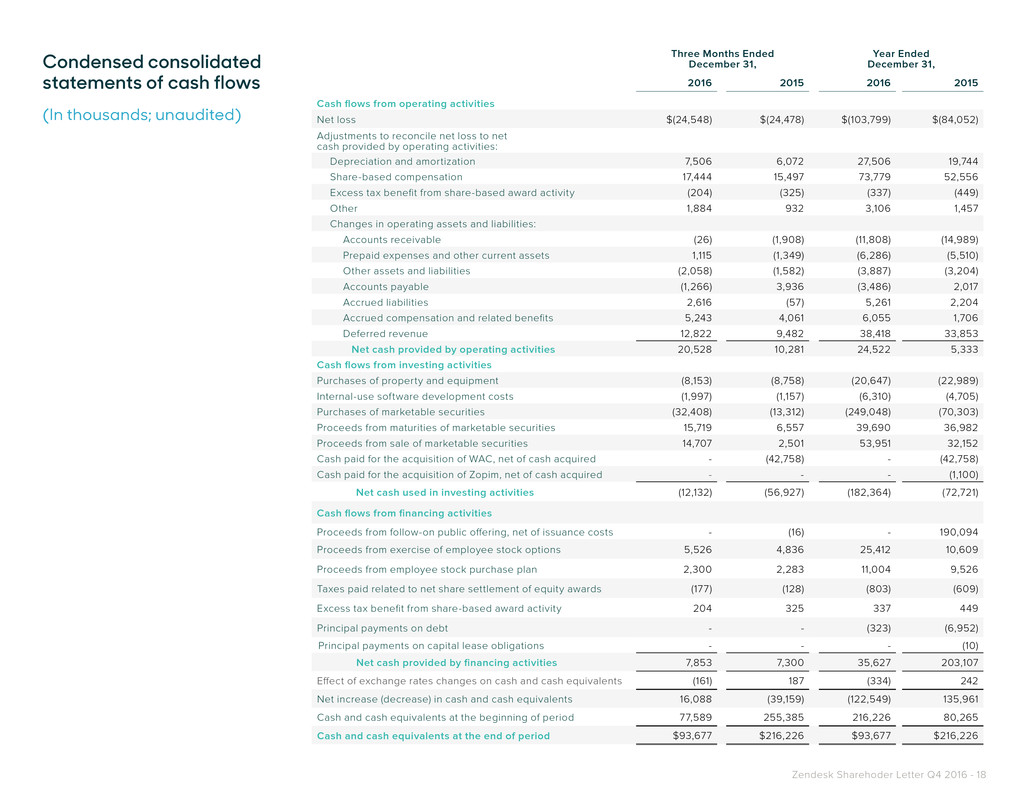
Condensed consolidated
balance sheets
(In thousands, except par
value; unaudited)
December 31, 2016 December 31, 2015
Assets
Current assets:
Cash and cash equivalents $93,677 $216,226
Marketable securities 131,190 29,414
Accounts receivable, net of allowance for doubtful accounts of $1,269
and $763 as of December 31, 2016 and December 31, 2015, respectively 37,343 26,168
Prepaid expenses and other current assets 17,608 11,423
Total current assets 279,818 283,231
Marketable securities, noncurrent 75,168 22,336
Property and equipment, net 62,731 56,540
Goodwill and intangible assets, net 53,296 57,050
Other assets 4,272 3,529
Total assets $475,285 $422,686
Liabilities and stockholders’ equity
Current liabilities:
Accounts payable $4,555 $9,332
Accrued liabilities 19,106 9,742
Accrued compensation and related benefits 20,281 14,115
Deferred revenue 123,276 84,210
Total current liabilities 167,218 117,399
Deferred revenue, noncurrent 1,257 1,405
Other liabilities 7,382 10,592
Total liabilities 175,857 129,396
Stockholders’ equity:
Preferred stock, par value $0.01 per share - -
Common stock, par value $0.01 per share 971 905
Additional paid-in capital 624,026 511,183
Accumulated other comprehensive loss (5,197) (2,225)
Accumulated deficit (319,720) (215,921)
Treasury stock, at cost (652) (652)
Total stockholders’ equity 299,428 293,290
Total liabilities and stockholders’ equity $475,285 $422,686
Zendesk Sharehoder Letter Q4 2016 - 18
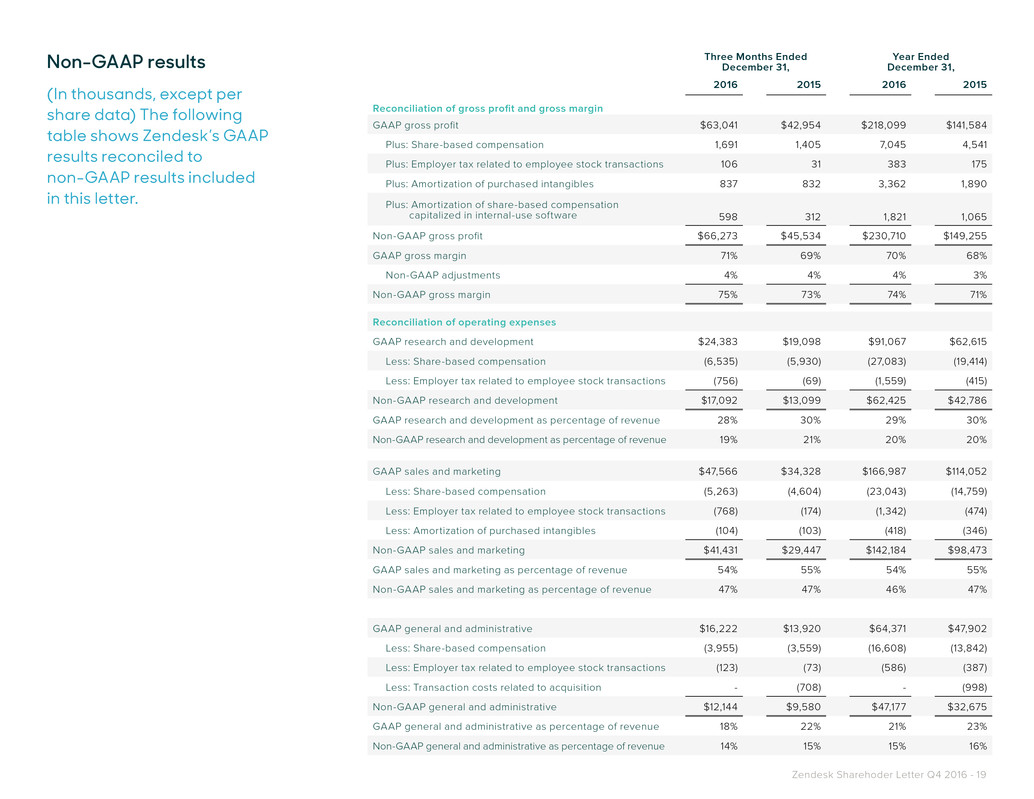
Three Months Ended
December 31,
Year Ended
December 31,
2016 2015 2016 2015
Cash flows from operating activities
Net loss $(24,548) $(24,478) $(103,799) $(84,052)
Adjustments to reconcile net loss to net
cash provided by operating activities:
Depreciation and amortization 7,506 6,072 27,506 19,744
Share-based compensation 17,444 15,497 73,779 52,556
Excess tax benefit from share-based award activity (204) (325) (337) (449)
Other 1,884 932 3,106 1,457
Changes in operating assets and liabilities:
Accounts receivable (26) (1,908) (11,808) (14,989)
Prepaid expenses and other current assets 1,115 (1,349) (6,286) (5,510)
Other assets and liabilities (2,058) (1,582) (3,887) (3,204)
Accounts payable (1,266) 3,936 (3,486) 2,017
Accrued liabilities 2,616 (57) 5,261 2,204
Accrued compensation and related benefits 5,243 4,061 6,055 1,706
Deferred revenue 12,822 9,482 38,418 33,853
Net cash provided by operating activities 20,528 10,281 24,522 5,333
Cash flows from investing activities
Purchases of property and equipment (8,153) (8,758) (20,647) (22,989)
Internal-use software development costs (1,997) (1,157) (6,310) (4,705)
Purchases of marketable securities (32,408) (13,312) (249,048) (70,303)
Proceeds from maturities of marketable securities 15,719 6,557 39,690 36,982
Proceeds from sale of marketable securities 14,707 2,501 53,951 32,152
Cash paid for the acquisition of WAC, net of cash acquired - (42,758) - (42,758)
Cash paid for the acquisition of Zopim, net of cash acquired - - - (1,100)
Net cash used in investing activities (12,132) (56,927) (182,364) (72,721)
Cash flows from financing activities
Proceeds from follow-on public offering, net of issuance costs - (16) - 190,094
Proceeds from exercise of employee stock options 5,526 4,836 25,412 10,609
Proceeds from employee stock purchase plan 2,300 2,283 11,004 9,526
Taxes paid related to net share settlement of equity awards (177) (128) (803) (609)
Excess tax benefit from share-based award activity 204 325 337 449
Principal payments on debt - - (323) (6,952)
Principal payments on capital lease obligations - - - (10)
Net cash provided by financing activities 7,853 7,300 35,627 203,107
Effect of exchange rates changes on cash and cash equivalents (161) 187 (334) 242
Net increase (decrease) in cash and cash equivalents 16,088 (39,159) (122,549) 135,961
Cash and cash equivalents at the beginning of period 77,589 255,385 216,226 80,265
Cash and cash equivalents at the end of period $93,677 $216,226 $93,677 $216,226
Condensed consolidated
statements of cash flows
(In thousands; unaudited)
Zendesk Sharehoder Letter Q4 2016 - 19
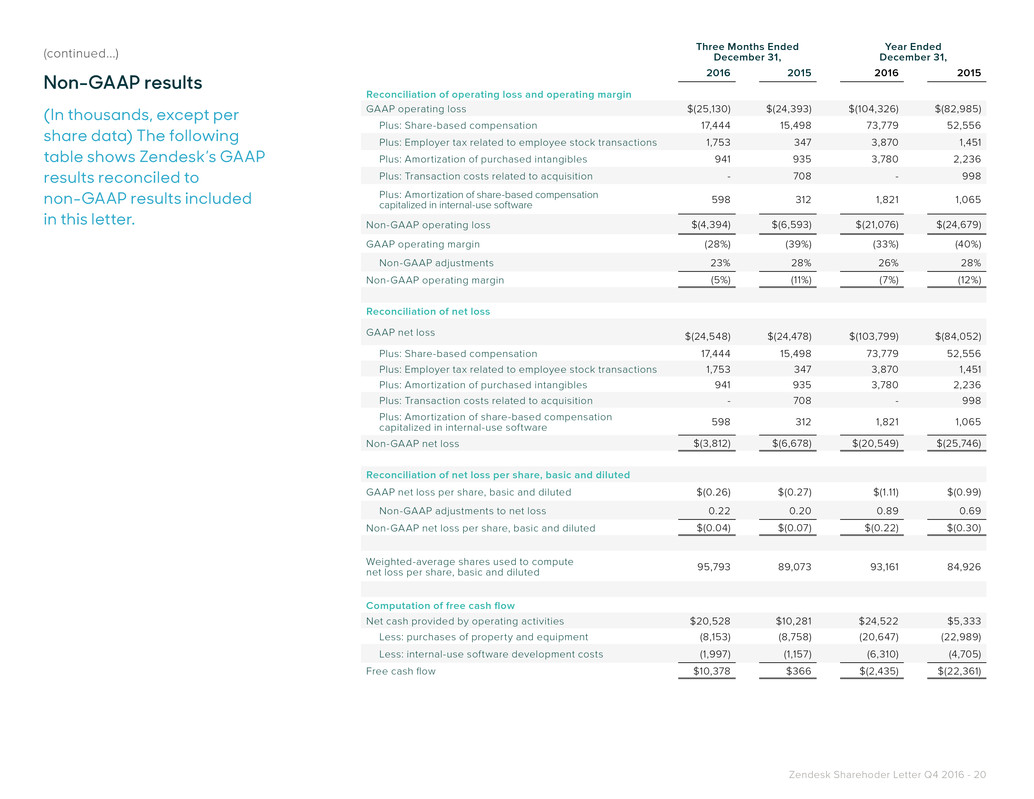
Non-GAAP results
(In thousands, except per
share data) The following
table shows Zendesk’s GAAP
results reconciled to
non-GAAP results included
in this letter.
Three Months Ended
December 31,
Year Ended
December 31,
2016 2015 2016 2015
Reconciliation of gross profit and gross margin
GAAP gross profit $63,041 $42,954 $218,099 $141,584
Plus: Share-based compensation 1,691 1,405 7,045 4,541
Plus: Employer tax related to employee stock transactions 106 31 383 175
Plus: Amortization of purchased intangibles 837 832 3,362 1,890
Plus: Amortization of share-based compensation
capitalized in internal-use software 598 312 1,821 1,065
Non-GAAP gross profit $66,273 $45,534 $230,710 $149,255
GAAP gross margin 71% 69% 70% 68%
Non-GAAP adjustments 4% 4% 4% 3%
Non-GAAP gross margin 75% 73% 74% 71%
Reconciliation of operating expenses
GAAP research and development $24,383 $19,098 $91,067 $62,615
Less: Share-based compensation (6,535) (5,930) (27,083) (19,414)
Less: Employer tax related to employee stock transactions (756) (69) (1,559) (415)
Non-GAAP research and development $17,092 $13,099 $62,425 $42,786
GAAP research and development as percentage of revenue 28% 30% 29% 30%
Non-GAAP research and development as percentage of revenue 19% 21% 20% 20%
GAAP sales and marketing $47,566 $34,328 $166,987 $114,052
Less: Share-based compensation (5,263) (4,604) (23,043) (14,759)
Less: Employer tax related to employee stock transactions (768) (174) (1,342) (474)
Less: Amortization of purchased intangibles (104) (103) (418) (346)
Non-GAAP sales and marketing $41,431 $29,447 $142,184 $98,473
GAAP sales and marketing as percentage of revenue 54% 55% 54% 55%
Non-GAAP sales and marketing as percentage of revenue 47% 47% 46% 47%
GAAP general and administrative $16,222 $13,920 $64,371 $47,902
Less: Share-based compensation (3,955) (3,559) (16,608) (13,842)
Less: Employer tax related to employee stock transactions (123) (73) (586) (387)
Less: Transaction costs related to acquisition - (708) - (998)
Non-GAAP general and administrative $12,144 $9,580 $47,177 $32,675
GAAP general and administrative as percentage of revenue 18% 22% 21% 23%
Non-GAAP general and administrative as percentage of revenue 14% 15% 15% 16%
Zendesk Sharehoder Letter Q4 2016 - 20
(continued...)
Non-GAAP results
(In thousands, except per
share data) The following
table shows Zendesk’s GAAP
results reconciled to
non-GAAP results included
in this letter.
Three Months Ended
December 31,
Year Ended
December 31,
2016 2015 2016 2015
Reconciliation of operating loss and operating margin
GAAP operating loss $(25,130) $(24,393) $(104,326) $(82,985)
Plus: Share-based compensation 17,444 15,498 73,779 52,556
Plus: Employer tax related to employee stock transactions 1,753 347 3,870 1,451
Plus: Amortization of purchased intangibles 941 935 3,780 2,236
Plus: Transaction costs related to acquisition - 708 - 998
Plus: Amortization of share-based compensation
capitalized in internal-use software 598 312 1,821 1,065
Non-GAAP operating loss $(4,394) $(6,593) $(21,076) $(24,679)
GAAP operating margin (28%) (39%) (33%) (40%)
Non-GAAP adjustments 23% 28% 26% 28%
Non-GAAP operating margin (5%) (11%) (7%) (12%)
Reconciliation of net loss
GAAP net loss
$(24,548) $(24,478) $(103,799) $(84,052)
Plus: Share-based compensation 17,444 15,498 73,779 52,556
Plus: Employer tax related to employee stock transactions 1,753 347 3,870 1,451
Plus: Amortization of purchased intangibles 941 935 3,780 2,236
Plus: Transaction costs related to acquisition - 708 - 998
Plus: Amortization of share-based compensation
capitalized in internal-use software 598 312 1,821 1,065
Non-GAAP net loss $(3,812) $(6,678) $(20,549) $(25,746)
Reconciliation of net loss per share, basic and diluted
GAAP net loss per share, basic and diluted $(0.26) $(0.27) $(1.11) $(0.99)
Non-GAAP adjustments to net loss 0.22 0.20 0.89 0.69
Non-GAAP net loss per share, basic and diluted $(0.04) $(0.07) $(0.22) $(0.30)
Weighted-average shares used to compute
net loss per share, basic and diluted 95,793 89,073 93,161 84,926
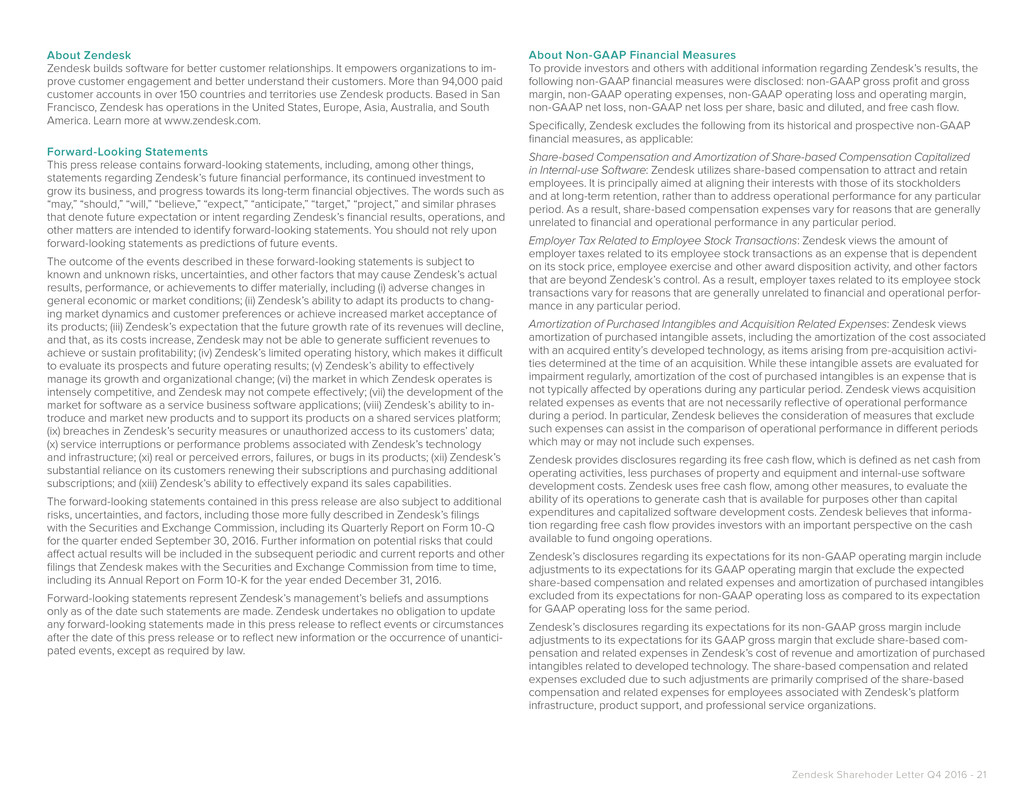
Computation of free cash flow
Net cash provided by operating activities $20,528 $10,281 $24,522 $5,333
Less: purchases of property and equipment (8,153) (8,758) (20,647) (22,989)
Less: internal-use software development costs (1,997) (1,157) (6,310) (4,705)
Free cash flow $10,378 $366 $(2,435) $(22,361)
Zendesk Sharehoder Letter Q4 2016 - 21
About Zendesk
Zendesk builds software for better customer relationships. It empowers organizations to im-
prove customer engagement and better understand their customers. More than 94,000 paid
customer accounts in over 150 countries and territories use Zendesk products. Based in San
Francisco, Zendesk has operations in the United States, Europe, Asia, Australia, and South
America. Learn more at www.zendesk.com.
Forward-Looking Statements
This press release contains forward-looking statements, including, among other things,
statements regarding Zendesk’s future financial performance, its continued investment to
grow its business, and progress towards its long-term financial objectives. The words such as
“may,” “should,” “will,” “believe,” “expect,” “anticipate,” “target,” “project,” and similar phrases
that denote future expectation or intent regarding Zendesk’s financial results, operations, and
other matters are intended to identify forward-looking statements. You should not rely upon
forward-looking statements as predictions of future events.
The outcome of the events described in these forward-looking statements is subject to
known and unknown risks, uncertainties, and other factors that may cause Zendesk’s actual
results, performance, or achievements to differ materially, including (i) adverse changes in
general economic or market conditions; (ii) Zendesk’s ability to adapt its products to chang-
ing market dynamics and customer preferences or achieve increased market acceptance of
its products; (iii) Zendesk’s expectation that the future growth rate of its revenues will decline,
and that, as its costs increase, Zendesk may not be able to generate sufficient revenues to
achieve or sustain profitability; (iv) Zendesk’s limited operating history, which makes it difficult
to evaluate its prospects and future operating results; (v) Zendesk’s ability to effectively
manage its growth and organizational change; (vi) the market in which Zendesk operates is
intensely competitive, and Zendesk may not compete effectively; (vii) the development of the
market for software as a service business software applications; (viii) Zendesk’s ability to in-
troduce and market new products and to support its products on a shared services platform;
(ix) breaches in Zendesk’s security measures or unauthorized access to its customers’ data;
(x) service interruptions or performance problems associated with Zendesk’s technology
and infrastructure; (xi) real or perceived errors, failures, or bugs in its products; (xii) Zendesk’s
substantial reliance on its customers renewing their subscriptions and purchasing additional
subscriptions; and (xiii) Zendesk’s ability to effectively expand its sales capabilities.
The forward-looking statements contained in this press release are also subject to additional
risks, uncertainties, and factors, including those more fully described in Zendesk’s filings
with the Securities and Exchange Commission, including its Quarterly Report on Form 10-Q
for the quarter ended September 30, 2016. Further information on potential risks that could
affect actual results will be included in the subsequent periodic and current reports and other
filings that Zendesk makes with the Securities and Exchange Commission from time to time,
including its Annual Report on Form 10-K for the year ended December 31, 2016.
Forward-looking statements represent Zendesk’s management’s beliefs and assumptions
only as of the date such statements are made. Zendesk undertakes no obligation to update
any forward-looking statements made in this press release to reflect events or circumstances
after the date of this press release or to reflect new information or the occurrence of unantici-
pated events, except as required by law.
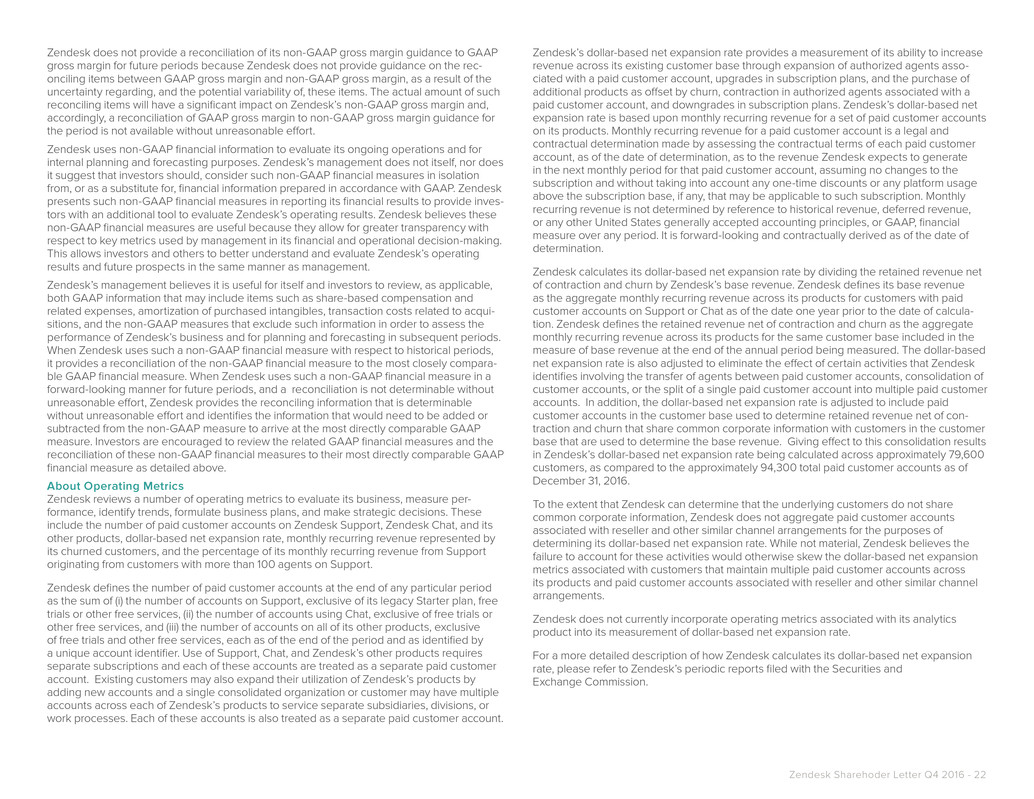
About Non-GAAP Financial Measures
To provide investors and others with additional information regarding Zendesk’s results, the
following non-GAAP financial measures were disclosed: non-GAAP gross profit and gross
margin, non-GAAP operating expenses, non-GAAP operating loss and operating margin,
non-GAAP net loss, non-GAAP net loss per share, basic and diluted, and free cash flow.
Specifically, Zendesk excludes the following from its historical and prospective non-GAAP
financial measures, as applicable:
Share-based Compensation and Amortization of Share-based Compensation Capitalized
in Internal-use Software: Zendesk utilizes share-based compensation to attract and retain
employees. It is principally aimed at aligning their interests with those of its stockholders
and at long-term retention, rather than to address operational performance for any particular
period. As a result, share-based compensation expenses vary for reasons that are generally
unrelated to financial and operational performance in any particular period.
Employer Tax Related to Employee Stock Transactions: Zendesk views the amount of
employer taxes related to its employee stock transactions as an expense that is dependent
on its stock price, employee exercise and other award disposition activity, and other factors
that are beyond Zendesk’s control. As a result, employer taxes related to its employee stock
transactions vary for reasons that are generally unrelated to financial and operational perfor-
mance in any particular period.
Amortization of Purchased Intangibles and Acquisition Related Expenses: Zendesk views
amortization of purchased intangible assets, including the amortization of the cost associated
with an acquired entity’s developed technology, as items arising from pre-acquisition activi-
ties determined at the time of an acquisition. While these intangible assets are evaluated for
impairment regularly, amortization of the cost of purchased intangibles is an expense that is
not typically affected by operations during any particular period. Zendesk views acquisition
related expenses as events that are not necessarily reflective of operational performance
during a period. In particular, Zendesk believes the consideration of measures that exclude
such expenses can assist in the comparison of operational performance in different periods
which may or may not include such expenses.
Zendesk provides disclosures regarding its free cash flow, which is defined as net cash from
operating activities, less purchases of property and equipment and internal-use software
development costs. Zendesk uses free cash flow, among other measures, to evaluate the
ability of its operations to generate cash that is available for purposes other than capital
expenditures and capitalized software development costs. Zendesk believes that informa-
tion regarding free cash flow provides investors with an important perspective on the cash
available to fund ongoing operations.
Zendesk’s disclosures regarding its expectations for its non-GAAP operating margin include
adjustments to its expectations for its GAAP operating margin that exclude the expected
share-based compensation and related expenses and amortization of purchased intangibles
excluded from its expectations for non-GAAP operating loss as compared to its expectation
for GAAP operating loss for the same period.
Zendesk’s disclosures regarding its expectations for its non-GAAP gross margin include
adjustments to its expectations for its GAAP gross margin that exclude share-based com-
pensation and related expenses in Zendesk’s cost of revenue and amortization of purchased
intangibles related to developed technology. The share-based compensation and related
expenses excluded due to such adjustments are primarily comprised of the share-based
compensation and related expenses for employees associated with Zendesk’s platform
infrastructure, product support, and professional service organizations.
Zendesk Sharehoder Letter Q4 2016 - 22
Zendesk does not provide a reconciliation of its non-GAAP gross margin guidance to GAAP
gross margin for future periods because Zendesk does not provide guidance on the rec-
onciling items between GAAP gross margin and non-GAAP gross margin, as a result of the
uncertainty regarding, and the potential variability of, these items. The actual amount of such
reconciling items will have a significant impact on Zendesk’s non-GAAP gross margin and,
accordingly, a reconciliation of GAAP gross margin to non-GAAP gross margin guidance for
the period is not available without unreasonable effort.
Zendesk uses non-GAAP financial information to evaluate its ongoing operations and for
internal planning and forecasting purposes. Zendesk’s management does not itself, nor does
it suggest that investors should, consider such non-GAAP financial measures in isolation
from, or as a substitute for, financial information prepared in accordance with GAAP. Zendesk
presents such non-GAAP financial measures in reporting its financial results to provide inves-
tors with an additional tool to evaluate Zendesk’s operating results. Zendesk believes these
non-GAAP financial measures are useful because they allow for greater transparency with
respect to key metrics used by management in its financial and operational decision-making.
This allows investors and others to better understand and evaluate Zendesk’s operating
results and future prospects in the same manner as management.
Zendesk’s management believes it is useful for itself and investors to review, as applicable,
both GAAP information that may include items such as share-based compensation and
related expenses, amortization of purchased intangibles, transaction costs related to acqui-
sitions, and the non-GAAP measures that exclude such information in order to assess the
performance of Zendesk’s business and for planning and forecasting in subsequent periods.
When Zendesk uses such a non-GAAP financial measure with respect to historical periods,
it provides a reconciliation of the non-GAAP financial measure to the most closely compara-
ble GAAP financial measure. When Zendesk uses such a non-GAAP financial measure in a
forward-looking manner for future periods, and a reconciliation is not determinable without
unreasonable effort, Zendesk provides the reconciling information that is determinable
without unreasonable effort and identifies the information that would need to be added or
subtracted from the non-GAAP measure to arrive at the most directly comparable GAAP
measure. Investors are encouraged to review the related GAAP financial measures and the
reconciliation of these non-GAAP financial measures to their most directly comparable GAAP
financial measure as detailed above.
About Operating Metrics
Zendesk reviews a number of operating metrics to evaluate its business, measure per-
formance, identify trends, formulate business plans, and make strategic decisions. These
include the number of paid customer accounts on Zendesk Support, Zendesk Chat, and its
other products, dollar-based net expansion rate, monthly recurring revenue represented by
its churned customers, and the percentage of its monthly recurring revenue from Support
originating from customers with more than 100 agents on Support.
Zendesk defines the number of paid customer accounts at the end of any particular period
as the sum of (i) the number of accounts on Support, exclusive of its legacy Starter plan, free
trials or other free services, (ii) the number of accounts using Chat, exclusive of free trials or
other free services, and (iii) the number of accounts on all of its other products, exclusive
of free trials and other free services, each as of the end of the period and as identified by
a unique account identifier. Use of Support, Chat, and Zendesk’s other products requires
separate subscriptions and each of these accounts are treated as a separate paid customer
account. Existing customers may also expand their utilization of Zendesk’s products by
adding new accounts and a single consolidated organization or customer may have multiple
accounts across each of Zendesk’s products to service separate subsidiaries, divisions, or
work processes. Each of these accounts is also treated as a separate paid customer account.
Zendesk’s dollar-based net expansion rate provides a measurement of its ability to increase
revenue across its existing customer base through expansion of authorized agents asso-
ciated with a paid customer account, upgrades in subscription plans, and the purchase of
additional products as offset by churn, contraction in authorized agents associated with a
paid customer account, and downgrades in subscription plans. Zendesk’s dollar-based net
expansion rate is based upon monthly recurring revenue for a set of paid customer accounts
on its products. Monthly recurring revenue for a paid customer account is a legal and
contractual determination made by assessing the contractual terms of each paid customer
account, as of the date of determination, as to the revenue Zendesk expects to generate
in the next monthly period for that paid customer account, assuming no changes to the
subscription and without taking into account any one-time discounts or any platform usage
above the subscription base, if any, that may be applicable to such subscription. Monthly
recurring revenue is not determined by reference to historical revenue, deferred revenue,
or any other United States generally accepted accounting principles, or GAAP, financial
measure over any period. It is forward-looking and contractually derived as of the date of
determination.
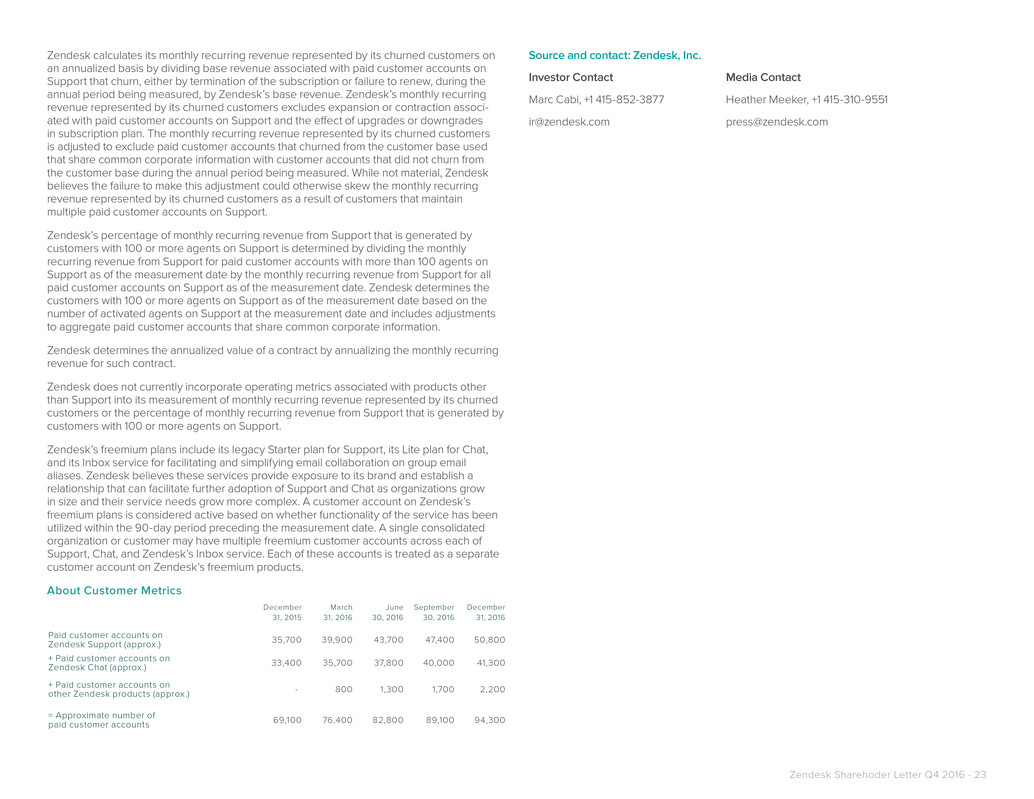
Zendesk calculates its dollar-based net expansion rate by dividing the retained revenue net
of contraction and churn by Zendesk’s base revenue. Zendesk defines its base revenue
as the aggregate monthly recurring revenue across its products for customers with paid
customer accounts on Support or Chat as of the date one year prior to the date of calcula-
tion. Zendesk defines the retained revenue net of contraction and churn as the aggregate
monthly recurring revenue across its products for the same customer base included in the
measure of base revenue at the end of the annual period being measured. The dollar-based
net expansion rate is also adjusted to eliminate the effect of certain activities that Zendesk
identifies involving the transfer of agents between paid customer accounts, consolidation of
customer accounts, or the split of a single paid customer account into multiple paid customer
accounts. In addition, the dollar-based net expansion rate is adjusted to include paid
customer accounts in the customer base used to determine retained revenue net of con-
traction and churn that share common corporate information with customers in the customer
base that are used to determine the base revenue. Giving effect to this consolidation results
in Zendesk’s dollar-based net expansion rate being calculated across approximately 79,600
customers, as compared to the approximately 94,300 total paid customer accounts as of
December 31, 2016.
To the extent that Zendesk can determine that the underlying customers do not share
common corporate information, Zendesk does not aggregate paid customer accounts
associated with reseller and other similar channel arrangements for the purposes of
determining its dollar-based net expansion rate. While not material, Zendesk believes the
failure to account for these activities would otherwise skew the dollar-based net expansion
metrics associated with customers that maintain multiple paid customer accounts across
its products and paid customer accounts associated with reseller and other similar channel
arrangements.
Zendesk does not currently incorporate operating metrics associated with its analytics
product into its measurement of dollar-based net expansion rate.
For a more detailed description of how Zendesk calculates its dollar-based net expansion
rate, please refer to Zendesk’s periodic reports filed with the Securities and
Exchange Commission.
Zendesk Sharehoder Letter Q4 2016 - 23
Zendesk calculates its monthly recurring revenue represented by its churned customers on
an annualized basis by dividing base revenue associated with paid customer accounts on
Support that churn, either by termination of the subscription or failure to renew, during the
annual period being measured, by Zendesk’s base revenue. Zendesk’s monthly recurring
revenue represented by its churned customers excludes expansion or contraction associ-
ated with paid customer accounts on Support and the effect of upgrades or downgrades
in subscription plan. The monthly recurring revenue represented by its churned customers
is adjusted to exclude paid customer accounts that churned from the customer base used
that share common corporate information with customer accounts that did not churn from
the customer base during the annual period being measured. While not material, Zendesk
believes the failure to make this adjustment could otherwise skew the monthly recurring
revenue represented by its churned customers as a result of customers that maintain
multiple paid customer accounts on Support.
Zendesk’s percentage of monthly recurring revenue from Support that is generated by
customers with 100 or more agents on Support is determined by dividing the monthly
recurring revenue from Support for paid customer accounts with more than 100 agents on
Support as of the measurement date by the monthly recurring revenue from Support for all
paid customer accounts on Support as of the measurement date. Zendesk determines the
customers with 100 or more agents on Support as of the measurement date based on the
number of activated agents on Support at the measurement date and includes adjustments
to aggregate paid customer accounts that share common corporate information.
Zendesk determines the annualized value of a contract by annualizing the monthly recurring
revenue for such contract.
Zendesk does not currently incorporate operating metrics associated with products other
than Support into its measurement of monthly recurring revenue represented by its churned
customers or the percentage of monthly recurring revenue from Support that is generated by
customers with 100 or more agents on Support.
Zendesk’s freemium plans include its legacy Starter plan for Support, its Lite plan for Chat,
and its Inbox service for facilitating and simplifying email collaboration on group email
aliases. Zendesk believes these services provide exposure to its brand and establish a
relationship that can facilitate further adoption of Support and Chat as organizations grow
in size and their service needs grow more complex. A customer account on Zendesk’s
freemium plans is considered active based on whether functionality of the service has been
utilized within the 90-day period preceding the measurement date. A single consolidated
organization or customer may have multiple freemium customer accounts across each of
Support, Chat, and Zendesk’s Inbox service. Each of these accounts is treated as a separate
customer account on Zendesk’s freemium products.
About Customer Metrics
December
31, 2015
March
31, 2016
June
30, 2016
September
30, 2016
December
31, 2016
Paid customer accounts on
Zendesk Support (approx.) 35,700 39,900 43,700 47,400 50,800
+ Paid customer accounts on
Zendesk Chat (approx.) 33,400 35,700 37,800 40,000 41,300
+ Paid customer accounts on
other Zendesk products (approx.) - 800 1,300 1,700 2,200
= Approximate number of
paid customer accounts 69,100 76,400 82,800 89,100 94,300
Source and contact: Zendesk, Inc.
Investor Contact
Marc Cabi, +1 415-852-3877
ir@zendesk.com
Media Contact
Heather Meeker, +1 415-310-9551
press@zendesk.com

Zendesk Sharehoder Letter Q4 2016 - 24
