Attached files
| file | filename |
|---|---|
| EX-99.1 - EX-99.1 - KAPSTONE PAPER & PACKAGING CORP | a17-3923_1ex99d1.htm |
| 8-K - 8-K - KAPSTONE PAPER & PACKAGING CORP | a17-3923_18k.htm |
Exhibit 99.2
2016 Fourth Quarter and Full Year Financial Review February 8, 2017 Matt Kaplan, President and Chief Executive Officer Randy Nebel, Executive Vice President of Integrated Packaging Andrea K. Tarbox, Executive Vice President and CFO
Forward-looking Statements The information in this presentation and statements made during this presentation may contain certain forward-looking statements within the meaning of federal securities laws. These statements reflect management’s expectations regarding future events and operating performance. Risk Factors These forward-looking statements involve a number of risks and uncertainties. A list of the factors that could cause actual results to differ materially from those expressed in, or underlying, any forward-looking statements can be found in the Company’s filings with the Securities and Exchange Commission, such as its annual and quarterly reports. The Company disclaims any obligation to revise or update such statements to reflect the occurrence of events after the date of this presentation. Non-GAAP Financial Measures This presentation refers to non-U.S. GAAP financial information. A reconciliation of non-U.S. GAAP to U.S. GAAP financial measures is available at the end of the press release and on the company’s website at KapStonepaper.com under Investors. Forward-Looking Statements 2
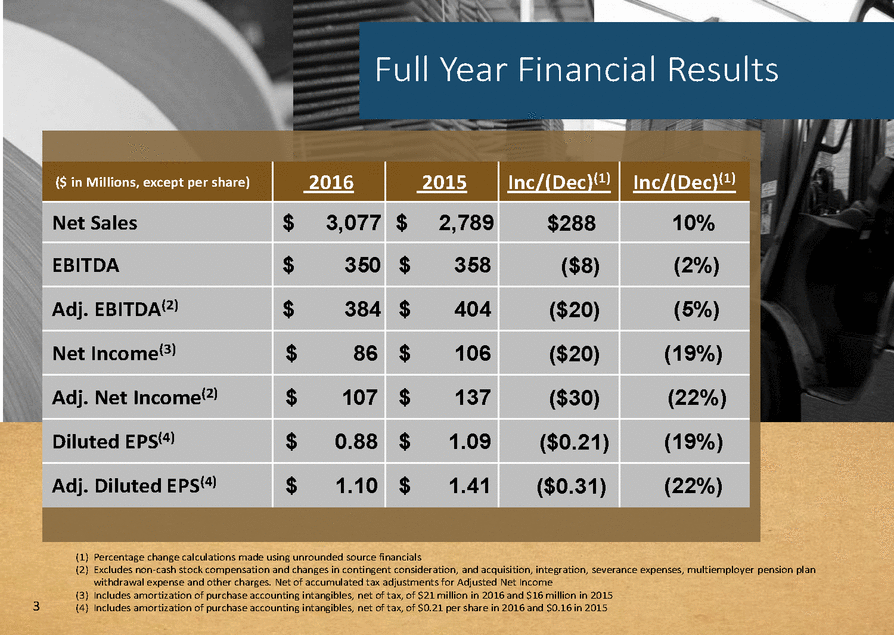
Full Year Financial Results (1) Percentage change calculations made using unrounded source financials (2) Excludes non-cash stock compensation and changes in contingent consideration, and acquisition, integration, severance expenses, multiemployer pension plan withdrawal expense and other charges. Net of accumulated tax adjustments for Adjusted Net Income (3) Includes amortization of purchase accounting intangibles, net of tax, of $21 million in 2016 and $16 million in 2015 (4) Includes amortization of purchase accounting intangibles, net of tax, of $0.21 per share in 2016 and $0.16 in 2015 3 ($ in Millions, except per share) 2016 2015 Inc/(Dec)(1) Inc/(Dec)(1) Net Sales $3,077 $2,789 $288 10% EBITDA $350 $358 ($8) (2%) Adj. EBITDA(2) $384 $404 ($20) (5%) Net Income(3) $86 $106 ($20) (19%) Adj. Net Income(2) $107 $137 ($30) (22%) Diluted EPS(4) $0.88 $1.09 ($0.21) (19%) Adj. Diluted EPS(4) $1.10 $1.41 ($0.31) (22%)
2016 Compared to 2015 $2,789 Acquisition reflects twelve months of Victory Packaging results in 2016 compared to seven months in 2015 Price/mix was unfavorably impacted by: Average mill selling prices down $44 per ton reflecting lower prices of $59 million due to lower domestic and export containerboard prices, lower prices for export kraft paper, and a less favorable product mix of $26 million due to lower specialty paper volume and higher export containerboard shipments Lower corrugated products selling prices due to a less favorable product mix and competitive pressures, $15 million Sales volume up 88,000 tons in Paper and Packaging segment, offset by lower sales in Distribution segment Other sales reflects elimination of Paper and Packaging segment sales to the Distribution segment Deflation of $5 million due to lower fiber and fuel costs, partially offset by higher OCC, salaries and wages Productivity and cost savings includes $14 million due to higher mill production, $13 million of lower costs for management incentives and $14 million of benefit curtailments, synergies related to the Victory Packaging acquisition and less market downtime, partially offset by $6 million of costs for Q4 2016 Hurricane Matthew and $6 million of lower pension income 4 $ in Millions $ in Millions Productivity Gains More than Offset by Price/Mix Declines Net Sales $367$100$71$50$3,077 Adjusted EBITDA $404$17$100$53$384 $5$5
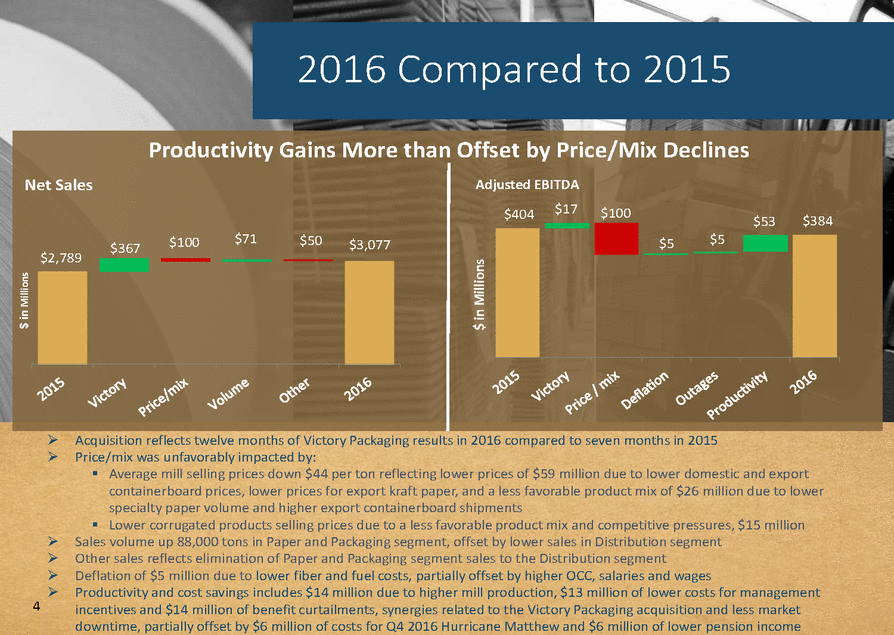
Fourth Quarter Financial Results (1) Percentage change calculations made using unrounded source financials (2) Excludes non-cash stock compensation and changes in contingent consideration, and acquisition, integration, severance expenses, multiemployer pension plan withdrawal expense and other charges. Net of accumulated tax adjustments for Adjusted Net Income (3) Includes amortization of purchase accounting intangibles net of tax of $5 million in Q4 2016 , $6 million in Q4 2015, and $5 million in Q3 2016 (4) Includes amortization of purchase accounting intangibles net of tax of $0.05 per share in Q4 2016, $0.06 in Q4 2015, and $0.05 in Q3 2016 5 ($ in Millions, except per share) Q4 2016 Q4 2015 Inc/(Dec)(1) Q3 2016 Inc/(Dec)(1) Net Sales $777 $764 2% $777 --% EBITDA $84 $75 12% $99 (15%) Adj. EBITDA(2) $92 $82 13% $108 (15%) Net Income(3) $18 $12 55% $31 (41%) Adj. Net Income(2) $23 $16 43% $37 (37%) Diluted EPS(4) $0.19 $0.12 58% $0.32 (41%) Adj. Diluted EPS(4) $0.24 $0.17 41% $0.37 (35%)
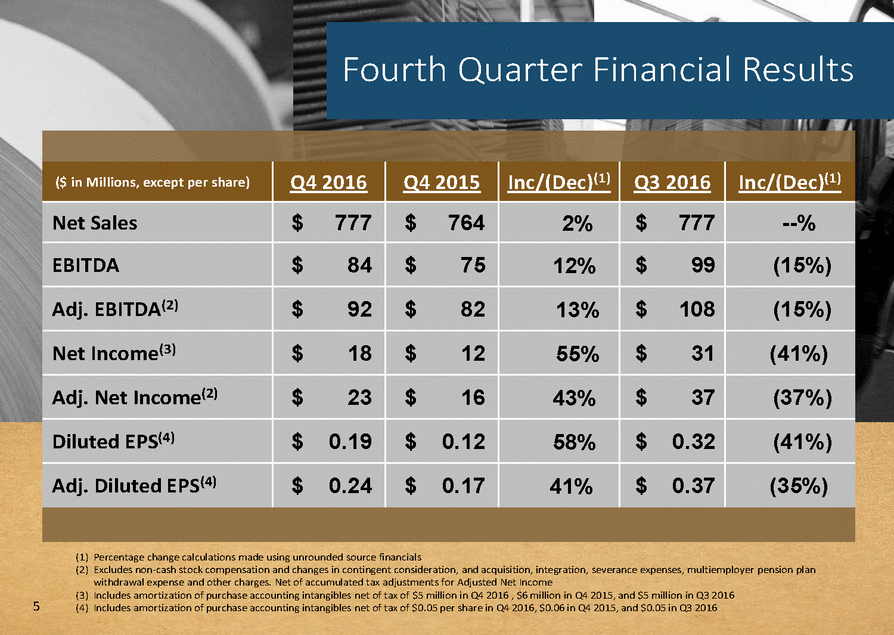
Q4 2016 Compared to Q4 2015 $82 $19 $6 $7 Price/mix was unfavorably impacted by: Lower average mill selling prices, down $29 per ton reflecting: o Lower prices of $11 million due to Q1 2016 index driven lower domestic containerboard prices and lower prices for export containerboard and domestic and export kraft paper, partially offset by the October 2016 containerboard price increase o Less favorable product mix of $4 million reflecting lower Durasorb shipments Lower corrugated products selling prices due to a less favorable mix and competitive pressures, $4 million Sales volume up 66,000 tons in Paper and Packaging segment, offset by $5 million of lower sales in Distribution segment Productivity and cost savings include 29,000 tons of higher mill production, lower costs for management incentives and benefit curtailments and less market downtime 6 $ in Millions $ in Millions Productivity and Lower Outage Costs offset by Price Leads to Earnings Gain Net Sales $764$19$32$777 Adjusted EBITDA $18$92 $10
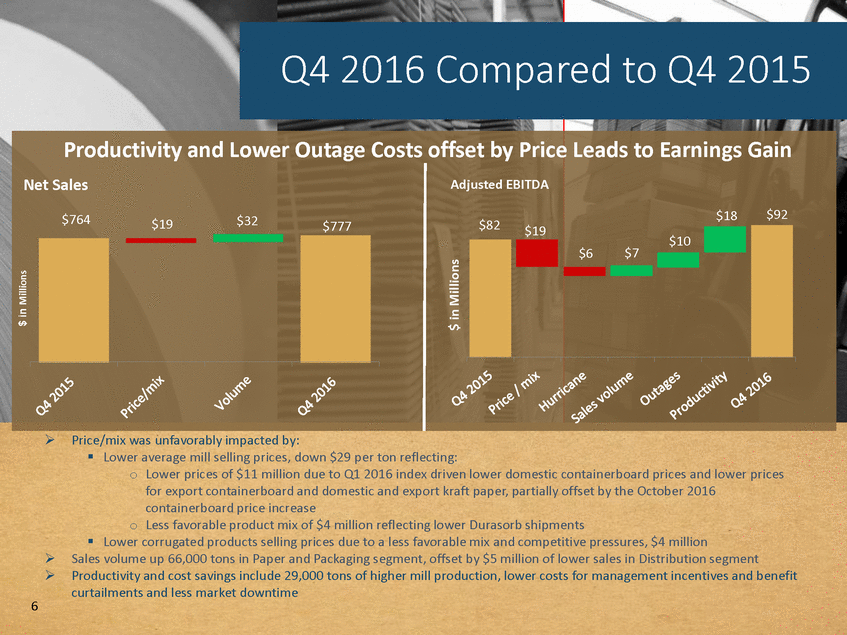
Strong Cash Flows In 2016, operating cash flow increased $20 million YOY primarily due to a reduction in inventories and timing of tax payments Company invested $27 million for new integration opportunities 2016 CAPEX of $127 million included approximately $40 million for strategic, value-adding projects Net debt at December 31, 2016 - $1,474 million In 2016, $65 million voluntary prepayment No mandatory principal payments due until Q1 2019 Debt to EBITDA leverage ratio (per credit agreement) 3.82 times – December 31, 2016 3.98 times – September 30, 2016 3.60 times – December 31, 2015 No pension plan funding required in 2016 7 Operating Cash Flows Trend $282 $262 20162015
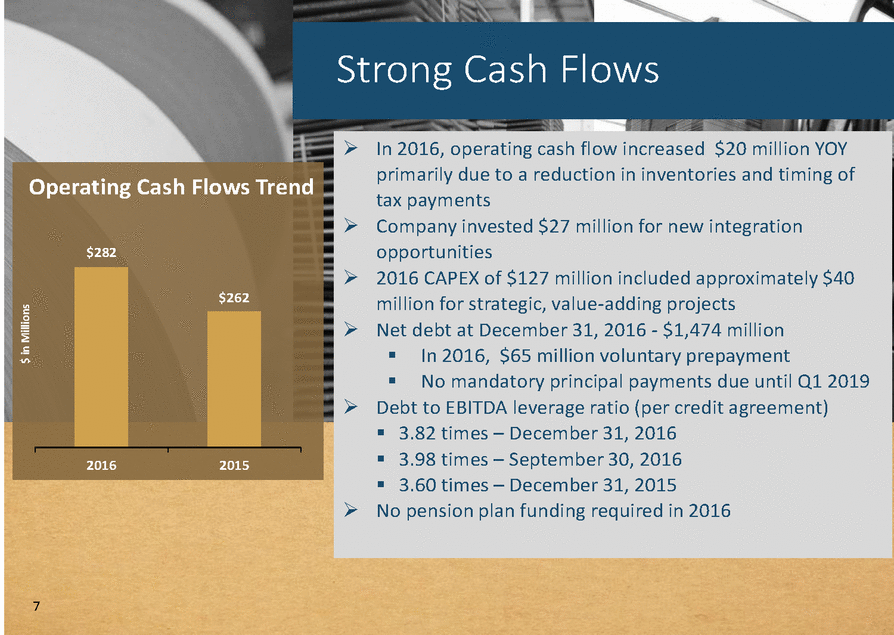
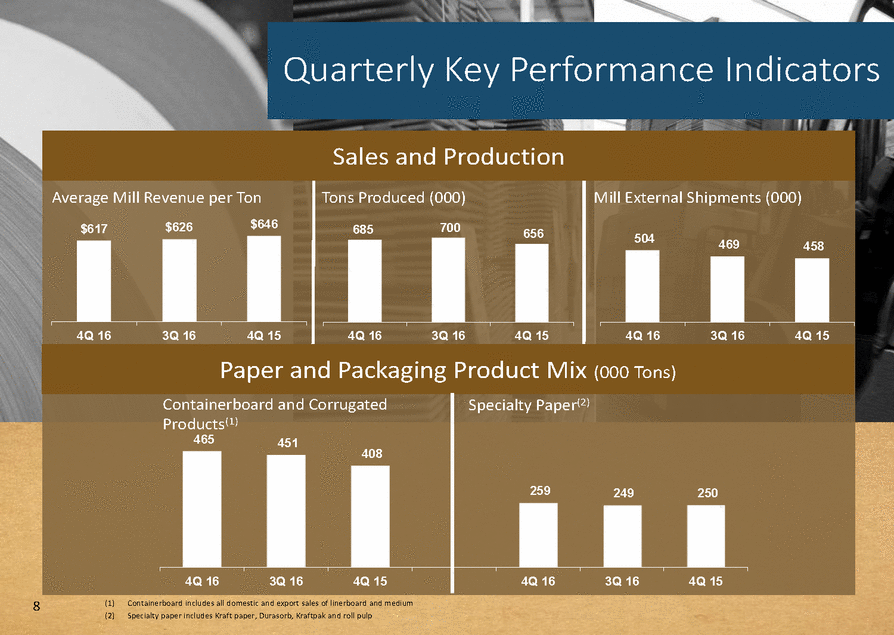
Quarterly Key Performance Indicators 8 (1)Containerboard includes all domestic and export sales of linerboard and medium (2)Specialty paper includes Kraft paper, Durasorb, Kraftpak and roll pulp Sales and Production Average Mill Revenue per Ton $617$626$646 4Q 163Q 164Q 15 Tons Produced (000) 685700 4Q 163Q 164Q 15 Mill External Shipments (000) 504469 4Q 163Q 164Q 15 Paper and Packaging Product Mix (000 Tons) Containerboard and Corrugated Products(1) 465451 Specialty Paper(2) 259249250 4Q 163Q 164Q 15 4Q 163Q 164Q 15
Operations Highlights Distribution Segment 9 erformance has been consistent with expectations for profitability, cash flow and integration et sales of $236 million for Q4 2016 were $5 million lower than prior year ower selling prices due to the pass through of the January 2016 containerboard price reduction ower sales volume, down about 1 percent, but expect 2017 growth to resume djusted EBITDA of $16 million for Q4 2016 was $2 million higher than prior year 4 million benefit from lower corrugated products costs artially offset by lower prices and volume xpect future opportunities to internalize Victory outside purchases

Integration Strategies 10 On February 1, 2017 we announced the acquisition of Associated Packaging Incorporated (API) Produces approximately 10,000 tons per year of corrugated boxes Strong management team will stay on with KapStone Strategically based in Greer, South Carolina near the Cowpens mill Well-equipped sheet plant Significant growth opportunities Lucrative fulfillment business Expect to increase throughput with Victory and strategic account relationships Increases KapStone’s integration by 17 thousand tons within 18 months
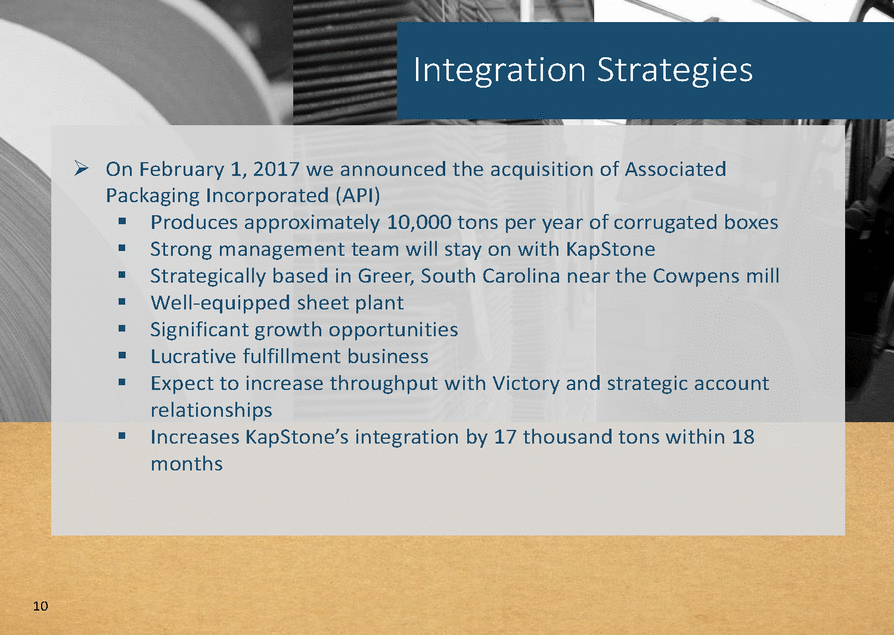
Integration Strategy 17 Previous 2016 initiatives announced should provide approximately 85,000 tons of additional integration by mid 2018 Our previously stated goal of integrating an additional 100,000 to 150,000 tons on an annualized basis by mid 2018 will be achieved with these initiatives 11 Annual Volume - Tons Integration from Recent Strategic Investments 115 60 48325 85 2019 Outlook Over 2013 Base Pre 2016
Market Update 12 Strong operating rates Inventories have declined significantly Improved box demand Rising OCC prices Record export shipments
Appendix 13
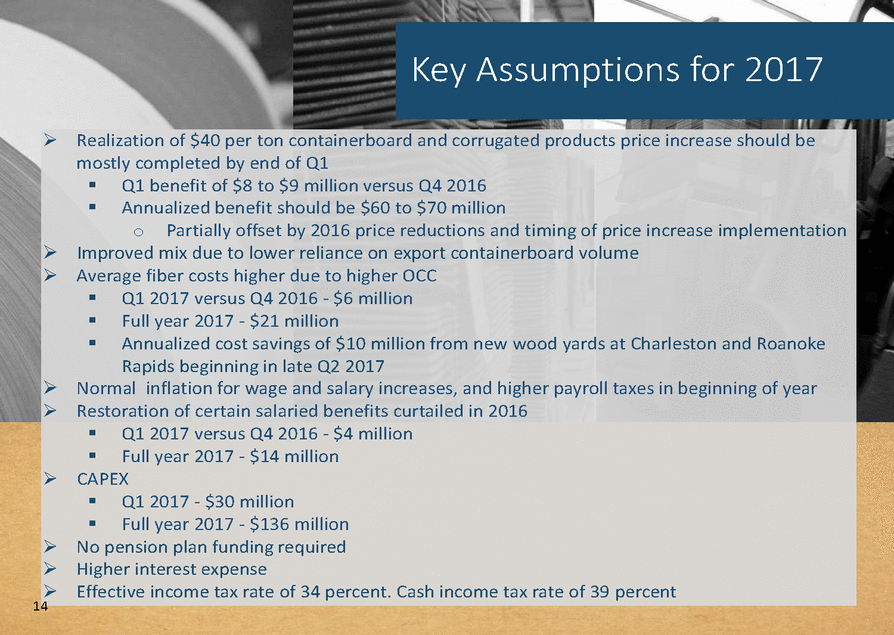
Key Assumptions for 2017 14 Realization of $40 per ton containerboard and corrugated products price increase should be mostly completed by end of Q1 Q1 benefit of $8 to $9 million versus Q4 2016 Annualized benefit should be $60 to $70 million oPartially offset by 2016 price reductions and timing of price increase implementation Improved mix due to lower reliance on export containerboard volume Average fiber costs higher due to higher OCC Q1 2017 versus Q4 2016 - $6 million Full year 2017 - $21 million Annualized cost savings of $10 million from new wood yards at Charleston and Roanoke Rapids beginning in late Q2 2017 Normal inflation for wage and salary increases, and higher payroll taxes in beginning of year Restoration of certain salaried benefits curtailed in 2016 Q1 2017 versus Q4 2016 - $4 million Full year 2017 - $14 million CAPEX Q1 2017 - $30 million Full year 2017 - $136 million No pension plan funding required Higher interest expense Effective income tax rate of 34 percent. Cash income tax rate of 39 percent
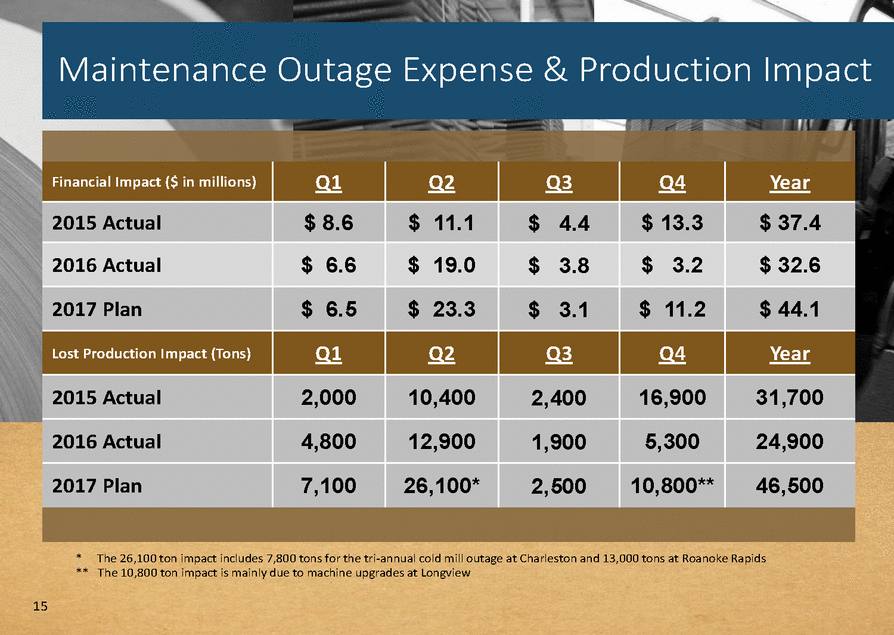
Maintenance Outage Expense & Production Impact *The 26,100 ton impact includes 7,800 tons for the tri-annual cold mill outage at Charleston and 13,000 tons at Roanoke Rapids ** The 10,800 ton impact is mainly due to machine upgrades at Longview 15 Financial Impact ($ in millions) Q1 Q2 Q3 Q4 Year 2015 Actual $ 8.6 $11.1 $4.4 $ 13.3 $ 37.4 2016 Actual $6.6 $19.0 $3.8 $3.2 $ 32.6 2017 Plan $6.5 $23.3 $3.1 $11.2 $ 44.1 Lost Production Impact (Tons) Q1 Q2 Q3 Q4 Year 2015 Actual 2,000 10,400 2,400 16,900 31,700 2016 Actual 4,800 12,900 1,900 5,300 24,900 2017 Plan 7,100 26,100* 2,500 10,800** 46,500
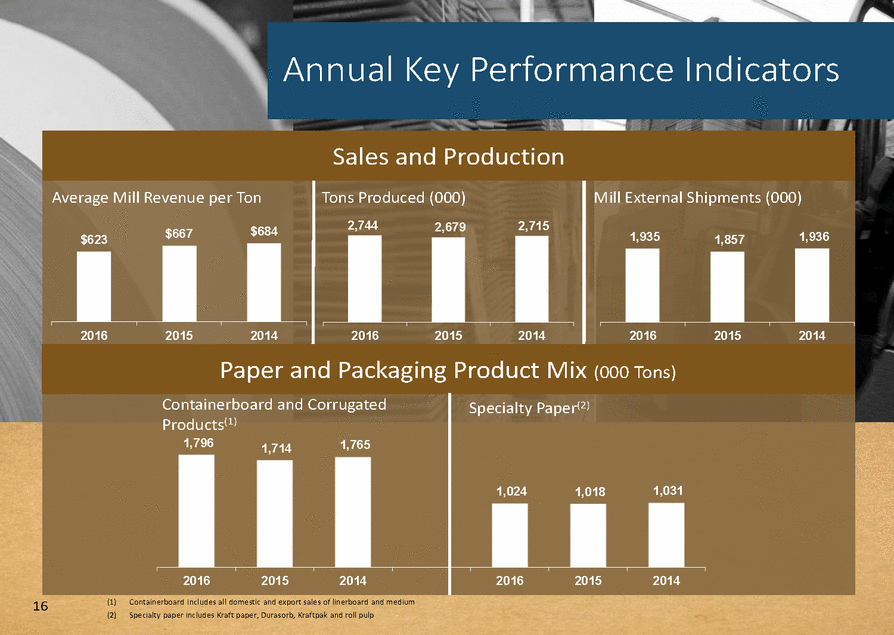
Annual Key Performance Indicators 1,857 (1)Containerboard includes all domestic and export sales of linerboard and medium (2)Specialty paper includes Kraft paper, Durasorb, Kraftpak and roll pulp 16 Sales and Production Average Mill Revenue per Ton $667$684 201620152014 Tons Produced (000) 2,7442,6792,715 201620152014 Mill External Shipments (000) 1,9351,936 201620152014 Paper and Packaging Product Mix (000 Tons) Containerboard and Corrugated Products(1) 1,7961,7141,765 Specialty Paper(2) 1,0241,0181,031 201620152014 201620152014
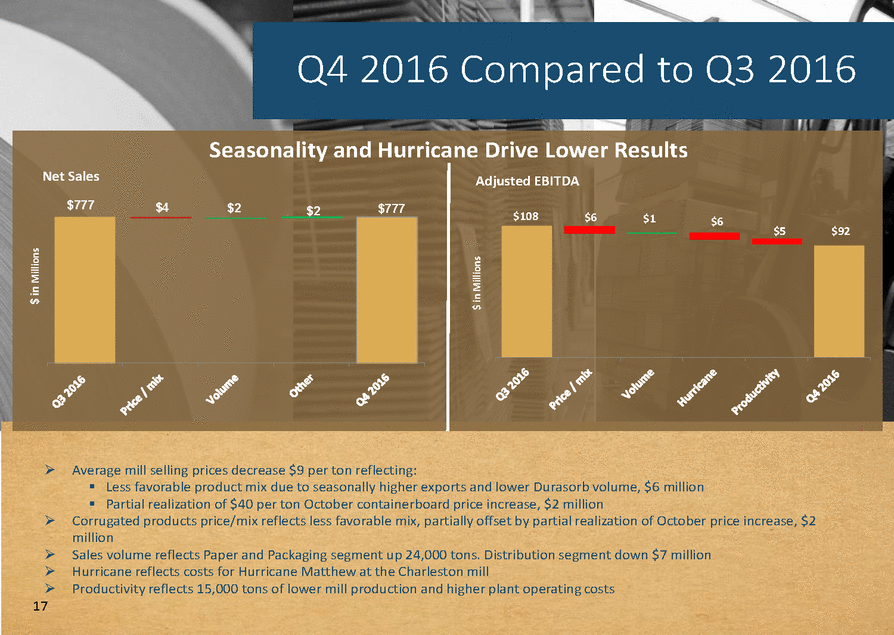
Q4 2016 Compared to Q3 2016 $5 $92 Average mill selling prices decrease $9 per ton reflecting: Less favorable product mix due to seasonally higher exports and lower Durasorb volume, $6 million Partial realization of $40 per ton October containerboard price increase, $2 million Corrugated products price/mix reflects less favorable mix, partially offset by partial realization of October price increase, $2 million Sales volume reflects Paper and Packaging segment up 24,000 tons. Distribution segment down $7 million Hurricane reflects costs for Hurricane Matthew at the Charleston mill Productivity reflects 15,000 tons of lower mill production and higher plant operating costs 17 $ in Millions $ in Millions Seasonality and Hurricane Drive Lower Results Net Sales $777$4$2$2$777 Adjusted EBITDA $108$6$1$6
