Attached files
| file | filename |
|---|---|
| EX-99.1 - EX-99.1 - Regional Management Corp. | d326544dex991.htm |
| 8-K - FORM 8-K - Regional Management Corp. | d326544d8k.htm |

4Q 2016 Earnings Call Presentation February 7, 2017 Exhibit 99.2
Safe Harbor Statement This presentation and the responses to various questions contain forward-looking statements, which reflect our current views with respect to, among other things, the Company’s operations and financial performance. You can identify these forward-looking statements by the use of words such as “outlook,” “believes,” “expects,” “potential,” “continues,” “may,” “will,” “should,” “seeks,” “approximately,” “predicts,” “intends,” “plans,” “estimates,” “anticipates” or the negative version of these words or other comparable words. Such forward-looking statements are subject to various risks and uncertainties. Accordingly, there are or will be important factors that could cause actual outcomes or results to differ materially from those indicated in these statements. These factors include but are not limited to those described under “Risk Factors” in the Company’s Annual Report on Form 10-K and Quarterly Reports on Form 10-Q. We cannot guarantee future events, results, actions, levels of activity, performance or achievements. Neither the Company nor any of its respective agents, employees or advisors undertake any duty or obligation to supplement, amend, update or revise any forward-looking statement, whether as a result of new information or otherwise. This presentation also contains certain non-GAAP measures. Because they adjust for certain non-operating and non-cash items, the Company believes that non-GAAP measures are useful to investors as supplemental financial measures that, when viewed with the Company’s GAAP financial information, provide information regarding trends in the Company’s results of operations and credit metrics, which is intended to help investors meaningfully evaluate and compare the Company’s results of operations and credit metrics between periods. Please refer to the Appendix accompanying this presentation for a reconciliation of non-GAAP measures to the most comparable GAAP measure. The information and opinions contained in this document are provided as of the date of this presentation and are subject to change without notice. This document has not been approved by any regulatory or supervisory authority.
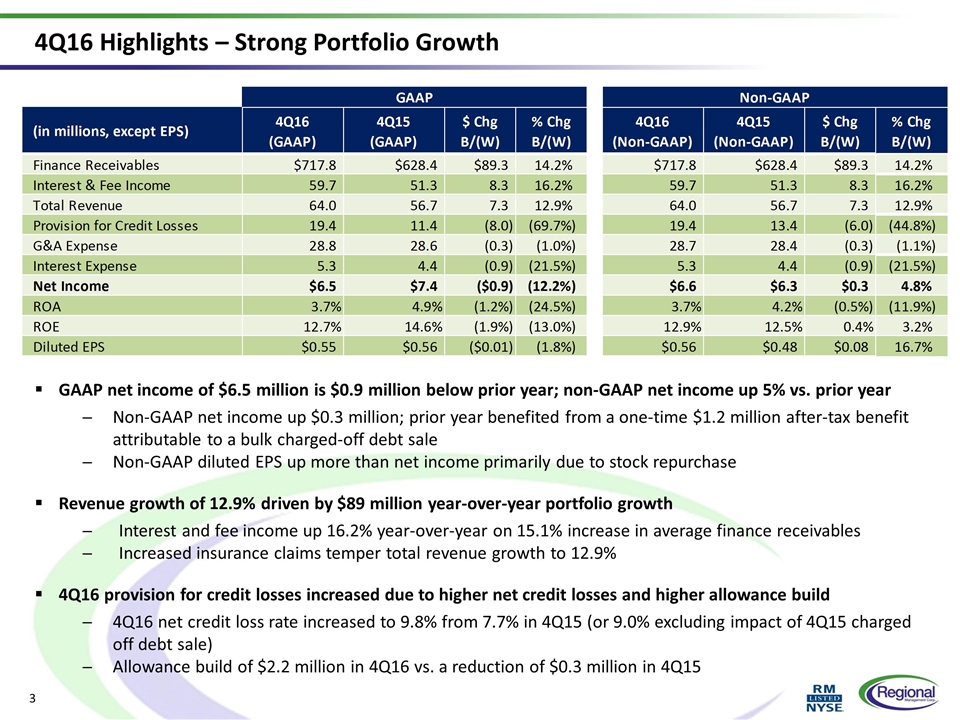
4Q16 Highlights – Strong Portfolio Growth GAAP net income of $6.5 million is $0.9 million below prior year; non-GAAP net income up 5% vs. prior year Non-GAAP net income up $0.3 million; prior year benefited from a one-time $1.2 million after-tax benefit attributable to a bulk charged-off debt sale Non-GAAP diluted EPS up more than net income primarily due to stock repurchase Revenue growth of 12.9% driven by $89 million year-over-year portfolio growth Interest and fee income up 16.2% year-over-year on 15.1% increase in average finance receivables Increased insurance claims temper total revenue growth to 12.9% 4Q16 provision for credit losses increased due to higher net credit losses and higher allowance build 4Q16 net credit loss rate increased to 9.8% from 7.7% in 4Q15 (or 9.0% excluding impact of 4Q15 charged off debt sale) Allowance build of $2.2 million in 4Q16 vs. a reduction of $0.3 million in 4Q15
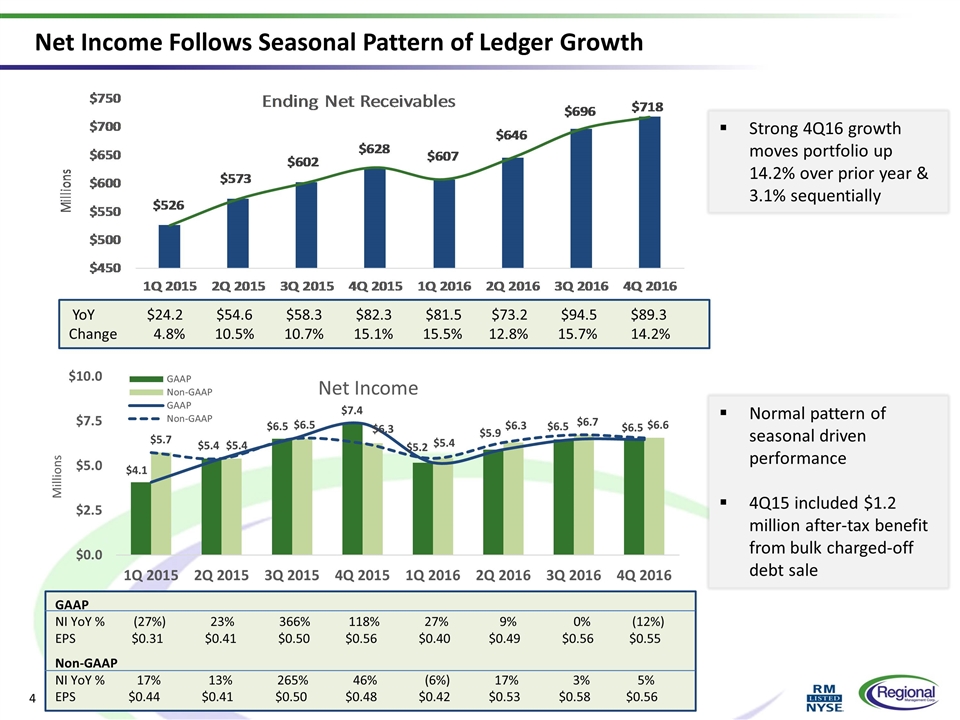
Net Income Follows Seasonal Pattern of Ledger Growth YoY $24.2 $54.6 $58.3 $82.3 $81.5 $73.2 $94.5 $89.3 Change 4.8% 10.5% 10.7% 15.1% 15.5% 12.8% 15.7% 14.2% Normal pattern of seasonal driven performance 4Q15 included $1.2 million after-tax benefit from bulk charged-off debt sale Strong 4Q16 growth moves portfolio up 14.2% over prior year & 3.1% sequentially GAAP NI YoY % (27%) 23% 366% 118% 27% 9% 0% (12%) EPS $0.31 $0.41 $0.50 $0.56 $0.40 $0.49 $0.56 $0.55 Non-GAAP NI YoY % 17% 13% 265% 46% (6%) 17% 3% 5% EPS $0.44 $0.41 $0.50 $0.48 $0.42 $0.53 $0.58 $0.56
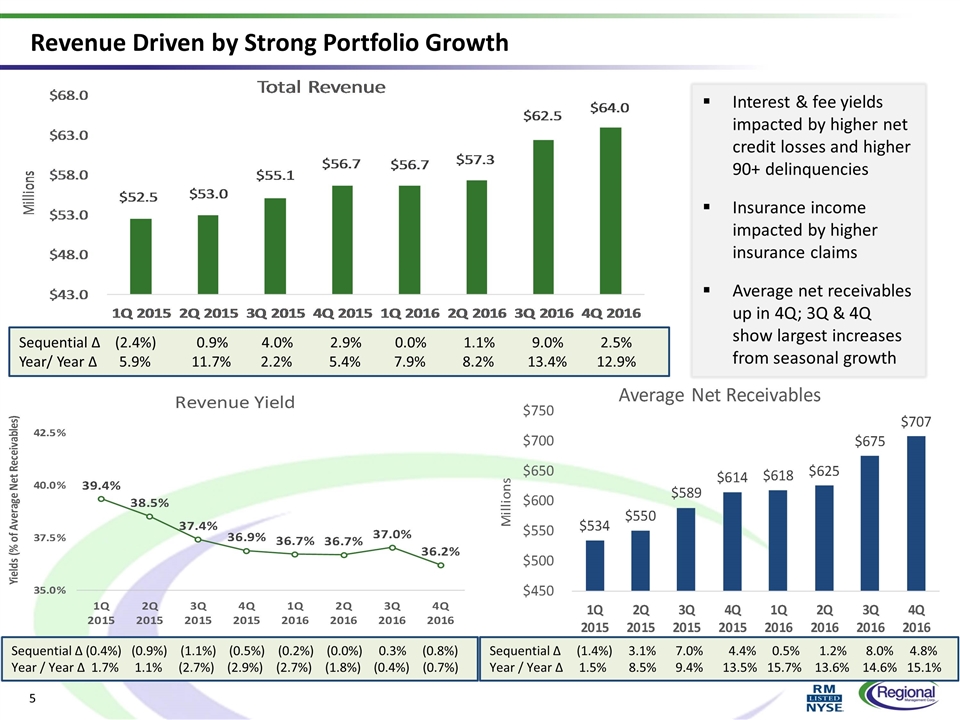
Revenue Driven by Strong Portfolio Growth Interest & fee yields impacted by higher net credit losses and higher 90+ delinquencies Insurance income impacted by higher insurance claims Average net receivables up in 4Q; 3Q & 4Q show largest increases from seasonal growth Sequential Δ (0.4%) (0.9%) (1.1%) (0.5%) (0.2%) (0.0%) 0.3% (0.8%) Year / Year Δ 1.7% 1.1% (2.7%) (2.9%) (2.7%) (1.8%) (0.4%) (0.7%) Sequential Δ (1.4%) 3.1% 7.0% 4.4% 0.5% 1.2% 8.0% 4.8% Year / Year Δ 1.5% 8.5% 9.4% 13.5% 15.7% 13.6% 14.6% 15.1% Sequential Δ (2.4%) 0.9% 4.0% 2.9% 0.0% 1.1% 9.0% 2.5% Year/ Year Δ 5.9% 11.7% 2.2% 5.4% 7.9% 8.2% 13.4% 12.9%
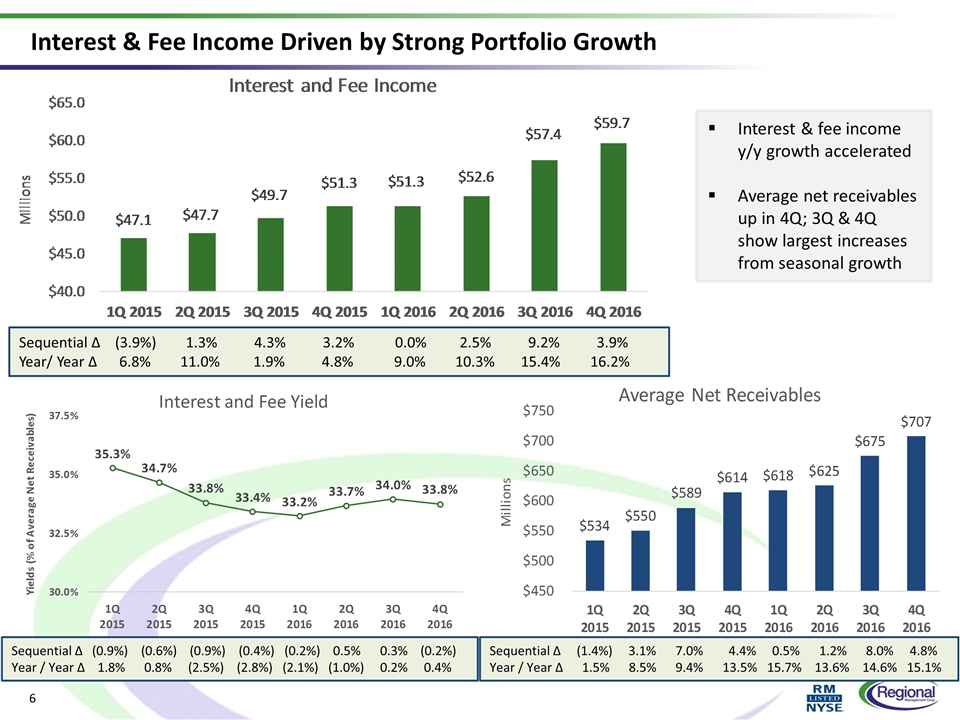
Interest & Fee Income Driven by Strong Portfolio Growth Interest & fee income y/y growth accelerated Average net receivables up in 4Q; 3Q & 4Q show largest increases from seasonal growth Sequential Δ (0.9%) (0.6%) (0.9%) (0.4%) (0.2%) 0.5% 0.3% (0.2%) Year / Year Δ 1.8% 0.8% (2.5%) (2.8%) (2.1%) (1.0%) 0.2% 0.4% Sequential Δ (1.4%) 3.1% 7.0% 4.4% 0.5% 1.2% 8.0% 4.8% Year / Year Δ 1.5% 8.5% 9.4% 13.5% 15.7% 13.6% 14.6% 15.1% Sequential Δ (3.9%) 1.3% 4.3% 3.2% 0.0% 2.5% 9.2% 3.9% Year/ Year Δ 6.8% 11.0% 1.9% 4.8% 9.0% 10.3% 15.4% 16.2%
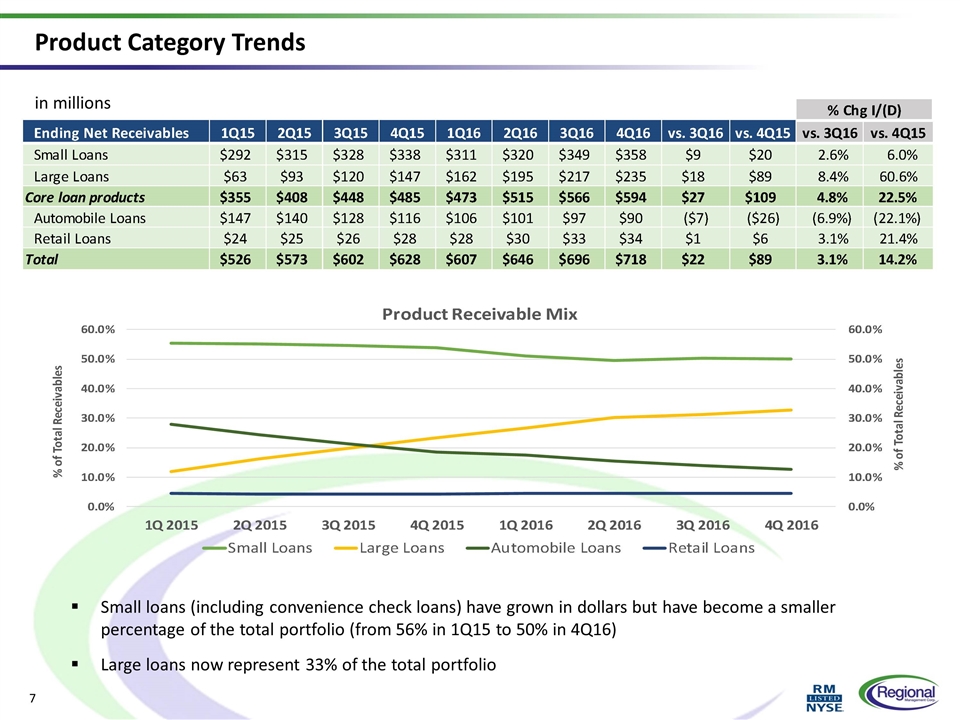
in millions Product Category Trends Small loans (including convenience check loans) have grown in dollars but have become a smaller percentage of the total portfolio (from 56% in 1Q15 to 50% in 4Q16) Large loans now represent 33% of the total portfolio
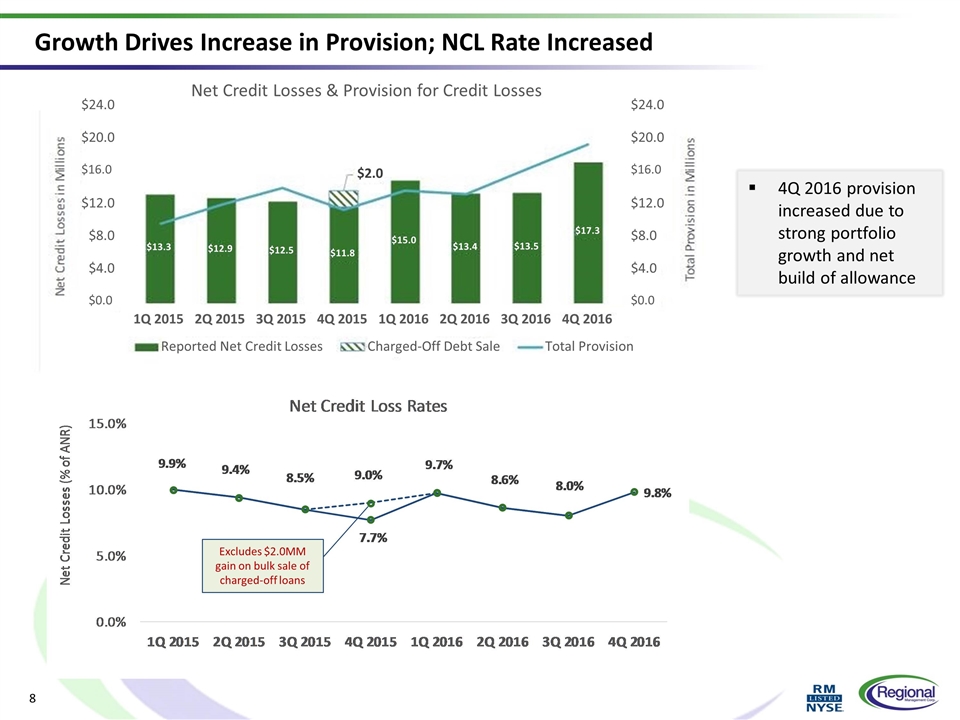
Growth Drives Increase in Provision; NCL Rate Increased Excludes $2.0MM gain on bulk sale of charged-off loans 4Q 2016 provision increased due to strong portfolio growth and net build of allowance $13.3 $12.9 $12.5 $11.8 $15.0 $13.4 $13.5 $17.3 $2.0 $0.0 $4.0 $8.0 $12.0 $16.0 $20.0 $24.0 $0.0 $4.0 $8.0 $12.0 $16.0 $20.0 $24.0 1Q 2015 2Q 2015 3Q 2015 4Q 2015 1Q 2016 2Q 2016 3Q 2016 4Q 2016 Net Credit Losses & Provision for Credit Losses Reported Net Credit Losses Charged-Off Debt Sale Total Provision
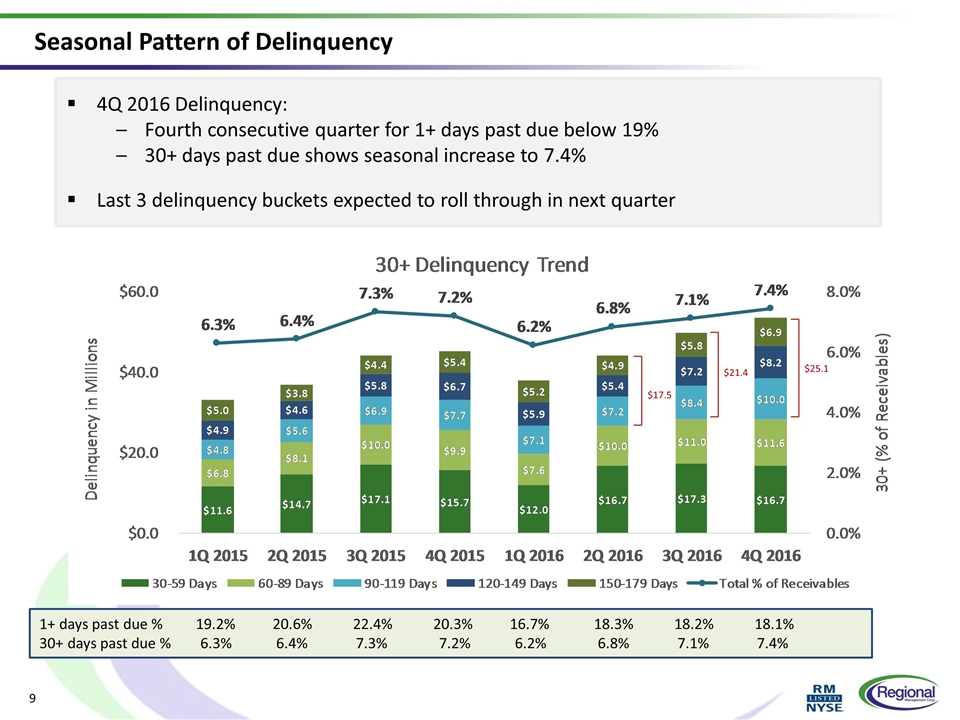
4Q 2016 Delinquency: Fourth consecutive quarter for 1+ days past due below 19% 30+ days past due shows seasonal increase to 7.4% Last 3 delinquency buckets expected to roll through in next quarter Seasonal Pattern of Delinquency 1+ days past due % 19.2% 20.6% 22.4% 20.3% 16.7% 18.3% 18.2% 18.1% 30+ days past due % 6.3% 6.4% 7.3% 7.2% 6.2% 6.8% 7.1% 7.4% $21.4 $25.1 $17.5
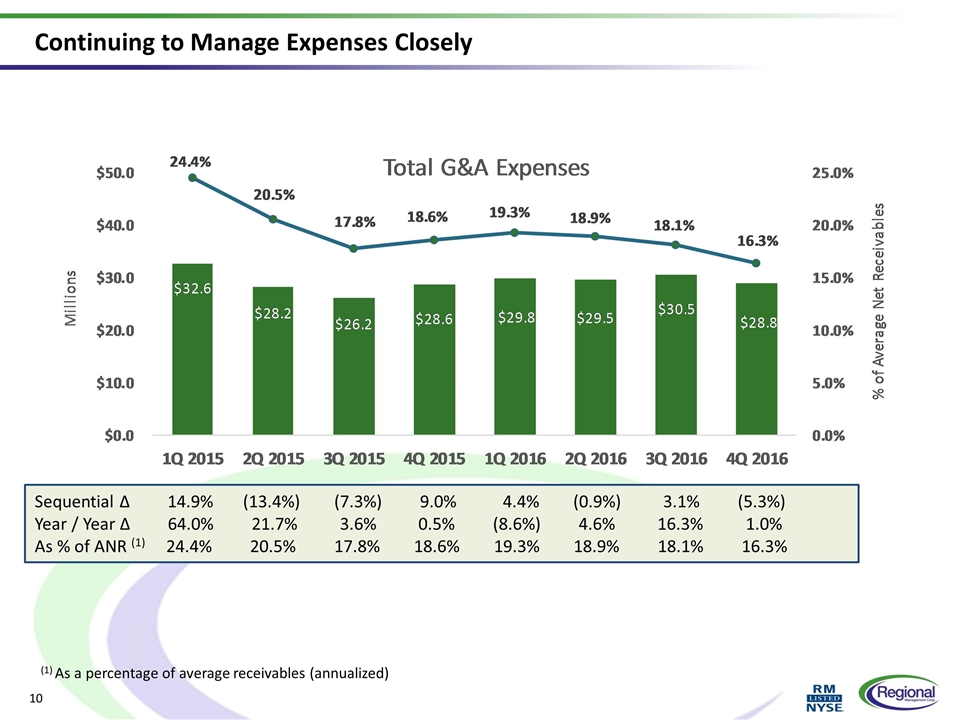
Continuing to Manage Expenses Closely Sequential Δ 14.9% (13.4%) (7.3%) 9.0% 4.4% (0.9%) 3.1% (5.3%) Year / Year Δ 64.0% 21.7% 3.6% 0.5% (8.6%) 4.6% 16.3% 1.0% As % of ANR (1) 24.4% 20.5% 17.8% 18.6% 19.3% 18.9% 18.1% 16.3% (1) As a percentage of average receivables (annualized)
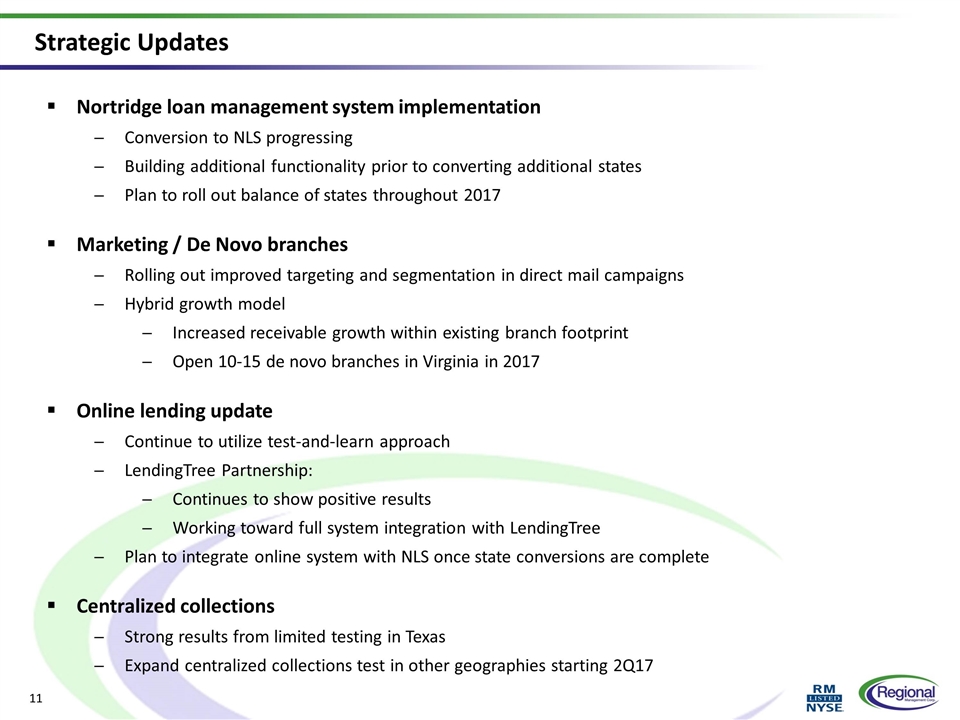
Strategic Updates Nortridge loan management system implementation Conversion to NLS progressing Building additional functionality prior to converting additional states Plan to roll out balance of states throughout 2017 Marketing / De Novo branches Rolling out improved targeting and segmentation in direct mail campaigns Hybrid growth model Increased receivable growth within existing branch footprint Open 10-15 de novo branches in Virginia in 2017 Online lending update Continue to utilize test-and-learn approach LendingTree Partnership: Continues to show positive results Working toward full system integration with LendingTree Plan to integrate online system with NLS once state conversions are complete Centralized collections Strong results from limited testing in Texas Expand centralized collections test in other geographies starting 2Q17
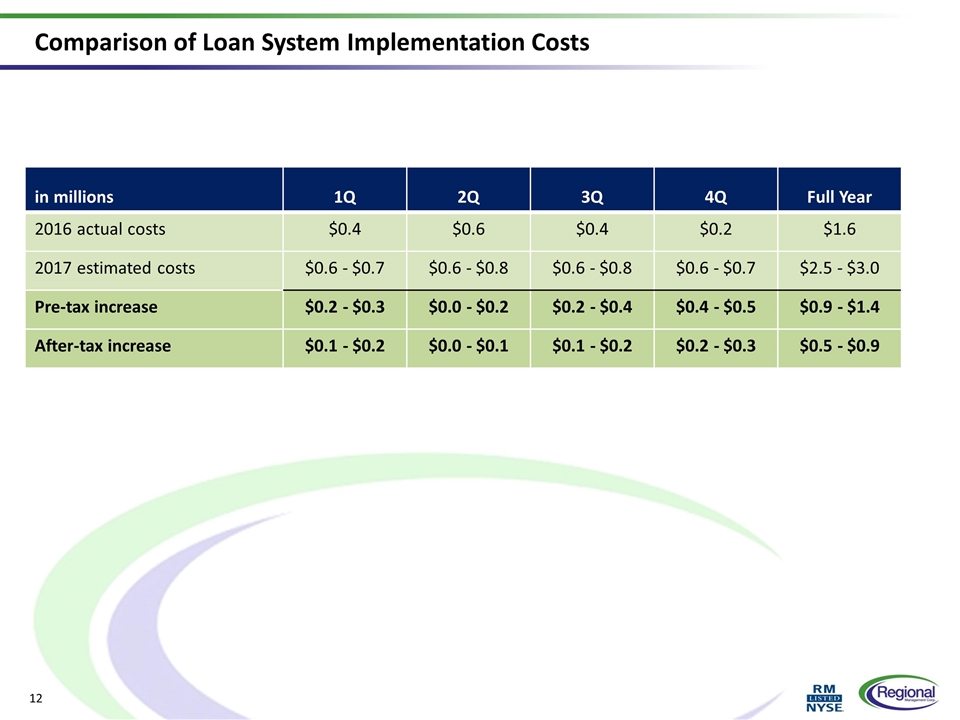
Comparison of Loan System Implementation Costs in millions 1Q 2Q 3Q 4Q Full Year 2016 actual costs $0.4 $0.6 $0.4 $0.2 $1.6 2017 estimated costs $0.6 - $0.7 $0.6 - $0.8 $0.6 - $0.8 $0.6 - $0.7 $2.5 - $3.0 Pre-tax increase $0.2 - $0.3 $0.0 - $0.2 $0.2 - $0.4 $0.4 - $0.5 $0.9 - $1.4 After-tax increase $0.1 - $0.2 $0.0 - $0.1 $0.1 - $0.2 $0.2 - $0.3 $0.5 - $0.9

Appendix
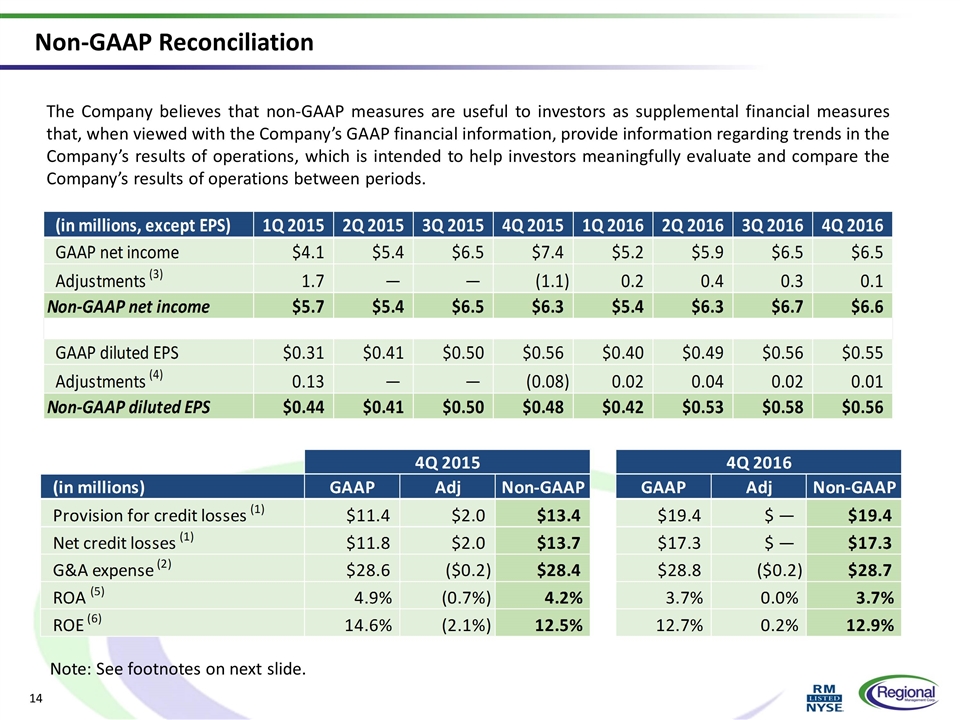
Non-GAAP Reconciliation The Company believes that non-GAAP measures are useful to investors as supplemental financial measures that, when viewed with the Company’s GAAP financial information, provide information regarding trends in the Company’s results of operations, which is intended to help investors meaningfully evaluate and compare the Company’s results of operations between periods. Note: See footnotes on next slide. (in millions, except EPS) 1Q 2015 2Q 2015 3Q 2015 4Q 2015 1Q 2016 2Q 2016 3Q 2016 4Q 2016 GAAP net income $4.0830000000000002 $5.4080000000000004 $6.5069999999999997 $7.367 $5.1760000000000002 $5.9119999999999999 $6.476 $6.4669999999999996 Adjustments (3) 1.657 — — -1.1060000000000001 0.24199999999999999 0.39200000000000002 0.254 9.4E-2 Non-GAAP net income $5.74 $5.41 $6.5069999999999997 $6.2610000000000001 $5.4180000000000001 $6.3040000000000003 $6.73 $6.5609999999999999 GAAP diluted EPS $0.31 $0.41 $0.5 $0.56000000000000005 $0.4 $0.49 $0.56000000000000005 $0.55000000000000004 Adjustments (4) 0.13 — — -8.0000000000000071E-2 1.9999999999999962E-2 4.0000000000000036E-2 1.9999999999999907E-2 1.0000000000000009E-2 Non-GAAP diluted EPS $0.44 $0.41 $0.5 $0.48 $0.42 $0.53 $0.57999999999999996 $0.56000000000000005 4Q 2015 4Q 2016 (in millions) GAAP Adj Non-GAAP GAAP Adj Non-GAAP Provision for credit losses (1) $11.449 $1.964 $13.413 $19.427 $ — $19.427 Net credit losses (1) $11.782999999999999 $1.964 $13.747 $17.277000000000001 $ — $17.277000000000001 G&A expense (2) $28.55 $-0.18 $28.37 $28.826000000000001 $-0.153 $28.673000000000002 ROA (5) 4.888212090147% -0.7% 4.154349924855% 3.691584050325% 0.000000000000% 3.745242454644% ROE (6) 0.14649545370936551 -2.0999999999999991 0.12450224456011096 0.12691403816056088 .2% 0.12875877599682078
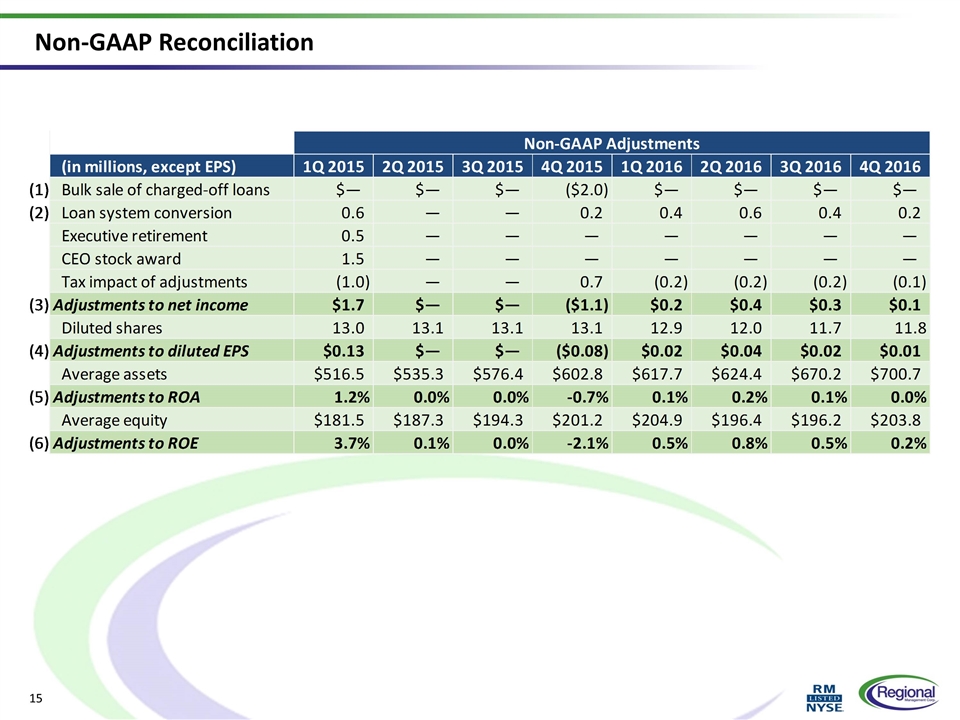
Non-GAAP Reconciliation Non-GAAP Adjustments (in millions, except EPS) 1Q 2015 2Q 2015 3Q 2015 4Q 2015 1Q 2016 2Q 2016 3Q 2016 4Q 2016 (1) Bulk sale of charged-off loans $— $— $— $-1.964 $— $— $— $— (2) Loan system conversion 0.60899999999999999 — — 0.18 0.39200000000000002 0.63600000000000001 0.41199999999999998 0.153 Executive retirement 0.53300000000000003 — — — — — — — CEO stock award 1.53 — — — — — — — Tax impact of adjustments -1.0149999999999999 — — 0.67800000000000005 -0.15 -0.24399999999999999 -0.158 -5.8999999999999997E-2 (3) Adjustments to net income $1.6569999999999998 $— $— $-1.1059999999999999 $0.24200000000000002 $0.39200000000000002 $0.254 $9.4E-2 Diluted shares 13.000999999999999 13.077999999999999 13.111000000000001 13.105 12.949 11.974 11.664 11.763 (4) Adjustments to diluted EPS $0.13 $— $— $-8.0000000000000071E-2 $1.9999999999999962E-2 $4.0000000000000036E-2 $1.9999999999999907E-2 $1.0000000000000009E-2 Average assets $516.49599999999998 $535.29499999999996 $576.36199999999997 $602.83799999999997 $617.71299999999997 $624.35699999999997 $670.19299999999998 $700.72900000000004 (5) Adjustments to ROA 1.2% 14945030310395402.1% 0.0% -0.7% 1.1% 2.2% 1.1% 0.0% Average equity $181.464 $187.32300000000001 $194.32 $201.15299999999999 $204.904 $196.36500000000001 $196.215 $203.82300000000001 (6) Adjustments to ROE 3.7% 1.1% 0.0% -2.1% .5% .8% .5% .2%
