Attached files
| file | filename |
|---|---|
| EX-31 - CERTIFICATIONS UNDER SECTION 302 OF THE SARBANES-OXELY ACT OF 2002 - FASTENAL CO | fast1231201610-kexhibit31.htm |
| 10-K - 10-K - FASTENAL CO | fast1231201610-k.htm |
| EX-32 - CERTIFICATIONS UNDER SECTION 906 OF THE SARBANES-OXLEY ACT OF 2002 - FASTENAL CO | fast1231201610-kexhibit32.htm |
| EX-23 - CONSENT OF INDEPENDENT REGISTERED PUBLIC ACCOUNTING FIRM - FASTENAL CO | fast1231201610-kexhibit23.htm |
| EX-21 - LIST OF SUBSIDIARIES - FASTENAL CO | fast1231201610-kexhibit21.htm |
2016
Annual
Report
2016
ANNUAL
REPO
RT
2016 ANNUAL REPORT
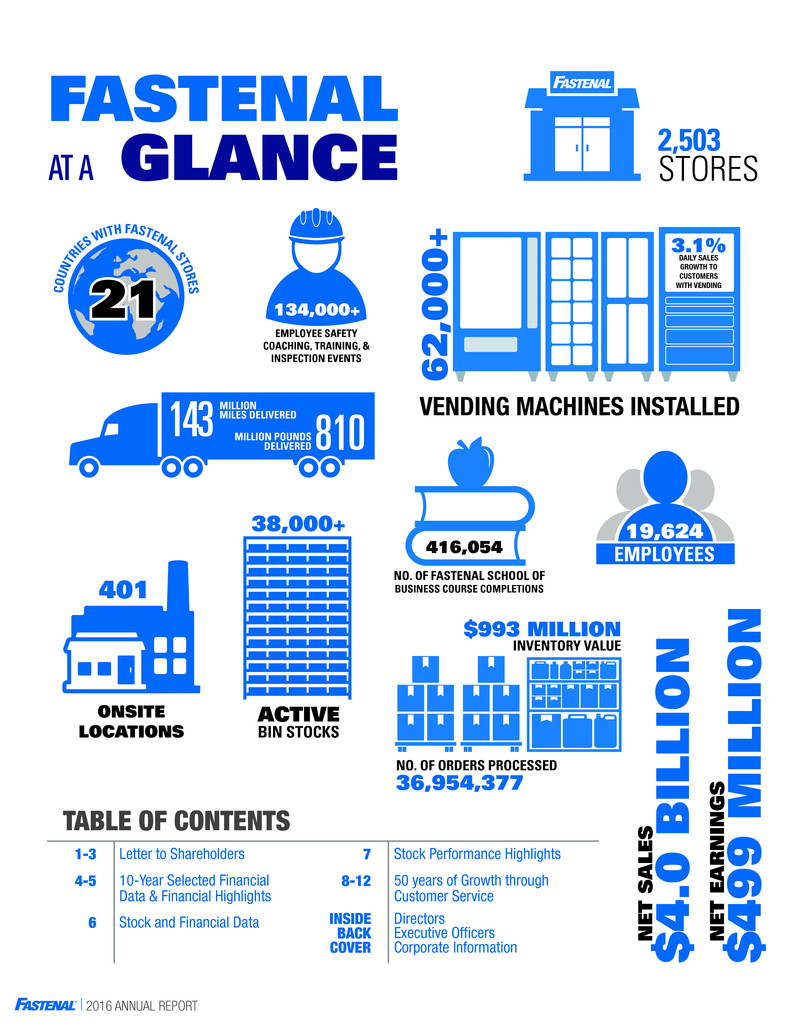
$4.0 BILLIO
N
NET SALE
S
NET EARNING
S
$499 MILLIO
N
TABLE OF CONTENTS
1-3 Letter to Shareholders
4-5 10-Year Selected Financial
Data & Financial Highlights
6 Stock and Financial Data
NO. OF FASTENAL SCHOOL OF
BUSINESS COURSE COMPLETIONS
416,054
STORES
2,503
INVENTORY VALUE
$993 MILLION
NO. OF ORDERS PROCESSED
36,954,377
19,624
EMPLOYEES
134,000+
EMPLOYEE SAFETY
COACHING, TRAINING, &
INSPECTION EVENTS
GLANCE
FASTENAL
AT A
143 MILLIONMILES DELIVERED 810DELIVEREDMILLION POUNDS
38,000+
BIN STOCKS
ACTIVEONSITE
401
ONSITE
LOCATIONS
62,000
+
VENDING MACHINES INSTALLED
DAILY SALES
GROWTH TO
CUSTOMERS
WITH VENDING
3.1%
CO
UN
TR
IES
W IT
H FASTENAL STORES21
7 Stock Performance Highlights
8-12 50 years of Growth through
Customer Service
INSIDE
BACK
COVER
Directors
Executive Officers
Corporate Information
2016 ANNUAL REPORT
1
LETTER TO
SHAREHOLDERS
One year ago I was in a new role – CEO of Fastenal. After 20 years
with Fastenal, I thought I knew the organization well. I knew we had
great people; I just didn’t realize how great. Blue Team members
are willing to change, to grow, and to learn on both an individual
basis and as a team. With this spirit, anything is possible.
In last year’s letter, we spoke about the results of the year, our
growth drivers, and our structural advantages. This letter is similar
in content; however, our aspirations for 2017 are much simpler –
we plan to grow our sales and our earnings.
To make this a reality, we plan to serve our customers well and to
help them improve their business. We have a name for this: Growth
Through Customer Service. We also plan to serve our employees
well, reflecting our core belief in people and a willingness to
challenge each other. Finally, we plan to better manage expenses.
Doing these three things will also serve you, our shareholders.
In 2016, our net sales grew 2.4%. The best way to understand
what happened in 2016 is to revisit some trends mentioned in
last year’s letter to shareholders. To summarize, 2015 was a
disappointing year. The growth rate of our business weakened
as the year progressed. Our net sales in the first quarter grew
about 9%, then slid to 5% growth in the second quarter, and in
September our daily sales growth went negative. We finished the
year with four negative months.
Our top 100 customers also experienced weakening trends in
2015. We are a significant supplier to each of these customers;
therefore, we feel our sales activity with this group is a good
‘proxy’ for their overall business activities. From the first quarter
of 2015 to the fourth, the number of top 100 customers with
growth in spend dropped about a third, from 75 to 49. For the 51
customers whose spend contracted with Fastenal, 37 were down
more than 10% and 21 were down more than 25%. These two
groups were about two and a half times greater in size than we
would normally expect. With these customers, our market share
continues to expand; however, the market place in which they
operate has contracted.
The weakness within our top 100 customers continued in
2016. With some variations, depending on the quarter, about 50
customers grew and about 50 contracted. The severity of the drop
with our contracting customers was only slightly better than in
2015, with about 30 customers contracting more than 10% and
about 12 customers contracting more than 25%. Both of these
were about two times the norm. In short, 2015 and 2016 were
tough years for our customers, and our success directly relates to
our customers’ success.
Understanding this customer information is important to
maintaining perspective during a weakening period like 2015 and
2016. It also serves as a reminder to everyone within Fastenal of
our mission to our customers. When they’re struggling, we need
to focus our energy on providing even more ideas for savings and
improvements.
There is another positive to never lose sight of: The market we serve
is large, and we currently serve about 4%. A short-term weakness
in the economy has no relevance to our market opportunity or the
steps needed to grow our business long term.
As stated above, our net sales grew 2.4% in 2016; however, our
pre-tax earnings contracted 4.4%, our net earnings contracted
3.3%, and our net earnings per share (EPS) contracted 2.3%. The
latter number was helped by our repurchase of shares in 2015 and
in early 2016.
In 2016, our gross margin was 49.6%, our first annual gross margin
below 50% in ten years. This wasn’t unexpected, but it was still
a tough pill to swallow. It wasn’t unexpected because fasteners,
our highest-margin product line, now represent about 37% of our
revenue versus 52% in 2006. Fastener sales have been dropping
as a percentage of our total revenues for about 20 years, primarily
because of our success selling additional non-fastener products
to existing customers. Our industrial vending and Onsite initiatives
have accelerated this trend in recent years. Ignoring product mix,
our gross margins also weakened due to several additional factors:
(1) some deflation in steel and/or in energy prices over time, (2)
a weak macro environment for our customers, and (3) some
disruption in the marketplace. The latter is difficult to quantify, but
we believe the disruption will benefit Fastenal in the long term due
to our structural advantage (more on this later).
In 2016, our operating expenses grew just over 4%. During all of
2015, we aggressively added capacity to the organization. This
capacity consisted of about 1,700 additional store employees, about
700 additional vehicles, about 9,000 additional industrial vending
devices, and an additional layer of deployed IT infrastructure. In
2016, we dedicated around 200 non-store personnel to optimize
our industrial vending business, we upgraded around 2,000 store
locations, and deployed about 22,000 more vending devices.
These investments dictated much of our expense patterns for the
year.
As CEO, I am proud of many things we did in 2016. We managed
our expenses in a compassionate and mainly disciplined manner,
and we pulled back on the accelerator as needed.
To make this a reality, we plan to
serve our customers well and to help
them improve their business.
We have a name for this:
Growth Through Customer Service
2016 ANNUAL REPORT
2
As CEO, I am also learning, and there was one expense where we
underperformed: We did not manage our store occupancy expense
well. We will work to improve this in 2017 and 2018. Given the
previous discussion about gross margins, managing our operating
expenses will become more important over time.
Our growth drivers haven’t changed from twelve months ago. They
include the following:
National Accounts
This is really our company-wide key account program. National
account customers represent about 47% of our revenue, and this
moves closer to 60% if we expand the definition to include large
regional customers and government customers.
Today, about a quarter of this business is served by an Onsite team
or some other customer-specific location. We believe our global
capabilities provide a compelling advantage in the marketplace.
We believe this advantage allows Fastenal to push further and
faster with these customers, forcing our competitors to play catch-
up. We simply have to exceed our customers’ expectations every
day – not easy, but achievable.
Onsite Locations
An Onsite location is a ‘store’ within a customer’s facility, or
sometimes in a lower-cost facility near the customer. At the end
of 2014, we had just over 200 active Onsite locations. During
2015 we signed 80, and in 2016 we signed 176. Our success has
grown because our engagement, or participation, has grown. In
2015, about 25% of our district business units signed an Onsite
customer; in 2016, this doubled to just over 50%. Our goal in 2017
is to have 80% of our districts sign at least one Onsite customer.
If achieved, we believe this could result in 275 to 300 signings. It
might be questionable for us to publish this ambitious of a goal, but
that is the DNA of Fastenal – see the potential and challenge your
people to achieve that potential.
Industrial Vending
We started 2016 with about 55,500 vending devices installed at
customer sites and ended the year with about 62,800. The net
increase of 7,300 (or 13%) probably doesn’t sound like a big deal;
however, we ‘tuned up’ the business and removed around 9,300
underperforming devices. We think this was a good decision. It
improved the efficiency of the business, improved the financial
returns of the business, and positioned us to serve our customers
at a higher level – we like all three outcomes. As with Onsite, we
believe there is a significant growth opportunity remaining in the
industrial vending marketplace.
(For those of you possibly confused by the 7,300 vending machines
noted above versus the 22,000 devices discussed earlier in this
letter, the difference is about 15,000 devices deployed under a
locker leasing program during the year. We exclude these devices
from most of our disclosures as they don’t generate product sales,
but rather rental fees.)
Store Locations
Let’s talk about one of our basic growth drivers. Starting in late
2015, we invested heavily to upgrade about 2,000 stores through
our CSP 16 (Customer Service Project 2016) initiative. It involved
an infusion of about $54 million worth of inventory and a lot of hard
work at the local store level. We did this to improve our same-day
service capabilities and to allow our local teams to expand the
breadth of customers within their sales plans. A specific area of
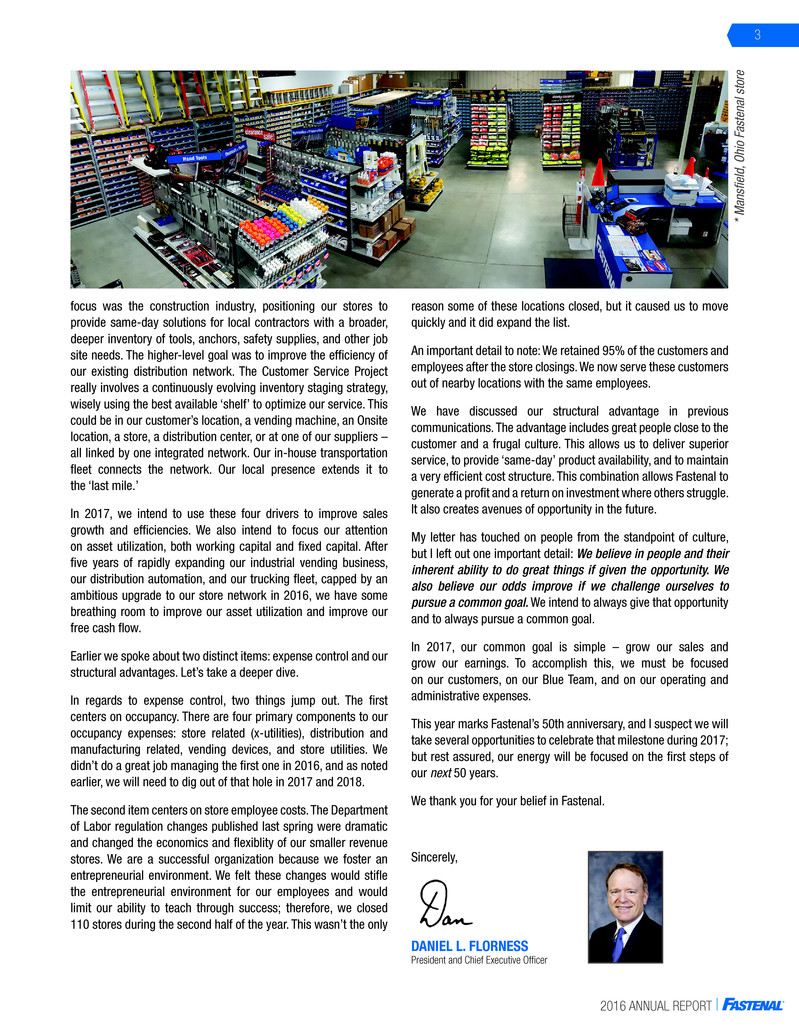
The Customer Service Project really
involves a continuously evolving
inventory staging strategy, wisely
using the best available ‘shelf’ to
optimize our service.
2016 ANNUAL REPORT
3
DANIEL L. FLORNESS
President and Chief Executive Officer
focus was the construction industry, positioning our stores to
provide same-day solutions for local contractors with a broader,
deeper inventory of tools, anchors, safety supplies, and other job
site needs. The higher-level goal was to improve the efficiency of
our existing distribution network. The Customer Service Project
really involves a continuously evolving inventory staging strategy,
wisely using the best available ‘shelf’ to optimize our service. This
could be in our customer’s location, a vending machine, an Onsite
location, a store, a distribution center, or at one of our suppliers –
all linked by one integrated network. Our in-house transportation
fleet connects the network. Our local presence extends it to
the ‘last mile.’
In 2017, we intend to use these four drivers to improve sales
growth and efficiencies. We also intend to focus our attention
on asset utilization, both working capital and fixed capital. After
five years of rapidly expanding our industrial vending business,
our distribution automation, and our trucking fleet, capped by an
ambitious upgrade to our store network in 2016, we have some
breathing room to improve our asset utilization and improve our
free cash flow.
Earlier we spoke about two distinct items: expense control and our
structural advantages. Let’s take a deeper dive.
In regards to expense control, two things jump out. The first
centers on occupancy. There are four primary components to our
occupancy expenses: store related (x-utilities), distribution and
manufacturing related, vending devices, and store utilities. We
didn’t do a great job managing the first one in 2016, and as noted
earlier, we will need to dig out of that hole in 2017 and 2018.
The second item centers on store employee costs. The Department
of Labor regulation changes published last spring were dramatic
and changed the economics and flexiblity of our smaller revenue
stores. We are a successful organization because we foster an
entrepreneurial environment. We felt these changes would stifle
the entrepreneurial environment for our employees and would
limit our ability to teach through success; therefore, we closed
110 stores during the second half of the year. This wasn’t the only
reason some of these locations closed, but it caused us to move
quickly and it did expand the list.
An important detail to note: We retained 95% of the customers and
employees after the store closings. We now serve these customers
out of nearby locations with the same employees.
We have discussed our structural advantage in previous
communications. The advantage includes great people close to the
customer and a frugal culture. This allows us to deliver superior
service, to provide ‘same-day’ product availability, and to maintain
a very efficient cost structure. This combination allows Fastenal to
generate a profit and a return on investment where others struggle.
It also creates avenues of opportunity in the future.
My letter has touched on people from the standpoint of culture,
but I left out one important detail: We believe in people and their
inherent ability to do great things if given the opportunity. We
also believe our odds improve if we challenge ourselves to
pursue a common goal. We intend to always give that opportunity
and to always pursue a common goal.
In 2017, our common goal is simple – grow our sales and
grow our earnings. To accomplish this, we must be focused
on our customers, on our Blue Team, and on our operating and
administrative expenses.
This year marks Fastenal’s 50th anniversary, and I suspect we will
take several opportunities to celebrate that milestone during 2017;
but rest assured, our energy will be focused on the first steps of
our next 50 years.
We thank you for your belief in Fastenal.
Sincerely,
* Mansfield
, Ohio
Fastenal stor
e

2016 ANNUAL REPORT
4
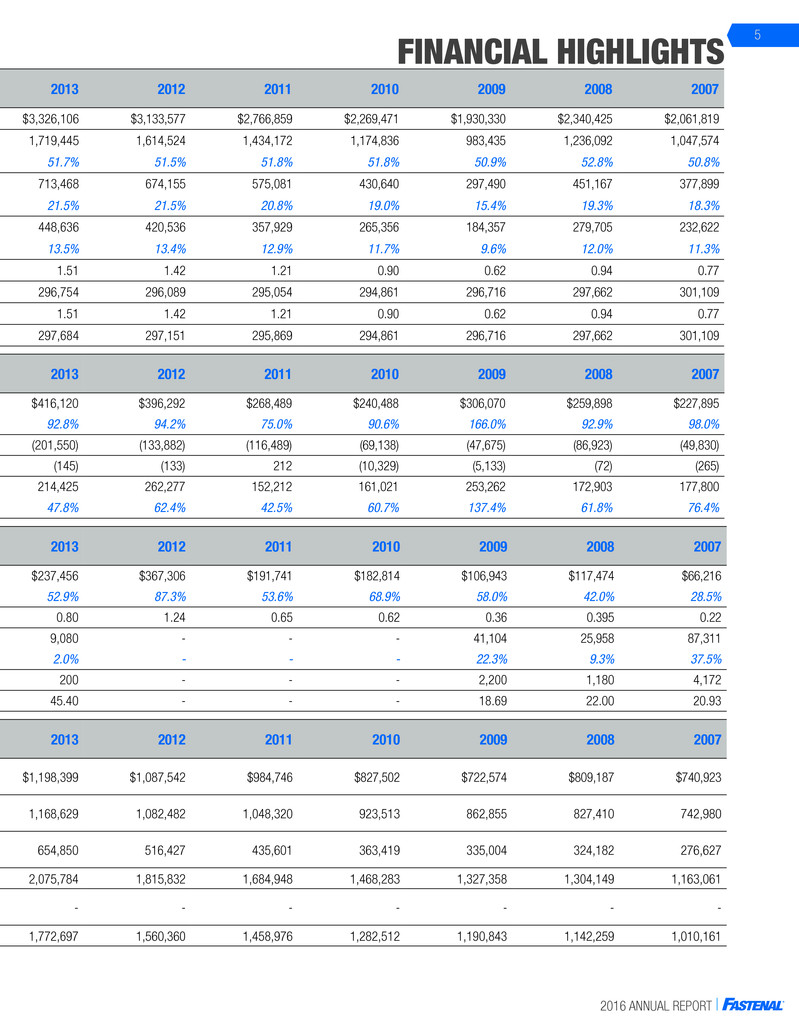
Operating Results 2016 Percent Change 2015 2014 2013 2012 2011 2010 2009 2008 2007
Net sales $ 3,962,036 2.4% $3,869,187 $3,733,507 $3,326,106 $3,133,577 $2,766,859 $2,269,471 $1,930,330 $2,340,425 $2,061,819
Gross profit $ 1,964,777 0.8% 1,948,934 1,897,402 1,719,445 1,614,524 1,434,172 1,174,836 983,435 1,236,092 1,047,574
% of net sales 49.6% 50.4% 50.8% 51.7% 51.5% 51.8% 51.8% 50.9% 52.8% 50.8%
Earnings before income taxes $ 789,729 -4.4% 826,020 787,434 713,468 674,155 575,081 430,640 297,490 451,167 377,899
% of net sales 19.9% 21.3% 21.1% 21.5% 21.5% 20.8% 19.0% 15.4% 19.3% 18.3%
Net earnings $ 499,478 -3.3% 516,361 494,150 448,636 420,536 357,929 265,356 184,357 279,705 232,622
% of net sales 12.6% 13.3% 13.2% 13.5% 13.4% 12.9% 11.7% 9.6% 12.0% 11.3%
Basic net earnings per share $ 1.73 -2.3% 1.77 1.67 1.51 1.42 1.21 0.90 0.62 0.94 0.77
Basic weighted average shares outstanding 288,950 -0.9% 291,453 296,490 296,754 296,089 295,054 294,861 296,716 297,662 301,109
Diluted net earnings per share $ 1.73 -2.3% 1.77 1.66 1.51 1.42 1.21 0.90 0.62 0.94 0.77
Diluted weighted average shares outstanding(1) 289,158 -1.0% 292,045 297,313 297,684 297,151 295,869 294,861 296,716 297,662 301,109
Dividends and Common
Stock Purchase Summary 2016
Percent
Change 2015 2014 2013 2012 2011 2010 2009 2008 2007
Dividends paid $ 346,588 6.0% $327,101 $296,581 $237,456 $367,306 $191,741 $182,814 $106,943 $117,474 $66,216
% of net earnings 69.4% 63.3% 60.0% 52.9% 87.3% 53.6% 68.9% 58.0% 42.0% 28.5%
Dividends paid per share $ 1.20 7.1% 1.12 1.00 0.80 1.24 0.65 0.62 0.36 0.395 0.22
Purchases of common stock $ 59,440 -79.7% 292,951 52,942 9,080 - - - 41,104 25,958 87,311
% of net earnings 11.9% 56.7% 10.7% 2.0% - - - 22.3% 9.3% 37.5%
Common stock shares purchased 1,600 -77.5% 7,100 1,200 200 - - - 2,200 1,180 4,172
Average price paid per share $ 37.15 -10.0% 41.26 44.12 45.40 - - - 18.69 22.00 20.93
Financial Position at Year End 2016 Percent Change 2015 2014 2013 2012 2011 2010 2009 2008 2007
Operational working capital
(accounts receivable, net and inventories) $ 1,492,705 8.0% $1,381,638 $1,331,301 $1,198,399 $1,087,542 $984,746 $827,502 $722,574 $809,187 $740,923
Net working capital
(current assets less current liabilities) $ 1,445,126 11.9% 1,291,610 1,207,912 1,168,629 1,082,482 1,048,320 923,513 862,855 827,410 742,980
Fixed capital
(property and equipment, net) $ 899,697 9.9% 818,889 763,889 654,850 516,427 435,601 363,419 335,004 324,182 276,627
Total assets $ 2,668,884 5.4% 2,532,462 2,359,102 2,075,784 1,815,832 1,684,948 1,468,283 1,327,358 1,304,149 1,163,061
Total debt
(current portion of debt and long-term debt) $ 390,000 6.8% 365,000 90,000 - - - - - - -
Total stockholders' equity $ 1,933,094 7.3% 1,801,289 1,915,217 1,772,697 1,560,360 1,458,976 1,282,512 1,190,843 1,142,259 1,010,161
All information contained in this Annual Report reflects the 2-for-1 stock split in 2011.
(1) Reflects impact of stock options issued by the Company that were in-the-money and outstanding during the period.
(Amounts in Thousands Except Per Share Information)
10-YEAR SELECTED FINANCIAL
DA
TA
Cash Flow Summary 2016 Percent Change 2015 2014 2013 2012 2011 2010 2009 2008 2007
Net cash provided by operating activities $ 513,999 -6.0% $546,940 $499,392 $416,120 $396,292 $268,489 $240,488 $306,070 $259,898 $227,895
% of net earnings 102.9% 105.9% 101.1% 92.8% 94.2% 75.0% 90.6% 166.0% 92.9% 98.0%
Less capital expenditures, net $ (182,946) 26.0% (145,227) (183,655) (201,550) (133,882) (116,489) (69,138) (47,675) (86,923) (49,830)
Acquisitions and other $ (5,147) -85.5% (35,400) (5,577) (145) (133) 212 (10,329) (5,133) (72) (265)
Free cash flow $ 325,906 -11.0% 366,313 310,160 214,425 262,277 152,212 161,021 253,262 172,903 177,800
% of net earnings 65.2% 70.9% 62.8% 47.8% 62.4% 42.5% 60.7% 137.4% 61.8% 76.4%
2016 ANNUAL REPORT
5
Operating Results 2016 Percent Change 2015 2014 2013 2012 2011 2010 2009 2008 2007
Net sales $ 3,962,036 2.4% $3,869,187 $3,733,507 $3,326,106 $3,133,577 $2,766,859 $2,269,471 $1,930,330 $2,340,425 $2,061,819
Gross profit $ 1,964,777 0.8% 1,948,934 1,897,402 1,719,445 1,614,524 1,434,172 1,174,836 983,435 1,236,092 1,047,574
% of net sales 49.6% 50.4% 50.8% 51.7% 51.5% 51.8% 51.8% 50.9% 52.8% 50.8%
Earnings before income taxes $ 789,729 -4.4% 826,020 787,434 713,468 674,155 575,081 430,640 297,490 451,167 377,899
% of net sales 19.9% 21.3% 21.1% 21.5% 21.5% 20.8% 19.0% 15.4% 19.3% 18.3%
Net earnings $ 499,478 -3.3% 516,361 494,150 448,636 420,536 357,929 265,356 184,357 279,705 232,622
% of net sales 12.6% 13.3% 13.2% 13.5% 13.4% 12.9% 11.7% 9.6% 12.0% 11.3%
Basic net earnings per share $ 1.73 -2.3% 1.77 1.67 1.51 1.42 1.21 0.90 0.62 0.94 0.77
Basic weighted average shares outstanding 288,950 -0.9% 291,453 296,490 296,754 296,089 295,054 294,861 296,716 297,662 301,109
Diluted net earnings per share $ 1.73 -2.3% 1.77 1.66 1.51 1.42 1.21 0.90 0.62 0.94 0.77
Diluted weighted average shares outstanding(1) 289,158 -1.0% 292,045 297,313 297,684 297,151 295,869 294,861 296,716 297,662 301,109
Dividends and Common
Stock Purchase Summary 2016
Percent
Change 2015 2014 2013 2012 2011 2010 2009 2008 2007
Dividends paid $ 346,588 6.0% $327,101 $296,581 $237,456 $367,306 $191,741 $182,814 $106,943 $117,474 $66,216
% of net earnings 69.4% 63.3% 60.0% 52.9% 87.3% 53.6% 68.9% 58.0% 42.0% 28.5%
Dividends paid per share $ 1.20 7.1% 1.12 1.00 0.80 1.24 0.65 0.62 0.36 0.395 0.22
Purchases of common stock $ 59,440 -79.7% 292,951 52,942 9,080 - - - 41,104 25,958 87,311
% of net earnings 11.9% 56.7% 10.7% 2.0% - - - 22.3% 9.3% 37.5%
Common stock shares purchased 1,600 -77.5% 7,100 1,200 200 - - - 2,200 1,180 4,172
Average price paid per share $ 37.15 -10.0% 41.26 44.12 45.40 - - - 18.69 22.00 20.93
Financial Position at Year End 2016 Percent Change 2015 2014 2013 2012 2011 2010 2009 2008 2007
Operational working capital
(accounts receivable, net and inventories) $ 1,492,705 8.0% $1,381,638 $1,331,301 $1,198,399 $1,087,542 $984,746 $827,502 $722,574 $809,187 $740,923
Net working capital
(current assets less current liabilities) $ 1,445,126 11.9% 1,291,610 1,207,912 1,168,629 1,082,482 1,048,320 923,513 862,855 827,410 742,980
Fixed capital
(property and equipment, net) $ 899,697 9.9% 818,889 763,889 654,850 516,427 435,601 363,419 335,004 324,182 276,627
Total assets $ 2,668,884 5.4% 2,532,462 2,359,102 2,075,784 1,815,832 1,684,948 1,468,283 1,327,358 1,304,149 1,163,061
Total debt
(current portion of debt and long-term debt) $ 390,000 6.8% 365,000 90,000 - - - - - - -
Total stockholders' equity $ 1,933,094 7.3% 1,801,289 1,915,217 1,772,697 1,560,360 1,458,976 1,282,512 1,190,843 1,142,259 1,010,161
All information contained in this Annual Report reflects the 2-for-1 stock split in 2011.
(1) Reflects impact of stock options issued by the Company that were in-the-money and outstanding during the period.
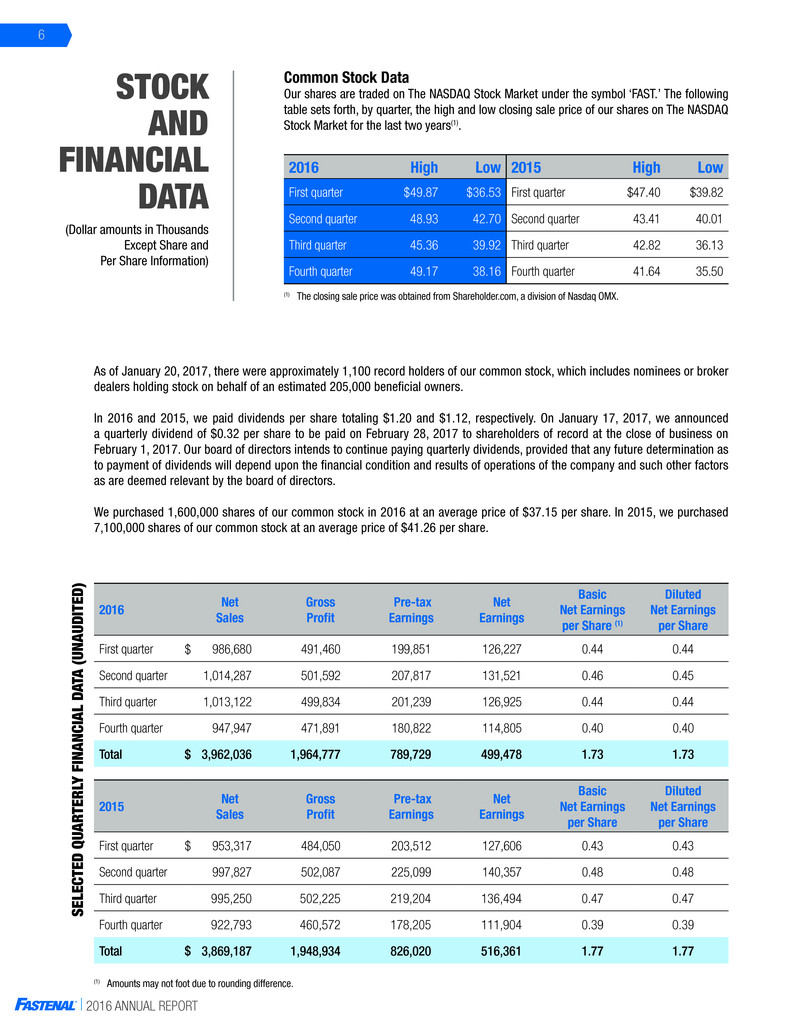
FINANCIAL HIGHLIGHTS
Cash Flow Summary 2016 Percent Change 2015 2014 2013 2012 2011 2010 2009 2008 2007
Net cash provided by operating activities $ 513,999 -6.0% $546,940 $499,392 $416,120 $396,292 $268,489 $240,488 $306,070 $259,898 $227,895
% of net earnings 102.9% 105.9% 101.1% 92.8% 94.2% 75.0% 90.6% 166.0% 92.9% 98.0%
Less capital expenditures, net $ (182,946) 26.0% (145,227) (183,655) (201,550) (133,882) (116,489) (69,138) (47,675) (86,923) (49,830)
Acquisitions and other $ (5,147) -85.5% (35,400) (5,577) (145) (133) 212 (10,329) (5,133) (72) (265)
Free cash flow $ 325,906 -11.0% 366,313 310,160 214,425 262,277 152,212 161,021 253,262 172,903 177,800
% of net earnings 65.2% 70.9% 62.8% 47.8% 62.4% 42.5% 60.7% 137.4% 61.8% 76.4%
2016 ANNUAL REPORT
6
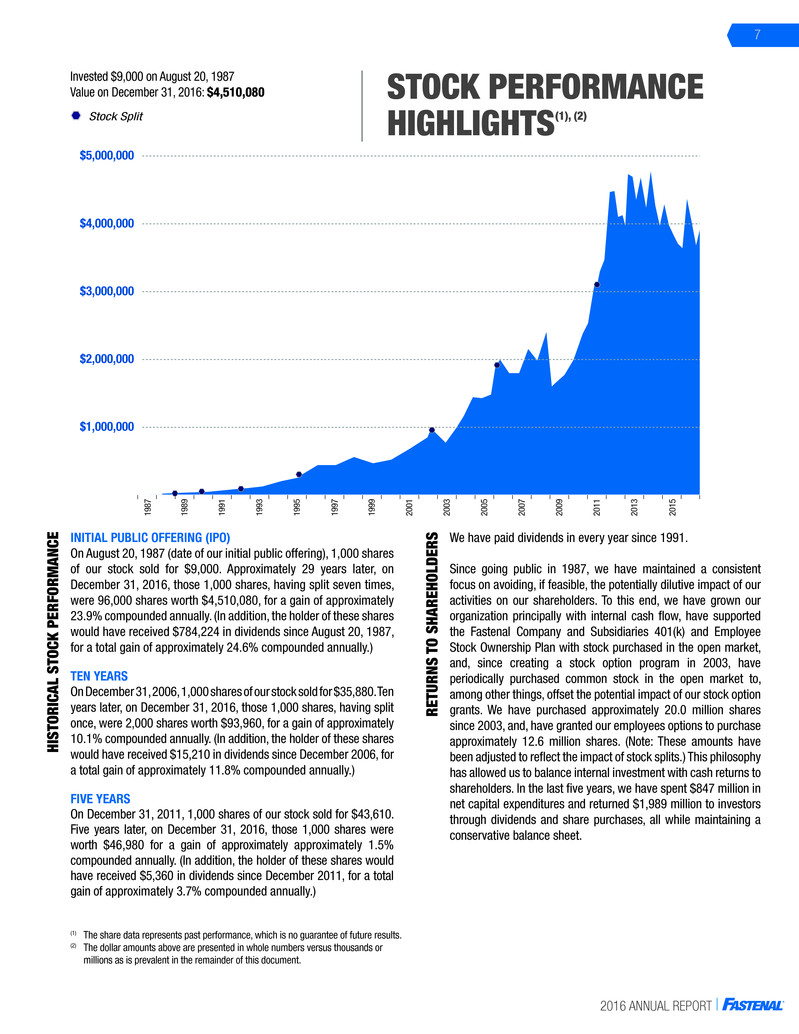
2016 High Low 2015 High Low
First quarter $49.87 $36.53 First quarter $47.40 $39.82
Second quarter 48.93 42.70 Second quarter 43.41 40.01
Third quarter 45.36 39.92 Third quarter 42.82 36.13
Fourth quarter 49.17 38.16 Fourth quarter 41.64 35.50
As of January 20, 2017, there were approximately 1,100 record holders of our common stock, which includes nominees or broker
dealers holding stock on behalf of an estimated 205,000 beneficial owners.
In 2016 and 2015, we paid dividends per share totaling $1.20 and $1.12, respectively. On January 17, 2017, we announced
a quarterly dividend of $0.32 per share to be paid on February 28, 2017 to shareholders of record at the close of business on
February 1, 2017. Our board of directors intends to continue paying quarterly dividends, provided that any future determination as
to payment of dividends will depend upon the financial condition and results of operations of the company and such other factors
as are deemed relevant by the board of directors.
We purchased 1,600,000 shares of our common stock in 2016 at an average price of $37.15 per share. In 2015, we purchased
7,100,000 shares of our common stock at an average price of $41.26 per share.
Common Stock Data
Our shares are traded on The NASDAQ Stock Market under the symbol ‘FAST.’ The following
table sets forth, by quarter, the high and low closing sale price of our shares on The NASDAQ
Stock Market for the last two years(1).
2015 Net Sales
Gross
Profit
Pre-tax
Earnings
Net
Earnings
Basic
Net Earnings
per Share
Diluted
Net Earnings
per Share
First quarter 953,317 484,050 203,512 127,606 0.43 0.43
Second quarter 997,827 502,087 225,099 140,357 0.48 0.48
Third quarter 995,250 502,225 219,204 136,494 0.47 0.47
Fourth quarter 922,793 460,572 178,205 111,904 0.39 0.39
Total 3,869,187 1,948,934 826,020 516,361 1.77 1.77
2016 Net Sales
Gross
Profit
Pre-tax
Earnings
Net
Earnings
Basic
Net Earnings
per Share (1)
Diluted
Net Earnings
per Share
First quarter 986,680 491,460 199,851 126,227 0.44 0.44
Second quarter 1,014,287 501,592 207,817 131,521 0.46 0.45
Third quarter 1,013,122 499,834 201,239 126,925 0.44 0.44
Fourth quarter 947,947 471,891 180,822 114,805 0.40 0.40
Total 3,962,036 1,964,777 789,729 499,478 1.73 1.73
(1) The closing sale price was obtained from Shareholder.com, a division of Nasdaq OMX.
STOCK
AND
FINANCIAL
DATA
SELECTED Q
UA
RTER
LY FINANCIAL
DA
TA (UN
AUDITED
)
(Dollar amounts in Thousands
Except Share and
Per Share Information)
(1) Amounts may not foot due to rounding difference.
$
$
$
$
2016 ANNUAL REPORT
7
Invested $9,000 on August 20, 1987
Value on December 31, 2016: $4,510,080 STOCK PERFORMANCE
HIGHLIGHTS(1), (2)
(1) The share data represents past performance, which is no guarantee of future results.
(2) The dollar amounts above are presented in whole numbers versus thousands or
millions as is prevalent in the remainder of this document.
$1,000,000
$2,000,000
$3,000,000
$4,000,000
$5,000,000
198
7
198
9
199
1
199
3
199
5
199
7
199
9
200
1
200
3
200
5
200
7
200
9
201
1
201
3
201
5
201
7
Stock Split
INITIAL PUBLIC OFFERING (IPO)
On August 20, 1987 (date of our initial public offering), 1,000 shares
of our stock sold for $9,000. Approximately 29 years later, on
December 31, 2016, those 1,000 shares, having split seven times,
were 96,000 shares worth $4,510,080, for a gain of approximately
23.9% compounded annually. (In addition, the holder of these shares
would have received $784,224 in dividends since August 20, 1987,
for a total gain of approximately 24.6% compounded annually.)
TEN YEARS
On December 31, 2006, 1,000 shares of our stock sold for $35,880. Ten
years later, on December 31, 2016, those 1,000 shares, having split
once, were 2,000 shares worth $93,960, for a gain of approximately
10.1% compounded annually. (In addition, the holder of these shares
would have received $15,210 in dividends since December 2006, for
a total gain of approximately 11.8% compounded annually.)
FIVE YEARS
On December 31, 2011, 1,000 shares of our stock sold for $43,610.
Five years later, on December 31, 2016, those 1,000 shares were
worth $46,980 for a gain of approximately approximately 1.5%
compounded annually. (In addition, the holder of these shares would
have received $5,360 in dividends since December 2011, for a total
gain of approximately 3.7% compounded annually.)
HISTORICAL STOCK PERFORMANC
E
RETURNS
TO
SHAREHOLDER
S We have paid dividends in every year since 1991.
Since going public in 1987, we have maintained a consistent
focus on avoiding, if feasible, the potentially dilutive impact of our
activities on our shareholders. To this end, we have grown our
organization principally with internal cash flow, have supported
the Fastenal Company and Subsidiaries 401(k) and Employee
Stock Ownership Plan with stock purchased in the open market,
and, since creating a stock option program in 2003, have
periodically purchased common stock in the open market to,
among other things, offset the potential impact of our stock option
grants. We have purchased approximately 20.0 million shares
since 2003, and, have granted our employees options to purchase
approximately 12.6 million shares. (Note: These amounts have
been adjusted to reflect the impact of stock splits.) This philosophy
has allowed us to balance internal investment with cash returns to
shareholders. In the last five years, we have spent $847 million in
net capital expenditures and returned $1,989 million to investors
through dividends and share purchases, all while maintaining a
conservative balance sheet.
2016 ANNUAL REPORT
8
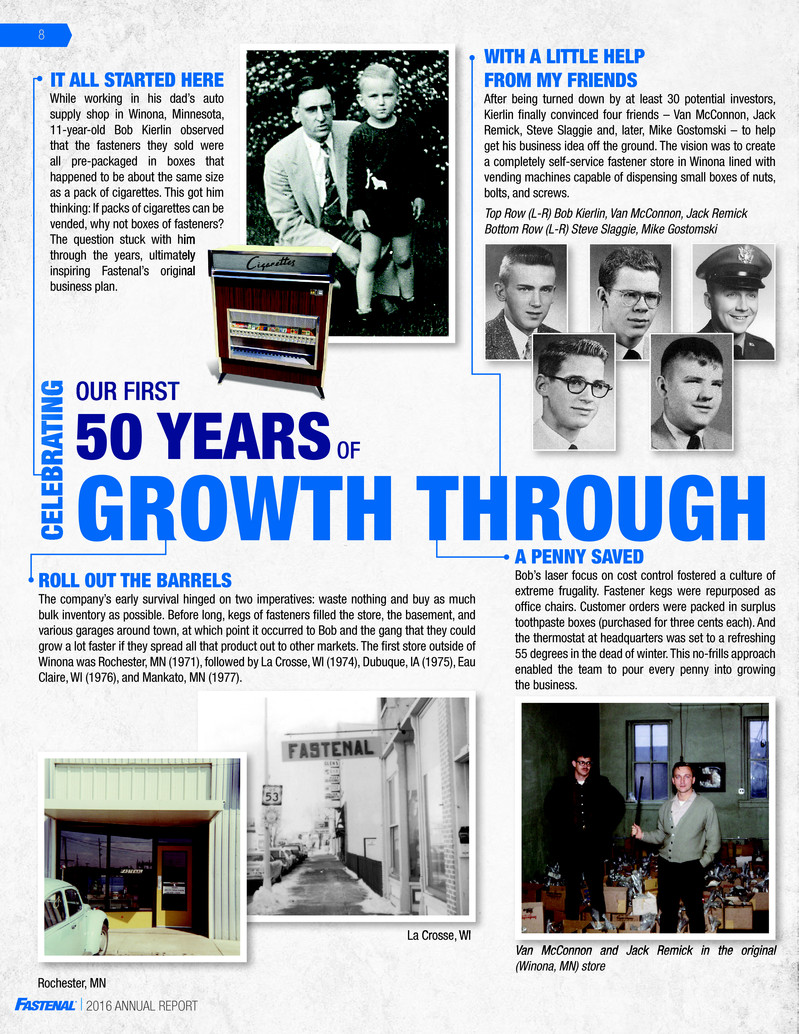
While working in his dad’s auto
supply shop in Winona, Minnesota,
11-year-old Bob Kierlin observed
that the fasteners they sold were
all pre-packaged in boxes that
happened to be about the same size
as a pack of cigarettes. This got him
thinking: If packs of cigarettes can be
vended, why not boxes of fasteners?
The question stuck with him
through the years, ultimately
inspiring Fastenal’s original
business plan.
After being turned down by at least 30 potential investors,
Kierlin fi nally convinced four friends – Van McConnon, Jack
Remick, Steve Slaggie and, later, Mike Gostomski – to help
get his business idea off the ground. The vision was to create
a completely self-service fastener store in Winona lined with
vending machines capable of dispensing small boxes of nuts,
bolts, and screws.
The company’s early survival hinged on two imperatives: waste nothing and buy as much
bulk inventory as possible. Before long, kegs of fasteners fi lled the store, the basement, and
various garages around town, at which point it occurred to Bob and the gang that they could
grow a lot faster if they spread all that product out to other markets. The fi rst store outside of
Winona was Rochester, MN (1971), followed by La Crosse, WI (1974), Dubuque, IA (1975), Eau
Claire, WI (1976), and Mankato, MN (1977).
Bob’s laser focus on cost control fostered a culture of
extreme frugality. Fastener kegs were repurposed as
offi ce chairs. Customer orders were packed in surplus
toothpaste boxes (purchased for three cents each). And
the thermostat at headquarters was set to a refreshing
55 degrees in the dead of winter. This no-frills approach
enabled the team to pour every penny into growing
the business.
IT ALL STARTED HERE
ROLL OUT THE BARRELS
A PENNY SAVED
WITH A LITTLE HELP
FROM MY FRIENDS
OUR FIRST
CELEBR
ATIN
G
GROWTH THROUGH
50 YEARS OF
Rochester, MN
Top Row (L-R) Bob Kierlin, Van McConnon, Jack Remick
Bottom Row (L-R) Steve Slaggie, Mike Gostomski
Van McConnon and Jack Remick in the original
(Winona, MN) store
La Crosse, WI
2016 ANNUAL REPORT
9
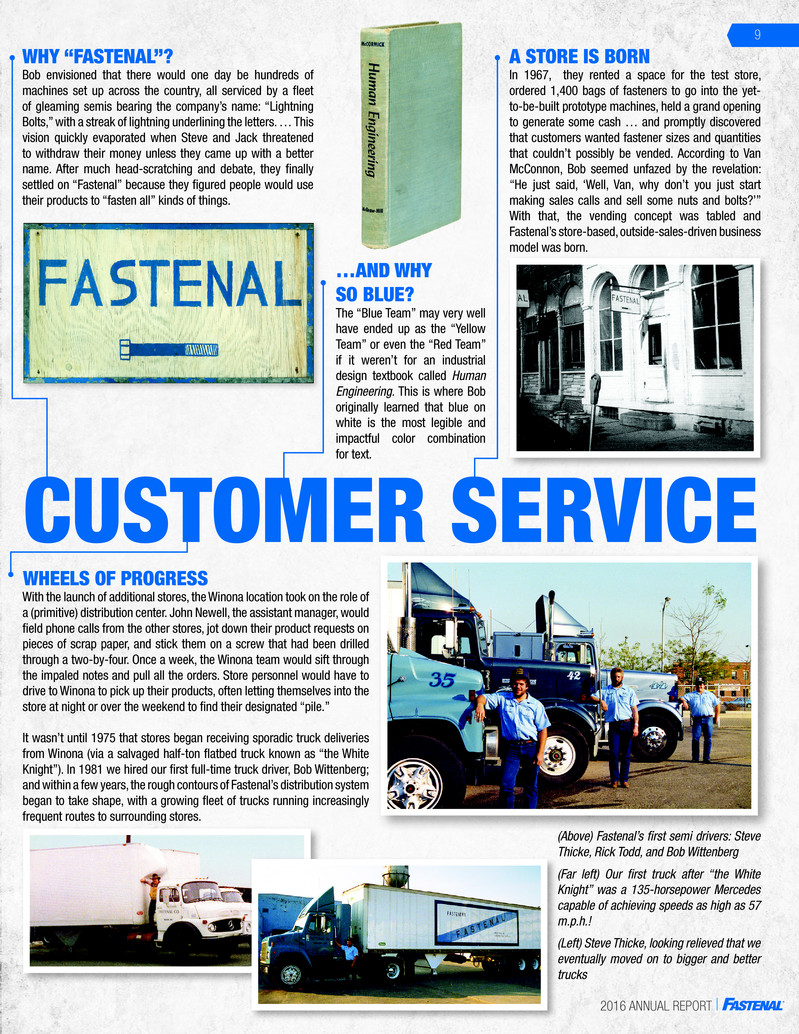
Bob envisioned that there would one day be hundreds of
machines set up across the country, all serviced by a fl eet
of gleaming semis bearing the company’s name: “Lightning
Bolts,” with a streak of lightning underlining the letters. … This
vision quickly evaporated when Steve and Jack threatened
to withdraw their money unless they came up with a better
name. After much head-scratching and debate, they fi nally
settled on “Fastenal” because they fi gured people would use
their products to “fasten all” kinds of things.
In 1967, they rented a space for the test store,
ordered 1,400 bags of fasteners to go into the yet-
to-be-built prototype machines, held a grand opening
to generate some cash … and promptly discovered
that customers wanted fastener sizes and quantities
that couldn’t possibly be vended. According to Van
McConnon, Bob seemed unfazed by the revelation:
“He just said, ‘Well, Van, why don’t you just start
making sales calls and sell some nuts and bolts?’”
With that, the vending concept was tabled and
Fastenal’s store-based, outside-sales-driven business
model was born.
With the launch of additional stores, the Winona location took on the role of
a (primitive) distribution center. John Newell, the assistant manager, would
fi eld phone calls from the other stores, jot down their product requests on
pieces of scrap paper, and stick them on a screw that had been drilled
through a two-by-four. Once a week, the Winona team would sift through
the impaled notes and pull all the orders. Store personnel would have to
drive to Winona to pick up their products, often letting themselves into the
store at night or over the weekend to fi nd their designated “pile.”
It wasn’t until 1975 that stores began receiving sporadic truck deliveries
from Winona (via a salvaged half-ton fl atbed truck known as “the White
Knight”). In 1981 we hired our fi rst full-time truck driver, Bob Wittenberg;
and within a few years, the rough contours of Fastenal’s distribution system
began to take shape, with a growing fl eet of trucks running increasingly
frequent routes to surrounding stores.
WHY “FASTENAL”?
The “Blue Team” may very well
have ended up as the “Yellow
Team” or even the “Red Team”
if it weren’t for an industrial
design textbook called Human
Engineering. This is where Bob
originally learned that blue on
white is the most legible and
impactful color combination
for text.
…AND WHY
SO BLUE?
A STORE IS BORN
WHEELS OF PROGRESS
CUSTOMER SERVICE
(Above) Fastenal’s fi rst semi drivers: Steve
Thicke, Rick Todd, and Bob Wittenberg
(Far left) Our fi rst truck after “the White
Knight” was a 135-horsepower Mercedes
capable of achieving speeds as high as 57
m.p.h.!
(Left) Steve Thicke, looking relieved that we
eventually moved on to bigger and better
trucks
2016 ANNUAL REPORT
10
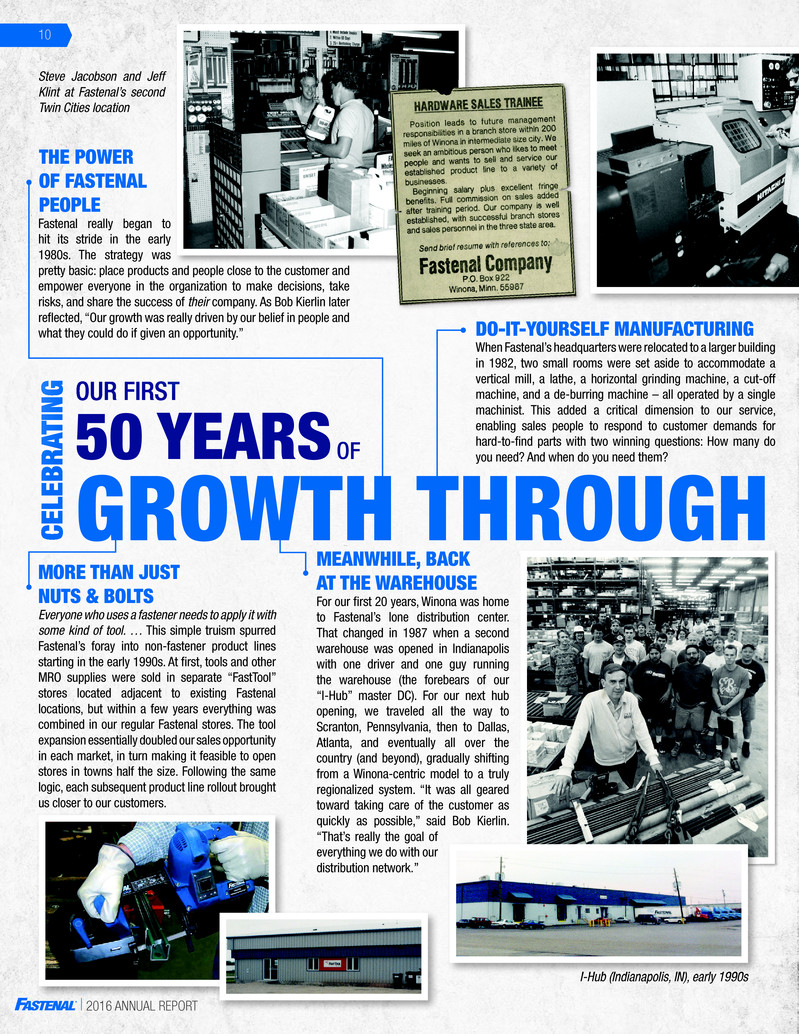
For our fi rst 20 years, Winona was home
to Fastenal’s lone distribution center.
That changed in 1987 when a second
warehouse was opened in Indianapolis
with one driver and one guy running
the warehouse (the forebears of our
“I-Hub” master DC). For our next hub
opening, we traveled all the way to
Scranton, Pennsylvania, then to Dallas,
Atlanta, and eventually all over the
country (and beyond), gradually shifting
from a Winona-centric model to a truly
regionalized system. “It was all geared
toward taking care of the customer as
quickly as possible,” said Bob Kierlin.
“That’s really the goal of
everything we do with our
distribution network.”
Everyone who uses a fastener needs to apply it with
some kind of tool. … This simple truism spurred
Fastenal’s foray into non-fastener product lines
starting in the early 1990s. At fi rst, tools and other
MRO supplies were sold in separate “FastTool”
stores located adjacent to existing Fastenal
locations, but within a few years everything was
combined in our regular Fastenal stores. The tool
expansion essentially doubled our sales opportunity
in each market, in turn making it feasible to open
stores in towns half the size. Following the same
logic, each subsequent product line rollout brought
us closer to our customers.
MORE THAN JUST
NUTS & BOLTS
MEANWHILE, BACK
AT THE WAREHOUSE
OUR FIRST
CELEBR
ATIN
G
GROWTH THROUGH
50 YEARS OF
When Fastenal’s headquarters were relocated to a larger building
in 1982, two small rooms were set aside to accommodate a
vertical mill, a lathe, a horizontal grinding machine, a cut-off
machine, and a de-burring machine – all operated by a single
machinist. This added a critical dimension to our service,
enabling sales people to respond to customer demands for
hard-to-fi nd parts with two winning questions: How many do
you need? And when do you need them?
DO-IT-YOURSELF MANUFACTURING
Fastenal really began to
hit its stride in the early
1980s. The strategy was
pretty basic: place products and people close to the customer and
empower everyone in the organization to make decisions, take
risks, and share the success of their company. As Bob Kierlin later
refl ected, “Our growth was really driven by our belief in people and
what they could do if given an opportunity.”
THE POWER
OF FASTENAL
PEOPLE
Steve Jacobson and Jeff
Klint at Fastenal’s second
Twin Cities location
I-Hub (Indianapolis, IN), early 1990s
2016 ANNUAL REPORT
11
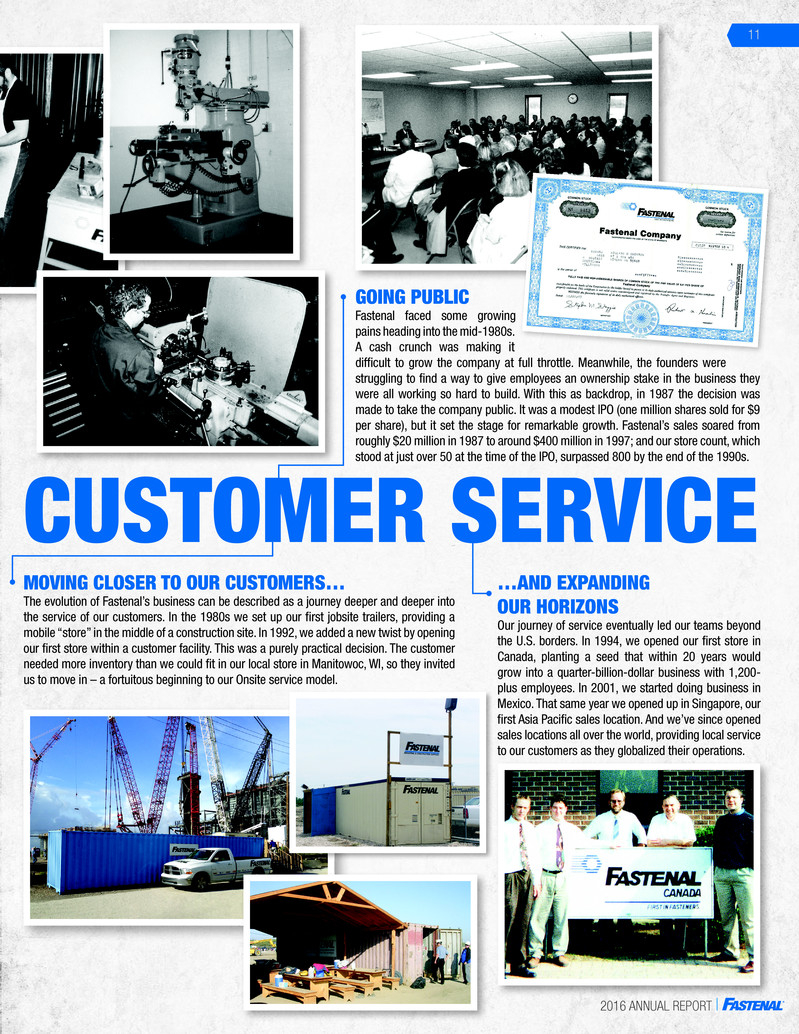
Fastenal faced some growing
pains heading into the mid-1980s.
A cash crunch was making it
diffi cult to grow the company at full throttle. Meanwhile, the founders were
struggling to fi nd a way to give employees an ownership stake in the business they
were all working so hard to build. With this as backdrop, in 1987 the decision was
made to take the company public. It was a modest IPO (one million shares sold for $9
per share), but it set the stage for remarkable growth. Fastenal’s sales soared from
roughly $20 million in 1987 to around $400 million in 1997; and our store count, which
stood at just over 50 at the time of the IPO, surpassed 800 by the end of the 1990s.
GOING PUBLIC
CUSTOMER SERVICE
The evolution of Fastenal’s business can be described as a journey deeper and deeper into
the service of our customers. In the 1980s we set up our fi rst jobsite trailers, providing a
mobile “store” in the middle of a construction site. In 1992, we added a new twist by opening
our fi rst store within a customer facility. This was a purely practical decision. The customer
needed more inventory than we could fi t in our local store in Manitowoc, WI, so they invited
us to move in – a fortuitous beginning to our Onsite service model.
MOVING CLOSER TO OUR CUSTOMERS… …AND EXPANDING
OUR HORIZONS
Our journey of service eventually led our teams beyond
the U.S. borders. In 1994, we opened our fi rst store in
Canada, planting a seed that within 20 years would
grow into a quarter-billion-dollar business with 1,200-
plus employees. In 2001, we started doing business in
Mexico. That same year we opened up in Singapore, our
fi rst Asia Pacifi c sales location. And we’ve since opened
sales locations all over the world, providing local service
to our customers as they globalized their operations.
2016 ANNUAL REPORT
12
OUR FIRST
CELEBR
ATIN
G
GROWTH THROUGH
CUSTOMER SERVICE
50 YEARS OF
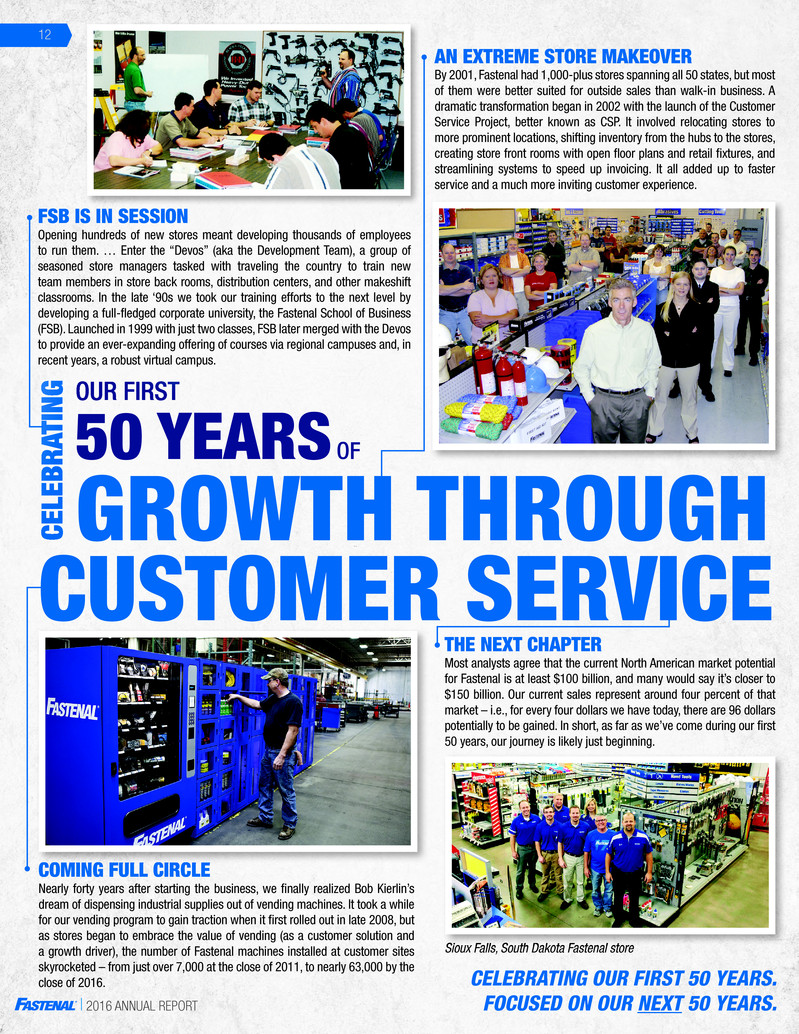
Nearly forty years after starting the business, we fi nally realized Bob Kierlin’s
dream of dispensing industrial supplies out of vending machines. It took a while
for our vending program to gain traction when it fi rst rolled out in late 2008, but
as stores began to embrace the value of vending (as a customer solution and
a growth driver), the number of Fastenal machines installed at customer sites
skyrocketed – from just over 7,000 at the close of 2011, to nearly 63,000 by the
close of 2016.
Most analysts agree that the current North American market potential
for Fastenal is at least $100 billion, and many would say it’s closer to
$150 billion. Our current sales represent around four percent of that
market – i.e., for every four dollars we have today, there are 96 dollars
potentially to be gained. In short, as far as we’ve come during our fi rst
50 years, our journey is likely just beginning.
CELEBRATING OUR FIRST 50 YEARS.
FOCUSED ON OUR NEXT 50 YEARS.
COMING FULL CIRCLE
THE NEXT CHAPTER
By 2001, Fastenal had 1,000-plus stores spanning all 50 states, but most
of them were better suited for outside sales than walk-in business. A
dramatic transformation began in 2002 with the launch of the Customer
Service Project, better known as CSP. It involved relocating stores to
more prominent locations, shifting inventory from the hubs to the stores,
creating store front rooms with open fl oor plans and retail fi xtures, and
streamlining systems to speed up invoicing. It all added up to faster
service and a much more inviting customer experience.
AN EXTREME STORE MAKEOVER
FSB IS IN SESSION
Opening hundreds of new stores meant developing thousands of employees
to run them. … Enter the “Devos” (aka the Development Team), a group of
seasoned store managers tasked with traveling the country to train new
team members in store back rooms, distribution centers, and other makeshift
classrooms. In the late ‘90s we took our training efforts to the next level by
developing a full-fl edged corporate university, the Fastenal School of Business
(FSB). Launched in 1999 with just two classes, FSB later merged with the Devos
to provide an ever-expanding offering of courses via regional campuses and, in
recent years, a robust virtual campus.
Sioux Falls, South Dakota Fastenal store

2016 ANNUAL REPORT
JAMES C. JANSEN
Executive Vice President - Manufacturing
HOLDEN LEWIS
Executive Vice President and
Chief Financial Officer
LELAND J. HEIN
Senior Executive Vice President - Sales
SHERYL A. LISOWSKI
Controller, Chief Accounting Officer,
and Treasurer
DANIEL L. FLORNESS
President and Chief Executive Officer
WILLIAM J. DRAZKOWSKI
Executive Vice President -
National Accounts Sales
EXECUTIVE OFFICER
S
ANNUAL
MEETING
The annual meeting of shareholders
will be held at 10:00 a.m., central
time, April 25, 2017, at our home
office located at 2001 Theurer
Boulevard, Winona, Minnesota.
HOME
OFFICE
Fastenal Company
2001 Theurer Boulevard
Winona, Minnesota 55987-0978
Phone: (507) 454-5374
Fax: (507) 453-8049
LEGAL
COUNSEL
INDEPENDENT
REGISTERED PUBLIC
ACCOUNTING FIRM
Faegre Baker Daniels LLP
Minneapolis, Minnesota
KPMG LLP
Minneapolis, Minnesota
FORM
10-K
TRANSFER
AGENT
A copy of our 2016 Annual Report
on Form 10-K to the Securities and
Exchange Commission is available
without charge to shareholders
upon written request to internal
audit at the address of our home
office listed on this page.
Copies of our latest press releases,
unaudited supplemental company
information, and monthly sales
information are available at:
http://investor.fastenal.com.
Wells Fargo Bank, N.A.
Minneapolis, Minnesota
CORPOR
ATE INFORM
ATIO
N
MICHAEL J. DOLAN
Self-Employed Business Consultant,
Retired Executive Vice President and
Chief Operating Officer,
The Smead Manufacturing Company
SCOTT A. SATTERLEE
Retired President of North America
Surface Transportation Division, C.H.
Robinson Worldwide, Inc.
RITA J. HEISE
Self-Employed Business Consultant,
Retired Corporate Vice President and
Chief Information Officer of
Cargill, Incorporated
STEPHEN L. EASTMAN
President of the Parts, Garments,
and Accessories Division of
Polaris Industries Inc.
(recreational vehicle manufacturer)
DANIEL L. JOHNSON
President and Chief Executive Officer of
M.A. Mortenson Company (family owned
construction company)
REYNE K. WISECUP
DARREN R. JACKSON
Retired Chief Executive Officer,
Advance Auto Parts, Inc.
WILLARD D. OBERTON
Chairman of the Board, Retired President
and Chief Executive Officer,
Fastenal Company
MICHAEL J. ANCIUS
Director of Strategic Planning, Financing,
and Taxation, Kwik Trip, Inc.
(retail convenience store operator)DIRECTOR
S
DANIEL L. FLORNESS
NICHOLAS J. LUNDQUIST
Senior Executive Vice President -
Operations
GARY A. POLIPNICK
Executive Vice President -
FAST Solutions®
REYNE K. WISECUP
Senior Executive Vice President -
Human Resources
JEFFERY M. WATTS
Executive Vice President -
International Sales
TERRY M. OWEN
Senior Executive Vice President -
Sales Operations
JOHN L. SODERBERG
Executive Vice President -
Information Technology
CHARLES S. MILLER
Executive Vice President - Sales

2016
ANNUAL
REPO
RT
9705201 2016 Annual Report | 01.17 KS | Printed in the USA
