Attached files
| file | filename |
|---|---|
| EX-99.1 - EXHIBIT 99.1 - Prestige Consumer Healthcare Inc. | exhibit991fy17-q3earningsr.htm |
| 8-K - 8-K - Prestige Consumer Healthcare Inc. | a8-kpressreleasedecember20.htm |

Exhibit 99.2
This presentation contains certain “forward-looking” statements within the meaning of the Private Securities Litigation Reform Act of 1995, such
as statements regarding the Company’s expected financial performance, including revenue growth, adjusted EPS, and adjusted free cash flow;
the impact of the Fleet acquisition on revenues; the timing of the Fleet integration; the Company’s expected leverage and ability to meet
financial covenants; the expected growth and market position of the acquired Fleet brands; the impact of the Fleet acquisition on the Company’s
brand-building and product development initiatives; the ability to achieve synergies from the Fleet acquisition; and the Company’s ability to
leverage the Fleet manufacturing facility and R&D resources. Words such as “trend,” “continue,” “will,” “expect,” “project,” “anticipate,” “likely,”
“estimate,” “may,” “should,” “could,” “would,” and similar expressions identify forward-looking statements. Such forward-looking statements
represent the Company’s expectations and beliefs and involve a number of known and unknown risks, uncertainties and other factors that may
cause actual results to differ materially from those expressed or implied by such forward-looking statements. These factors include, among
others, general economic and business conditions, regulatory matters, competitive pressures, difficulties successfully integrating the Fleet
brands, manufacturing facility and R&D resources, supplier issues, unexpected costs or liabilities, disruptions resulting from the integration of
Fleet, and other risks set forth in Part I, Item 1A. Risk Factors in the Company’s Annual Report on Form 10-K for the year ended March 31, 2016
and in Part II, Item 1A. Risk Factors in the Company’s Quarterly Report on Form 10-Q for the quarter ended December 31, 2016. You are
cautioned not to place undue reliance on these forward-looking statements, which speak only as of the date this presentation. Except to the
extent required by applicable law, the Company undertakes no obligation to update any forward-looking statement contained in this
presentation, whether as a result of new information, future events, or otherwise.
All adjusted GAAP numbers presented are footnoted and reconciled to their closest GAAP measurement in the attached reconciliation schedule
or in our earnings release in the “About Non-GAAP Financial Measures” section.
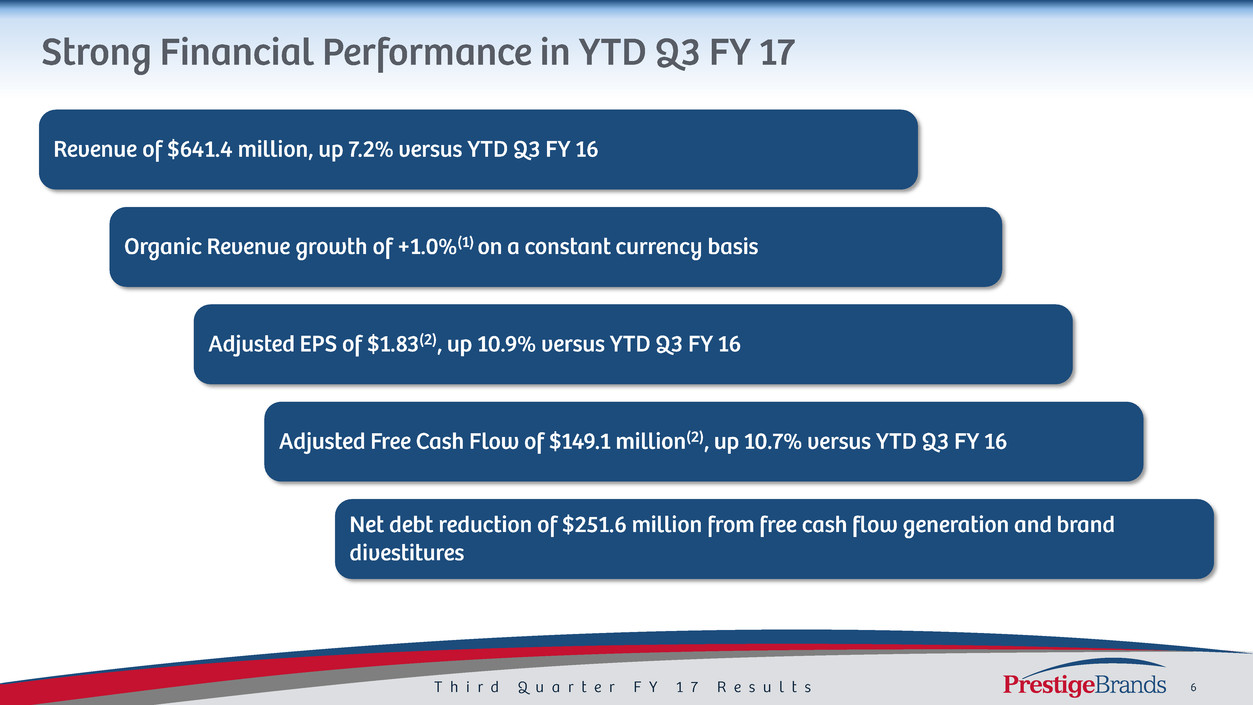
Q3 Revenue of $216.8 million, up 8.3% versus PY Q3
— Organic growth of 2.8%(1) on a constant currency basis
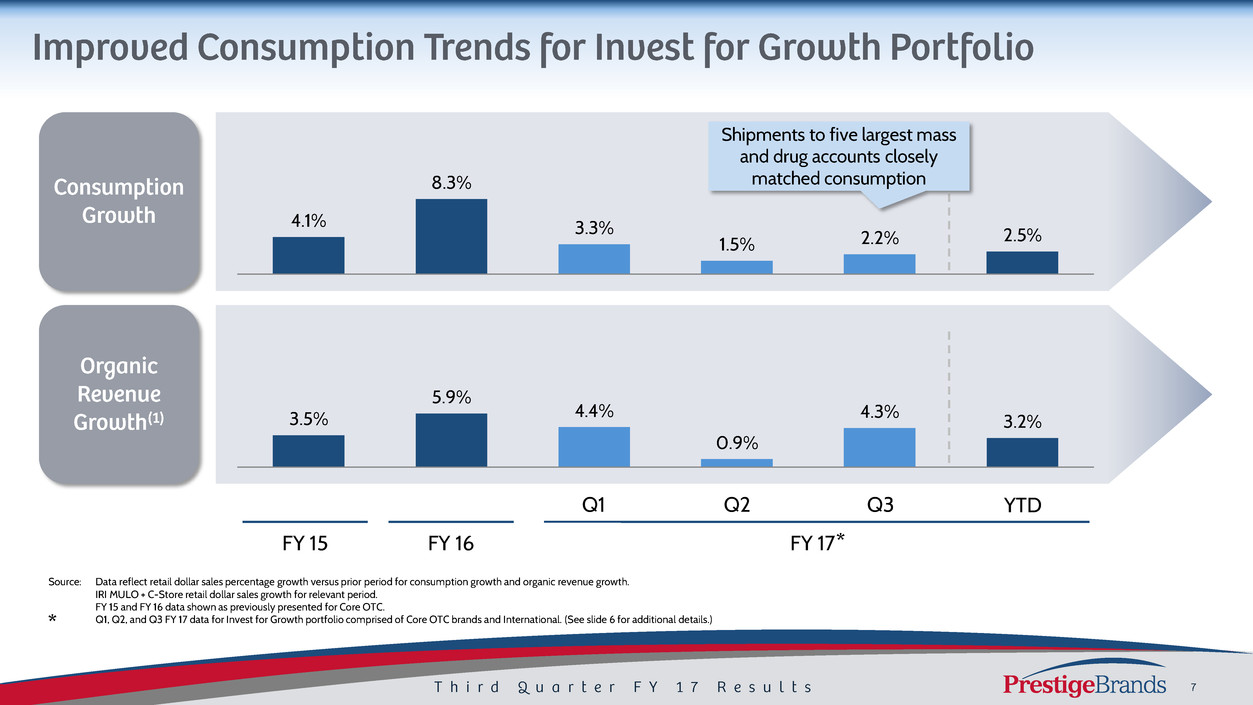
— Revenue growth of 4.3%(1) for Invest for Growth* portfolio
— International revenue up 6.5% in Q3 with particular strength in Care Pharma
Gross Margin of 57.5% in line with Q2 and expectations
Adjusted EPS of $0.61(2), up 15.1% versus PY Q3
Strong Adjusted Free Cash Flow of $49.6 million(2), above the PY Q3 of $45.8 million
— Leverage of 4.3x(3) compared to 5.0x at the beginning of FY 17
Successfully completed divestiture of three additional Manage for Cash brands
Closed previously announced C.B. Fleet transaction on January 26th, 2017 and financed primarily with Senior Secured
Incremental Term Loan
Invest for Growth portfolio comprised of Core OTC brands and International; reported on a constant currency basis. Core OTC brands reflect: Monistat (after Q2 FY 16), BC/Goody’s, Clear Eyes, Dramamine, Debrox, Chloraseptic, Luden’s, Little Remedies, Compound
W, Nix (after Q2 FY 16), Beano, Efferdent and The Doctor’s IRI multi-outlet + C-Store retail dollar sales for relevant period. International includes Canadian consumption for leading retailers, and Australia/ROW shipment data as a proxy for consumption. *
FY 17
Source: Data reflect retail dollar sales percentage growth versus prior period for consumption growth and organic revenue growth.
IRI MULO + C-Store retail dollar sales growth for relevant period.
FY 15 and FY 16 data shown as previously presented for Core OTC.
Q1, Q2, and Q3 FY 17 data for Invest for Growth portfolio comprised of Core OTC brands and International. (See slide 6 for additional details.)
FY 15
4.1%
8.3%
3.3%
1.5% 2.2% 2.5%
3.5%
5.9%
4.4%
0.9%
4.3% 3.2%
Q1
*
*
Q2 Q3
FY 16
Shipments to five largest mass
and drug accounts closely
matched consumption
YTD
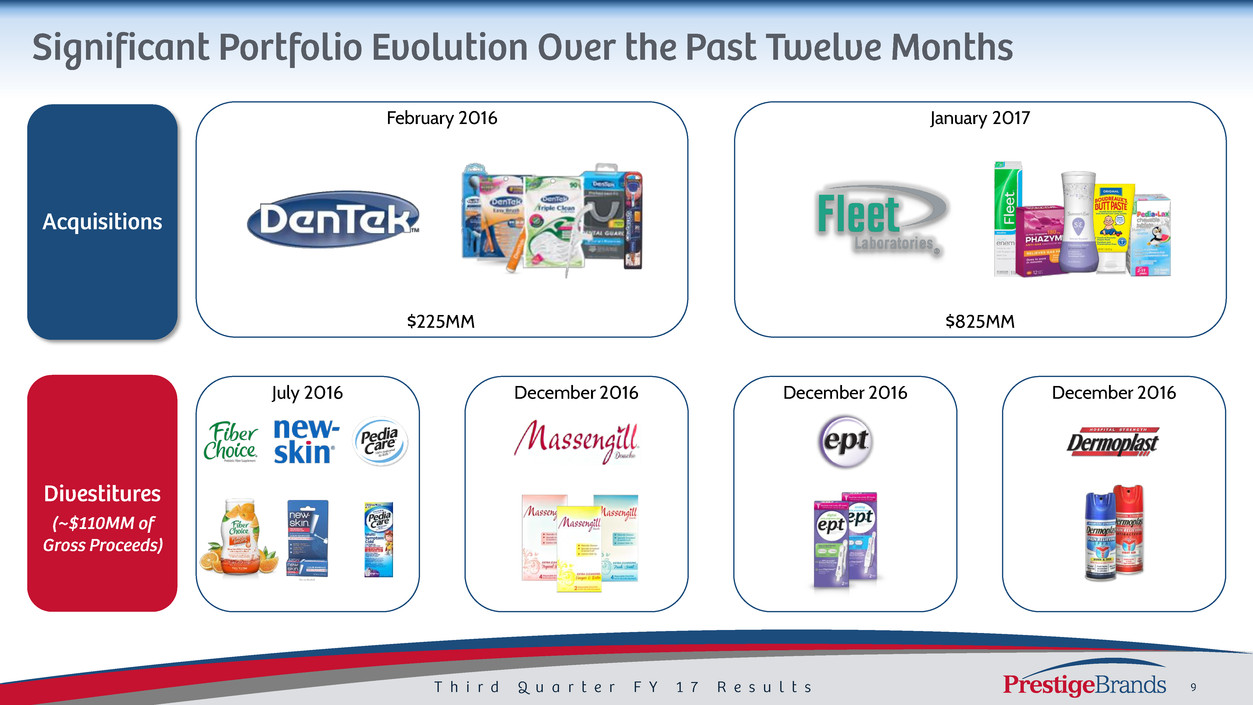
July 2016 December 2016 December 2016 December 2016
February 2016 January 2017
* Announcement date
$225MM $825MM
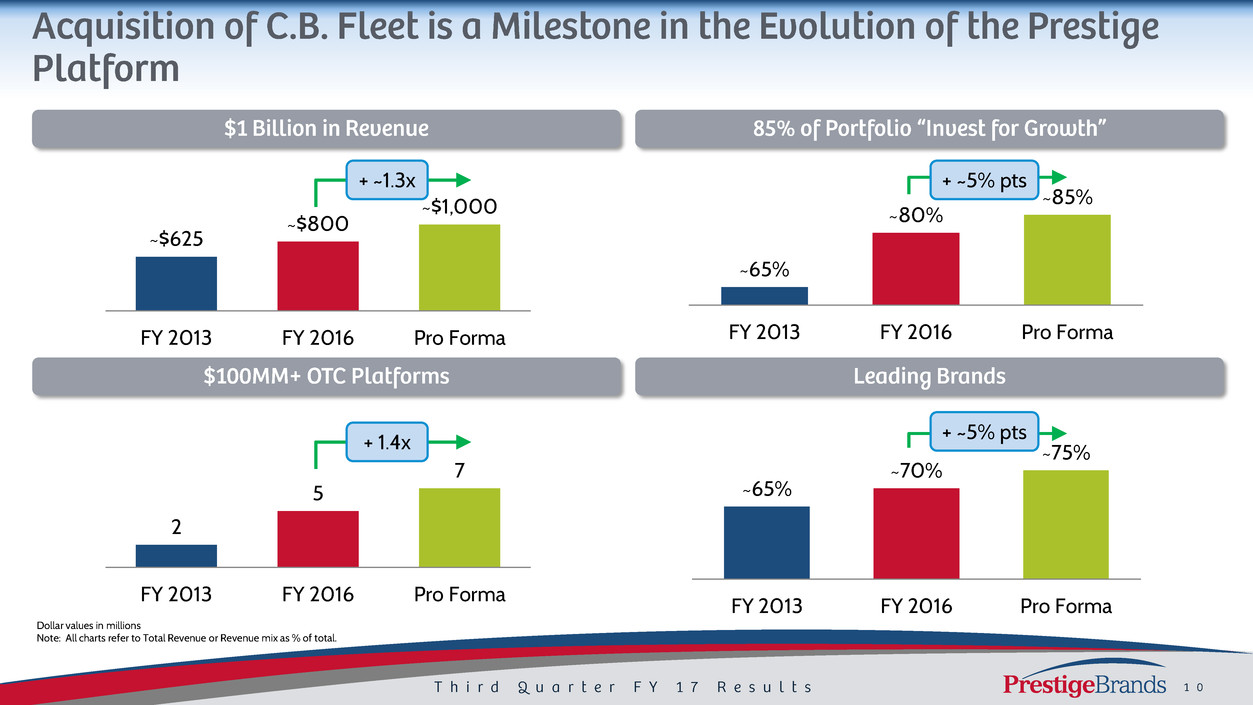
~$625
~$800
~$1,000
FY 2013 FY 2016 Pro Forma
~65%
~80%
~85%
FY 2013 FY 2016 Pro Forma
~65%
~70%
~75%
FY 2013 FY 2016 Pro Forma
+ ~1.3x + ~5% pts
+ ~5% pts
2
5
7
FY 2013 FY 2016 Pro Forma
Dollar values in millions
Note: All charts refer to Total Revenue or Revenue mix as % of total.
+ 1.4x
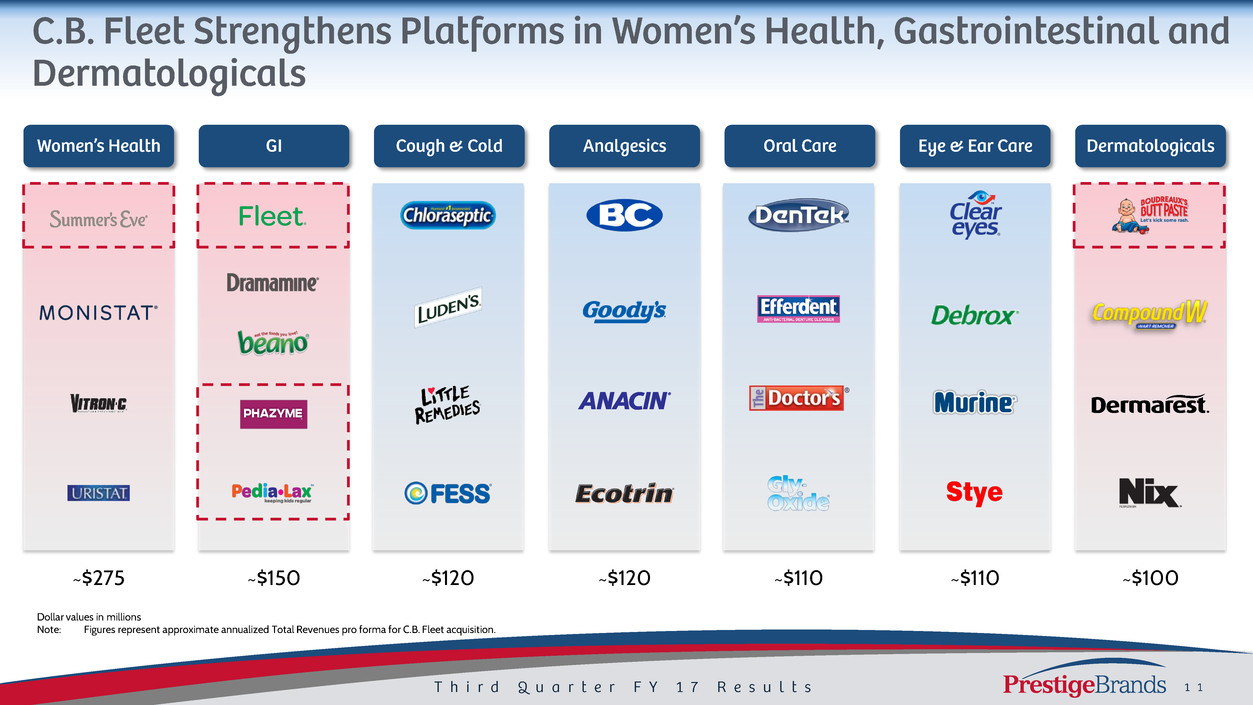
~$275 ~$120 ~$120 ~$110 ~$110
Dollar values in millions
Note: Figures represent approximate annualized Total Revenues pro forma for C.B. Fleet acquisition.
~$100 ~$150
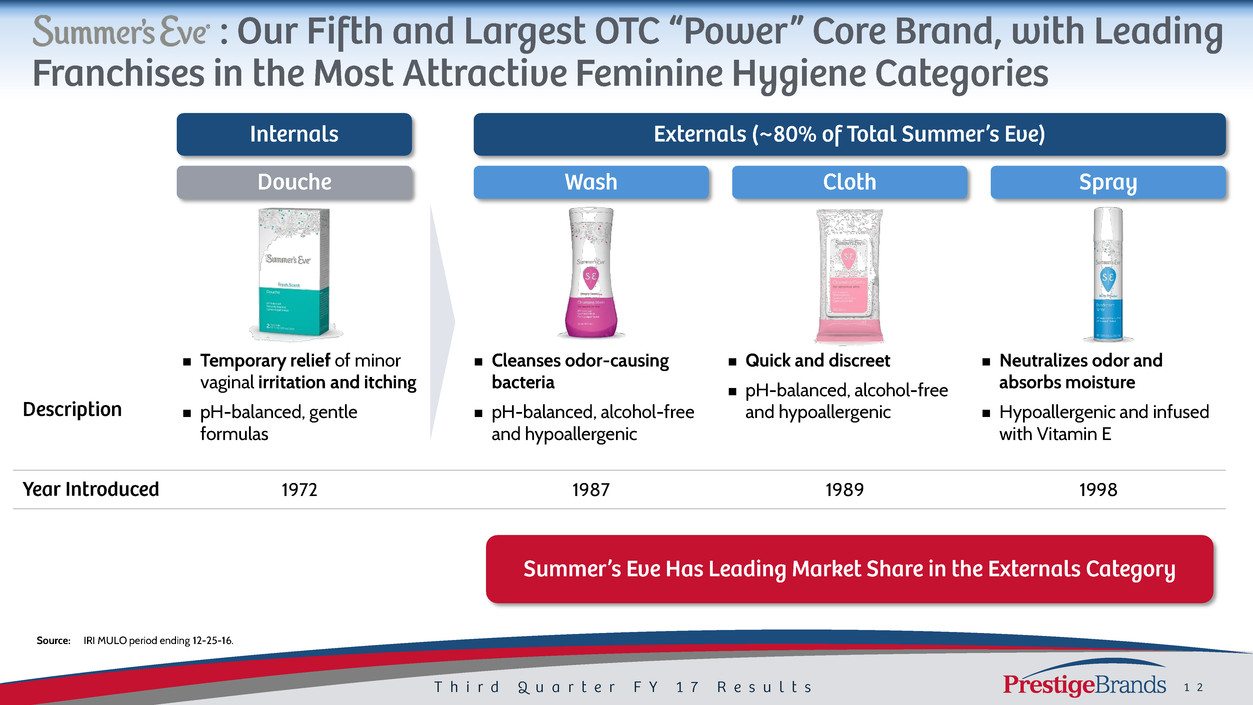
Temporary relief of minor
vaginal irritation and itching
pH-balanced, gentle
formulas
Cleanses odor-causing
bacteria
pH-balanced, alcohol-free
and hypoallergenic
Quick and discreet
pH-balanced, alcohol-free
and hypoallergenic
Neutralizes odor and
absorbs moisture
Hypoallergenic and infused
with Vitamin E
1972 1987 1989 1998
Source: IRI MULO period ending 12-25-16.
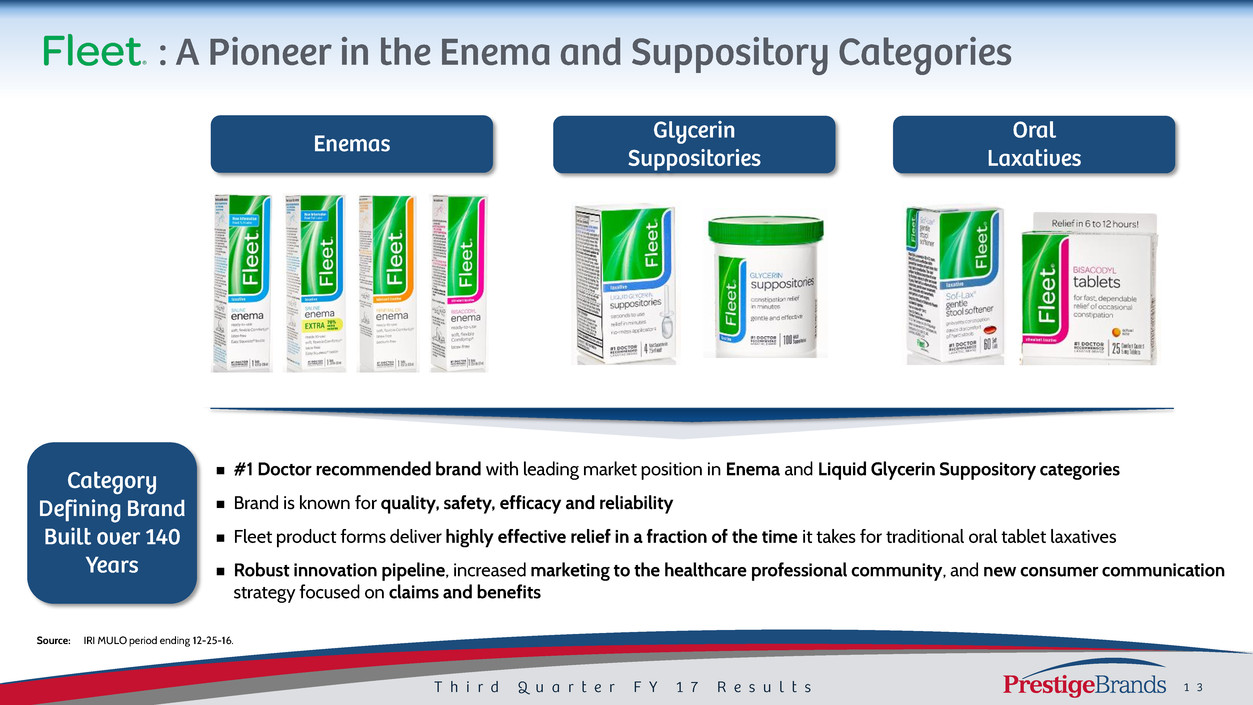
#1 Doctor recommended brand with leading market position in Enema and Liquid Glycerin Suppository categories
Brand is known for quality, safety, efficacy and reliability
Fleet product forms deliver highly effective relief in a fraction of the time it takes for traditional oral tablet laxatives
Robust innovation pipeline, increased marketing to the healthcare professional community, and new consumer communication
strategy focused on claims and benefits
Source: IRI MULO period ending 12-25-16.
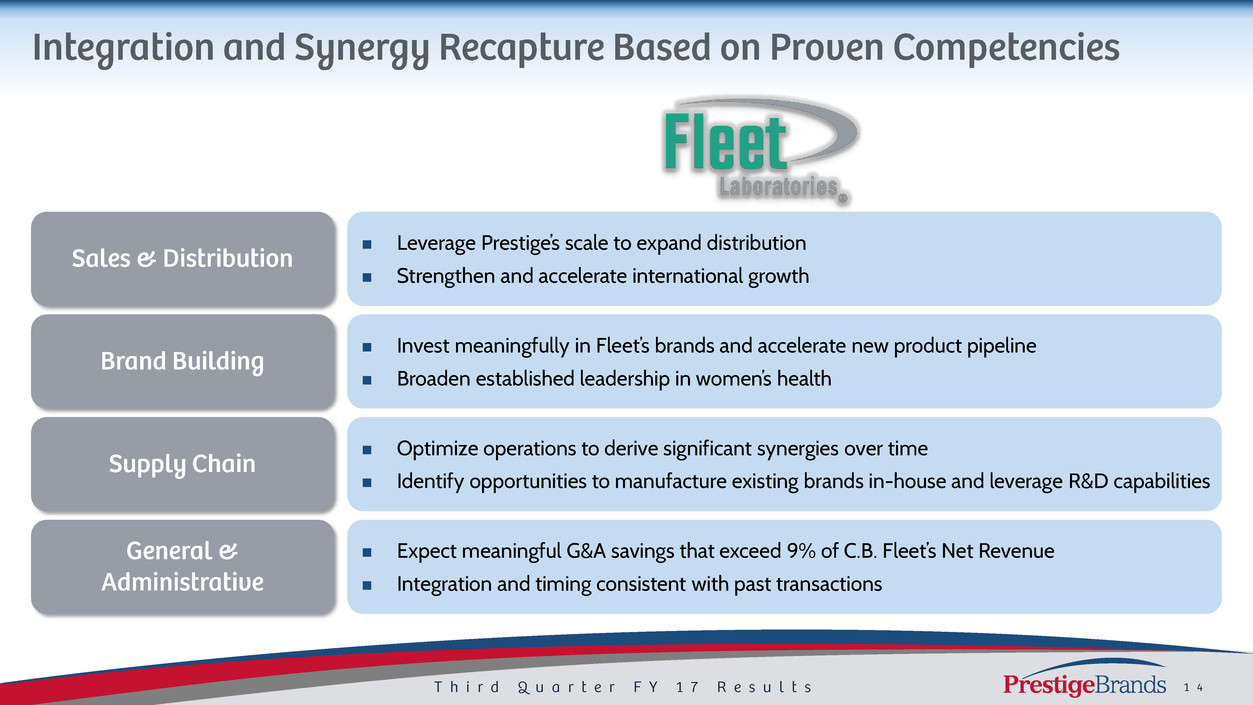
Leverage Prestige’s scale to expand distribution
Strengthen and accelerate international growth
Invest meaningfully in Fleet’s brands and accelerate new product pipeline
Broaden established leadership in women’s health
Optimize operations to derive significant synergies over time
Identify opportunities to manufacture existing brands in-house and leverage R&D capabilities
Expect meaningful G&A savings that exceed 9% of C.B. Fleet’s Net Revenue
Integration and timing consistent with past transactions

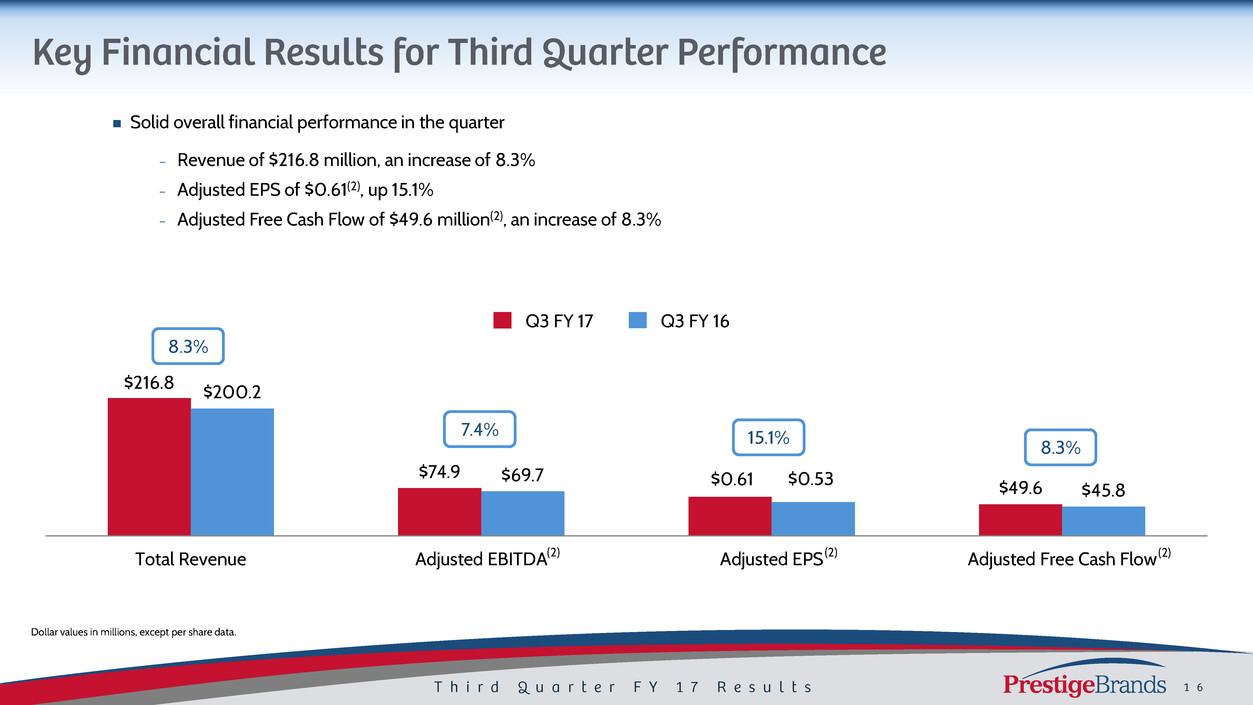
Solid overall financial performance in the quarter
− Revenue of $216.8 million, an increase of 8.3%
− Adjusted EPS of $0.61(2), up 15.1%
− Adjusted Free Cash Flow of $49.6 million(2), an increase of 8.3%
$216.8
$74.9
$49.6
$200.2
$69.7
$45.8
Total Revenue Adjusted EBITDA Adjusted EPS Adjusted Free Cash Flow
Q3 FY 17 Q3 FY 16
8.3%
7.4% 15.1% 8.3%
$0.61 $0.53
(2) (2) (2)
Dollar values in millions, except per share data.
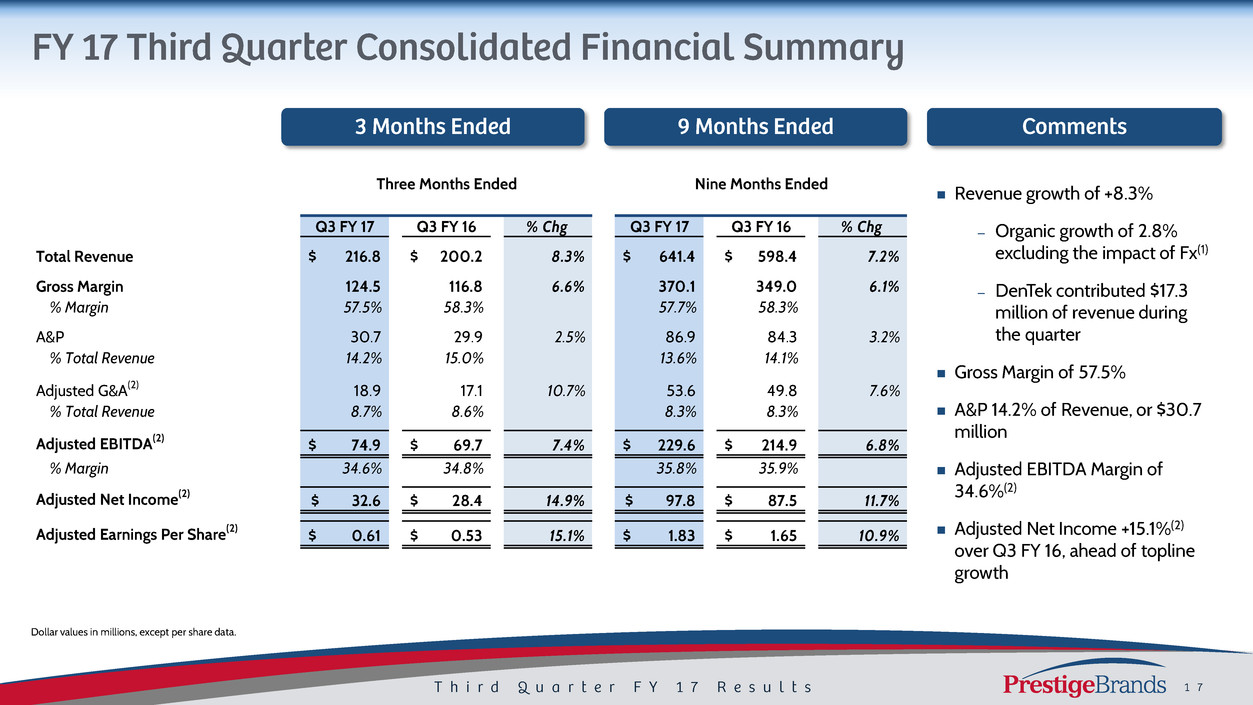
Revenue growth of +8.3%
– Organic growth of 2.8%
excluding the impact of Fx(1)
– DenTek contributed $17.3
million of revenue during
the quarter
Gross Margin of 57.5%
A&P 14.2% of Revenue, or $30.7
million
Adjusted EBITDA Margin of
34.6%(2)
Adjusted Net Income +15.1%(2)
over Q3 FY 16, ahead of topline
growth
Dollar values in millions, except per share data.
Three Months Ended Nine Months Ended
Q3 FY 17 Q3 FY 16 % Chg Q3 FY 17 Q3 FY 16 % Chg
Total Revenue 216.8$ 200.2$ 8.3% 641.4$ 598.4$ 7.2%
Gross Margin 124.5 116.8 6.6% 370.1 349.0 6.1%
% Margin 57.5% 58.3% 57.7% 58.3%
A&P 30.7 29.9 2.5% 86.9 84.3 3.2%
% Total Revenue 14.2% 15.0% 13.6% 14.1%
Adjusted G&A(2) 18.9 17.1 10.7% 53.6 49.8 7.6%
% Total Revenue 8.7% 8.6% 8.3% 8.3%
Adjusted EBITDA(2) 74.9$ 69.7$ 7.4% 229.6$ 214.9$ 6.8%
% Margin 34.6% 34.8% 35.8% 35.9%
Adjusted Net Income(2) 32.6$ 28.4$ 14.9% 97.8$ 87.5$ 11.7%
Adjusted Earnings Per Share(2) 0.61$ 0.53$ 15.1% 1.83$ 1.65$ 10.9%
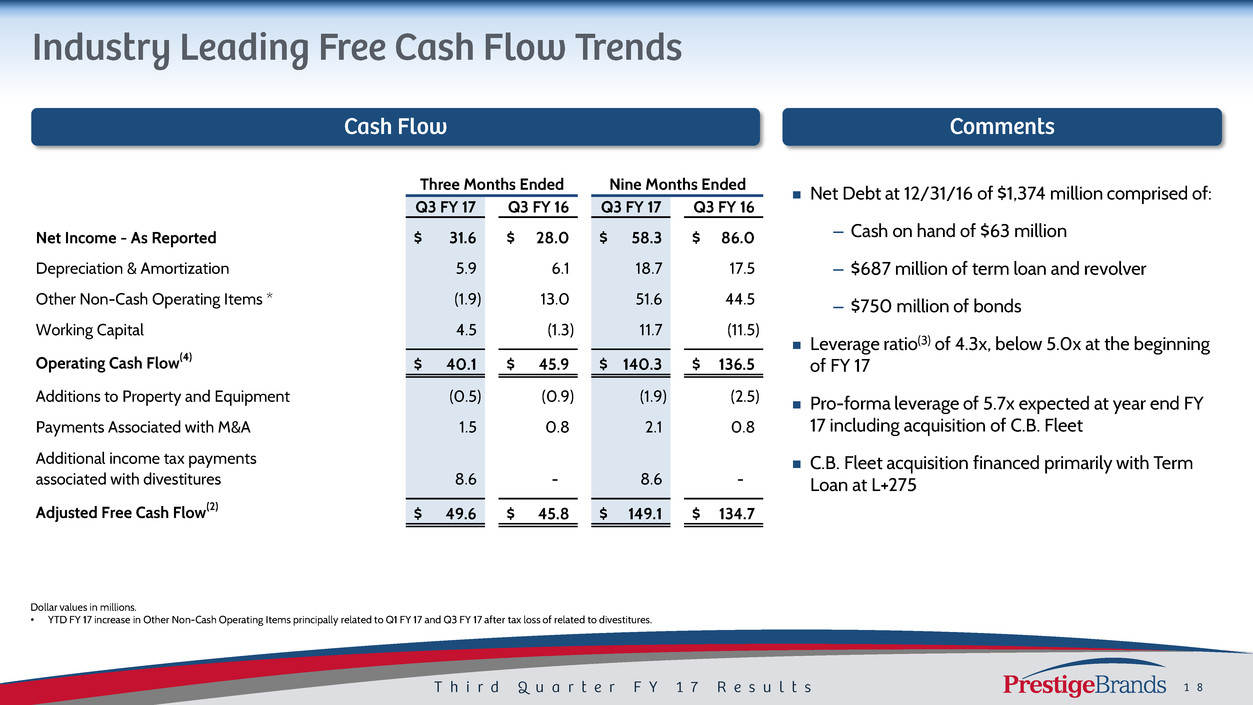
Net Debt at 12/31/16 of $1,374 million comprised of:
– Cash on hand of $63 million
– $687 million of term loan and revolver
– $750 million of bonds
Leverage ratio(3) of 4.3x, below 5.0x at the beginning
of FY 17
Pro-forma leverage of 5.7x expected at year end FY
17 including acquisition of C.B. Fleet
C.B. Fleet acquisition financed primarily with Term
Loan at L+275
Dollar values in millions.
• YTD FY 17 increase in Other Non-Cash Operating Items principally related to Q1 FY 17 and Q3 FY 17 after tax loss of related to divestitures.
Three Months Ended Nine Months Ended
Q3 FY 17 Q3 FY 16 Q3 FY 17 Q3 FY 16
Net Income - As Reported 31.6$ 28.0$ 58.3$ 86.0$
Depreciation & Amortization 5.9 6.1 18.7 17.5
Other Non-Cash Operating Items * (1.9) 13.0 51.6 44.5
Working Capital 4.5 (1.3) 11.7 (11.5)
Operating Cash Flow(4) 40.1$ 45.9$ 140.3$ 136.5$
Additions to Property and Equipment (0.5) (0.9) (1.9) (2.5)
Payments Associated with M&A 1.5 0.8 2.1 0.8
Additional income tax payments
associated with divestitures 8.6 - 8.6 -
Adjusted Free C sh Flow(2) 49.6$ 45.8$ 149.1$ 134.7$
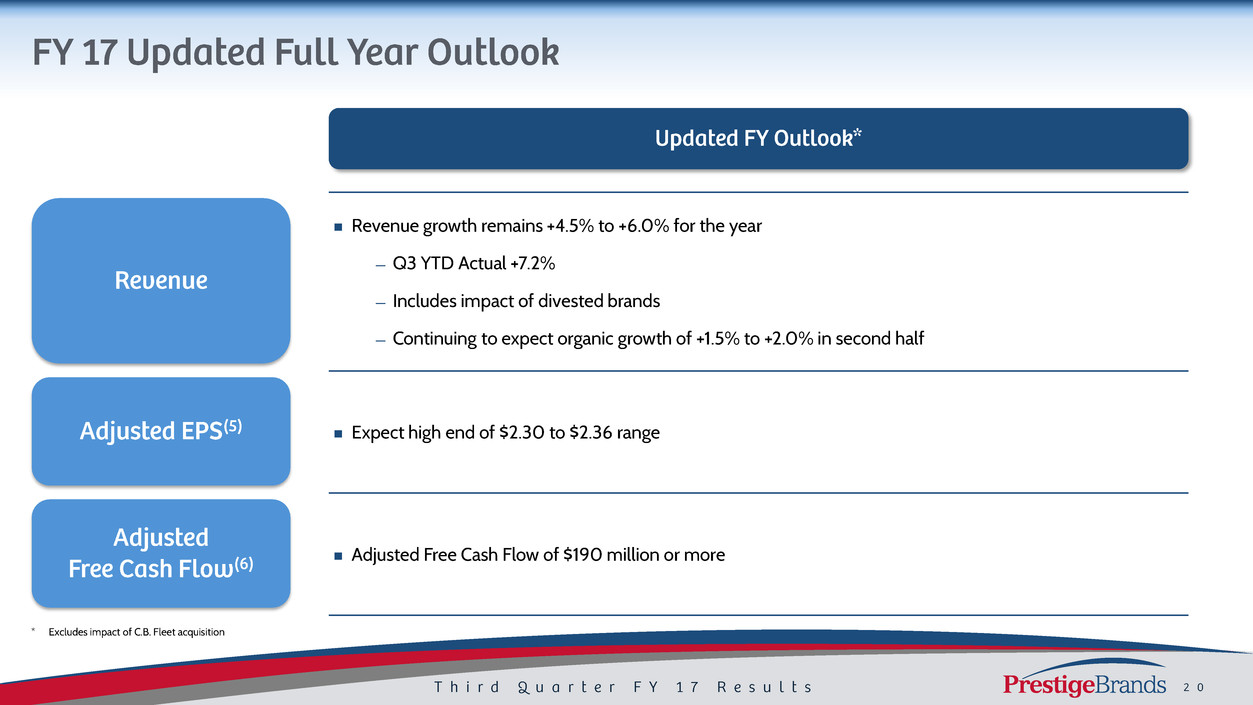
Revenue growth remains +4.5% to +6.0% for the year
— Q3 YTD Actual +7.2%
— Includes impact of divested brands
— Continuing to expect organic growth of +1.5% to +2.0% in second half
Expect high end of $2.30 to $2.36 range
Adjusted Free Cash Flow of $190 million or more
* Excludes impact of C.B. Fleet acquisition
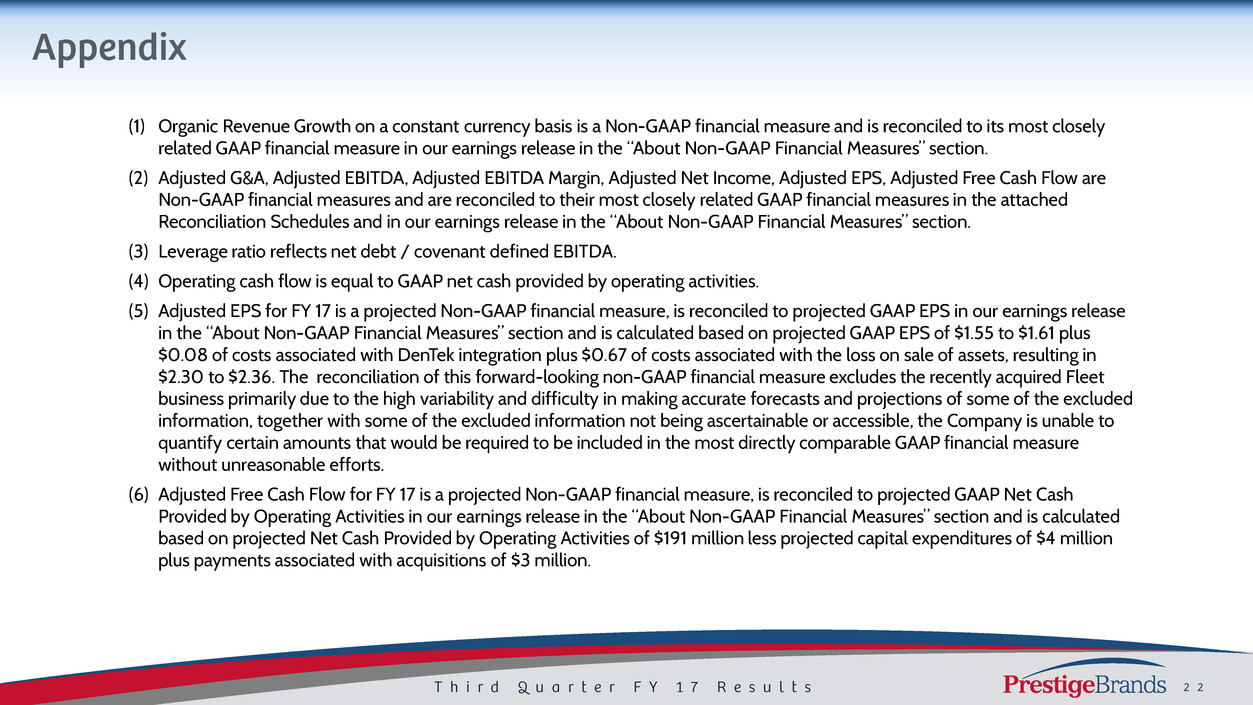
(1) Organic Revenue Growth on a constant currency basis is a Non-GAAP financial measure and is reconciled to its most closely
related GAAP financial measure in our earnings release in the “About Non-GAAP Financial Measures” section.
(2) Adjusted G&A, Adjusted EBITDA, Adjusted EBITDA Margin, Adjusted Net Income, Adjusted EPS, Adjusted Free Cash Flow are
Non-GAAP financial measures and are reconciled to their most closely related GAAP financial measures in the attached
Reconciliation Schedules and in our earnings release in the “About Non-GAAP Financial Measures” section.
(3) Leverage ratio reflects net debt / covenant defined EBITDA.
(4) Operating cash flow is equal to GAAP net cash provided by operating activities.
(5) Adjusted EPS for FY 17 is a projected Non-GAAP financial measure, is reconciled to projected GAAP EPS in our earnings release
in the “About Non-GAAP Financial Measures” section and is calculated based on projected GAAP EPS of $1.55 to $1.61 plus
$0.08 of costs associated with DenTek integration plus $0.67 of costs associated with the loss on sale of assets, resulting in
$2.30 to $2.36. The reconciliation of this forward-looking non-GAAP financial measure excludes the recently acquired Fleet
business primarily due to the high variability and difficulty in making accurate forecasts and projections of some of the excluded
information, together with some of the excluded information not being ascertainable or accessible, the Company is unable to
quantify certain amounts that would be required to be included in the most directly comparable GAAP financial measure
without unreasonable efforts.
(6) Adjusted Free Cash Flow for FY 17 is a projected Non-GAAP financial measure, is reconciled to projected GAAP Net Cash
Provided by Operating Activities in our earnings release in the “About Non-GAAP Financial Measures” section and is calculated
based on projected Net Cash Provided by Operating Activities of $191 million less projected capital expenditures of $4 million
plus payments associated with acquisitions of $3 million.
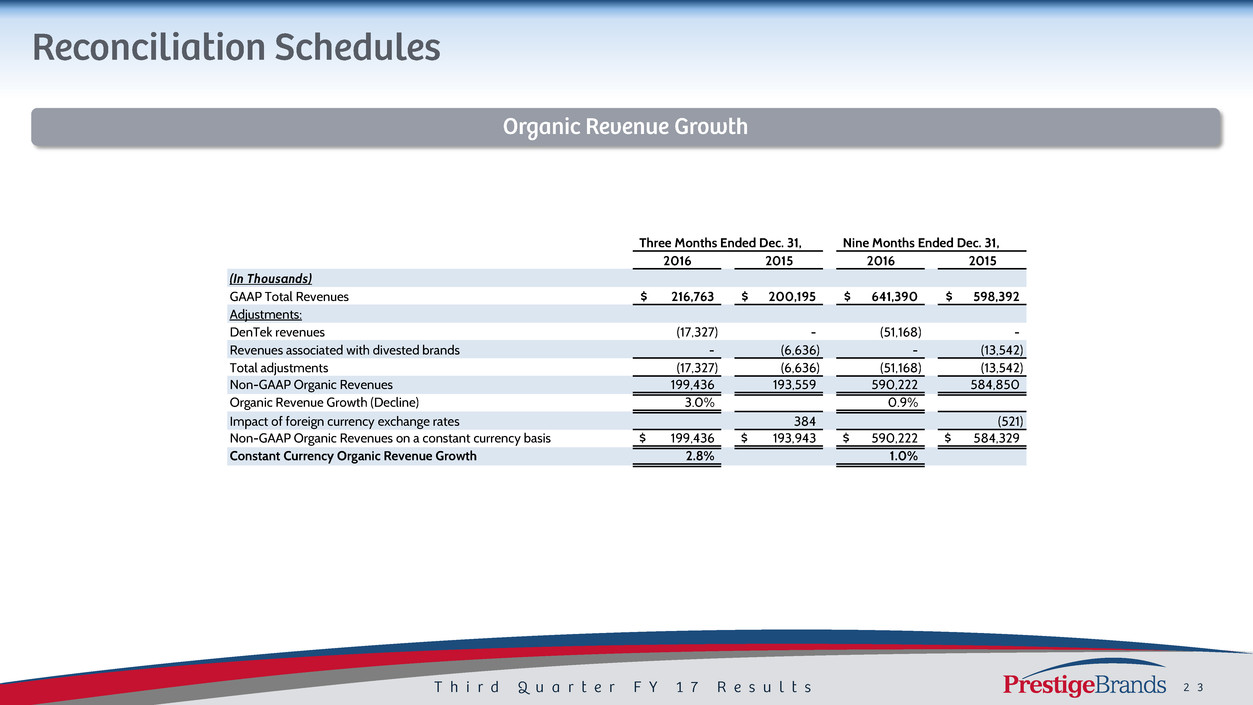
Three Months Ended Dec. 31, Nine Months Ended Dec. 31,
2016 2015 2016 2015
(In Thousands)
GAAP Total Revenues 216,763$ 200,195$ 641,390$ 598,392$
Adjustments:
DenTek revenues (17,327) - (51,168) -
Revenues associated with divested brands - (6,636) - (13,542)
Total adjustments (17,327) (6,636) (51,168) (13,542)
Non-GAAP Organic Revenues 199,436 193,559 590,222 584,850
Organic Revenue Growth (Decline) 3.0% 0.9%
Impact of foreign currency exchange rates 384 (521)
Non-GAAP Organic Revenues on a constant currency basis 199,436$ 193,943$ 590,222$ 584,329$
Constant Currency Organic Revenue Growth 2.8% 1.0%
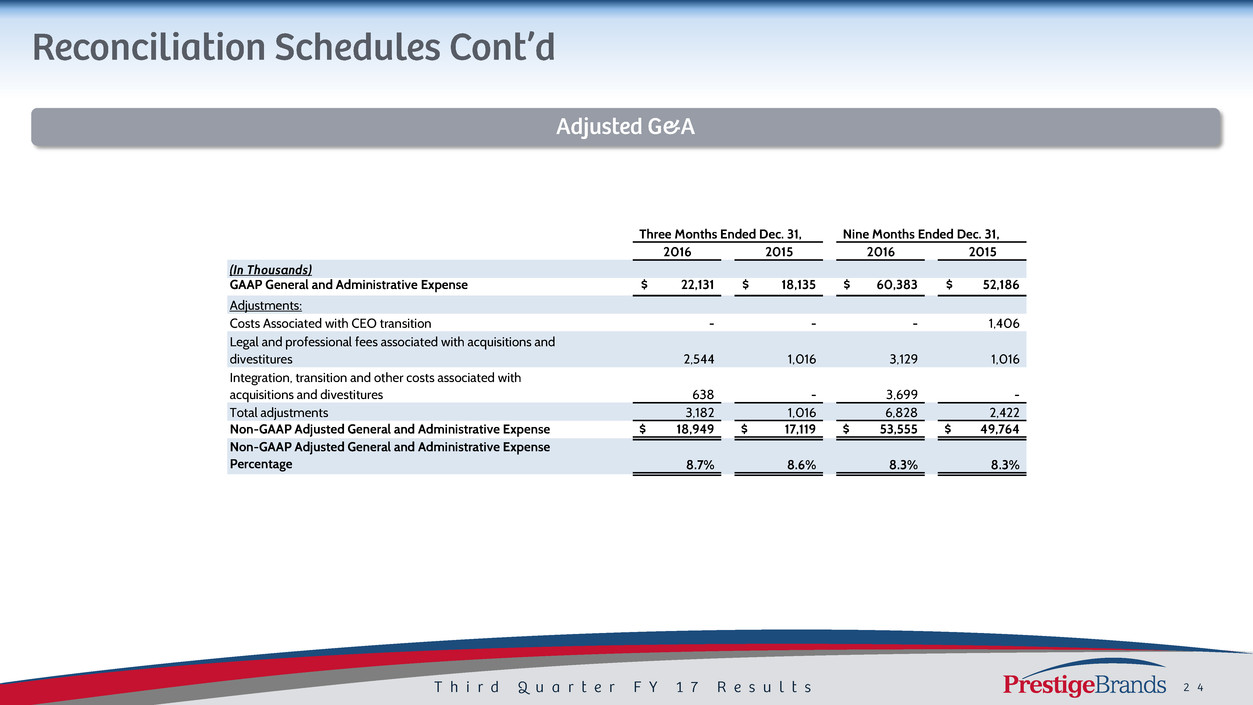
Three Months Ended Dec. 31, Nine Months Ended Dec. 31,
2016 2015 2016 2015
(In Thousands)
GAAP General and Administrative Expense 22,131$ 18,135$ 60,383$ 52,186$
Adjustments:
Costs Associated with CEO transition - - - 1,406
Legal and professional fees associated with acquisitions and
divestitures 2,544 1,016 3,129 1,016
Integration, transition and other costs associated with
acquisitions and divestitures 638 - 3,699 -
Total adjustments 3,182 1,016 6,828 2,422
Non-GAAP Adjusted General and Administrative Expense 18,949$ 17,119$ 53,555$ 49,764$
Non-GAAP Adjusted General and Administrative Expense
Percentage 8.7% 8.6% 8.3% 8.3%
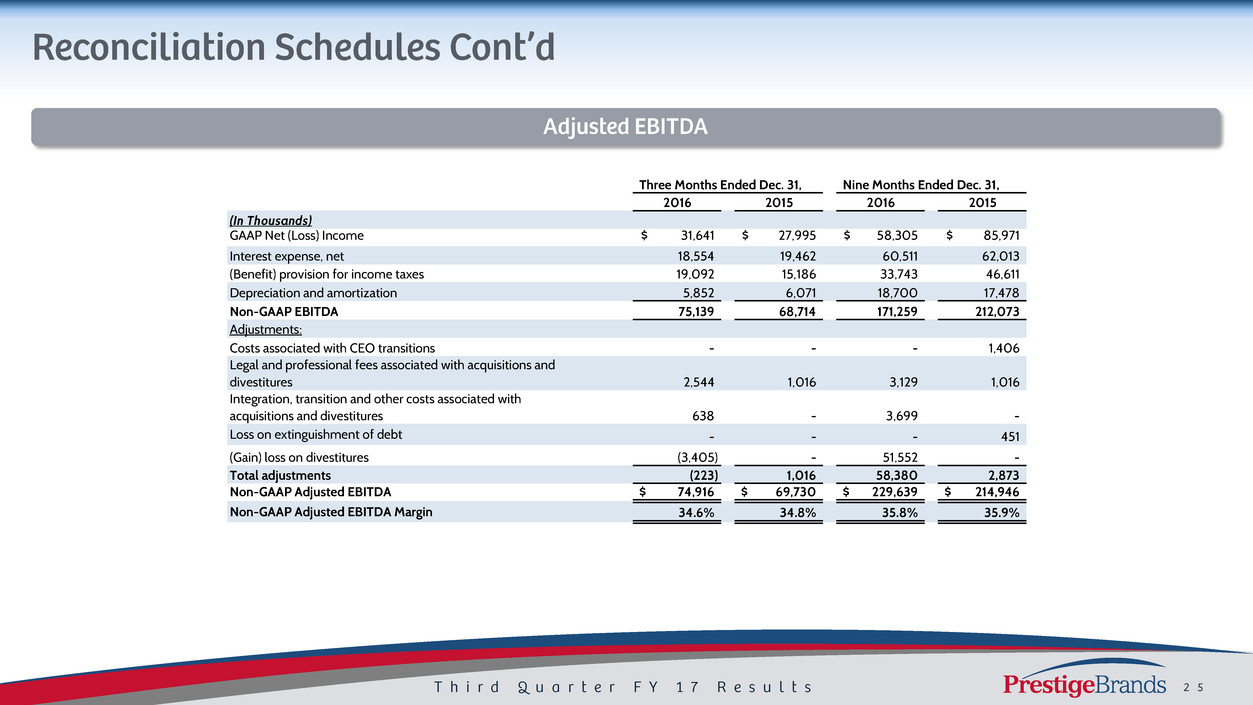
Three Months Ended Dec. 31, Nine Months Ended Dec. 31,
2016 2015 2016 2015
(In Thousands)
GAAP Net (Loss) Income 31,641$ 27,995$ 58,305$ 85,971$
Interest expense, net 18,554 19,462 60,511 62,013
(Benefit) provision for income taxes 19,092 15,186 33,743 46,611
Depreciation and amortization 5,852 6,071 18,700 17,478
Non-GAAP EBITDA 75,139 68,714 171,259 212,073
Adjustments:
Costs associated with CEO transitions - - - 1,406
Legal and professional fees associated with acquisitions and
divestitures 2,544 1,016 3,129 1,016
Integration, transition and other costs associated with
acquisitions and divestitures 638 - 3,699 -
Loss on extinguishment of debt - - - 451
(Gain) loss on divestitures (3,405) - 51,552 -
Total adjustments (223) 1,016 58,380 2,873
Non-GAAP Adjusted EBITDA 74,916$ 69,730$ 229,639$ 214,946$
Non-GAAP Adjusted EBITDA Margin 34.6% 34.8% 35.8% 35.9%
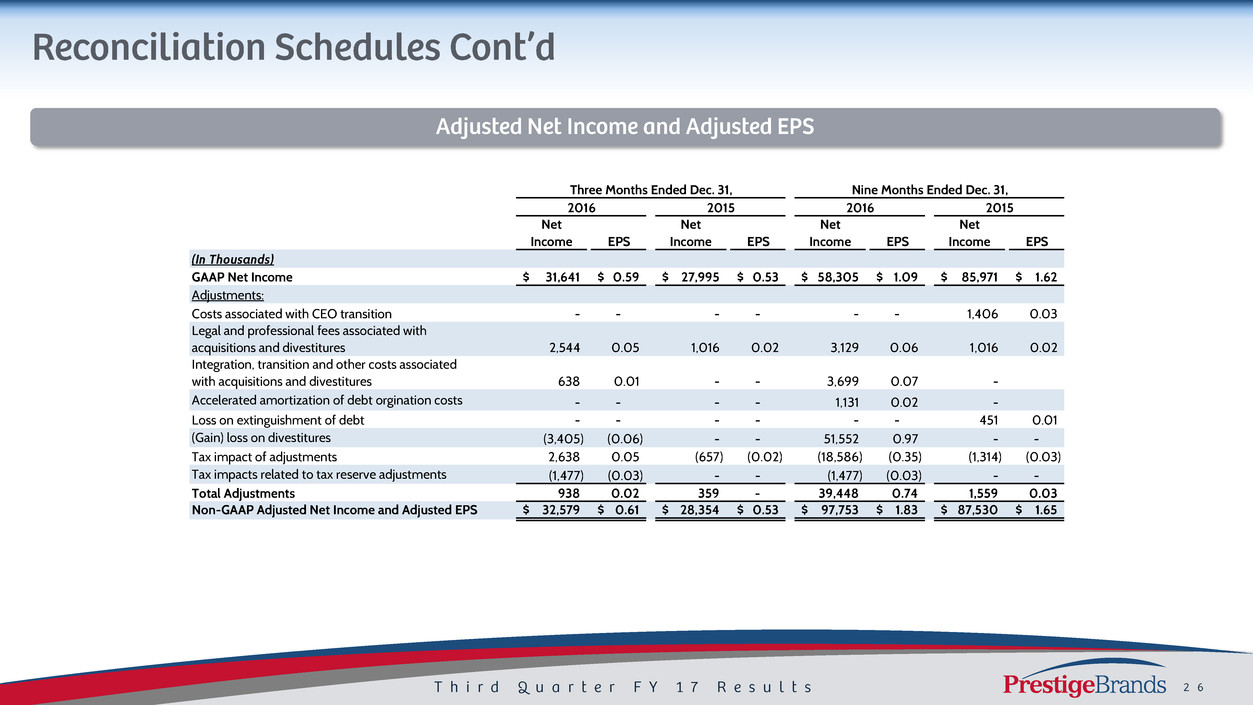
Three Months Ended Dec. 31, Nine Months Ended Dec. 31,
2016 2015 2016 2015
Net
Income EPS
Net
Income EPS
Net
Income EPS
Net
Income EPS
(In Thousands)
GAAP Net Income 31,641$ 0.59$ 27,995$ 0.53$ 58,305$ 1.09$ 85,971$ 1.62$
Adjustments:
Costs associated with CEO transition - - - - - - 1,406 0.03
Legal and professional fees associated with
acquisitions and divestitures 2,544 0.05 1,016 0.02 3,129 0.06 1,016 0.02
Integration, transition and other costs associated
with acquisitions and divestitures 638 0.01 - - 3,699 0.07 -
Accelerated amortization of debt orgination costs - - - - 1,131 0.02 -
Loss on extinguishment of debt - - - - - - 451 0.01
(Gain) loss on divestitures (3,405) (0.06) - - 51,552 0.97 - -
Tax impact of adjustments 2,638 0.05 (657) (0.02) (18,586) (0.35) (1,314) (0.03)
Tax impacts related to tax reserve adjustments (1,477) (0.03) - - (1,477) (0.03) - -
Total Adjustments 938 0.02 359 - 39,448 0.74 1,559 0.03
Non-GAAP Adjusted Net Income and Adjusted EPS 32,579$ 0.61$ 28,354$ 0.53$ 97,753$ 1.83$ 87,530$ 1.65$
Three Months Ended Dec. 31, Nine Months Ended Dec. 31,
2016 2015 2016 2015
(In Thousands)
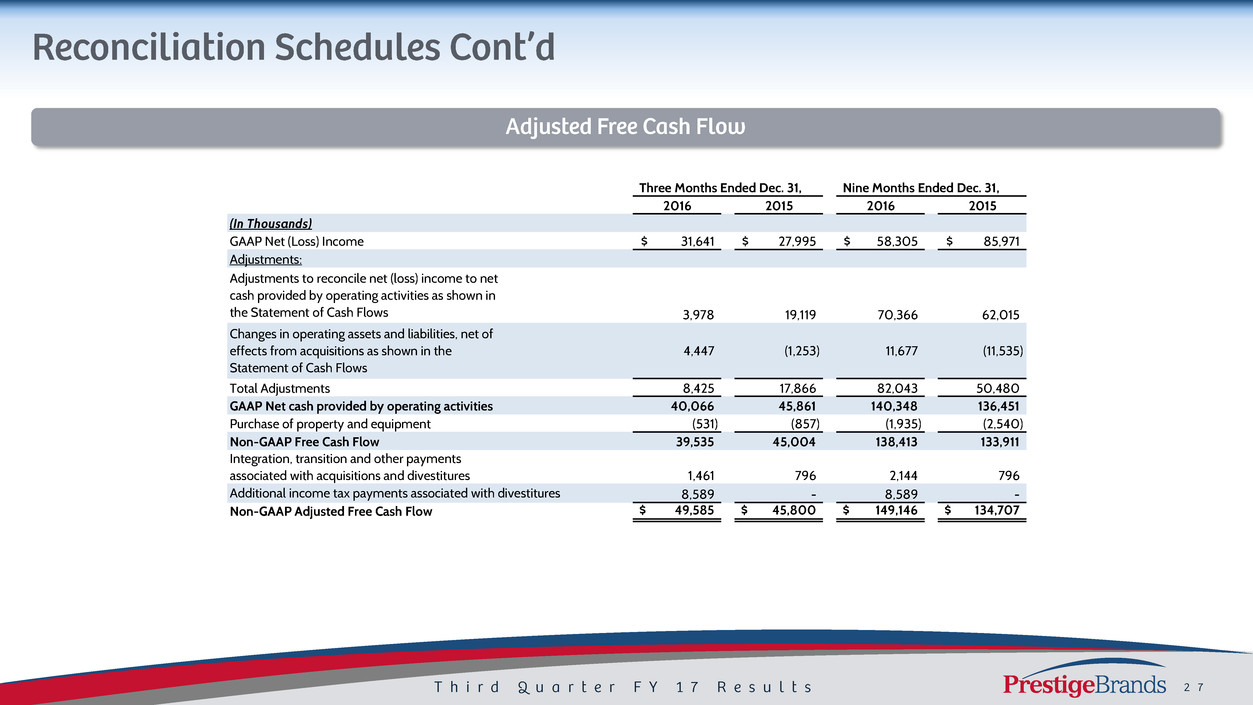
GAAP Net (Loss) Income 31,641$ 27,995$ 58,305$ 85,971$
Adjustments:
Adjustments to reconcile net (loss) income to net
cash provided by operating activities as shown in
the Statement of Cash Flows 3,978 19,119 70,366 62,015
Changes in operating assets and liabilities, net of
effects from acquisitions as shown in the
Statement of Cash Flows
4,447 (1,253) 11,677 (11,535)
Total Adjustments 8,425 17,866 82,043 50,480
GAAP Net cash provided by operating activities 40,066 45,861 140,348 136,451
Purchase of property and equipment (531) (857) (1,935) (2,540)
Non-GAAP Free Cash Flow 39,535 45,004 138,413 133,911
Integration, transition and other payments
associated with acquisitions and divestitures 1,461 796 2,144 796
Additional income tax payments associated with divestitures 8,589 - 8,589 -
Non-GAAP Adjusted Free Cash Flow 49,585$ 45,800$ 149,146$ 134,707$
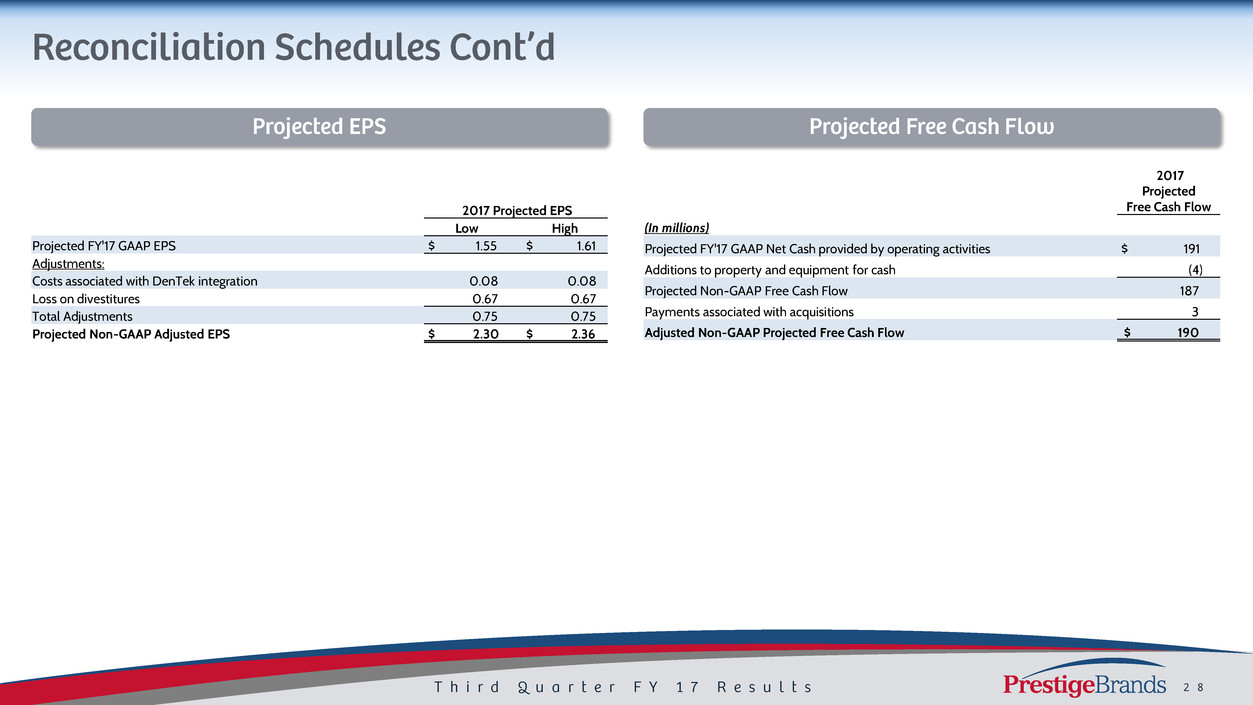
2017 Projected EPS
Low High
Projected FY'17 GAAP EPS $ 1.55 $ 1.61
Adjustments:
Costs associated with DenTek integration 0.08 0.08
Loss on divestitures 0.67 0.67
Total Adjustments 0.75 0.75
Projected Non-GAAP Adjusted EPS $ 2.30 $ 2.36
2017
Projected
Free Cash Flow
(In millions)
Projected FY'17 GAAP Net Cash provided by operating activities $ 191
Additions to property and equipment for cash (4)
Projected Non-GAAP Free Cash Flow 187
Payments associated with acquisitions 3
Adjusted Non-GAAP Projected Free Cash Flow $ 190
