Attached files
| file | filename |
|---|---|
| EX-99.1 - EX-99.1 - ESTERLINE TECHNOLOGIES CORP | d295761dex991.htm |
| 8-K - FORM 8-K - ESTERLINE TECHNOLOGIES CORP | d295761d8k.htm |
 Q1
2017 Supplemental Financial Information February 2, 2017
Exhibit 99.2 |
 1 This presentation may contain "forward-looking statements" within the meaning of the Private Securities Litigation
Reform Act of 1995. These statements relate to future
events or our future financial performance. In some cases, you
can identify forward-looking statements by terminology such as
“anticipate,” “believe,” “continue,” “could,” “estimate,” “expect,” “intend,” “may,” “might,” “plan,”
“potential,” “predict,” “should” or “will,” or the negative of such terms, or other comparable terminology. These forward-looking statements are only predictions based on the
current intent and expectations of the management of Esterline, are not
guarantees of future performance or actions, and involve risks
and uncertainties that are difficult to predict and may cause Esterline’s or its industry’s actual results, performance or achievements to be materially different from any future results, performance or achievements
expressed or implied by the forward-looking statements. Esterline's
actual results and the timing and outcome of events may differ
materially from those expressed in or implied by the forward-looking statements due to risks detailed in Esterline's public filings with the Securities and Exchange Commission including its most recent Transition
Report on Form 10-K.
This presentation also contains references to non-GAAP financial
information subject to Regulation G. The reconciliations
of each non-GAAP financial measure to its comparable GAAP measure as well as further information on management’s use of non-GAAP financial measures are included in Esterline’s press release dated February 2, 2017,
included as Exhibit 99.1 to Form 8-K filed with the SEC on
the same date, as well as in this presentation, including the
Appendix.
Q1 2017 Supplemental Financial Information |
 Q1
2017 Supplemental Financial Information Strategic Direction
2 Key Focus Areas A high-performing aerospace and defense company whose engaged employees deliver value through world-class products, services, and technologies. Profitable & Balanced Sales Growth Enterprise Excellence Leverage the Enterprise Employee Engagement Regulatory & Customer Compliance Q1 2017 Supplemental Financial Information |
 Q1
2017 Supplemental Financial Information Q1 2017 Financial
Results •
Sales of $458 million, up 3.7%*
– Organic sales increase $22 million • GAAP EPS of $0.72 (per diluted share) – Adjusted EPS of $0.82** • Free cash flow of $30 million** 3 * Comparison is to fiscal Q1 2016 ** Excludes certain discrete items; see Page 1 regarding non-GAAP financial measures.
Solid Start to Fiscal 2017 |
 Q1
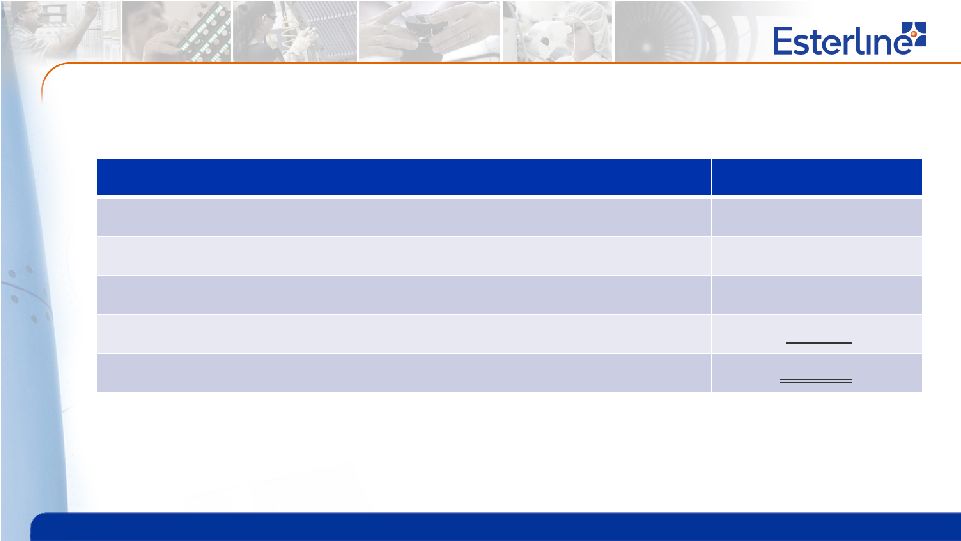
2017 Supplemental Financial Information Q1 2017 Year-over-Year
(YOY) Summary 4
Dollars in millions, except EPS
Q1 2017 Q1 2016 Change Sales $ 458 $ 441 $ 17 Gross Margin $ 144 $ 138 $ 6 - % of sales 31.5% 31.2% 0.3% Operating Earnings from Continuing Operations $ 30 $ 17 $ 13 - % of sales 6.5% 3.9% 2.6% Earnings from Continuing Operations $ 21 $ 10 $ 11 Earnings Per Diluted Share from Continuing Operations $ 0.72 $ 0.33 $ 0.39 |
 Q1
2017 Supplemental Financial Information Q1 2017 Sales Change
(YOY) Items
Sales Q1 2016 $ 441 • Foreign currency translation (8) • FX forward contract gain 3 • Sales volume 22 Q1 2017 $ 458 Dollars in millions 5 |
 Q1
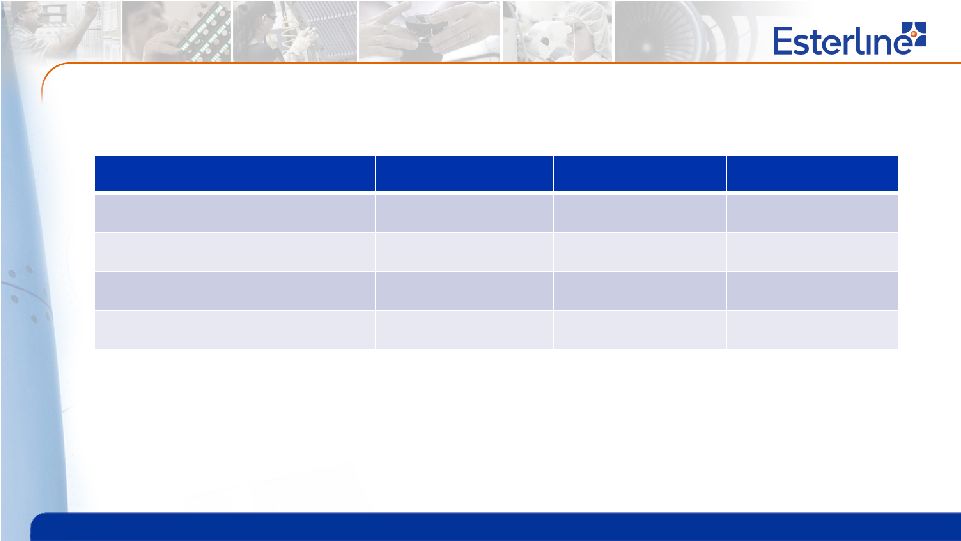
2017 Supplemental Financial Information Q1 2017 Segment Sales Change
(YOY) Total Change
Organic¹
FX Avionics & Controls 3% 3% <1% Sensors & Systems 10% 11% (1)% Advanced Materials (5)% (1)% (4)% Total 4% 5% (1)% ¹ Q1 2017 organic sales growth represents the total
reported increase within the company’s continuing operations less the impact of all foreign currency translation and hedging activities. 6 |
 Q1
2017 Supplemental Financial Information Q1 2017 Gross Margin Change
(YOY) Items
Gross Margin Q1 2016 $ 138 • Foreign currency translation (2) • FX forward contract gain 3 • Sales volume / mix 4 • Other 1 Q1 2017 $ 144 Dollars in millions 7 |
 Q1
2017 Supplemental Financial Information Q1 2017 Earnings
Adjustment 8
* See Page 1 regarding non-GAAP financial measures.
Dollars in millions, except EPS
Adjustments are net of tax
Earnings from Continuing Ops EPS GAAP $ 21 $ 0.72 • Compliance costs 2 0.08 • DAT integration costs 1 0.02 Adjusted * $ 24 $ 0.82 |
 Q1
2017 Supplemental Financial Information Q1 2017 Free Cash Flow
Reconciliation 9
* See Page 1 regarding non-GAAP financial measures.
Q1 2017 Q1 2016 Net Earnings $ 16 $ 5 • Depreciation and amortization (Depreciation of $14M and $12M in Q1 2017 and Q1 2016, respectively) 26 24 • Change in working capital
(A/R, Inventory, A/P) 23 23 • Other (20) (11) Cash flow from operations $ 45 $ 41 • Capital expenditures (15) (15) Free cash flow* $ 30 $ 26 Dollars in millions; GAAP results |
 Q1
2017 Supplemental Financial Information Q1 2017 EBITDA
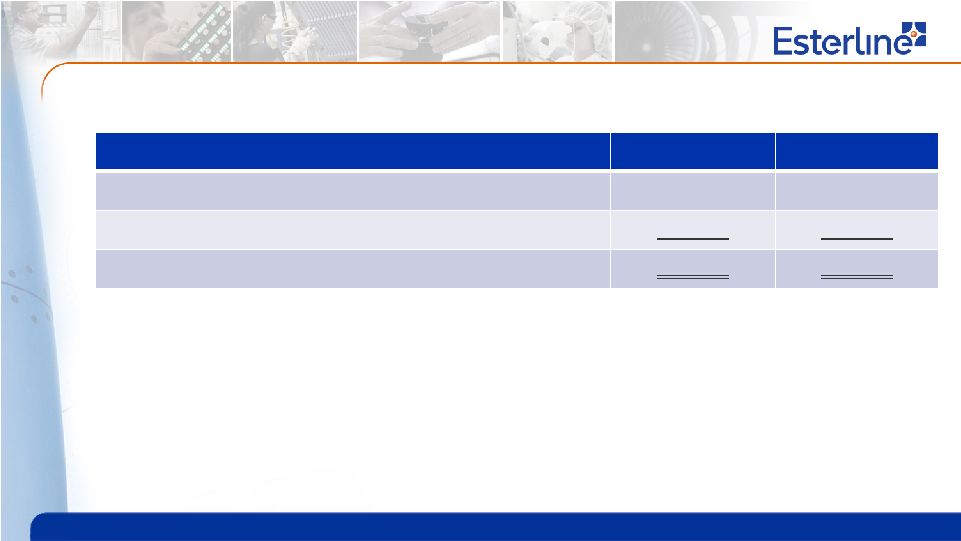
10 * See Page 1 regarding non-GAAP financial measures. Q1 2017 Q1 2016 Operating Earnings from Continuing Operations $ 30 $ 17 • Depreciation and amortization 25 24 EBITDA from Continuing Operations * $ 55 $ 41 Dollars in millions |
 Q1
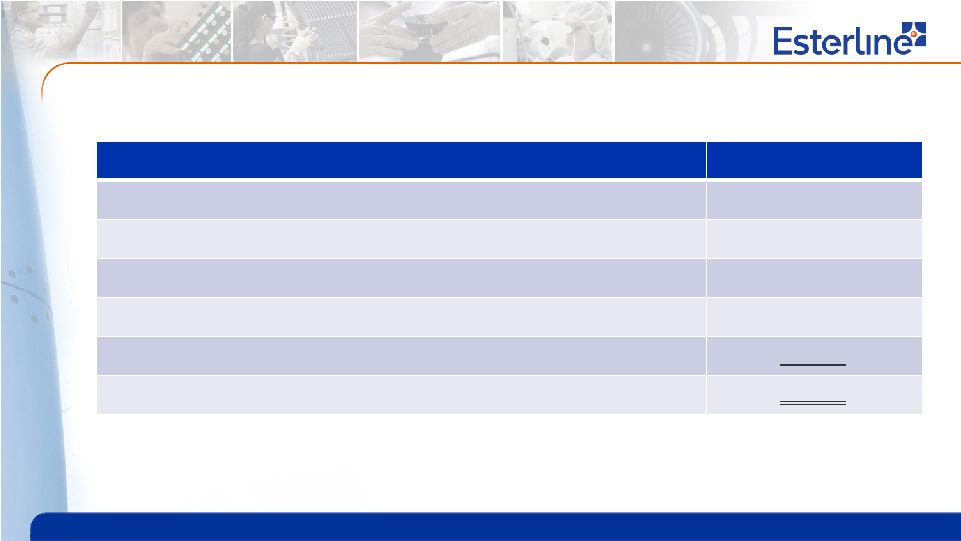
2017 Supplemental Financial Information 2017 Guidance
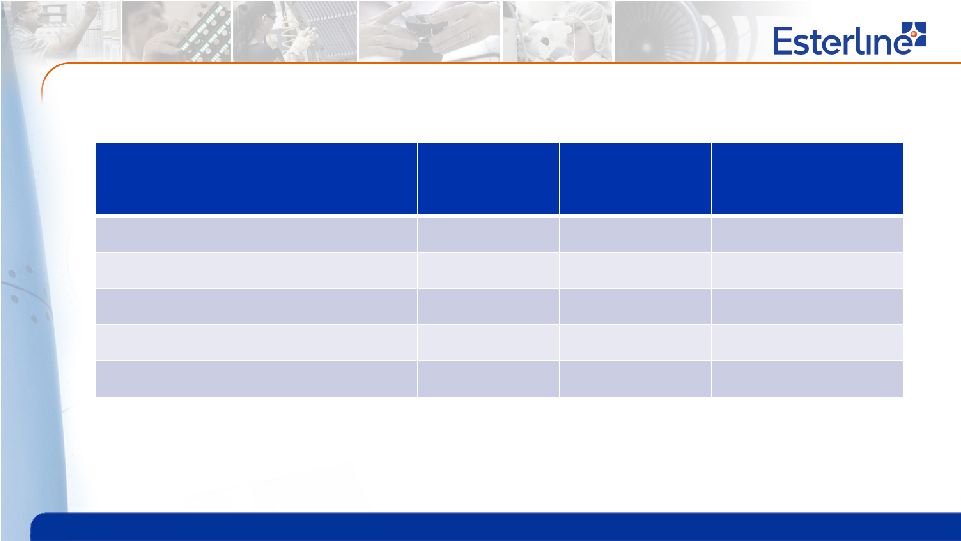
Guidance Sales $2.0B - $2.05B GAAP EPS (diluted, continuing ops) $4.30 - $4.70 Adjusted EPS* (diluted, continuing ops) $4.50 - $4.90 EBITDA* $295M - $315M Free Cash Flow* $165M - $185M 11 Guidance 2017 Adjusted EPS GAAP EPS (diluted, continuing
ops) $4.30 -
$4.70 Compliance Costs $0.18 DAT Integration Costs $0.02 Adjusted EPS* (diluted, continuing
ops) $4.50 -
$4.90 * See Page 1 regarding non-GAAP financial measures. Guidance Unchanged |
 2017
Tax Outlook Q1 2017 Supplemental Financial Information
12 2017 Q1 Discrete Tax Benefits 2017 Q1 Tax Expense (Excluding Discrete Benefits) Actual 2017 Q1 Tax Expense 2017 Full-Year Estimated Tax Rate ~ 24% - 25% $0 $3 $6 $9 27.7% Tax Rate (Ex. Discrete Items) 1.9% Effective Tax Rate |
 Q1
2017 Supplemental Financial Information 2017 Guidance
Assumptions •
Interest expense ~$29 million
•
Tax rate ~24%-25%
•
Average diluted shares outstanding 29.830 million
•
Depreciation / Amortization expense ~$100 million
•
Cap Ex $55 - $60 million 13 |
 Q1
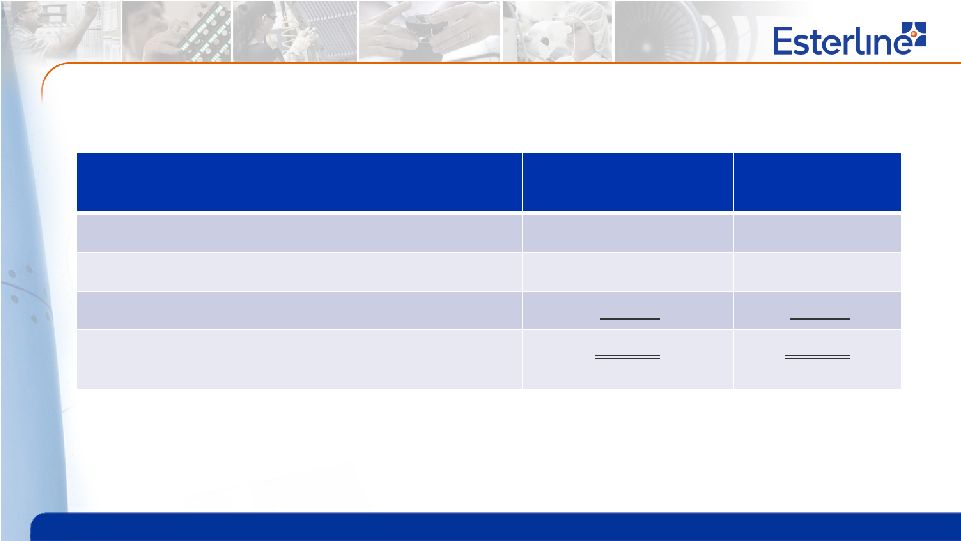
2017 Supplemental Financial Information Share Repurchase
Update # Shares
In thousands $ Value In millions $ Authorization Remaining In millions • FY 2014 269 $ 30.3 • FY 2015 2,562 259.5 • FY 2016 305 18.7 • Q1 2017 - - Total since inception* 3,136 $ 308.5 $ 91.5 * $400 million total authorization for share repurchase. 14 |
 Q1
2017 Supplemental Financial Information Appendix
15 |
 Q1
2017 Supplemental Financial Information Q1 2017 Adjusted Gross Margin and
EBIT* 16
* See Page 1 regarding non-GAAP financial measures
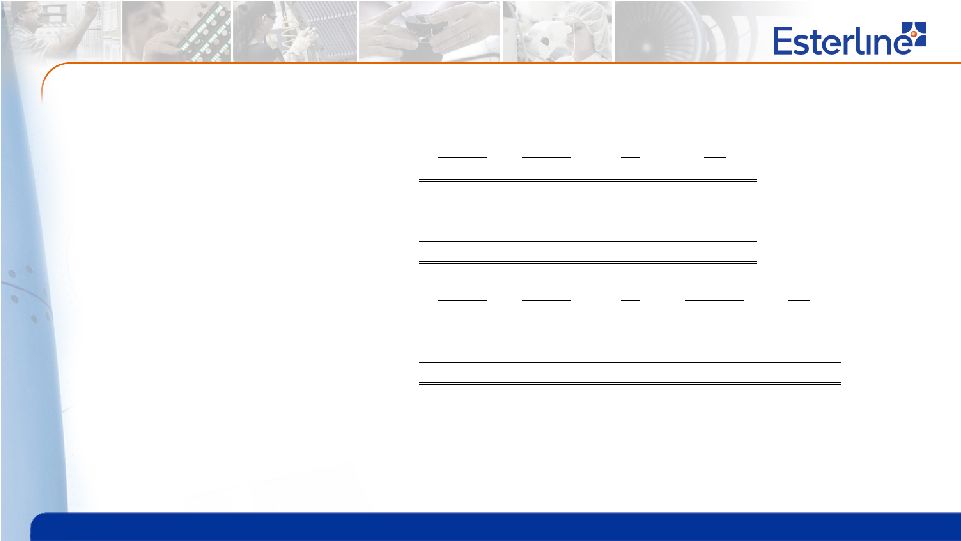
In thousands Avionics Sensors AM ESL GAAP Sales 192,682 $ 167,073 $ 97,978 $ 457,733 $ GAAP Gross Margin 60,488 $ 59,106 $ 24,453 $ 144,047 $ DAT Integration Costs 301 - - 301 Adjusted Gross Margin
60,789 $ 59,106 $ 24,453 $ 144,348 $ Avionics Sensors AM Corporate ESL GAAP EBIT 17,917 $ 19,946 $ 9,880 $ (17,767) $ 29,976 $ Compliance Costs - - - 2,251 2,251 DAT Integration Costs 637 - - - 637 Adjusted EBIT 18,554 $ 19,946 $ 9,880 $ (15,516) $ 32,864 $ Adjusted Gross Margin as a % of Sales 31.5% 35.4% 25.0% - 31.5% Adjusted EBIT as a % of Sales 9.6% 11.9% 10.1% - 7.2% |
 Q1
2017 Supplemental Financial Information Q1 2016 Adjusted Gross Margin and
EBIT* 17
* See Page 1 regarding non-GAAP financial measures
In thousands Avionics Sensors AM ESL GAAP Sales 186,245 $ 152,430 $ 102,802 $ 441,477 $ GAAP Gross Margin 59,667 $ 50,235 $ 27,817 $ 137,719 $ Accelerated Integration - 331 156 487 DAT Integration 1,102 - - 1,102 Adjusted Gross Margin 60,769 $ 50,566 $ 27,973 $ 139,308 $ Avionics Sensors AM Corporate ESL GAAP EBIT 9,413 $ 12,784 $ 12,990 $ (18,065) $ 17,122 $ Accelerated Integration 334 520 281 283 1,418 Compliance Costs - - - 3,484 3,484 DAT Integration 3,648 - - - 3,648 Adjusted EBIT 13,395 $ 13,304 $ 13,271 $ (14,298) $ 25,672 $ Adjusted Gross Margin as a % of Sales 32.6% 33.2% 27.2% - 31.6% Adjusted EBIT as a % of Sales 7.2% 8.7% 12.9% - 5.8% |