Attached files
| file | filename |
|---|---|
| 8-K - 8-K - WideOpenWest Finance, LLC | a17-3481_18k.htm |
Exhibit 99.1
February 2017

Legal disclaimer Forward-Looking Statements Certain statements in this presentation and in any accompanying oral remarks made in connection with this presentation are “forward-looking statements” within the meaning of securities laws. You should not place undue reliance on these statements. Forward-looking statements include information concerning our liquidity and our possible or assumed future results of operations, including descriptions of our business strategies, as well as cost savings and other benefits we expect to achieve (and the timing thereof) as discussed herein. These statements often include words such as “believe,” “expect,” “anticipate,” “intend,” “plan,” “estimate,” “seek,” “will,” “may” or similar expressions. These statements are based on certain assumptions that we have made in light of our experience in the industry as well as our perceptions of historical trends, current conditions, expected future developments and other factors we believe are appropriate in these circumstances. You should understand that these statements are not guarantees of performance or results. They involve risks, uncertainties and assumptions which are discussed in detail in the Company’s most recent Form 10-K Annual Report for the year ended December 31, 2015 filed with the Securities and Exchange Commission (the “SEC”) on March 17, 2016 and our Form 10-Q Quarterly Reports subsequently filed with the SEC which should be read in conjunction with this presentation. Furthermore, we have not yet filed the Company’s Form 10-K Annual Report for the year ended December 31, 2016 with the SEC. When the Company ultimately files its Form 10-K Annual Report with the SEC, actual results and financial information related to the quarter and year ended December 31, 2016 could differ materially from those reflected in the forward-looking statements contained herein as a result of a variety of factors, many of which are beyond the Company’s control. The Company assumes no responsibility to update or revise any forward-looking statements as a result of new information or future developments. Third Party Information This presentation has been prepared by the Company and includes information from other sources believed by management to be reliable. No representation or warranty, express or implied, is made as to the accuracy or completeness of any of the information set forth herein. This presentation may contain summaries of the terms of certain documents and agreements, but reference is made to the actual documents and agreements for the complete information contained therein. The information contained herein is as of the date hereof and is subject to change, completion or amendment without notice. Non-GAAP Financial Measures We have included certain non-GAAP financial measures in this presentation, including Pro Forma Total Revenue, Adjusted EBITDA, Pro Forma Adjusted EBITDA, Pro Forma Capital Expenditures, Free Cash Flow and Unlevered Free Cash Flow. We believe such measures are commonly used by investors to evaluate our performance and that of our competitors. These measures are not presentations made in accordance with GAAP and our use of such terms varies from others in our industry. These measures should not be considered as alternatives to total revenue, net income (loss), operating income, total capital expenditures or any other performance measures derived in accordance with GAAP as measures of operating performance or operating cash flows or as measures of liquidity. These non-GAAP financial measures have important limitations as analytical tools and you should not consider them in isolation or as substitutes for analysis of our results as reported under GAAP. For definitions of these non-GAAP financial measures, a discussion regarding the limitations of their use and a reconciliation of these measures to the most directly comparable GAAP financial measures, see “Non-GAAP Financial Measures”, “Unaudited Pro Forma Information” and “Unaudited Reconciliation of GAAP to Non-GAAP and Pro Forma Financial Measures” in the Appendix to this presentation. Due to the inherent difficulty of forecasting the timing and amount of certain items that would impact net income, we are unable to reasonably estimate the related impact of such items to net income, the GAAP financial measure most directly comparable to Adjusted EBITDA. Accordingly, we are unable to provide a reconciliation of adjusted EBITDA to net income with respect to the updated 2016 and forward-looking guidance provided herein. For the same reasons, we are unable to address the probable significance of the unavailable information, which could have a significant impact on our final 2016 and full-year 2017 GAAP financial results. Pro Forma Subscriber & Financial Information The SEC requires that pro forma information be presented in a registrant’s periodic filings when events occur for which disclosure would be material to investors, including a significant business combination or the disposition of a significant portion of a business. The significance of an acquired or disposed business is determined based on the “significant subsidiary” tests specified in Regulation S-X, Article 11, Rule 1-02(w). In this regard, the Company has made certain acquisitions and divestitures which do not meet the “significant subsidiary” tests. Accordingly, the Company’s historical financial information as filed with the SEC does not contain pro forma financial information relating to those transactions. Nevertheless, this presentation makes certain pro forma adjustments to the historical subscriber and financial information of the Company giving effect to those transactions as if such transactions had been completed at the beginning of each period presented because we believe such information would be meaningful to investors by showing how such transactions might have affected the Company’s historical subscriber and financial information. For a discussion regarding such pro forma information and reconciliations to the most directly comparable GAAP financial measures, see “Unaudited Pro Forma Information” and “Unaudited Reconciliations of GAAP to Non-GAAP and Pro Forma Financial Measures” in the Appendix to this presentation.

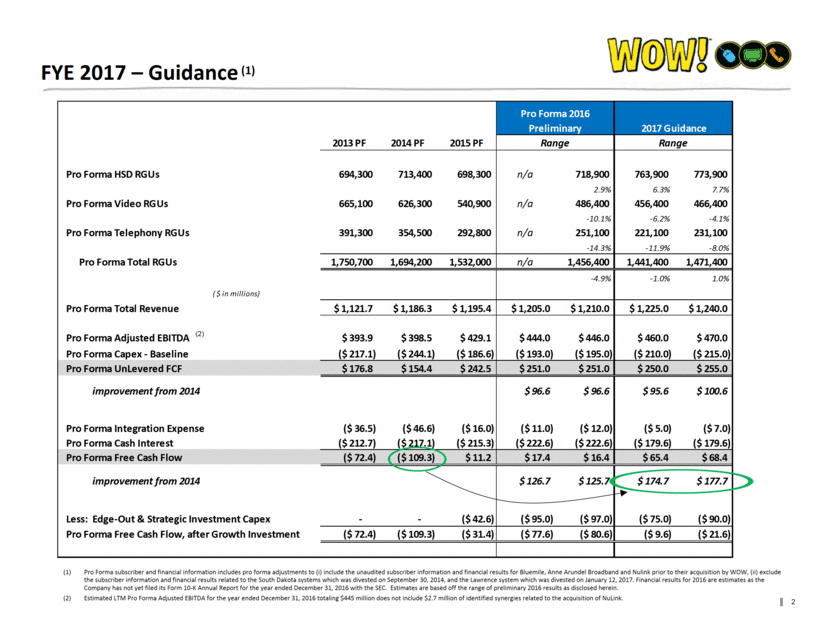
FYE 2017 – Guidance (1) (2) Pro Forma subscriber and financial information includes pro forma adjustments to (i) include the unaudited subscriber information and financial results for Bluemile, Anne Arundel Broadband and Nulink prior to their acquisition by WOW, (ii) exclude the subscriber information and financial results related to the South Dakota systems which was divested on September 30, 2014, and the Lawrence system which was divested on January 12, 2017. Financial results for 2016 are estimates as the Company has not yet filed its Form 10-K Annual Report for the year ended December 31, 2016 with the SEC. Estimates are based off the range of preliminary 2016 results as disclosed herein. Estimated LTM Pro Forma Adjusted EBITDA for the year ended December 31, 2016 totaling $445 million does not include $2.7 million of identified synergies related to the acquisition of NuLink. 2013 PF 2014 PF 2015 PF Pro Forma HSD RGUs 694,300 713,400 698,300 n/a 718,900 763,900 773,900 2.9% 6.3% 7.7% Pro Forma Video RGUs 665,100 626,300 540,900 n/a 486,400 456,400 466,400 -10.1% -6.2% -4.1% Pro Forma Telephony RGUs 391,300 354,500 292,800 n/a 251,100 221,100 231,100 -14.3% -11.9% -8.0% Pro Forma Total RGUs 1,750,700 1,694,200 1,532,000 n/a 1,456,400 1,441,400 1,471,400 -4.9% -1.0% 1.0% ( $ in millions) Pro Forma Total Revenue $ 1,121.7 $ 1,186.3 $ 1,195.4 $ 1,205.0 $ 1,210.0 $ 1,225.0 $ 1,240.0 Pro Forma Adjusted EBITDA $ 393.9 $ 398.5 $ 429.1 $ 444.0 $ 446.0 $ 460.0 $ 470.0 Pro Forma Capex - Baseline ($ 217.1) ($ 244.1) ($ 186.6) ($ 193.0) ($ 195.0) ($ 210.0) ($ 215.0) Pro Forma UnLevered FCF $ 176.8 $ 154.4 $ 242.5 $ 251.0 $ 251.0 $ 250.0 $ 255.0 Pro Forma Integration Expense ($ 36.5) ($ 46.6) ($ 16.0) ($ 11.0) ($ 12.0) ($ 5.0) ($ 7.0) Pro Forma Cash Interest ($ 212.7) ($ 217.1) ($ 215.3) ($ 222.6) ($ 222.6) ($ 179.6) ($ 179.6) Pro Forma Free Cash Flow ($ 72.4) ($ 109.3) $ 11.2 $ 17.4 $ 16.4 $ 65.4 $ 68.4 Less: Edge-Out & Strategic Investment Capex - - ($ 42.6) ($ 95.0) ($ 97.0) ($ 75.0) ($ 90.0) Pro Forma Free Cash Flow, after Growth Investment ($ 72.4) ($ 109.3) ($ 31.4) ($ 77.6) ($ 80.6) ($ 9.6) ($ 21.6) 2017 Guidance Range Range $ 95.6 $ 100.6 Pro Forma 2016 Preliminary improvement from 2014 $ 96.6 $ 96.6 $ 126.7 $ 125.7 $ 174.7 $ 177.7 improvement from 2014
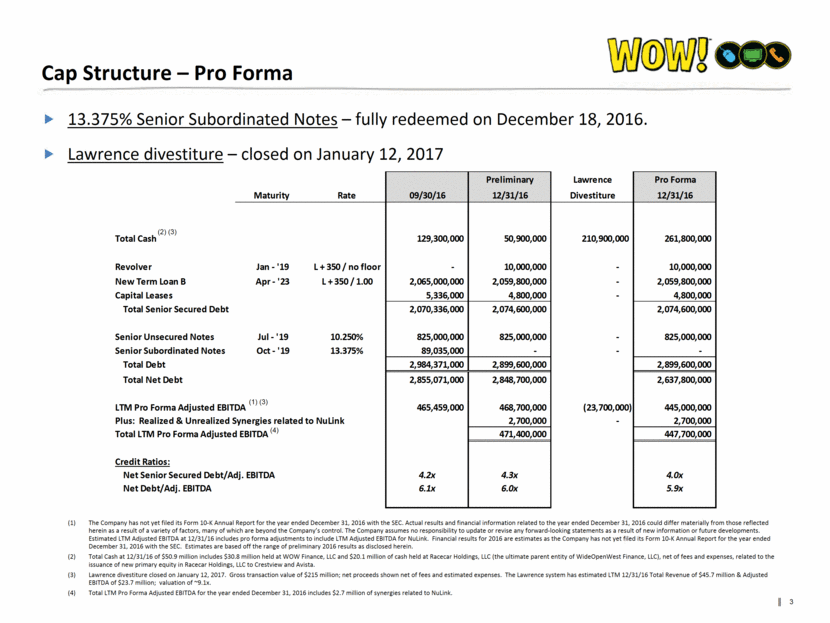
Cap Structure – Pro Forma 13.375% Senior Subordinated Notes – fully redeemed on December 18, 2016. Lawrence divestiture – closed on January 12, 2017 The Company has not yet filed its Form 10-K Annual Report for the year ended December 31, 2016 with the SEC. Actual results and financial information related to the year ended December 31, 2016 could differ materially from those reflected herein as a result of a variety of factors, many of which are beyond the Company’s control. The Company assumes no responsibility to update or revise any forward-looking statements as a result of new information or future developments. Estimated LTM Adjusted EBITDA at 12/31/16 includes pro forma adjustments to include LTM Adjusted EBITDA for NuLink. Financial results for 2016 are estimates as the Company has not yet filed its Form 10-K Annual Report for the year ended December 31, 2016 with the SEC. Estimates are based off the range of preliminary 2016 results as disclosed herein. Total Cash at 12/31/16 of $50.9 million includes $30.8 million held at WOW Finance, LLC and $20.1 million of cash held at Racecar Holdings, LLC (the ultimate parent entity of WideOpenWest Finance, LLC), net of fees and expenses, related to the issuance of new primary equity in Racecar Holdings, LLC to Crestview and Avista. Lawrence divestiture closed on January 12, 2017. Gross transaction value of $215 million; net proceeds shown net of fees and estimated expenses. The Lawrence system has estimated LTM 12/31/16 Total Revenue of $45.7 million & Adjusted EBITDA of $23.7 million; valuation of ~9.1x. Total LTM Pro Forma Adjusted EBITDA for the year ended December 31, 2016 includes $2.7 million of synergies related to NuLink. (2) (3) (1) (3) (4) Preliminary Lawrence Pro Forma Maturity Rate 09/30/16 12/31/16 Divestiture 12/31/16 Total Cash 129,300,000 50,900,000 210,900,000 261,800,000 Revolver Jan - '19 L + 350 / no floor - 10,000,000 - 10,000,000 New Term Loan B Apr - '23 L + 350 / 1.00 2,065,000,000 2,059,800,000 - 2,059,800,000 Capital Leases 5,336,000 4,800,000 - 4,800,000 Total Senior Secured Debt 2,070,336,000 2,074,600,000 2,074,600,000 Senior Unsecured Notes Jul - '19 10.250% 825,000,000 825,000,000 - 825,000,000 Senior Subordinated Notes Oct - '19 13.375% 89,035,000 - - - Total Debt 2,984,371,000 2,899,600,000 2,899,600,000 Total Net Debt 2,855,071,000 2,848,700,000 2,637,800,000 LTM Pro Forma Adjusted EBITDA 465,459,000 468,700,000 (23,700,000) 445,000,000 Plus: Realized & Unrealized Synergies related to NuLink 2,700,000 - 2,700,000 Total LTM Pro Forma Adjusted EBITDA 471,400,000 447,700,000 Credit Ratios: Net Senior Secured Debt/Adj. EBITDA 4.2x 4.3x 4.0x Net Debt/Adj. EBITDA 6.1x 6.0x 5.9x
Non-GAAP Financial Measures We have included certain non-GAAP financial measures in this presentation including Pro Forma Total Revenue, Adjusted EBITDA, Pro Forma Adjusted EBITDA, Pro Forma Capital Expenditures, Free Cash Flow and Unlevered Free Cash Flow. We believe that these non-GAAP measures enhance an investor’s understanding of our financial performance. We believe that these non-GAAP measures are useful financial metrics to assess our operating performance from period to period by excluding certain items that we believe are not representative of our core business. We believe that these non-GAAP measures provide investors with useful information for assessing the comparability between periods of our ability to generate cash from operations sufficient to pay taxes, to service debt and to undertake capital expenditures. We use these non-GAAP measures for business planning purposes and in measuring our performance relative to that of our competitors. We believe these non-GAAP measures are measures commonly used by Investors to evaluate our performance and that of our competitors. Adjusted EBITDA is defined by WOW! as net income (loss) before net interest expense, income taxes, depreciation and amortization (including impairments), gains (losses) realized and unrealized on derivative instruments, management fees to related party, the write-up or off of any asset, debt modification expenses, loss on extinguishment of debt, integration and restructuring expenses and all non-cash charges and expenses (including equity based compensation expense) and certain other income and expenses, as further defined in our credit facilities. Adjusted EBITDA is not a presentation made in accordance with generally accepted accounting principles in the United States (“GAAP”) and our use of the term Adjusted EBITDA varies from others in our industry. Adjusted EBITDA should not be considered as an alternative to net income (loss), operating income or any other performance measures derived in accordance with GAAP as measures of operating performance or operating cash flows or as measures of liquidity. Adjusted EBITDA has important limitations as an analytical tool and you should not consider it in isolation or as a substitute for analysis of our results as reported under GAAP. For example, Adjusted EBITDA: excludes certain tax payments that may represent a reduction in cash available to us; does not reflect any cash capital expenditure requirements for the assets being depreciated and amortized that may have to be replaced in the future; does not reflect changes in, or cash requirements for, our working capital needs; and does not reflect the significant interest expense, or the cash requirements necessary to service interest or principal payments, on our debt. Furthermore, although the Company has made certain acquisitions and divestitures which do not meet the SEC’s “significant subsidiary” tests which would require the presentation of pro forma financial information in its periodic filings, Total Revenue, Adjusted EBITDA and Capital Expenditures in this presentation are presented on a pro forma basis, giving effect to our acquisition of Bluemile, Inc. (“Bluemile”) on September 27, 2013, our increased investment in Anne Arundel Broadband (“AAB”) on May 1, 2014, our divestiture of the South Dakota systems on September 30, 2014, our acquisition of the operating assets of HC Cable Opco, LLC (dba “NuLink”) on September 9, 2016, and our divestiture of the Lawrence, KS system on January 12, 2017, as if such transactions had been completed at the beginning of each period presented. See “Unaudited Pro Forma Information” and “Unaudited Reconciliations of GAAP to Non-GAAP and Pro Forma Financial Measures” on the following pages and the accompanying tables for reconciliations of these non-GAAP financial measures to their most directly comparable GAAP financial measure. We define Unlevered FCF as Adjusted EBITDA minus capital expenditures. We define FCF as Unlevered FCF minus integration expense and cash interest. We believe these measures are useful metrics for analyzing our cash levels. However, Unlevered FCF and FCF should not be considered a substitute for operating cash flows determined in accordance with GAAP. In addition, these measures do not necessarily represent funds available for discretionary use and are not necessarily a measure of our ability to fund our cash needs. In addition, other companies in our industry may calculate free cash flow differently than we do, limiting its usefulness as a comparative measure.
Unaudited Pro Forma Information The Securities and Exchange Commission (the “SEC”) requires that pro forma financial information be presented in a registrant’s periodic filings when events occur for which disclosure would be material to investors, including significant business combinations or the disposition of a significant portion of the business. The significance of an acquired or disposed business is determined based on the “significant subsidiary” tests specified in Regulation S-X, Article 11, Rule 1-02(w). In this regard, although the Company has made certain acquisitions and divestitures, such transactions do not meet the “significant subsidiary” tests and, accordingly, the Company’s historical financial information as filed with the SEC does not contain pro forma financial information relating to those transactions. Nevertheless, this presentation makes certain pro forma adjustments to the subscriber and historical financial information of the Company as filed with the SEC because we believe such information would be meaningful to investors by showing how such transactions might have affected the Company’s historical financial statements. The unaudited pro forma subscriber and financial information in this presentation has been prepared giving effect to our acquisition of Bluemile on September 27, 2013, our increased investment in AAB on May 1, 2014, our divestiture of the Company’s South Dakota systems on September 30, 2014, our acquisition of the operating assets of NuLink on September 9, 2016 and our divestiture of the Lawrence, KS system on January 12, 2017, as if such transactions had been completed at the beginning of each period presented. The unaudited pro forma subscriber and financial information is for informational purposes only and does not purport to represent what our results of operations or financial information would have been if such transactions had occurred at any date, nor does such information purport to project the results of operations for any future period. The unaudited pro forma condensed combined financial information in this presentation was prepared based on Bluemile’s, AAB’s and NuLink’s unaudited financial information for the respective periods presented. The historical unaudited subscriber and financial information has been adjusted to give pro forma effect to events that are directly attributable to such transactions, factually supportable and expected to have a continuing impact on the combined results. The unaudited pro forma subscriber and financial information herein does not reflect non-recurring charges that have been incurred in connection with the transactions and related financings, including legal fees, broker fees and accounting fees. See “Unaudited Reconciliations of GAAP to Non-GAAP and Pro Forma Financial Measures” in the following tables for reconciliations of such pro forma information to the most directly comparable GAAP financial measures. The unaudited pro forma information herein should be read in conjunction with the information contained in “Management’s Discussion and Analysis of Financial Condition and Results of Operations,” the consolidated financial statements and the accompanying notes appearing in our most recently filed Form 10-K for the year ended December 31, 2015 as filed with the SEC on March 17, 2016 and subsequent quarterly filings on Form 10-Q. Due to the inherent difficulty of forecasting the timing and amount of certain items that would impact net income, we are unable to reasonably estimate the related impact of such items to net income, the GAAP financial measure most directly comparable to Adjusted EBITDA. Accordingly, we are unable to provide a reconciliation of adjusted EBITDA to net income with respect to the updated 2016 and forward-looking guidance provided herein. For the same reasons, we are unable to address the probable significance of the unavailable information, which could have a significant impact on our final 2016 and full-year 2017 GAAP financial results. Furthermore, we have not yet filed the Company’s Annual Report on Form 10-K for the year ended December 31, 2016 with the SEC. When the Company ultimately files its Annual Report on Form 10-K with the SEC, actual results and financial information related to the year and quarter ended December 31, 2016 could differ materially from those reflected in the forward-looking statements contained herein as a result of a variety of factors, many of which are beyond the Company’s control. The Company assumes no responsibility to update or revise any forward-looking statements as a result of new information or future developments.
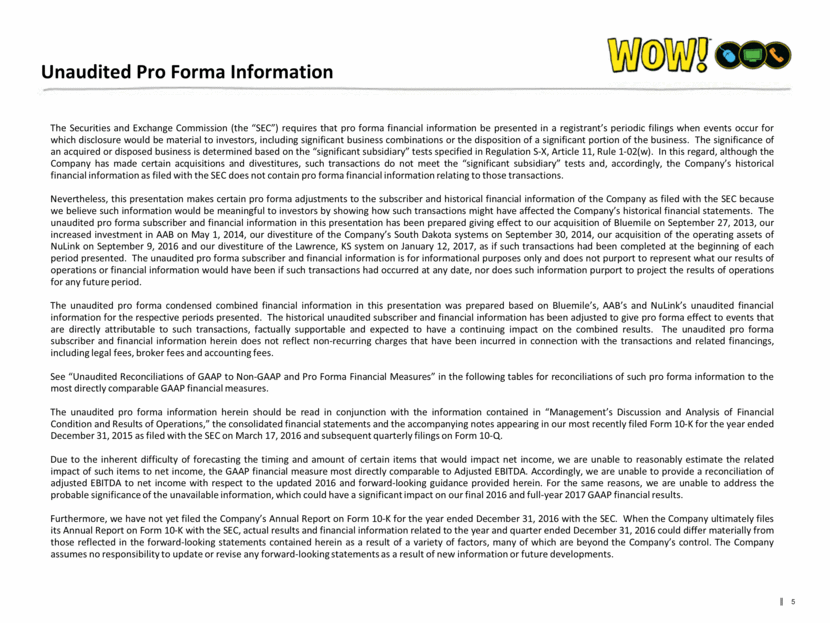
Unaudited Reconciliations of GAAP to Non-GAAP and Pro Forma Financial Measures The following table provides unaudited reconciliations of our Total Revenue, net income (loss) and Capex to Pro Forma Total Revenue, Pro Forma Adjusted EBITDA and Pro Forma Total Capex for the respective periods presented: See accompanying notes on page 8 Mar. 31, Jun. 30, Sept. 30, Dec. 31, Mar. 31, Jun. 30, Sept. 30, Dec. 31, Mar. 31, Jun. 30, Sept. 30, Dec. 31, Mar. 31, Jun. 30, Sep. 30, 2013 2013 2013 2013 2014 2014 2014 2014 2015 2015 2015 2015 2016 2016 2016 Total Revenue $ 296.4 $ 301.4 $ 297.4 $ 304.5 $ 312.1 $ 319.8 $ 323.2 $ 309.2 $ 312.3 $ 305.8 $ 297.7 $ 301.3 $ 302.3 $ 307.5 $ 311.2 Pro Forma Adjustments: Revenue related to Bluemile, Inc. (1) 2.2 2.2 2.2 - - - - - - - - - - - - Revenue related to AAB (2) 5.1 5.3 5.2 5.2 5.3 1.8 - - - - - - - - - Revenue related to NuLink (3) 5.4 5.6 5.6 5.6 5.6 5.8 5.9 5.9 6.1 6.2 6.2 6.2 6.2 6.2 4.7 Revenue related to the South Dakota systems (4) (20.5) (20.5) (20.2) (19.9) (21.3) (20.0) (21.2) - - - - - - - - Revenue related to the Lawrence system (5) (12.0) (11.7) (11.4) (11.4) (11.3) (11.5) (11.5) (11.5) (11.8) (11.6) (11.5) (11.5) (11.5) (11.3) (11.5) Pro Forma Total Revenue $ 276.6 $ 282.3 $ 278.8 $ 284.0 $ 290.4 $ 295.9 $ 296.4 $ 303.6 $ 306.6 $ 300.4 $ 292.4 $ 296.0 $ 297.0 $ 302.4 $ 304.4 Net Income (loss) $ (35.1) ($78.9) ($18.8) $ (28.4) $ (20.3) ($7.8) $31.7 $ (26.8) $ (6.6) $ (27.5) $ (7.1) $ (1.5) $ 4.8 $ (145.0) $ (12.4) Depreciation and amortization 64.8 63.2 63.0 65.4 66.0 64.1 64.0 57.2 54.8 55.5 55.9 54.9 52.5 52.9 49.6 Management fee to related party 0.4 0.4 0.4 0.5 0.4 0.5 0.4 0.4 0.4 0.6 0.5 0.4 0.4 0.5 0.4 Interest expense 66.9 57.9 58.8 58.4 57.8 59.4 60.0 59.8 58.9 57.1 55.3 54.7 54.2 55.2 52.9 Loss on extinguishment of debt - 57.3 - 0.8 - - - - - 22.9 - - - 2.5 28.1 Unrealized gain on derivative instruments, net (1.0) (1.2) (0.9) (0.3) (1.0) (0.8) (1.3) (1.0) (2.0) (1.1) (1.2) (1.3) (1.1) (1.2) - (Gain) Loss on sale of assets - - - - - - (52.6) (0.3) - - - - - - - Non-recurring prof. fees, M&A integration and restr. exp. 8.7 12.1 9.9 5.8 4.9 13.0 8.9 19.8 3.5 4.2 4.8 3.5 1.1 2.4 3.8 Non-cash stock compensation - - - - - - - - - - - - - 0.1 0.4 Other expense (income), net (0.1) 0.3 (0.1) 0.1 0.1 (0.2) (2.4) (0.9) (0.2) - 0.6 - - (0.1) (1.9) Income tax (benefit) expense - - - 6.2 1.1 (16.7) 1.2 (0.5) 0.9 1.0 0.8 1.2 1.0 147.6 (5.2) Adjusted EBITDA $ 104.6 $ 111.1 $ 112.3 $ 108.5 $ 109.0 $ 111.5 $ 109.9 $ 107.7 $ 109.7 $ 112.7 $ 109.6 $ 111.9 $ 112.9 $ 114.9 $ 115.7 Adjusted EBITDA Pro Forma Adjustments: Adjusted EBITDA related to Bluemile, Inc. (1) 0.7 0.7 0.7 - - - - - - - - - - - - Adjusted EBITDA related to AAB (2) 0.6 0.7 0.7 0.7 0.8 0.2 - - - - - - - - - Adjusted EBITDA related to NuLink (3) 1.7 2.0 1.9 1.9 1.8 1.9 2.0 2.1 2.0 2.1 2.1 2.2 2.0 2.1 1.7 Adjusted EBITDA related to the South Dakota systems (4) (7.5) (8.5) (8.1) (8.2) (9.4) (8.0) (9.4) - - - - - - - - Adjusted EBITDA related to the Lawrence system (5) (6.0) (5.9) (5.2) (5.5) (5.4) (5.4) (5.2) (5.6) (5.8) (5.9) (5.7) (5.8) (5.9) (5.9) (5.9) Pro Forma Adjusted EBITDA $ 94.1 $ 100.1 $ 102.3 $ 97.4 $ 96.8 $ 100.2 $ 97.3 $ 104.2 $ 105.9 $ 108.9 $ 106.0 $ 108.3 $ 109.0 $ 111.1 $ 111.5 Total Capex $ 30.2 $ 59.9 $ 77.4 $ 54.4 $ 52.9 $ 66.0 $ 66.3 $ 66.7 $ 55.6 $ 54.7 $ 64.5 $ 57.1 $ 63.6 $ 71.3 $ 72.3 Pro Forma Adjustments: Capex related to Bluemile, Inc. (1) 0.3 0.3 0.3 - - - - - - - - - - - - Capex EBITDA related to AAB (2) 0.9 1.0 1.1 0.7 0.9 0.3 - - - - - - - - - Capex EBITDA related to NuLink (3) 0.7 0.6 1.2 1.8 1.1 0.6 1.0 0.8 0.8 1.1 1.1 0.7 1.2 1.7 0.9 Capex EBITDA related to the South Dakota systems (4) (1.4) (2.0) (2.6) (2.3) (1.9) (3.0) (3.1) - - - - - - - - Capex EBITDA related to the Lawrence system (5) (0.8) (0.7) (2.6) (1.3) (0.4) (1.5) (1.4) (1.2) (0.7) (0.7) (1.8) (3.2) (1.3) (1.4) (1.7) Pro Forma Total Capex $ 29.9 $ 59.1 $ 74.8 $ 53.3 $ 52.6 $ 62.4 $ 62.8 $ 66.3 $ 55.7 $ 55.1 $ 63.8 $ 54.6 $ 63.5 $ 71.6 $ 71.5 Three Months Ended
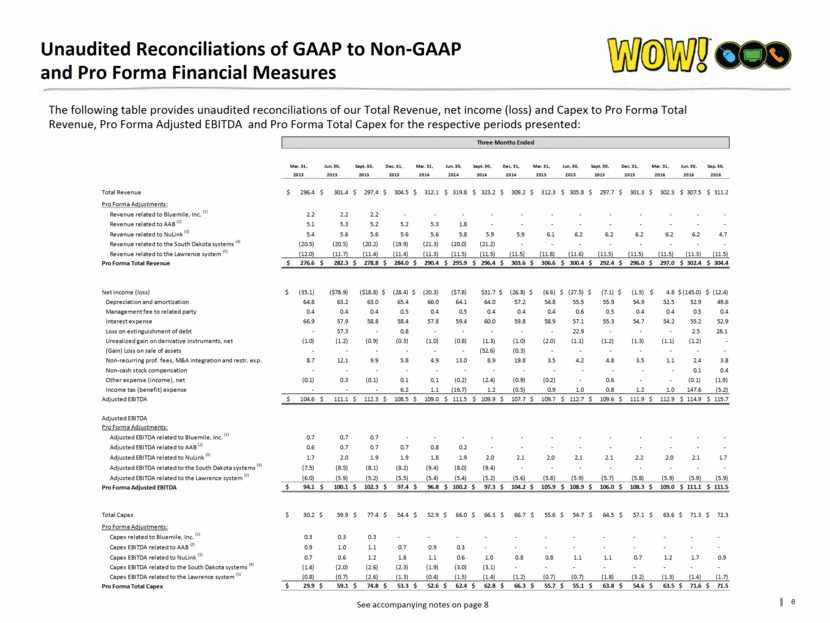
Unaudited Reconciliations of GAAP to Non-GAAP and Pro Forma Financial Measures (cont’d) See accompanying notes on page 8 The following table provides unaudited reconciliations of our Total Revenue, net income (loss) and Capex to Pro Forma Total Revenue, Pro Forma Adjusted EBITDA and Pro Forma Total Capex for the respective periods presented: Dec. 31, Dec. 31, Dec. 31, Dec. 31, 2013 2014 2015 Total Revenue $ 1,199.7 $ 1,264.3 $ 1,217.1 Pro Forma Adjustments: Revenue related to Bluemile, Inc. (1) 6.6 - - Revenue related to AAB (2) 20.8 7.1 - Revenue related to NuLink (3) 22.2 23.2 24.7 Revenue related to the South Dakota systems (4) (81.1) (62.5) - Revenue related to the Lawrence system (5) (46.5) (45.8) (46.4) Pro Forma Total Revenue $ 1,121.7 $ 1,186.3 $ 1,195.4 Net loss $ (161.2) $ (23.2) $ (42.7) Depreciation and amortization 256.4 251.3 221.1 Management fee to related party 1.7 1.7 1.9 Interest expense 242.0 237.0 226.0 Loss on extinguishment of debt 58.1 - 22.9 Unrealized gain on derivative instruments, net (3.4) (4.1) (5.6) (Gain) Loss on sale of assets - (52.9) - Non-recurring prof. fees, M&A integration and restr. exp. 36.5 46.6 16.0 Non-Cash stock compensation - - - Other expense (income), net 0.2 (3.4) 0.4 Income tax (benefit) expense 6.2 (14.9) 3.9 Adjusted EBITDA $ 436.5 $ 438.1 $ 443.9 Pro Forma Adjustments: Adjusted EBITDA related to Bluemile, Inc. (1) 2.1 - - Adjusted EBITDA related to AAB (2) 2.7 1.0 - Adjusted EBITDA related to NuLink (3) 7.5 7.8 8.4 Adjusted EBITDA related to the South Dakota systems (4) (32.3) (26.8) - Adjusted EBITDA related to the Lawrence system (5) (22.6) (21.6) (23.2) Pro Forma Adjusted EBITDA $ 393.9 $ 398.5 $ 429.1 Total Capex 221.9 $ 251.9 $ 231.9 $ Pro Forma Adjustments: Capex related to Bluemile, Inc. (1) 0.9 - - Capex EBITDA related to AAB (2) 3.7 1.2 - Capex EBITDA related to NuLink (3) 4.3 3.5 3.7 Capex EBITDA related to the South Dakota systems (4) (8.3) (8.0) - Capex EBITDA related to the Lawrence system (5) (5.4) (4.5) (6.4) Pro Forma Total Capex $ 217.1 $ 244.1 $ 229.2 Twelve Months Ended
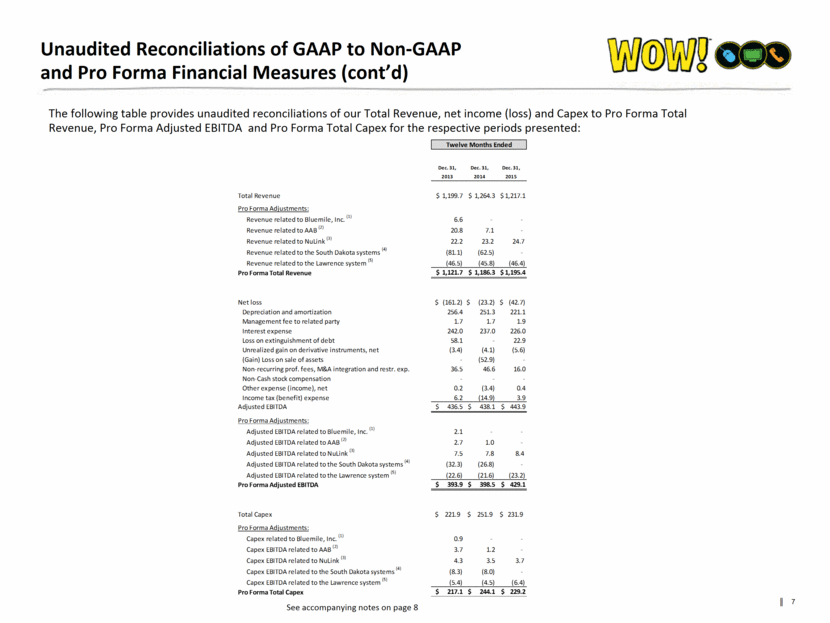
Unaudited Reconciliations of GAAP to Non-GAAP and Pro Forma Financial Measures (cont’d) Notes to Unaudited Reconciliations of GAAP to Non-GAAP Financial Measures: Represents our management’s estimate of pre-acquisition Total Revenue, Adjusted EBITDA and Capital Expenditures of the assets acquired from Bluemile, Inc. (“Bluemile”) preceding our acquisition on September 27, 2014 based on the books and records of Bluemile, as adjusted by our management to reflect the assets actually acquired. We believe that, based on operating data, including operating data for the period in 2013 that we owned and operated the acquired Bluemile assets (from September 27, 2013 through December 31, 2013), the pro forma amounts represent a reasonable estimate of EBITDA from Bluemile asset operations. However, there can be no assurances that such results accurately reflect the actual results of the acquired assets of Bluemile for the periods September 27, 2013. Such amounts are presented solely for the purposes of presenting the calculation of Pro Forma Total Revenue, Pro Forma Adjusted EBITDA and Pro Forma Capital Expenditures based on information set forth in the books and records of Bluemile as provided to us by Bluemile at the time of the acquisition. Such amounts are unaudited and have not been verified by our management. Represents our management’s estimate of pre-acquisition Total Revenue, Adjusted EBITDA and Capital Expenditures of Anne Arundel Broadband (“AAB”) for the periods preceding our increased investment in AAB on April 30, 2014 based on the books and records of AAB, as adjusted by our management to reflect the assets actually acquired. We believe that, based on operating data, including operating data for the period following our increased investment in AAB (from May 1, 2014 through December 31, 2014), the pro forma amounts represent a reasonable estimate of Total Revenue, Adjusted EBITDA and Capital Expenditures from AAB’s operations. However, there can be no assurances that such results accurately reflect the actual results of the acquired assets of AAB for the periods preceding April 30, 2014. Such amounts are presented solely for the purposes of presenting the calculation of Pro Forma Total Revenue, Pro Forma Adjusted EBITDA and Pro Forma Capital Expenditures based on information set forth in the books and records of AAB as provided to us by AAB at the time of the acquisition. Such amounts are unaudited and have not been verified by our management. Represents our management’s estimate of pre-acquisition Total Revenue, Adjusted EBITDA and Capital Expenditures of HC Cable Opco, LLC d/b/a NuLink (“NuLink”) for the periods preceding our acquisition of substantially all of the operating assets of NuLink on September 9, 2016 based on the books and records of NuLink, as adjusted by our management to reflect the assets actually acquired. We believe that, based on operating data, including operating data for the period following our acquisition of NuLink (from September 9, 2016 through September 30, 2016), the pro forma amounts represent a reasonable estimate of Total Revenue, Adjusted EBITDA and Capital Expenditures from NuLink’s operations. However, there can be no assurances that such results accurately reflect the actual results of the acquired assets of NuLink for the periods preceding September 9, 2016. Such amounts are presented solely for the purposes of presenting the calculation of Pro Forma Total Revenue, Pro Forma Adjusted EBITDA and Pro Forma Capital Expenditures based on information set forth in the books and records of NuLink as provided to us by NuLink at the time of the acquisition. Such amounts are unaudited and have not been verified by our management. Represents the Total Revenue, Adjusted EBITDA and Capital Expenditures of the South Dakota systems for the periods preceding our divestiture of such assets on September 30, 2014 based on the individual books and records of the South Dakota systems. Such amounts have been extracted from the consolidated financial statements for the Company which has been audited, except the preliminary December 31, 2016 results. We believe that such pro forma amounts represent a reasonable estimate of Total Revenue, Adjusted EBITDA and Capital Expenditures for the South Dakota systems for the periods proceeding our divestiture, however, the individual books and records of the South Dakota systems have not been audited. There can be no assurances that such results accurately reflect the actual results of the South Dakota systems for the periods preceding September 30, 2014. Such amounts are presented solely for the purposes of presenting the calculation of Pro Forma Total Revenue, Pro Forma Adjusted EBITDA and Pro Forma Capital Expenditures based on information set forth in the Company’s books and records at the time of the divestiture. Represents the Total Revenue, Adjusted EBITDA and Capital Expenditures of the Lawrence system for the periods preceding our divestiture of such assets on January 12, 2017 based on the individual books and records of the Lawrence system. Such amounts have been extracted from the consolidated financial statements for the Company which has been audited, except the preliminary December 31, 2016 results. We believe that such pro forma amounts represent a reasonable estimate of Total Revenue, Adjusted EBITDA and Capital Expenditures for the Lawrence system for the periods proceeding our divestiture, however, the individual books and records of the Lawrence system have not been audited. There can be no assurances that such results accurately reflect the actual results of the Lawrence system for the periods preceding January 12, 2017. Such amounts are presented solely for the purposes of presenting the calculation of Pro Forma Total Revenue, Pro Forma Adjusted EBITDA and Pro Forma Capital Expenditures based on information set forth in the Company’s books and records at the time of the divestiture.
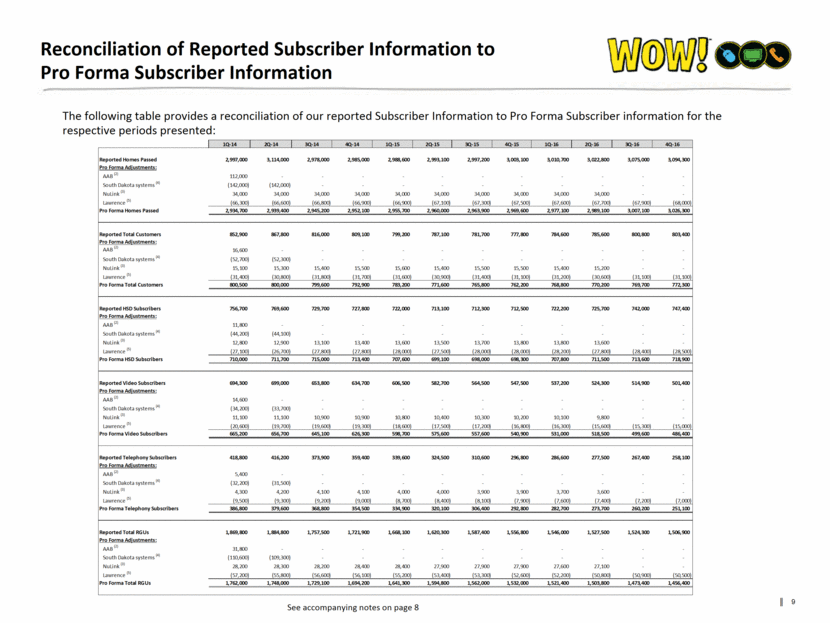
Reconciliation of Reported Subscriber Information to Pro Forma Subscriber Information The following table provides a reconciliation of our reported Subscriber Information to Pro Forma Subscriber information for the respective periods presented: See accompanying notes on page 8 1Q-14 2Q-14 3Q-14 4Q-14 1Q-15 2Q-15 3Q-15 4Q-15 1Q-16 2Q-16 3Q-16 4Q-16 Reported Homes Passed 2,997,000 3,114,000 2,978,000 2,985,000 2,988,600 2,993,100 2,997,200 3,003,100 3,010,700 3,022,800 3,075,000 3,094,300 Pro Forma Adjustments: AAB (2) 112,000 - - - - - - - - - - - South Dakota systems (4) (142,000) (142,000) - - - - - - - - - - NuLink (3) 34,000 34,000 34,000 34,000 34,000 34,000 34,000 34,000 34,000 34,000 - - Lawrence (5) (66,300) (66,600) (66,800) (66,900) (66,900) (67,100) (67,300) (67,500) (67,600) (67,700) (67,900) (68,000) Pro Forma Homes Passed 2,934,700 2,939,400 2,945,200 2,952,100 2,955,700 2,960,000 2,963,900 2,969,600 2,977,100 2,989,100 3,007,100 3,026,300 Reported Total Customers 852,900 867,800 816,000 809,100 799,200 787,100 781,700 777,800 784,600 785,600 800,800 803,400 Pro Forma Adjustments: AAB (2) 16,600 - - - - - - - - - - - South Dakota systems (4) (52,700) (52,300) - - - - - - - - - - NuLink (3) 15,100 15,300 15,400 15,500 15,600 15,400 15,500 15,500 15,400 15,200 - - Lawrence (5) (31,400) (30,800) (31,800) (31,700) (31,600) (30,900) (31,400) (31,100) (31,200) (30,600) (31,100) (31,100) Pro Forma Total Customers 800,500 800,000 799,600 792,900 783,200 771,600 765,800 762,200 768,800 770,200 769,700 772,300 Reported HSD Subscribers 756,700 769,600 729,700 727,800 722,000 713,100 712,300 712,500 722,200 725,700 742,000 747,400 Pro Forma Adjustments: AAB (2) 11,800 - - - - - - - - - - - South Dakota systems (4) (44,200) (44,100) - - - - - - - - - - NuLink (3) 12,800 12,900 13,100 13,400 13,600 13,500 13,700 13,800 13,800 13,600 - - Lawrence (5) (27,100) (26,700) (27,800) (27,800) (28,000) (27,500) (28,000) (28,000) (28,200) (27,800) (28,400) (28,500) Pro Forma HSD Subscribers 710,000 711,700 715,000 713,400 707,600 699,100 698,000 698,300 707,800 711,500 713,600 718,900 Reported Video Subscribers 694,300 699,000 653,800 634,700 606,500 582,700 564,500 547,500 537,200 524,300 514,900 501,400 Pro Forma Adjustments: AAB (2) 14,600 - - - - - - - - - - - South Dakota systems (4) (34,200) (33,700) - - - - - - - - - - NuLink (3) 11,100 11,100 10,900 10,900 10,800 10,400 10,300 10,200 10,100 9,800 - - Lawrence (5) (20,600) (19,700) (19,600) (19,300) (18,600) (17,500) (17,200) (16,800) (16,300) (15,600) (15,300) (15,000) Pro Forma Video Subscribers 665,200 656,700 645,100 626,300 598,700 575,600 557,600 540,900 531,000 518,500 499,600 486,400 Reported Telephony Subscribers 418,800 416,200 373,900 359,400 339,600 324,500 310,600 296,800 286,600 277,500 267,400 258,100 Pro Forma Adjustments: AAB (2) 5,400 - - - - - - - - - - - South Dakota systems (4) (32,200) (31,500) - - - - - - - - - - NuLink (3) 4,300 4,200 4,100 4,100 4,000 4,000 3,900 3,900 3,700 3,600 - - Lawrence (5) (9,500) (9,300) (9,200) (9,000) (8,700) (8,400) (8,100) (7,900) (7,600) (7,400) (7,200) (7,000) Pro Forma Telephony Subscribers 386,800 379,600 368,800 354,500 334,900 320,100 306,400 292,800 282,700 273,700 260,200 251,100 Reported Total RGUs 1,869,800 1,884,800 1,757,500 1,721,900 1,668,100 1,620,300 1,587,400 1,556,800 1,546,000 1,527,500 1,524,300 1,506,900 Pro Forma Adjustments: AAB (2) 31,800 - - - - - - - - - - - South Dakota systems (4) (110,600) (109,300) - - - - - - - - - - NuLink (3) 28,200 28,300 28,200 28,400 28,400 27,900 27,900 27,900 27,600 27,100 - - Lawrence (5) (57,200) (55,800) (56,600) (56,100) (55,200) (53,400) (53,300) (52,600) (52,200) (50,800) (50,900) (50,500) Pro Forma Total RGUs 1,762,000 1,748,000 1,729,100 1,694,200 1,641,300 1,594,800 1,562,000 1,532,000 1,521,400 1,503,800 1,473,400 1,456,400
