Attached files
| file | filename |
|---|---|
| EX-99.1 - EXHIBIT 99.1 - SELECT BANCORP, INC. | v457873_ex99-1.htm |
| 8-K - FORM 8-K - SELECT BANCORP, INC. | v457873_8-k.htm |
Exhibit 99.2
Management Presentation February 1 - 2, 2017

2 This presentation contains forward - looking statements (within the meaning of the Private Securities Litigation Reform Act of 1995 ) . Such statements are not historical facts, but rather are based on our current expectations, estimates and projections about our industry, our beliefs and assumptions . Words including “may,” “will,” “could,” “would,” “should,” “anticipate,” “expect,” “intend,” “plan,” “project,” “believe,” “seek,” “estimate” and similar expressions are intended to identify forward - looking statements . These statements are not guarantees of future performance and are subject to certain risks, uncertainties and other factors, some of which remain beyond our control, are difficult to predict, and could cause actual results to differ materially from those expressed or forecasted in the forward - looking statements . Factors that could cause actual results to differ materially from the results anticipated may include, but are not limited to, the following : ( 1 ) competitive pressures among depository and other financial institutions may increase significantly and have an effect on pricing, spending, third - party relationships, and revenue ; ( 2 ) the strength of the United States economy in general and the strength of the local economies in which we conduct operations may be different than expected resulting in, among other things, a deterioration in credit quality or a reduced demand for credit, including the resultant effect on our loan portfolio and allowance for loan losses ; ( 3 ) the rate of delinquencies and amounts of charge - offs, the level of the allowance for loan losses, the rates of loan growth, or adverse changes in asset quality in our loan portfolio, which may result in increased credit risk - related losses and expenses ; ( 4 ) the risk that the preliminary financial information reported herein and our current preliminary analysis will be different when our review is finalized ; ( 5 ) changes in the U . S . legal and regulatory framework ; ( 6 ) adverse conditions in the stock market, the public debt market, and other capital markets (including changes in interest rate conditions) could have a negative impact on our operations . We caution you not to place undue reliance on these forward - looking statements, which reflect management’s view only as of the date of this presentation . We are not obligated to update these statements or publicly release the result of any revisions to them to reflect events or circumstances after the date of this presentation or to reflect the occurrence of unanticipated events . Cautionary Note Regarding Forward - Looking Statements

Select Bancorp, Inc. is a rising franchise headquartered in Dunn, North Carolina with 13 offices in central and eastern North Carolina x R ecord earnings in 2016 with significant momentum into 2017 x Attractive footprint with access to high growth markets and a deep - rooted deposit base x Successful acquisition strategy and steady organic growth have vaulted the institution to $847 million in assets as of December 31, 2016 x Conservative underwriting standards have led to excellent asset quality x Strong capital levels to support future growth, both organic and acquisitive 3 Introduction Source: SNL Financial, FIG Partners, Company Documents

4 Leadership A native of North Carolina, Bill has been in the banking industry since 1981. Bill has served as President and Chief Executive Officer of Select Bank & Trust since 2014. He served as President and Chief Executive Officer of New Century Bank from 2007 – 2014 and as Chief Executive Officer of the former New Century Bank of Fayetteville from 2004 - 2007. He is a graduate of the University of North Carolina in Chapel Hill, N.C. William L. “Bill” Hedgepeth , II – President & Chief Executive Officer A native of Georgia, Mark has been in the banking industry since 2004. Mark has served as Chief Financial Officer of Select Bank since 2014. He served as Chief Financial Officer of Millennium Bank from 2009 - 2014 and as Chief Financial Officer of Asheville Savings Bank from 2007 - 2008. He also served as Controller and interim Chief Financial Officer of Gateway Bank from 2004 - 2007. He is a graduate of East Carolina University in Greenville, N.C. Mark A. Jeffries – Chief Financial Officer A native of Delaware, Keith has been in the banking industry since 1980. He has served as Chief Banking Officer since January 2017. He previously served as Regional Executive for the bank’s New Hanover and Brunswick County, North Carolina markets. He founded Port City Capital Bank in Wilmington in 2001 and served as the bank’s President and Chief Executive Officer until the bank was sold in 2006. He is a graduate of St. Andrews Presbyterian College in Laurinburg, N.C. W. Keith Betts – Chief Banking Officer A native of Virginia, Rick has been in the banking industry since 1981. He has served as Chief Credit Officer for Select Bank & Trust since 2014. He served as Chief Credit Officer for New Century Bank from 2012 - 2014 and as a Senior Credit Administrator from 2008 - 2012. He is a graduate of Appalachian State University in Boone, N.C. David Richard “Rick” Tobin, Jr. – Chief Credit Officer Name Business Experience J. Gary Ciccone Chairman of the Board Founding Director of New Century Bank of Fayetteville; Partner of Nimocks, Ciccone, & Townsend (real estate brokerage) James H. Glen Jr. Founding Director of Select Bank & Trust and Select Bancorp of Greenville; President of Glen and Hewett LLC in Charlotte, NC (consulting firm) Oscar N. Harris CPA; Senior Partner and President of Oscar Harris & Associates P.A.; Former N.C. State Sentor Alicia Speight Hawk Co-Director of Development for The Oakwood School in Greenville, NC Gerald W. Hayes Jr. Attorney; President of Hayes, Williams, Turner & Daughtry, P.A. William L. "Bill" Hedgepeth II President & Chief Executive Officer of Select Bank & Trust and Select Bancorp Ronald V. "Ronnie" Jackson Owner/operator of Clinton Truck and Tractor Company; John W. McCauley Chief Executive Officer of Highland Paving Co. LLC; General Manager of McCauley-McDonald Investments Carlie C. "Mack" McLamb Jr. President of Carlie C's IGA V. Parker Overton Founding member & former Chairman of the Board of Select Bank & Trust and Select Bancorp of Greenville; Retired owner of Overton's Sports Center Anthony E. "Tony" Rand Chairman of the North Carolina Post Release Supervision & Parole Commission; Former NC State Senator Sharon Lamb Raynor President and Owner of LIFE, Inc. (long-term care provider) K. Clark Stallings Vice President of Stallings Group Ltd. W. Lyndo Tippett Founding Direcor of New Century Bank of Fayetteville; CPA; former Partner of Tippett, Bryan and Merritt Board of Directors Source: SNL Financial A native of North Carolina, Lynn has been in the banking industry since 2003. Lynn has served as Chief Administrative Officer for Select Bank & Trust since 2014. She served as Corporate Ethics Officer and Human Resources Director from 2011 - 2014 and as the Human Resources Director from 2003 - 2014. Lynn is certified as a Senior Professional of Human Resources (SPHR) and as a Corporate Compliance Ethics Professional (CCEP). She is a graduate of Wake Technical Community College in Raleigh, N.C. Lynn H. Johnson – Chief Administrative Officer

5 Recent Highlights ▪ Reached $847 million in assets in the fourth quarter of 2016 ▪ Earned a record $6.6 million in 2015 and $6.8 million in 2016 ▪ Achieved 10% loan growth in 2016 ▪ Despite strong loan growth, NPA/Assets decreased by 29% in 2016 ▪ Announced a Stock Repurchase Plan in August to purchase up to 5% of shares outstanding ▪ Recently hired a former Wilmington - based community bank CEO, W. Keith Betts, to lead the expansion of the branch franchise ▪ Consolidated two Greenville branches, two Fayetteville branches and two Burlington branches for added efficiency and increased profitability ▪ Completed the acquisition of two branches from Yadkin Bank, located in Morehead City and Leland Source: SNL Financial, FIG Partners, Company Documents

6 Geographic Footprint Wilmington SLCT Branch List June 2016 June 2015 Deposits ($000) Deposits ($000) 1101 New Pointe Blvd Leland NC 7,671 13,543 111 Northeast Blvd Clinton NC 37,172 33,724 155 N Market St Washington NC 15,734 18,196 168 NC Hwy 24 Morehead City NC 19,238 28,534 2818 Raeford Rd Fayetteville NC 92,892 85,140 3158 S Church St Burlington NC 33,609 11,870 3600 Charles Blvd Greenville NC 102,025 88,262 416 S Hughes Blvd Elizabeth City NC 51,329 48,106 431 N Spence Ave Goldsboro NC 68,222 73,204 4400 Fayetteville Rd Lumberton NC 37,168 36,364 4505 Falls of Neuse Rd Raleigh NC 6,156 5,404 700 W Cumberland St Dunn NC 168,056 115,284 818 McKinney Pkwy Lillington NC 22,353 23,318 Street Address City State Deposit History 13 Branches in Central & Eastern North Carolina Source: SNL Financial, FIG Partners

7 Financial Overview SELECT BANCORP, INC. - SLCT Company Information Type: Bank For the Twelve Months Ended 700 West Cumberland Street CEO: William L. Hedgepeth II (54) In $000s except for per share data 12/31/14 12/31/15 12/31/2016* 03/31/16 06/30/16 09/30/16 12/31/2016* Dunn, NC 28334 CFO: Mark A. Jeffries (60) (910) 892-7080 Number of Offices: 13 https://www.selectbank.com/ Number of Employees: 150 Balance Sheet Total Assets $766,121 $817,015 $846,640 $830,395 $826,588 $844,774 $846,640 SLCT - Total Return (%) Total Gross Loans $552,038 $617,398 $677,195 $629,619 $632,187 $651,743 $677,195 SLCT 49.04% Total Deposits $618,902 $651,161 $679,661 $667,654 $661,274 $677,121 $679,661 Loans/Deposits 89.20% 94.81% 99.64% 94.30% 95.60% 96.25% 99.64% Capital Common Equity $90,040 $97,057 $104,273 $99,210 $101,531 $103,191 $104,273 Preferred Equity $7,645 $7,645 $0 $0 $0 $0 $0 Total Equity/Assets 12.75% 12.82% 12.32% 11.95% 12.28% 12.22% 12.32% Tang. Common Equity/Tang. Assets 10.76% 10.99% 11.49% 11.08% 11.43% 11.39% 11.49% Tangible Equity/Tangible Assets 11.77% 11.93% 11.49% 11.08% 11.43% 11.39% 11.49% Tier 1 Capital 16.56% 15.04% 14.03% 13.80% 14.13% 14.29% 14.03% Leverage Ratio 13.07% 13.81% 12.99% 12.46% 12.89% 13.28% 12.99% Profitability Measures Net Interest Margin 3.88% 4.38% 4.06% 4.14% 4.24% 4.27% 3.98% Non Interest Income/Average Assets 0.43% 0.39% 0.39% 0.41% 0.40% 0.38% 0.35% Non Interest Expense/Average Assets 2.96% 2.77% 2.68% 2.70% 2.69% 2.75% 2.61% Efficiency Ratio 77.16% 66.04% 65.15% 65.46% 62.87% 62.40% 63.84% ROAA 0.37% 0.86% 0.81% 0.72% 0.93% 0.85% 0.76% ROAE 3.12% 6.42% 6.61% 5.99% 7.58% 6.75% 6.12% Earnings per share $0.26 $0.56 $0.58 $0.13 $0.16 $0.15 $0.14 Net Income $2,357 $6,553 $6,754 $1,503 $1,907 $1,739 $1,605 Asset Quality NPAs/Assets 1.76% 1.24% 0.88% 1.28% 1.15% 0.96% 0.88% NCOs/Avg Loans 0.00% 0.12% 0.02% -0.10% 0.00% 0.09% 0.08% Reserves/Loans 1.24% 1.14% 1.24% 1.20% 1.22% 1.21% 1.24% Reserves/NPAs 50.84% 69.43% 112.45% 70.76% 80.93% 97.24% 112.45% STOCK INFORMATION Price: $10.06 Exchange: NASDAQ Nbr of Shares Outstanding: 11,645,413 Nbr of Estimates 1 Price as of market close: 01/17/17 Common Mkt Value ($M): 117.0 LTM Dividend $0.00 Mean EPS Estimate 0.60 Tangible Book Value $8.20 Total Common Cap ($M): 117.0 LTM Dividend Payout Ratio 0.00% Current Pricing Ratios Price Change (%) Volume Highlights Price/ Book (%) 113.40 One Day 1.11 Average Daily Volume Weekly Avg as % of Shares Out Average Daily $ Value Traded Price/ Tg Book (%) 122.73 One Month 1.21 13,147 0.57 $132,259 Price/ Earnings (x) 16.8 Three Month 23.44 22,894 0.98 $230,314 Price/ LTM EPS (x) 17.3 Year-to-Date 2.13 6,565 0.28 $66,044 Quarters Ended 0 500 Volume (000) -20 -10 0 10 20 30 40 50 60 70 Jan-15 Apr-15 Jul-15 Oct-15 Jan-16 Apr-16 Jul-16 Oct-16 Jan-17 * Unaudited Source: SNL Financial, FIG Partners, Company Documents

8 Creating Value Through M&A Merger with New Century Bancorp, Inc. Dunn, North Carolina Merger Details Announced: September 30, 2013 Completed: July 25, 2014 Deal Value: $29.9 million Consideration: 100% Stock Acquiror Financials (Announcement) Assets: $550.0 million Loans: $356.1 million Deposits: $465.5 million LTM Earnings: $3.4 million Acquired 2 Branches of Yadkin Bank Leland, North Carolina Morehead City, North Carolina Transaction Details Announced: June 9, 2015 Completed: December 11, 2015 Deposits Transferred: $30.8 million Loans Acquired: $9.1 million Source: SNL Financial, FIG Partners
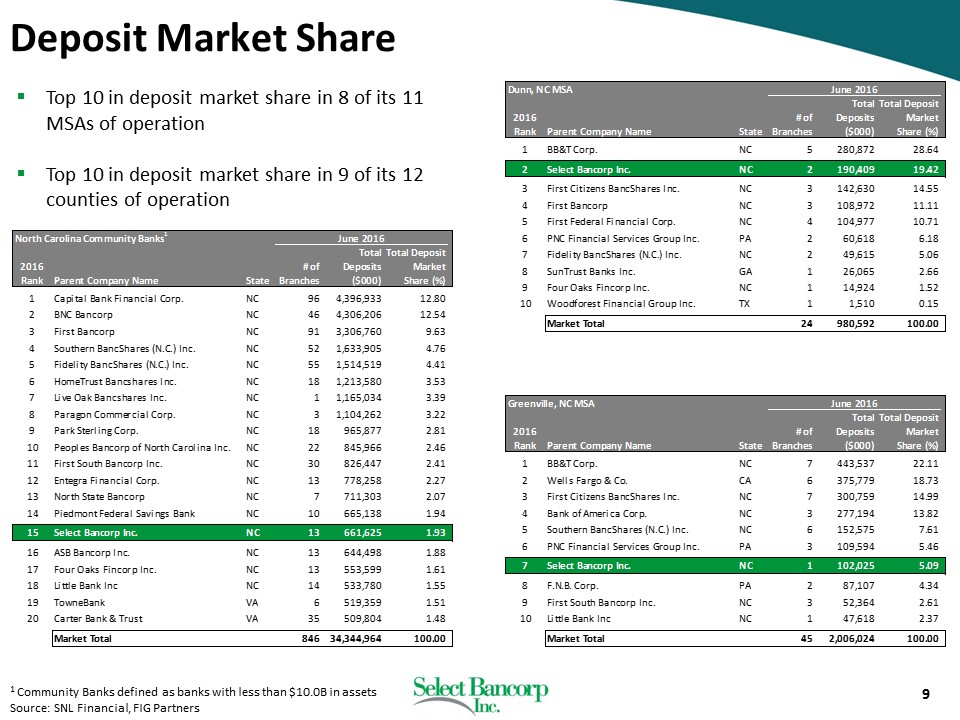
9 Deposit Market Share North Carolina Community Banks 12016 Rank Parent Company Name State # of Branches Total Deposits ($000) Total Deposit Market Share (%) 1 Capital Bank Financial Corp. NC 96 4,396,933 12.80 2 BNC Bancorp NC 46 4,306,206 12.54 3 First Bancorp NC 91 3,306,760 9.63 4 Southern BancShares (N.C.) Inc. NC 52 1,633,905 4.76 5 Fidelity BancShares (N.C.) Inc. NC 55 1,514,519 4.41 6 HomeTrust Bancshares Inc. NC 18 1,213,580 3.53 7 Live Oak Bancshares Inc. NC 1 1,165,034 3.39 8 Paragon Commercial Corp. NC 3 1,104,262 3.22 9 Park Sterling Corp. NC 18 965,877 2.81 10 Peoples Bancorp of North Carolina Inc. NC 22 845,966 2.46 11 First South Bancorp Inc. NC 30 826,447 2.41 12 Entegra Financial Corp. NC 13 778,258 2.27 13 North State Bancorp NC 7 711,303 2.07 14 Piedmont Federal Savings Bank NC 10 665,138 1.94 15 Select Bancorp Inc. NC 13 661,625 1.93 16 ASB Bancorp Inc. NC 13 644,498 1.88 17 Four Oaks Fincorp Inc. NC 13 553,599 1.61 18 Little Bank Inc NC 14 533,780 1.55 19 TowneBank VA 6 519,359 1.51 20 Carter Bank & Trust VA 35 509,804 1.48 Market Total 846 34,344,964 100.00 June 2016 1 Community Banks defined as banks with less than $10.0B in assets Source: SNL Financial, FIG Partners Dunn, NC MSA 2016 Rank Parent Company Name State # of Branches Total Deposits ($000) Total Deposit Market Share (%) 1 BB&T Corp. NC 5 280,872 28.64 2 Select Bancorp Inc. NC 2 190,409 19.42 3 First Citizens BancShares Inc. NC 3 142,630 14.55 4 First Bancorp NC 3 108,972 11.11 5 First Federal Financial Corp. NC 4 104,977 10.71 6 PNC Financial Services Group Inc. PA 2 60,618 6.18 7 Fidelity BancShares (N.C.) Inc. NC 2 49,615 5.06 8 SunTrust Banks Inc. GA 1 26,065 2.66 9 Four Oaks Fincorp Inc. NC 1 14,924 1.52 10 Woodforest Financial Group Inc. TX 1 1,510 0.15 Market Total 24 980,592 100.00 June 2016 Greenville, NC MSA 2016 Rank Parent Company Name State # of Branches Total Deposits ($000) Total Deposit Market Share (%) 1 BB&T Corp. NC 7 443,537 22.11 2 Wells Fargo & Co. CA 6 375,779 18.73 3 First Citizens BancShares Inc. NC 7 300,759 14.99 4 Bank of America Corp. NC 3 277,194 13.82 5 Southern BancShares (N.C.) Inc. NC 6 152,575 7.61 6 PNC Financial Services Group Inc. PA 3 109,594 5.46 7 Select Bancorp Inc. NC 1 102,025 5.09 8 F.N.B. Corp. PA 2 87,107 4.34 9 First South Bancorp Inc. NC 3 52,364 2.61 10 Little Bank Inc NC 1 47,618 2.37 Market Total 45 2,006,024 100.00 June 2016 ▪ Top 10 in deposit market share in 8 of its 11 MSAs of operation ▪ Top 10 in deposit market share in 9 of its 12 counties of operation

10 Transformational Asset Growth $589.7 $585.5 $525.6 $483.9 $786.3 $846.6 $282.3 $30.7 $0.0 $100.0 $200.0 $300.0 $400.0 $500.0 $600.0 $700.0 $800.0 $900.0 $1,000.0 2011 2012 2013 2014 2015 2016 Assets ($M) Note: Dollars in millions Source: SNL Financial, FIG Partners Total: $766.1 Total: $817.0 Acquisition of 2 Yadkin Bank Branches Merger With New Century Bancorp, Inc.

11 Loan Portfolio $417.6 $367.9 $346.5 $552.0 $617.4 $677.2 $200.0 $300.0 $400.0 $500.0 $600.0 $700.0 $800.0 2011 2012 2013 2014 2015 2016 Gross Loans Note: Dollars in millions Note: Regulatory data shown Source: SNL Financial, FIG Partners C&D 14.9% 1 - 4 Fam 14.4% HELOC 6.1% OwnOcc CRE 17.8% Other CRE 21.8% Multifam 8.3% C&I 10.4% Consr & Other 6.3% 4 Q16 Loan Portfolio Composition Historical Loan Growth

Non Int. Bearing 4.4% NOW Accts 4.7% MMDA & Sav 46.3% Time Deposits < $100k 13.3% Time Deposits > $100k 31.3% 12 Deposit Growth $501.4 $498.6 $448.5 $618.9 $651.2 $679.7 $200.0 $250.0 $300.0 $350.0 $400.0 $450.0 $500.0 $550.0 $600.0 $650.0 $700.0 $750.0 2011 2012 2013 2014 2015 2016 Deposits 4 Q16 Deposit Mix Historical Deposit Growth Note: Dollars in millions Note: Regulatory data shown Source: SNL Financial, FIG Partners

13 Asset Quality 3.84% 2.54% 3.40% 1.76% 1.24% 0.88% 3.73% 2.87% 2.04% 1.66% 1.17% 0.97% 0.0% 1.0% 2.0% 3.0% 4.0% 5.0% 2011 2012 2013 2014 2015 2016 NPAs (%) NPAs/Assets SLCT Peers ▪ Non - Performing Assets/Assets are at lowest level since 2011 (0.88%) ▪ Net Charge - offs/Avg. Loans are low, only 0.12% for 2015 and 0.02% for 2016 ▪ Management believes the Company is adequately reserved with Loan Loss Reserves/Gross Loans of 1.24% Note: Peer group defined on p.16 Source: SNL Financial, Company Documents

14 Capital 6.5% 5.0% 10.0% 8.0% 6.0% 8.0% 5.1% 6.0% 0.0% 2.0% 4.0% 6.0% 8.0% 10.0% 12.0% 14.0% 16.0% Common Equity Tier 1 Capital Ratio (%) Tier 1 Leverage Ratio (%) Total Risk Based Capital Ratio (%) Tier 1 Capital Ratio (%) Capital Adequacy 12/31/2016 Reg. Well Capitalized Threshold SLCT Capital in Excess of requirement 12.5% 13.0% 15.1% 14.0% Note: Data reflects holding company financials Source: SNL Financial, FIG Partners

15 Profitability $(163) $4,637 $2,941 $2,357 $6,553 $6,754 $(0.02) $0.67 $0.43 $0.26 $0.56 $0.58 -$0.1 $0.0 $0.1 $0.2 $0.3 $0.4 $0.5 $0.6 $0.7 $0.8 -$1,000.0 $0.0 $1,000.0 $2,000.0 $3,000.0 $4,000.0 $5,000.0 $6,000.0 $7,000.0 $8,000.0 2011 2012 2013 2014 2015 2016 EPS/ Share ($) Net Income ($M) Net Income Net income EPS Source: SNL Financial, Company Documents

Sorted by Market Cap Market Data Financial Highlights Price to: Div. Weekly Short Insider Institut. LTM Total Total TCE NPAs/ LTM LTM Mkt Cap Tg Bk EPS Yield Volume Interest Own. Own. Return Assets Loans /TA Assets ROAA ROAE Ticker Institution City State Exchange ($M) (%) (x) (%) (%) (%) (%) (%) (%) ($M) ($M) (%) (%) (%) (%) ANCX Access National Corp. Reston VA NASDAQ $291.2 243.1% 17.8x 2.2% 1.4% 10.9% 30.9% 25.8% 57.4% $1,430.7 $1,085.4 NA% 0.48% 1.27% 14.11% NKSH National Bankshares Inc. Blacksburg VA NASDAQ 304.1 170.7 20.1 2.8 0.6 4.3 3.3 34.3 35.7 1,203.2 636.7 14.9 1.11 1.26 8.45 PBNC Paragon Commercial Corp. Raleigh NC NASDAQ 246.6 181.2 16.9 -- 0.5 -- 24.1 41.8 69.2 1,503.8 1,191.3 9.1 0.38 0.95 11.35 SFST Southern First Bancshares Inc Greenville SC NASDAQ 240.5 220.8 19.2 -- 1.0 2.2 10.7 63.1 66.0 1,339.9 1,171.4 8.1 0.95 1.04 12.73 SONA Southern National Bncp of VA McLean VA NASDAQ 200.3 176.3 19.2 2.0 1.4 1.1 7.7 69.1 30.4 1,135.4 912.8 10.1 1.08 0.99 8.60 ESXB Community Bankers Trust Corp Richmond VA NASDAQ 165.8 146.1 16.8 0.0 0.4 0.0 3.6 48.9 56.6 1,249.9 888.3 9.1 1.36 0.83 8.92 CFFI C&F Financial Corp. Toano VA NASDAQ 157.1 126.4 12.4 2.9 1.1 0.9 7.3 26.6 22.2 1,425.0 1,039.4 8.8 0.65 0.90 9.43 ENFC Entegra Financial Franklin NC NASDAQ 141.0 108.4 22.2 -- 0.6 0.0 3.0 42.1 24.9 1,292.9 748.9 10.1 0.79 0.55 4.72 PEBK Peoples Bancorp of NC Inc. Newton NC NASDAQ 143.6 133.6 16.1 1.5 0.3 0.1 23.5 23.9 44.5 1,088.0 729.5 9.9 0.38 0.85 8.11 OPOF Old Point Financial Corp. Hampton VA NASDAQ 137.1 142.1 42.5 1.4 0.3 0.1 17.8 30.4 53.1 905.8 593.9 10.7 2.10 0.37 3.40 FCCO First Community Corp. Lexington SC NASDAQ 139.2 183.9 21.2 1.7 0.4 0.0 8.2 43.9 57.7 914.8 552.4 8.3 0.76 0.75 8.08 ASBB ASB Bncp Inc Asheville NC NASDAQ 120.4 131.8 21.6 -- 0.5 0.2 19.4 25.7 27.8 797.2 605.0 11.5 1.31 0.70 5.91 FSBK First South Bancorp Inc. Washington NC NASDAQ 115.8 140.6 17.9 1.0 0.3 0.1 9.4 18.2 46.0 985.8 689.8 8.4 0.84 0.69 7.66 BOTJ Bank of the James Finl Grp Inc Lynchburg VA NASDAQ 66.8 135.1 20.3 1.6 0.3 0.0 11.6 31.4 26.4 574.2 473.9 8.6 0.94 0.60 6.60 FBSS Fauquier Bankshares Inc. Warrenton VA NASDAQ 63.3 116.7 NM 2.8 0.3 0.1 5.8 17.2 13.5 623.9 457.3 8.7 1.59 -0.15 -1.64 HMTA HomeTown Bankshares Corp. Roanoke VA NASDAQ 61.7 128.9 22.4 -- 0.1 0.0 7.8 6.5 23.0 507.7 404.2 9.4 2.25 0.62 6.44 SLCT Select Bancorp Inc. Dunn NC NASDAQ 121.1 127.0 17.9 -- 0.6 0.2 22.0 12.9 30.0 846.6 677.2 11.5 0.88 0.81 6.61 Avg. 162.1 155.4 20.4 1.8 0.6 1.3 12.1 34.3 40.9 1,061.1 761.3 9.7 1.06 0.76 7.68 Pricing 01/26/17 Median 142.3 141.4 19.2 1.7 0.4 0.1 8.8 30.9 40.1 1,111.7 709.6 9.1 0.95 0.79 8.10 16 Peer Comparison Includes major exchange - traded companies headquartered in NC, SC, and VA with $0.5 - $1.5 B in assets 1 1 Major exchanges defined as NYSE , NYSE MKT, and NASDAQ Source: SNL Financial, FIG Partners

17 Why Select Bancorp? x Attractive franchise in central and eastern North Carolina x Emerging presence in two of North Carolina’s most attractive markets : Raleigh and Wilmington x Capital strength to focus on continued growth in promising markets and acquisition opportunities x Low relative valuation on both a tangible book value and earnings basis compared to peers x Scarcity value - very few North Carolina based community banks of this size x Improving performance with capacity for earnings growth

18