Attached files
| file | filename |
|---|---|
| EX-32.2 - EXHIBIT 32.2 - SELECT BANCORP, INC. | tv488011_ex32-2.htm |
| EX-32.1 - EXHIBIT 32.1 - SELECT BANCORP, INC. | tv488011_ex32-1.htm |
| EX-31.2 - EXHIBIT 31.2 - SELECT BANCORP, INC. | tv488011_ex31-2.htm |
| EX-31.1 - EXHIBIT 31.1 - SELECT BANCORP, INC. | tv488011_ex31-1.htm |
| EX-23.1 - EXHIBIT 23.1 - SELECT BANCORP, INC. | tv488011_ex23-1.htm |
| EX-21.1 - EXHIBIT 21.1 - SELECT BANCORP, INC. | tv488011_ex21-1.htm |
| EX-10.10 - EXHIBIT 10.10 - SELECT BANCORP, INC. | tv488011_ex10-10.htm |
UNITED STATES
SECURITIES AND EXCHANGE COMMISSION
WASHINGTON, D.C. 20549
FORM 10-K
x ANNUAL REPORT PURSUANT TO SECTION 13 OR 15(d) OF THE SECURITIES EXCHANGE ACT OF 1934
For the fiscal year ended December 31, 2017
OR
¨ TRANSITION REPORT PURSUANT TO SECTION 13 OR 15(d) OF THE SECURITIES EXCHANGE ACT OF 1934
COMMISSION FILE NUMBER 000-50400
SELECT BANCORP, INC.
(Exact name of registrant as specified in its charter)
| NORTH CAROLINA | 20-0218264 |
| (State or Other Jurisdiction of | (I.R.S. Employer |
| Incorporation or Organization) | Identification No.) |
| 700 W. Cumberland Street, Dunn, North Carolina | 28334 |
| (Address of Principal Executive Offices) | (Zip Code) |
Registrant’s Telephone number, including area code: (910) 892-7080
Securities registered pursuant to Section 12(b) of the Act:
| Title of each class | Name of each exchange on which registered | |
| Common Stock, par value $1.00 per share | The NASDAQ Stock Market LLC |
Securities registered pursuant to Section 12(g) of the Act:
NONE
Indicate by check mark if the registrant is a well-known seasoned issuer, as defined in Rule 405 of the Securities Act. ¨ Yes x No
Indicate by check mark if the registrant is not required to file reports pursuant to Section 13 or Section 15(d) of the Act. ¨ Yes x No
Indicate by check mark whether the registrant (1) has filed all reports required to be filed by Section 13 or 15(d) of the Securities Exchange Act of 1934 during the preceding 12 months (or for such shorter period that the registrant was required to file such reports), and (2) has been subject to such filing requirements for the past 90 days.
x Yes ¨ No
Indicate by check mark whether the registrant has submitted electronically and posted on its corporate Web site, if any, every Interactive Data File required to be submitted and posted pursuant to Rule 405 of Regulation S-T (§ 232.405 of this chapter) during the preceding 12 months (or for such shorter period that the registrant was required to submit and post such files). x Yes ¨ No
Indicate by check mark if disclosure of delinquent filers pursuant to Item 405 of Regulation S-K is not contained herein, and will not be contained, to the best of registrant’s knowledge, in definitive proxy or information statements incorporated by reference in Part III of this Form 10-K or any amendment to this Form 10-K ¨
Indicate by check mark whether the registrant is a large accelerated filer, an accelerated filer, a non-accelerated filer, a smaller reporting company, or emerging growth company. See the definitions of “large accelerated filer,” “accelerated filer,” “smaller reporting company,” and “emerging growth company” in Rule 12b-2 of the Exchange Act. (Check one):
| Large accelerated filer ¨ | Accelerated filer x | |
| Non-accelerated filer ¨ (Do not check if a smaller reporting company) | Smaller reporting company ¨ | |
| Emerging growth company ¨ |
If an emerging growth company, indicate by check mark if the registrant has elected not to use the extended transition period for complying with any new or revised financial accounting standards provided pursuant to Section 13(a) of the Exchange Act.
Indicate by check mark whether the registrant is a shell company (as defined in Rule 12b-2 of the Act).
¨ Yes x No
State the aggregate market value of the voting and non-voting common equity held by non-affiliates computed by reference to the price at which the common equity was last sold, or the average bid and asked price of such common equity, as of the last business day of the registrant's most recently completed second fiscal quarter: $123,399,405.
Indicate the number of shares outstanding of each of the registrant’s classes of Common Stock as of the latest practicable date: 14,013,917 shares outstanding as of March 9, 2018.
Documents Incorporated by Reference:
Portions of the registrant’s Proxy Statement for its 2018 Annual Meeting of Shareholders are incorporated by reference into Part III hereof.
FORM 10-K CROSS-REFERENCE INDEX
| - 2 - |
General
Select Bancorp, Inc. (the “Registrant” or the “Company”) (formerly New Century Bancorp, Inc.) was incorporated under the laws of the State of North Carolina on May 14, 2003, at the direction of the Board of Directors of Select Bank & Trust Company (formerly New Century Bank), for the purpose of serving as the bank holding company for Select Bank & Trust Company (“Select Bank” or the “Bank”) and became the holding company for the Bank on September 19, 2003. To become the Bank’s holding company, the Registrant received the approval of the Federal Reserve Board as well as Select Bank’s shareholders. Upon receiving such approval, each outstanding share of common stock of Select Bank was exchanged on a one-for-one basis for one share of common stock of the Registrant. On July 25, 2014, New Century Bancorp, Inc. and New Century Bank changed their names to Select Bancorp, Inc. and Select Bank & Trust Company, respectively. This was in conjunction with the merger with “Legacy” Select Bancorp, Inc. and Select Bank & Trust Company of Greenville, NC. On December 15, 2017, the Registrant acquired Premara Financial, Inc. (“Premara”) and its banking subsidiary Carolina Premier Bank (“Carolina Premier”) of Charlotte, North Carolina. Under the terms of that acquisition, Premara was merged with and into the Registrant, Carolina Premier was merged with and into the Bank, and shareholders of Premara received 1.0463 shares of the Registrant’s common stock or $12.65 in cash for each outstanding share of Premara common stock, with approximately 70% of such shares being exchanged for shares of the Registrant’s common stock and 30% being exchanged for cash.
The Registrant operates for the primary purpose of serving as the holding company for its subsidiary depository institution, Select Bank & Trust Company. The Registrant’s headquarters is located at 700 West Cumberland Street, Dunn, North Carolina 28334.
The Bank was incorporated on May 19, 2000 as a North Carolina-chartered commercial bank, opened for business on May 24, 2000, and is located at 700 West Cumberland Street, Dunn, North Carolina.
The Bank operates for the primary purpose of serving the banking needs of individuals and small to medium-sized businesses in its market area. The Bank offers a range of banking services including checking and savings accounts, commercial, consumer, mortgage and personal loans, and other associated financial services.
Primary Market Area
The Registrant’s market area consists of portions of central and eastern North Carolina which includes Alamance, Beaufort, Brunswick, Carteret, Cumberland, Harnett, Mecklenburg, New Hanover, Pasquotank, Pitt, Robeson, Sampson, Wake and Wayne counties and portions of northwestern South Carolina in Cherokee, Pickens and York counties. The Bank has branch offices in Dunn, Burlington, Charlotte, Clinton, Elizabeth City, Fayetteville, Goldsboro, Greenville, Leland, Lillington, Lumberton, Morehead City, Raleigh and Washington, North Carolina and Rock Hill, Blacksburg and Six Mile, South Carolina. The Registrant’s market area has a population of over 3.8 million with an average household income of over $44,500.
| - 3 - |
Total deposits in the Registrant’s market area exceeded $228 billion at June 30, 2017. The leading economic components of Alamance County, North Carolina, are healthcare and education with the largest employers being LabCorp, the public school system, the Alamance Regional Medical Center and Elon University. In Beaufort County, North Carolina, the top employers are the Beaufort County Schools, PCS Phosphate Company, Vidant Medical Center and other manufacturing facilities and public administration. Brunswick County North Carolina’s leading industries are education, public administration with the County of Brunswick, Progress Energy and a Food Lion distribution center. In Carteret County, North Carolina, it is public services that are leading economic factors as education, health services and public administration are the leading employers followed by major retailers including Wal-Mart, Food Lion and Big Rock Sports LLC, an outdoor sporting goods distributor. Cumberland County, North Carolina’s leading sector is the Department of Defense with extensions of the Army, Navy and Air Force located there, followed by Cape Fear Valley Health Systems, a Wal-Mart distribution Center, county and city administration and Goodyear Tire manufacturing facility. The U.S. Department of Veteran’s Affairs and Fayetteville Technical Community College also employ over 1,000 in Cumberland County. In Harnett County, North Carolina, top economic sectors are Harnett County Schools, along with a Food Lion distribution center, Campbell University, public administration, Betsy Johnson Memorial Hospital and a new Rooms To Go manufacturing and distribution center. In New Hanover County, North Carolina, education, health services and government officers are leaders in the economy. New Hanover Regional Medical Center, the school system and the University of North Carolina at Wilmington are the largest employers along with PPD Development, a pharmaceutical company. In Mecklenburg County, education, financial activities and health services are leading industries. The Charlotte-Mecklenburg Hospital and school systems are top employers along with Wells Fargo and Bank of America. Transportation is also a leading industry in Mecklenburg County with American Airlines as a top employer. In Pasquotank County, North Carolina, education, health services and the U.S. Department of Homeland Security through the U.S. Coast Guard base in Elizabeth City are top employers. Pitt County, North Carolina, has a mix of education and health services employers and still relies heavily on manufacturing with over 1,000 jobs attributable to NACCO Materials Handling Group as well as being home to East Carolina University and Vidant Medical Center. In Robeson County, North Carolina, leading sectors include education, health services, and manufacturing with Mountaire Farms of N.C. employing over 1,000. Robeson County is also home to UNC Pembroke and the Campbell Soup Supply Company. In Sampson County, North Carolina, leading sectors include education, manufacturing, agriculture and natural resources with top employers including Smithfield Foods, Prestage Farms and Hog Slat. In Wake County, North Carolina, leading sectors include government, education, healthcare, and technology. Wayne County North Carolina’s leading sectors are the federal government and military services, education and retail trade. In South Carolina’s Cherokee County, manufacturing, administrative and waste management are leading industries. Brown Packing Company, the Cherokee County School District and Ambassador Personnel are among the largest employers. In Pickens County, South Carolina, state government and education are leading the economy with both the state government offices and Clemson University among the largest employers. In York County, South Carolina, manufacturing, medical, retail and education are leading economic components as Kent Companies, a concrete contractor, York Hospital, the federal government and Wal-Mart are the top employers.
Competition
Commercial banking in the North Carolina and South Carolina markets in which the Bank operates is extremely competitive. The Registrant competes in its market areas with some of the largest banking organizations in the state and the country and other financial institutions, such as federally and state-chartered savings and loan institutions and credit unions, as well as consumer finance companies, mortgage companies and other lenders engaged in the business of extending credit. Many of the Registrant’s competitors have broader geographic markets and higher lending limits than Registrant and are also able to provide more services and make greater use of advertising. As of June 30, 2017, data provided by the FDIC Deposit Market Share Report indicated that, within the Registrant’s market area, there were 903 offices of insured depository institutions (38 in Alamance County, 14 in Beaufort County, 38 in Brunswick County, 26 in Carteret County, 60 in Cumberland County, 24 in Harnett County, 235 in Mecklenburg County, 12 in Pasquotank County, 45 in Pitt County, 30 in Robeson County, 14 in Sampson County, 252 in Wake County and 28 in Wayne County, all in North Carolina and 10 in Cherokee County, 30 in Pickens County and 47 in York County, South Carolina), including offices of the Bank.
The enactment of legislation authorizing interstate banking resulted in great increases in the size and financial resources of some of the Registrant’s competitors. In addition, larger out-of-state commercial banks have recently acquired a number of North Carolina and South Carolina banks and further heightened the competition among banks.
| - 4 - |
Despite the competition in its market areas, the Registrant believes that it has certain competitive advantages that distinguish it from its competition. The Registrant believes that its primary competitive advantages are its strong local identity and affiliation with the community and its emphasis on providing specialized services to small and medium-sized business enterprises, as well as professional and upper-income individuals. The Registrant offers customers modern, high-tech banking without forsaking community values such as prompt, personal service and friendliness. The Registrant offers many personalized services and intends to attract customers by being responsive and sensitive to their individualized needs. The Registrant also relies on goodwill and referrals from shareholders and satisfied customers, as well as traditional marketing media to attract new customers. To enhance a positive image in the community, the Registrant supports and participates in local events and its officers and directors serve on boards of local civic and charitable organizations.
Employees
As of December 31, 2017, the Registrant employed 202 full time equivalent employees. None of the Registrant’s employees are covered by a collective bargaining agreement. The Registrant believes relations with its employees to be good.
Regulation
Regulation of the Bank
General. The Bank is a North Carolina chartered commercial bank and its deposit accounts are insured by the Deposit Insurance Fund (“DIF”) administered by the Federal Deposit Insurance Corporation (“FDIC”). The Bank is subject to supervision, examination and regulation by the North Carolina Office of the Commissioner of Banks (“Commissioner”) and the FDIC and to North Carolina and federal statutory and regulatory provisions governing such matters as capital standards, dividends, mergers, subsidiary investments and establishment of branch offices. The Bank is required to file reports with the Commissioner and the FDIC concerning its activities and financial condition and is required to obtain regulatory approval prior to entering into certain transactions, including mergers with, or acquisitions of, other depository institutions.
As a federally insured depository institution, the Bank is subject to various regulations promulgated by the Board of Governors of the Federal Reserve System (“Federal Reserve Board”) or (“FRB”), including Regulation B (Equal Credit Opportunity), Regulation D (Reserve Requirements), Regulation E (Electronic Fund Transfers), Regulation O (Loans to Insiders), Regulation W (Transactions with Affiliates), Regulation Z (Truth in Lending), Regulation CC (Availability of Funds and Collection of Checks) and Regulation DD (Truth in Savings).
The system of regulation and supervision applicable to the Bank establishes a comprehensive framework for the operations of the Bank, and is intended primarily for the protection of the FDIC and the depositors of the Bank, rather than shareholders. Changes in the regulatory framework could have a material effect on the Bank that in turn, could have a material effect on the Registrant. This discussion does not purport to be a complete explanation of all such laws and regulations.
State Law. The Bank is subject to extensive supervision and regulation by the Commissioner. The Commissioner oversees state laws that set specific requirements for bank capital and deposits in, and loans and investments by, banks, including the amounts, types, and in some cases, rates. The Commissioner supervises and performs periodic examinations of North Carolina-chartered banks to assure compliance with state banking statutes and regulations, and the Bank is required to make regular reports to the Commissioner describing in detail its resources, assets, liabilities and financial condition. Among other things, the Commissioner regulates mergers and consolidations of state-chartered banks, the payment of dividends, loans to officers and directors, record keeping, types and amounts of loans and investments, and the establishment of branches.
| - 5 - |
North Carolina Banking Law Modernization Act. On October 1, 2012, as a result of the recommendations of the Joint Legislative Study Commission on the Modernization of North Carolina Banking Laws, legislation went into effect that comprehensively modernized North Carolina’s banking laws for the first time since the Great Depression. As a result of the legislation, Articles 1 through 10, 12, and 13 of Chapter 53 of the North Carolina General Statutes were repealed, and new Chapter 53C, entitled “Regulation of Banks,” became law. Major changes enacted by the law included: a comprehensive list of definitions enhancing the clarity and meaning of the various sections of North Carolina’s banking law, a broader reliance on the North Carolina Business Corporation Act, and incorporation of modern concepts of capital adequacy and regulatory supervision. In 2013, the North Carolina General Assembly made certain technical corrections and clarifications to Chapter 53C.
Dodd-Frank Wall Street Reform and Consumer Protection Act. In 2010, the Dodd-Frank Wall Street Reform and Consumer Protection Act (the “Dodd-Frank Act”) was signed into law. This law significantly changed the bank regulatory structure and affected the lending, deposit, investment, trading, and operating activities of financial institutions and their holding companies. The Dodd-Frank Act required various federal agencies to adopt a broad range of rules and regulations, and to prepare numerous studies and reports for Congress. The federal agencies have significant discretion in drafting rules and regulations, pursuant to the Dodd-Frank Act. The Dodd-Frank Act included, among other things:
| · | the creation of a Financial Stability Oversight Council to identify emerging systemic risks posed by financial firms, activities and practices, and to improve cooperation between federal agencies; |
| · | the creation of a Bureau of Consumer Financial Protection authorized to promulgate and enforce consumer protection regulations relating to financial products, which affects both banks and non-bank financial companies; |
| · | the establishment of strengthened capital and prudential standards for banks and bank holding companies; |
| · | enhanced regulation of financial markets, including derivatives and securitization markets; |
| · | the elimination of certain trading activities by banks; |
| · | a permanent increase of FDIC deposit insurance to $250,000 per depository category and an increase in the minimum deposit insurance fund reserve requirement from 1.15% to 1.35%, with assessments to be based on assets as opposed to deposits; |
| · | amendments to the Truth in Lending Act aimed at improving consumer protections with respect to mortgage originations, including originator compensation, minimum repayment standards, and prepayment considerations; and |
| · | disclosure and other requirements relating to executive compensation and corporate governance. |
The Dodd-Frank Act prohibits insured depository institutions and their holding companies from engaging in proprietary trading except in limited circumstances, and prohibits them from owning equity interests in excess of three percent (3%) of Tier 1 capital in private equity and hedge funds (known as the “Volcker Rule”).
In 2017, both the House of Representatives and the Senate introduced legislation that would repeal or modify provisions of the Dodd-Frank Act and significantly impact financial services regulation. Although the bills vary in content, certain key aspects include revisions to rules related to mortgage loans, delayed implementation of rules related to the Home Mortgage Disclosure Act, and reform and simplifications of certain Volcker Rule requirements. We cannot predict whether there will be additional proposed laws or reforms that would affect the U.S. financial system or financial institutions, whether or when such changes may be adopted, how such changes may be interpreted and enforced, or how such changes may affect us.
| - 6 - |
2017 Executive Order. On February 3, 2017, the President of the United States issued an executive order identifying “core principles” for the administration’s financial services regulatory policy and directing the Secretary of the Treasury, in consultation with the heads of other financial regulatory agencies, to evaluate how the current regulatory framework promotes or inhibits the principles and what actions have been, and are being, taken to promote the principles. In response to the executive order, on June 12, 2017, October 6, 2017 and October 26, 2017, respectively, the U.S. Department of the Treasury issued the first three of four reports recommending a number of comprehensive changes in the current regulatory system for U.S. depository institutions, the U.S. capital markets and the U.S. asset management and insurance industries.
Deposit Insurance. The Bank’s deposits are insured up to limits set by the Deposit Insurance Fund (“DIF”) of the FDIC. The DIF was formed on March 31, 2006, upon the merger of the Bank Insurance Fund and the Savings Insurance Fund in accordance with the Federal Deposit Insurance Reform Act of 2005 (the “Reform Act”). The Reform Act established a range of 1.15% to 1.50% within which the FDIC may set the Designated Reserve Ratio (the “reserve ratio” or “DRR”). The Dodd-Frank Act gave the FDIC greater discretion to manage the DIF, raised the minimum DIF reserve ratio to 1.35%, and removed the upper limit of 1.50%. In October 2010, the FDIC adopted a restoration plan to ensure that the DIF reserve ratio reaches 1.35% by September 30, 2020, as required by the Dodd-Frank Act. The FDIC also proposed a comprehensive, long-range plan for management of the DIF. As part of this comprehensive plan, the FDIC has adopted a final rule to set the DRR at 2.0%.
On October 3, 2008, the Emergency Economic Stabilization Act of 2008 was enacted and temporarily raised the standard minimum deposit insurance amount (the “SMDIA”) from $100,000 to $250,000 per depositor. On May 20, 2009, the Helping Families Save Their Homes Act extended the temporary increase in the SMDIA to $250,000 per depositor through December 31, 2013. On July 21, 2010, the Dodd-Frank Act permanently increased FDIC insurance coverage to $250,000 per depositor.
The FDIC imposes a risk-based deposit insurance premium assessment on member institutions in order to maintain the DIF. This assessment system was amended by the Reform Act and further amended by the Dodd-Frank Act. Under this system, as amended, the assessment rates for an insured depository institution vary according to the level of risk incurred in its activities. To arrive at an assessment rate for a banking institution, the FDIC places it in one of four risk categories determined by reference to its capital levels and supervisory ratings. In addition, in the case of those institutions in the lowest risk category, the FDIC further determines its assessment rate based on certain specified financial ratios or, if applicable, its long-term debt ratings. The assessment rate schedule can change from time to time, at the discretion of the FDIC, subject to certain limits. The Dodd-Frank Act changed the methodology for calculating deposit insurance assessments from the amount of an insured institution’s domestic deposits to its total assets minus tangible capital. On February 7, 2011, the FDIC issued a new regulation implementing these revisions to the assessment system. The regulation went into effect April 1, 2011.
The FDIC has authority to increase deposit insurance assessments. A significant increase in insurance premiums would likely have an adverse effect on the operating expenses and results of operations of the Registrant and the Bank. Management cannot predict what insurance assessment rates will be in the future.
Insurance of deposits may be terminated by the FDIC upon a finding that an insured institution has engaged in unsafe or unsound practices, is in an unsafe or unsound condition to continue operations or has violated any applicable law, regulation, rule, order or condition imposed by the FDIC. Management of the Bank is not aware of any practice, condition or violation that might lead to termination of its FDIC deposit insurance.
| - 7 - |
Capital Requirements. The federal banking regulators have adopted certain risk-based capital guidelines to assist in the assessment of the capital adequacy of a banking organization’s operations for both transactions reported on the balance sheet as assets and transactions, such as letters of credit, and recourse arrangements, which are recorded as off balance sheet items. Under these guidelines, nominal dollar amounts of assets and credit equivalent amounts of off-balance sheet items are multiplied by one of several risk adjustment percentages which range from 0% for assets with low credit risk, such as certain U.S. Treasury securities, to 1,250% for certain assets with high credit risk, such as securitization exposures.
A banking organization’s risk-based capital ratios are obtained by dividing its qualifying capital by its total risk adjusted assets. The regulators measure risk-adjusted assets, which include off balance sheet items, against both total qualifying capital (the sum of Common Equity Tier 1 capital and limited amounts of Tier 2 capital) and Tier 1 capital. “Common Equity Tier 1,” or core capital, includes common equity, qualifying noncumulative perpetual preferred stock and minority interests in equity accounts of consolidated subsidiaries, less goodwill and other intangibles, subject to certain exceptions. “Additional Tier 1 Capital” includes noncumulative perpetual preferred stock, tier 1 minority interests, grandfathered Trust preferred securities, and Troubled Asset Relief Program instruments less applicable regulatory adjustments and deductions. “Tier 2,” or supplementary capital, includes among other things, limited-life preferred stock, hybrid capital instruments, mandatory convertible securities, qualifying subordinated debt, and the allowance for loan and lease losses, subject to certain limitations and less required deductions. The inclusion of elements of Tier 2 capital is subject to certain other requirements and limitations of the federal banking agencies. Banks and bank holding companies subject to the risk-based capital guidelines are required to maintain a ratio of Tier 1 capital to risk-weighted assets of at least 5% and a ratio of total capital to risk-weighted assets of at least 10% to meet well capitalized thresholds. The appropriate regulatory authority may set higher capital requirements when particular circumstances warrant.
The federal banking agencies have adopted regulations specifying that they will include, in their evaluations of a bank’s capital adequacy, an assessment of the bank’s interest rate risk exposure. The standards for measuring the adequacy and effectiveness of a banking organization’s interest rate risk management include a measurement of board of director and senior management oversight, and a determination of whether a banking organization’s procedures for comprehensive risk management are appropriate for the circumstances of the specific banking organization.
Failure to meet applicable capital guidelines could subject a banking organization to a variety of enforcement actions, including limitations on its ability to pay dividends or expand with new branch offices or through acquisitions, the issuance by the applicable regulatory authority of a capital directive to increase capital and, in the case of depository institutions, the termination of deposit insurance by the FDIC, as well as the measures described under the “Federal Deposit Insurance Corporation Improvement Act of 1991” below, as applicable to undercapitalized institutions. In addition, future changes in regulations or practices could further reduce the amount of capital recognized for purposes of capital adequacy. Such a change could affect the ability of the Bank to grow and could restrict the amount of profits, if any, available for the payment of dividends to the Registrant and its shareholders.
On July 2, 2013, the Federal Reserve approved a final rule that establishes an integrated regulatory capital framework that addresses shortcomings in certain capital requirements. The rule implements in the United States the Basel III regulatory capital reforms from the Basel Committee on Banking Supervision and certain changes required by the Dodd-Frank Act.
| - 8 - |
The major provisions of the rule applicable to us are:
| · | The rule implements higher minimum capital requirements, includes a new common equity Tier1 capital requirement, and establishes criteria that instruments must meet in order to be considered Common Equity Tier 1 capital, additional Tier 1 capital, or Tier 2 capital. These enhancements both improve the quality and increase the quantity of capital required to be held by banking organizations, better equipping the U.S. banking system to deal with adverse economic conditions. The minimum capital to risk-weighted assets (“RWA”) requirements under the rule are a common equity Tier 1 capital ratio of 4.5% and a Tier 1 capital ratio of 6.0%, which is an increase from 4.0%, and a total capital ratio that remains at 8.0%. The minimum leverage ratio (Tier 1 capital to total assets) is 4.0%. The rule maintains the general structure of the current prompt corrective action, or PCA, framework while incorporating these increased minimum requirements. |
| · | The rule improves the quality of capital by implementing changes to the definition of capital. Among the most important changes are stricter eligibility criteria for regulatory capital instruments that would disallow the inclusion of instruments such as trust preferred securities in Tier 1 capital going forward, and new constraints on the inclusion of minority interests, mortgage-servicing assets (“MSAs”), deferred tax assets (“DTAs”), and certain investments in the capital of unconsolidated financial institutions. In addition, the rule requires that certain regulatory capital deductions be made from common equity Tier 1 capital. |
| · | Under the rule, in order to avoid limitations on capital distributions, including dividend payments and certain discretionary bonus payments to executive officers, a banking organization must hold a capital conservation buffer composed of common equity Tier 1 capital above its minimum risk-based capital requirements. This buffer is intended to help ensure that banking organizations conserve capital when it is most needed, allowing them to better weather periods of economic stress. The buffer is measured relative to RWA. A three-year phase-in of the capital conservation buffer requirements began on January 1, 2016. A banking organization with a buffer greater than 2.5% would not be subject to limits on capital distributions or discretionary bonus payments; however, a banking organization with a buffer of less than 2.5% would be subject to increasingly stringent limitations as the buffer approaches zero. The rule also prohibits a banking organization from making distributions or discretionary bonus payments during any quarter if its eligible retained income is negative in that quarter and its capital conservation buffer ratio was less than 2.5% at the beginning of the quarter. When the rule is fully phased in, the minimum capital requirements plus the capital conservation buffer will exceed the PCA well-capitalized thresholds. |
| · | The rule also increases the risk weights for past-due loans, certain commercial real estate loans, and some equity exposures, and makes selected other changes in risk weights and credit conversion factors. |
The Bank was required to comply with the new rule beginning on January 1, 2015. Compliance by the Registrant and the Bank with these capital requirements affects their respective operations by increasing the amount of capital required to conduct operations.
In October 2017, the federal banking agencies issued a notice of proposed rulemaking on simplifications to the final rules, a majority of which would apply solely to banking organizations that are not subject to the advanced approaches capital rule. Under the proposed rulemaking, non-advanced approaches banking organizations, such as the Registrant, would apply a simpler regulatory capital treatment for mortgage servicing assets (“MSAs”); certain deferred tax assets (“DTAs”) arising from temporary differences; investments in the capital of unconsolidated financial institutions; and capital issued by a consolidated subsidiary of a banking organization and held by third parties.
| - 9 - |
Specifically, the proposed rulemaking would eliminate: (i) the capital rule’s 10 percent common equity tier 1 capital deduction threshold that applies individually to MSAs, temporary difference DTAs, and significant investments in the capital of unconsolidated financial institutions in the form of common stock; (ii) the aggregate 15 percent common equity tier 1 capital deduction threshold that subsequently applies on a collective basis across such items; (iii) the 10 percent common equity tier 1 capital deduction threshold for non-significant investments in the capital of unconsolidated financial institutions; and (iv) the deduction treatment for significant investments in the capital of unconsolidated financial institutions not in the form of common stock. The capital rule would no longer have distinct treatments for significant and non-significant investments in the capital of unconsolidated financial institutions, but instead would require that non-advanced approaches banking organizations deduct from common equity tier 1 capital any amount of MSAs, temporary difference DTAs, and investments in the capital of unconsolidated financial institutions that individually exceeds 25 percent of common equity tier 1 capital. The proposed rulemaking also includes revisions to the treatment of certain acquisition, development, or construction exposures that are designed to address comments regarding the current definition of high volatility commercial real estate exposure under the capital rule’s standardized approach.
In November 2017, the federal banking agencies adopted a final rule to extend the regulatory capital treatment applicable during 2017 under the capital rules for certain items, including regulatory capital deductions, risk weights, and certain minority interest limitations. The relief provided under the final rule applies to banking organizations that are not subject to the capital rules’ advanced approaches, such as the Registrant. Specifically, the final rule extends the current regulatory capital treatment of mortgage servicing assets, deferred tax assets arising from temporary differences that could not be realized through net operating loss carrybacks, significant investments in the capital of unconsolidated financial institutions in the form of common stock, non-significant investments in the capital of unconsolidated financial institutions, significant investments in the capital of unconsolidated financial institutions that are not in the form of common stock, and common equity tier 1 minority interest, tier 1 minority interest, and total capital minority interest exceeding the capital rules’ minority interest limitations.
In December 2017, the Basel Committee on Banking Supervision published the last version of the Basel III accord, generally referred to as “Basel IV.” The Basel Committee stated that a key objective of the revisions incorporated into the framework is to reduce excessive variability of risk-weighted assets (“RWA”), which will be accomplished by enhancing the robustness and risk sensitivity of the standardized approaches for credit risk and operational risk, which will facilitate the comparability of banks’ capital ratios; constraining the use of internally modeled approaches; and complementing the risk-weighted capital ratio with a finalized leverage ratio and a revised and robust capital floor. Leadership of the federal banking regulators, who are tasked with implementing Basel IV, supported the revisions. Although it is uncertain at this time, we anticipate some, if not all, of the Basel IV accord may be incorporated into the capital requirements framework applicable to the Registrant.
Prompt Corrective Action. Under the Federal Deposit Insurance Corporation Improvement Act of 1991 (“FDICIA”), the federal banking regulators are required to take prompt corrective action if an insured depository institution fails to satisfy the minimum capital requirements discussed above, including a leverage limit, a risk-based capital requirement, and any other measure deemed appropriate by the federal banking regulators for measuring the capital adequacy of an insured depository institution. All institutions, regardless of their capital levels, are restricted from making any capital distribution or paying any management fees if the institution would thereafter fail to satisfy the minimum levels for any of its capital requirements. An institution that fails to meet the minimum level for any relevant capital measure (an “undercapitalized institution”) may be: (i) subject to increased monitoring by the appropriate federal banking regulator; (ii) required to submit an acceptable capital restoration plan within 45 days; (iii) subject to asset growth limits; and (iv) required to obtain prior regulatory approval for acquisitions, branching and new lines of business. The capital restoration plan must include a guarantee by the institution’s holding company that the institution will comply with the plan until it has been adequately capitalized on average for four consecutive quarters, under which the holding company would be liable up to the lesser of 5% of the institution’s total assets or the amount necessary to bring the institution into capital compliance as of the date it failed to comply with its capital restoration plan. A “significantly undercapitalized” institution, as well as any undercapitalized institution that does not submit an acceptable capital restoration plan, may be subject to regulatory demands for recapitalization, broader application of restrictions on transactions with affiliates, limitations on interest rates paid on deposits, asset growth and other activities, possible replacement of directors and officers, and restrictions on capital distributions by any bank holding company controlling the institution. Any company controlling the institution may also be required to divest the institution or the institution could be required to divest subsidiaries. The senior executive officers of a significantly undercapitalized institution may not receive bonuses or increases in compensation without prior regulatory approval and the institution is prohibited from making payments of principal or interest on its subordinated debt. In their discretion, the federal banking regulators may also impose the foregoing sanctions on an undercapitalized institution if the regulators determine that such actions are necessary to carry out the purposes of the prompt corrective action provisions. If an institution’s ratio of tangible capital to total assets falls below the “critical capital level” established by the appropriate federal banking regulator, the institution will be subject to conservatorship or receivership within specified time periods.
| - 10 - |
As discussed above, on July 2, 2013, the Federal Reserve Board, and on July 9, 2013, the FDIC, adopted a final rule that implements the Basel III changes to the international regulatory capital framework, referred to as the “Basel III Rules.” The Basel III Rules apply to both depository institutions and (subject to certain exceptions not applicable to the Registrant) their holding companies. Although parts of the Basel III Rules apply only to large, complex financial institutions, substantial portions of the Basel III Rules apply to the Registrant and the Bank. The Basel III Rules include requirements contemplated by the Dodd-Frank Act as well as certain standards initially adopted by the Basel Committee on Banking Supervision in December 2010.
The Basel III Rules include new risk-based and leverage capital ratio requirements which refine the definition of what constitutes “capital” for purposes of calculating those ratios. The minimum capital level requirements applicable to the Registrant and the Bank under the Basel III Rules are: (i) a common equity Tier 1 risk-based capital ratio of 4.5 percent; (ii) a Tier 1 risk-based capital ratio of 6 percent (increased from 4 percent); (iii) a total risk-based capital ratio of 8 percent (unchanged from prior rules); and (iv) a Tier 1 leverage ratio of 4 percent for all institutions. Common equity Tier 1 capital will consist of retained earnings and common stock instruments, subject to certain adjustments.
The Basel III Rules also established a “capital conservation buffer” of 2.5 percent above the new regulatory minimum risk-based capital requirements. The conservation buffer, when added to the capital requirements, result in the following minimum ratios: (i) a common equity Tier 1 risk-based capital ratio of 7.0 percent, (ii) a Tier 1 risk-based capital ratio of 8.5 percent, and (iii) a total risk-based capital ratio of 10.5 percent. The new capital conservation buffer requirement is being phased in beginning in January 2016 at 0.625 percent of risk-weighted assets with increases to that amount each year until full implementation in January 2019. An institution is subject to limitations on certain activities including payment of dividends, share repurchases and discretionary bonuses to executive officers if its capital level is below the buffer amount.
The Basel III Rules also revised the prompt corrective action framework, which is designed to place restrictions on insured depository institutions, including the Bank, if their capital levels do not meet certain thresholds. These revisions became effective on January 1, 2015. The prompt corrective action rules were modified to include a common equity Tier 1 capital component and to increase certain other capital requirements for the various thresholds. For example, under the prompt corrective action rules, insured depository institutions are required to meet the following capital levels in order to qualify as “well capitalized:” (i) a new common equity Tier 1 risk-based capital ratio of 6.5 percent; (ii) a Tier 1 risk-based capital ratio of 8 percent (increased from 6 percent); (iii) a total risk-based capital ratio of 10 percent (unchanged from prior rules); and (iv) a Tier 1 leverage ratio of 5 percent (unchanged from prior rules).
The Basel III Rules set forth certain changes in the methods of calculating certain risk-weighted assets, which in turn affect the calculation of risk based ratios. Under the Basel III Rules, higher or more sensitive risk weights would be assigned to various categories of assets, including certain credit facilities that finance the acquisition, development or construction of real property, certain exposures or credits that are 90 days past due or on nonaccrual, foreign exposures and certain corporate exposures. In addition, the Basel III Rules include (i) alternative standards of creditworthiness consistent with the Dodd-Frank Act; (ii) greater recognition of collateral and guarantees; and (iii) revised capital treatment for derivatives and repo-style transactions.
| - 11 - |
In addition, the final rule includes certain exemptions to address concerns about the regulatory burden on community banks. For example, banking organizations with less than $15 billion in consolidated assets as of December 31, 2009 are permitted to include in Tier 1 capital trust preferred securities and cumulative perpetual preferred stock issued and included in Tier 1 capital prior to May 19, 2010 on a permanent basis, without any phase out. The Bank has opted out of the requirement to include most accumulated other comprehensive income (“AOCI”) components in the calculation of CET1 capital and, in effect, retain the AOCI treatment under the prior capital rules and exclude accumulated other comprehensive income from capital.
Certain Basel III Rules became effective January 1, 2015. The conservation buffer will be phased in beginning in 2016 and will take full effect on January 1, 2019. Certain calculations under the Basel III Rules will also have phase-in periods.
Under the implementing regulations, the federal banking regulators, including the FDIC, generally measure an institution’s capital adequacy on the basis of its total risk-based capital ratio (the ratio of its total capital to risk-weighted assets), Tier 1 risk-based capital ratio (the ratio of its core capital to risk-weighted assets) and leverage ratio (the ratio of its core capital to adjusted total assets).
The following table shows the Bank’s actual capital ratios and the required capital ratios for the various prompt corrective action categories as of December 31, 2017.
| Regulatory | ||||||||||||||
| Adequately | Significantly | Minimum | ||||||||||||
| Actual | Well-capitalized | Capitalized | Undercapitalized | Undercapitalized | Requirement | |||||||||
| Total risk-based capital ratio | 11.38 | % | 10.0% or more | 8.0% or more | Less than 8.0% | Less than 6.0% | 11.50% or more | |||||||
| Tier 1 risk-based capital ratio | 10.56 | % | 8.0% or more | 6.0% or more | Less than 6.0% | Less than 4.0% | 8.00% or more | |||||||
| Common equity Tier 1 risk-based capital ratio | 10.56 | % | 6.5% or more | 4.5% or more | Less than 4.50% | Less than 3.0% | 8.00% or more | |||||||
| Leverage ratio | 12.08 | % | 5.0% or more | 4.0% or more * | Less than 4.0% * | Less than 3.0% | 8.00% or more | |||||||
* 3.0% if institution has the highest regulatory rating and meets certain other criteria.
A “critically undercapitalized” institution is defined as an institution that has a ratio of “tangible equity” to total assets of less than 2.0%. Tangible equity is defined as core capital plus cumulative perpetual preferred stock (and related surplus) less all intangibles other than qualifying supervisory goodwill and certain purchased mortgage servicing rights. The FDIC may reclassify a well-capitalized institution as adequately capitalized and may require an adequately capitalized or undercapitalized institution to comply with the supervisory actions applicable to institutions in the next lower capital category (but may not reclassify a significantly undercapitalized institution as critically undercapitalized) if the FDIC determines, after notice and an opportunity for a hearing, that the institution is in an unsafe or unsound condition or that the institution has received and not corrected a less-than-satisfactory rating for any CAMELS rating category. See Note M of the Notes to Consolidated Financial Statements included under Item 8 of this Annual Report on Form 10-K.
Safety and Soundness Guidelines. Under FDICIA, as amended by the Riegle Community Development and Regulatory Improvement Act of 1994 (the “CDRI Act”), each federal banking agency was required to establish safety and soundness standards for institutions under its authority. The interagency guidelines require depository institutions to maintain internal controls and information systems and internal audit systems that are appropriate for the size, nature and scope of the institution’s business. The guidelines also establish certain basic standards for the documentation of loans, credit underwriting, interest rate risk exposure, asset growth, and information security. The guidelines further provide that depository institutions should maintain safeguards to prevent the payment of compensation, fees and benefits that are excessive or that could lead to material financial loss, and should take into account factors such as comparable compensation practices at comparable institutions. If the appropriate federal banking agency determines that a depository institution is not in compliance with the safety and soundness guidelines, it may require the institution to submit an acceptable plan to achieve compliance with the guidelines. A depository institution must submit an acceptable compliance plan to its primary federal regulator within 30 days of receipt of a request for such a plan. Failure to submit or implement a compliance plan may subject the institution to regulatory sanctions.
| - 12 - |
International Money Laundering Abatement and Financial Anti-Terrorism Act of 2001. On October 26, 2001, the USA PATRIOT Act of 2001 was enacted. This act contains the International Money Laundering Abatement and Financial Anti-Terrorism Act of 2001, which sets forth anti-money laundering measures affecting insured depository institutions, broker-dealers and other financial institutions. The Act requires U.S. financial institutions to adopt new policies and procedures to combat money laundering and grants the Secretary of the Treasury broad authority to establish regulations and to impose requirements and restrictions on the operations of financial institutions.
Office of Foreign Assets Control Regulation. The United States has imposed economic sanctions that affect transactions with designated foreign countries, nationals and others. These are typically known as the “OFAC” rules based on their administration by the U.S. Treasury’s Office of Foreign Assets Control (OFAC). The OFAC-administered sanctions targeting countries take many different forms. Generally, however, they contain one or more of the following elements: (i) restrictions on trade with or investment in a sanctioned country, including prohibitions against direct or indirect imports from and exports to a sanctioned country and prohibitions on “U.S. persons” engaging in financial transactions relating to making investments in, or providing investment-related advice or assistance to, a sanctioned country; and (ii) a blocking of assets in which the government or specially designated nationals of the sanctioned country have an interest, by prohibiting transfers of property subject to U.S. jurisdiction (including property in the possession or control of U.S. persons). Blocked assets (e.g., property and bank deposits) cannot be paid out, withdrawn, set off or transferred in any manner without a license from OFAC. Failure of a financial institution to comply with these sanctions could result in legal consequences for the institution.
Community Reinvestment Act. The Bank, like other financial institutions, is subject to the Community Reinvestment Act (“CRA”). The purpose of the CRA is to encourage financial institutions to help meet the credit needs of their entire communities, including the needs of low-and moderate-income neighborhoods.
The federal banking agencies have implemented an evaluation system that rates an institution based on its asset size and actual performance in meeting community credit needs. Under these regulations, the institution is first evaluated and rated under two categories: a lending test and a community development test. For each of these tests, the institution is given a rating of either “outstanding,” “high satisfactory,” “low satisfactory,” “needs to improve,” or “substantial non-compliance.” A set of criteria for each rating has been developed and is included in the regulation. If an institution disagrees with a particular rating, the institution has the burden of rebutting the presumption by clearly establishing that the quantitative measures do not accurately present its actual performance, or that demographics, competitive conditions or economic or legal limitations peculiar to its service area should be considered. The ratings received under the three tests will be used to determine the overall composite CRA rating. The composite ratings currently given are: “outstanding,” “satisfactory,” “needs to improve” or “substantial non-compliance.”
The Bank’s CRA rating would be a factor to be considered by the FRB and the FDIC in considering applications submitted by the Bank to acquire branches or to acquire or combine with other financial institutions and take other actions and, if such rating was less than “satisfactory,” could result in the denial of such applications. During the Bank’s last compliance examination, the Bank received a satisfactory rating with respect to CRA compliance.
| - 13 - |
Federal Home Loan Bank System. The FHLB System consists of 12 district FHLBs subject to supervision and regulation by the Federal Housing Finance Agency (“FHFA”). The FHLBs provide a central credit facility primarily for member institutions. As a member of the FHLB of Atlanta, the Bank is required to acquire and hold shares of capital stock in the FHLB of Atlanta. The Bank was in compliance with this requirement with investment in FHLB of Atlanta stock of $2.5 million at December 31, 2017. The FHLB of Atlanta serves as a reserve or central bank for its member institutions within its assigned district. It is funded primarily from proceeds derived from the sale of consolidated obligations of the FHLB System. It offers advances to members in accordance with policies and procedures established by the FHFA and the Board of Directors of the FHLB of Atlanta. Long-term advances may only be made for the purpose of providing funds for residential housing finance, small businesses, small farms and small agribusinesses.
Reserves. Pursuant to regulations of the FRB, the Bank must maintain average daily reserves equal to 3% on transaction accounts of $15.2 million up to $110.2 million, plus 10% on the remainder. This percentage is subject to adjustment by the FRB. Because required reserves must be maintained in the form of vault cash or in a noninterest bearing account at a Federal Reserve Bank, the effect of the reserve requirement is to reduce the amount of the institution’s interest-earning assets. As of December 31, 2017, the Bank met its reserve requirements.
The Bank is also subject to the reserve requirements of North Carolina commercial banks. North Carolina law requires state nonmember banks to maintain, at all times, a reserve fund in an amount set by the Commissioner.
Liquidity Requirements. FDIC policy requires that banks maintain an average daily balance of liquid assets (cash, certain time deposits, mortgage-backed securities, loans available for sale and specified United States government, state, or federal agency obligations) in an amount which it deems adequate to protect the safety and soundness of the Bank. The FDIC currently has no specific level which it requires. The Bank maintains its liquidity position under policy guidelines based on liquid assets in relationship to deposits and short-term borrowings. Based on its policy calculation guidelines, the Bank’s calculated liquidity ratio was 11.34% of total deposits and short-term borrowings at December 31, 2017, which management believes is adequate.
Dividend Restrictions. Under FDIC regulations, the Bank is prohibited from making any capital distributions if after making the distribution, the Bank would have: (i) a total risk-based capital ratio of less than 8.0%; (ii) a Tier 1 risk-based capital ratio of less than 4.0%; or (iii) a leverage ratio of less than 4.0%. The FDIC and the Commissioner have the power to further restrict the payment of dividends by the Bank.
Limits on Loans to One Borrower. The Bank generally is subject to both FDIC regulations and North Carolina law regarding loans to any one borrower, including related entities. Under applicable law, with certain limited exceptions, loans and extensions of credit by a state chartered nonmember bank to a person outstanding at one time and not fully secured by collateral having a market value at least equal to the amount of the loan or extension of credit shall not exceed 15% of the unimpaired capital of the Bank. In addition, the Bank has an internal policy that loans and extensions of credit fully secured by readily marketable collateral having a market value at least equal to the amount of the loan or extension of credit shall not exceed 10% of the unimpaired capital fund of the Bank. Under the internal policy, the Bank’s loans to one borrower were limited to $10.5 million at December 31, 2017.
Transactions with Related Parties. Transactions between the Bank and any affiliate are governed by Sections 23A and 23B of the Federal Reserve Act. An affiliate of the Bank is any company or entity which controls, is controlled by or is under common control with the Bank. In a holding company context, the parent holding company of a bank (such as the Registrant) and any companies which are controlled by such parent holding company are affiliates of the bank. Generally, Sections 23A and 23B (i) limit the extent to which an institution or its subsidiaries may engage in “covered transactions” with any one affiliate to an amount equal to 10% of such institution’s capital stock and surplus, and contain an aggregate limit on all such transactions with all affiliates to an amount equal to 20% of such capital stock and surplus and (ii) require that all such transactions be on terms substantially the same, or at least as favorable, to the institution or subsidiary as those provided to a non-affiliate. The term “covered transaction” includes the making of loans, purchase of assets, issuance of a guarantee and similar other types of transactions.
| - 14 - |
Loans to Directors, Executive Officers and Principal Stockholders. The Bank is subject to the restrictions contained in Section 22(h) of the Federal Reserve Act and the applicable regulations thereunder (“Regulation O”) on loans to executive officers, directors and principal stockholders. Under Section 22(h), loans to a director, executive officer and to a greater than 10% stockholder of a state nonmember bank and certain affiliated interests of such persons, may not exceed, together with all other outstanding loans to such person and related interests, the institution’s loans-to-one-borrower limit and all loans to such persons may not exceed the institution’s unimpaired capital and unimpaired surplus. Section 22(h) also prohibits loans above amounts prescribed by the appropriate federal banking agency to directors, executive officers and greater than 10% stockholders of a depository institution, and their respective affiliates, unless such loan is approved in advance by a majority of the board of directors of the institution with any “interested” director not participating in the voting. Regulation O prescribes the loan amount (which includes all other outstanding loans to such person) as to which such prior board of directors approval is required as being the greater of $25,000 or 5% of capital and surplus (or any loans aggregating $500,000 or more). Further, Section 22(h) requires that loans to directors, executive officers and principal stockholders generally be made on terms substantially the same as offered in comparable transactions to other persons. Section 22(h) also generally prohibits a depository institution from paying the overdrafts of any of its executive officers or directors.
The Bank is also subject to the additional requirements and restrictions of Regulation O on loans to executive officers. Section 22(g) of the Federal Reserve Act requires approval by the board of directors of a depository institution for such extensions of credit and imposes reporting requirements for and additional restrictions on the type, amount and terms of credits to such officers. In addition, Section 106 of the Bank Holding Company Act of 1956, as amended (“BHCA”) prohibits extensions of credit to executive officers, directors, and greater than 10% stockholders of a depository institution by any other institution which has a correspondent banking relationship with the institution, unless such extension of credit is on substantially the same terms as those prevailing at the time for comparable transactions with other persons and does not involve more than the normal risk of repayment or present other unfavorable features.
The Volcker Rule. Under provisions of the Dodd-Frank Act referred to as the “Volcker Rule,” certain limitations are placed on the ability of bank holding companies and their affiliates to engage in sponsoring, investing in and transacting with certain investment funds, including hedge funds and private equity funds. The Volcker Rule also places restrictions on proprietary trading, which could impact certain hedging activities. The Volcker Rule, which became fully effective in July 2015, has not had a material impact on the Bank or the Registrant.
In 2017, both the House of Representatives and the Senate introduced legislation that would repeal or modify provisions of the Dodd-Frank Act and significantly impact financial services regulation. Although the bills vary in content, certain key aspects include revisions to, and simplifications of, certain Volcker Rule requirements.
Restrictions on Certain Activities. State chartered nonmember banks with deposits insured by the FDIC are generally prohibited from engaging in equity investments that are not permissible for a national bank. The foregoing limitation, however, does not prohibit FDIC-insured state banks from acquiring or retaining an equity investment in a subsidiary in which the bank is a majority owner. State chartered banks are also prohibited from engaging as a principal in any type of activity that is not permissible for a national bank and, subject to certain exceptions, subsidiaries of state chartered FDIC-insured banks may not engage as a principal in any type of activity that is not permissible for a subsidiary of a national bank, unless in either case, the FDIC determines that the activity would pose no significant risk to the DIF and the bank is, and continues to be, in compliance with applicable capital standards.
The Registrant cannot predict what legislation might be enacted or what regulations might be adopted in the future, or if enacted or adopted, the effect thereof on the Bank’s operations.
| - 15 - |
Regulation of the Registrant
Federal Regulation. The Registrant is a registered bank holding company subject to examination, regulation and periodic reporting under the Bank Holding Company Act of 1956, as administered by the Federal Reserve Board. The Federal Reserve Board has adopted capital adequacy guidelines for bank holding companies on a consolidated basis.
The status of the Registrant as a registered bank holding company under the Bank Holding Company Act does not exempt it from certain federal and state laws and regulations applicable to corporations generally, including, without limitation, certain provisions of the federal securities laws.
The Registrant is required to obtain the prior approval of the Federal Reserve Board to acquire all, or substantially all, of the assets of any bank or bank holding company. Prior Federal Reserve Board approval is required for the Registrant to acquire direct or indirect ownership or control of any voting securities of any bank or bank holding company if, after giving effect to such acquisition, it would, directly or indirectly, own or control more than five percent of any class of voting shares of such bank or bank holding company.
In addition, in certain such cases, an application to, and the prior approval of, the North Carolina Commissioner of Banks may also be required.
The Registrant is required to give the Federal Reserve Board prior written notice of any purchase or redemption of its outstanding equity securities if the gross consideration for the purchase or redemption, when combined with the net consideration paid for all such purchases or redemptions during the preceding 12 months, is equal to 10% or more of the Registrant’s consolidated net worth. The Federal Reserve Board may disapprove such a purchase or redemption if it determines that the proposal would constitute an unsafe and unsound practice, or would violate any law, regulation, Federal Reserve Board order or directive, or any condition imposed by, or written agreement with, the Federal Reserve Board. Such notice and approval is not required for a bank holding company that would be treated as “well-capitalized” and “well-managed” under applicable regulations of the Federal Reserve Board, that has received a composite “1” or “2” rating at its most recent bank holding company inspection by the Federal Reserve Board, and that is not the subject of any unresolved supervisory issues.
In addition, a bank holding company is prohibited generally from engaging in, or acquiring five percent or more of any class of voting securities of any company engaged in, non-banking activities. One of the principal exceptions to this prohibition is for activities found by the Federal Reserve Board to be so closely related to banking or managing or controlling banks as to be a proper incident thereto. Some of the principal activities that the Federal Reserve Board has determined by regulation to be so closely related to banking as to be a proper incident thereto are:
- making or servicing loans;
- performing certain data processing services;
- providing discount brokerage services;
- acting as fiduciary, investment or financial advisor;
- leasing personal or real property;
- making investments in corporations or projects designed primarily to promote community welfare; and
- acquiring a savings and loan association.
In evaluating a written notice of such an acquisition, the Federal Reserve Board will consider various factors, including among others the financial and managerial resources of the notifying bank holding company and the relative public benefits and adverse effects which may be expected to result from the performance of the activity by an affiliate of such company. The Federal Reserve Board may apply different standards to activities proposed to be commenced de novo and activities commenced by acquisition, in whole or in part, of a going concern. The required notice period may be extended by the Federal Reserve Board under certain circumstances, including a notice for acquisition of a company engaged in activities not previously approved by regulation of the Federal Reserve Board. If such a proposed acquisition is not disapproved or subjected to conditions by the Federal Reserve Board within the applicable notice period, it is deemed approved by the Federal Reserve Board.
| - 16 - |
However, with the passage of the Gramm-Leach-Bliley Financial Services Modernization Act of 1999, which became effective on March 11, 2000, the types of activities in which a bank holding company may engage were significantly expanded. Subject to various limitations, the Modernization Act generally permits a bank holding company to elect to become a “financial holding company.” A financial holding company may affiliate with securities firms and insurance companies and engage in other activities that are “financial in nature.” Among the activities that are deemed “financial in nature” are, in addition to traditional lending activities, securities underwriting, dealing in or making a market in securities, sponsoring mutual funds and investment companies, insurance underwriting and agency activities, certain merchant banking activities and activities that the Federal Reserve Board considers to be closely related to banking.
A bank holding company may become a financial holding company under the Modernization Act if each of its subsidiary banks is “well-capitalized” under the Federal Deposit Insurance Corporation Improvement Act prompt corrective action provisions, is well managed and has at least a satisfactory rating under the Community Reinvestment Act. In addition, the bank holding company must file a declaration with the Federal Reserve Board that the bank holding company wishes to become a financial holding company. A bank holding company that falls out of compliance with these requirements may be required to cease engaging in some of its activities. The Registrant has not yet elected to become a financial holding company.
Under the Gramm-Leach-Bliley Act, the Federal Reserve Board serves as the primary “umbrella” regulator of financial holding companies, with supervisory authority over each parent company and limited authority over its subsidiaries. Expanded financial activities of financial holding companies generally will be regulated according to the type of such financial activity: banking activities by banking regulators, securities activities by securities regulators and insurance activities by insurance regulators. The Gramm-Leach-Bliley Act also imposes additional restrictions and heightened data privacy and disclosure requirements regarding non-public information collected by financial institutions.
Capital Requirements. The Federal Reserve Board uses capital adequacy guidelines in its examination and regulation of bank holding companies. If capital falls below minimum guidelines, a bank holding company may, among other things, be denied approval to acquire or establish additional banks or non-bank businesses.
The Federal Reserve Board’s capital guidelines establish the following minimum regulatory capital requirements for bank holding companies:
| - | leverage capital requirement expressed as a percentage of adjusted total assets; |
| - | common equity Tier 1 expressed as a percentage of total risk-weighted assets; |
| - | risk-based requirement expressed as a percentage of total risk-weighted assets; and |
| - | Tier 1 leverage requirement expressed as a percentage of adjusted total assets. |
The leverage capital requirement consists of a minimum ratio of total capital to total assets of 4.0%, with an expressed expectation that banking organizations generally should operate above such minimum level. The risk-based requirement consists of a minimum ratio of total capital to total risk-weighted assets of 8.0%, of which at least one-half must be Tier 1 capital (which consists principally of shareholders’ equity). The Tier 1 leverage requirement consists of a minimum ratio of Tier 1 capital to total assets of 3.0% for the most highly-rated companies, with minimum requirements of 4.0% to 5.0% for all others.
| - 17 - |
The risk-based and leverage standards presently used by the Federal Reserve Board are minimum requirements, and higher capital levels will be required if warranted by the particular circumstances or risk profiles of individual banking organizations. Further, any banking organization experiencing or anticipating significant growth would be expected to maintain capital ratios, including tangible capital positions (i.e., Tier 1 capital less all intangible assets), well above the minimum levels.
Source of Strength for Subsidiaries. Bank holding companies are required to serve as a source of financial strength for their depository institution subsidiaries, and, if their depository institution subsidiaries become undercapitalized, bank holding companies may be required to guarantee the subsidiaries’ compliance with capital restoration plans filed with their bank regulators, subject to certain limits.
Dividends. As a bank holding company that does not, as an entity, currently engage in separate business activities of a material nature, the Registrant’s ability to pay cash dividends depends upon the cash dividends the Registrant receives from the Bank. At present, the Registrant’s only source of income is dividends paid by the Bank and interest earned on any investment securities the Registrant holds. The Registrant must pay all of its operating expenses from funds it receives from the Bank. Therefore, shareholders may receive dividends from the Registrant only to the extent that funds are available after payment of our operating expenses and the board decides to declare a dividend. In addition, the Federal Reserve Board generally prohibits bank holding companies from paying dividends except out of operating earnings where the prospective rate of earnings retention appears consistent with the bank holding company’s capital needs, asset quality and overall financial condition.
The FDIC Improvement Act requires the federal bank regulatory agencies biennially to review risk-based capital standards to ensure that they adequately address interest rate risk, concentration of credit risk and risks from non-traditional activities and, since adoption of the Riegle Community Development and Regulatory Improvement Act of 1994, to do so taking into account the size and activities of depository institutions and the avoidance of undue reporting burdens. In 1995, the agencies adopted regulations requiring as part of the assessment of an institution’s capital adequacy the consideration of (a) identified concentrations of credit risks, (b) the exposure of the institution to a decline in the value of its capital due to changes in interest rates and (c) the application of revised conversion factors and netting rules on the institution’s potential future exposure from derivative transactions.
In addition, the agencies in September 1996 adopted amendments to their respective risk-based capital standards to require banks and bank holding companies having significant exposure to market risk arising from, among other things, trading of debt instruments, (1) to measure that risk using an internal value-at-risk model conforming to the parameters established in the agencies’ standards and (2) to maintain a commensurate amount of additional capital to reflect such risk. The new rules were adopted effective January 1, 1997, with compliance mandatory from and after January 1, 1998.
Under the Financial Institutions Reform, Recovery, and Enforcement Act of 1989 (“FIRREA”), depository institutions are liable to the FDIC for losses suffered or anticipated by the FDIC in connection with the default of a commonly controlled depository institution or any assistance provided by the FDIC to such an institution in danger of default.
Subsidiary banks of a bank holding company are subject to certain quantitative and qualitative restrictions imposed by the Federal Reserve Act on any extension of credit to, or purchase of assets from, or letter of credit on behalf of, the bank holding company or its subsidiaries, and on the investment in or acceptance of stocks or securities of such holding company or its subsidiaries as collateral for loans. In addition, provisions of the Federal Reserve Act and Federal Reserve Board regulations limit the amounts of, and establish required procedures and credit standards with respect to, loans and other extensions of credit to officers, directors and principal shareholders of the Bank, the Registrant, any subsidiary of the Registrant and related interests of such persons. Moreover, subsidiaries of bank holding companies are prohibited from engaging in certain tying arrangements (with the holding company or any of its subsidiaries) in connection with any extension of credit, lease or sale of property or furnishing of services.
| - 18 - |
Any loans by a bank holding company to a subsidiary bank are subordinate in right of payment to deposits and to certain other indebtedness of the subsidiary bank. In the event of a bank holding company’s bankruptcy, any commitment by the bank holding company to a federal bank regulatory agency to maintain the capital of a subsidiary bank would be assumed by the bankruptcy trustee and entitled to a priority of payment. This priority would also apply to guarantees of capital plans under the FDIC Improvement Act.
Incentive Compensation Policies and Restrictions. In July 2010, the federal banking agencies issued guidance which applies to all banking organizations supervised by the agencies. Pursuant to the guidance, to be consistent with safety and soundness principles, a banking organization’s incentive compensation arrangements should: (1) provide employees with incentives that appropriately balance risk and reward; (2) be compatible with effective controls and risk management; and (3) be supported by strong corporate governance including active and effective oversight by the banking organization’s board of directors. Monitoring methods and processes used by a banking organization should be commensurate with the size and complexity of the organization and its use of incentive compensation.
In addition, in March 2011, the federal banking agencies, along with the Federal Housing Finance Agency, and the Securities and Exchange Commission, released a proposed rule intended to ensure that regulated financial institutions design their incentive compensation arrangements to account for risk. Specifically, the proposed rule would require compensation practices of the Registrant and the Bank to be consistent with the following principles: (1) compensation arrangements appropriately balance risk and financial reward; (2) such arrangements are compatible with effective controls and risk management; and (3) such arrangements are supported by strong corporate governance. In addition, financial institutions with $1 billion or more in assets would be required to have policies and procedures to ensure compliance with the rule and would be required to submit annual reports to their primary federal regulator. In May 2016, the federal bank regulatory agencies replaced the regulations proposed in 2011 with a new proposal. The comment period has closed and a final rule has not yet been published.
Tax Cuts and Jobs Act of 2017. On December 22, 2017, the Tax Cuts and Jobs Act of 2017 (the “Tax Act”) was signed into law. The Tax Act includes a number of provisions that impact the Registrant, including the following:
| · | Tax Rate. The Tax Act replaces the graduated corporate tax rates applicable under prior law, which imposed a maximum tax rate of 35%, with a reduced 21% flat tax rate. Although the reduced tax rate generally should be favorable to the Registrant by resulting in increased earnings and capital, it decreased the value of our existing deferred tax assets by approximately $2.6 million as of December 31, 2017. |
| · | Employee Compensation. A “publicly held corporation” is not permitted to deduct compensation in excess of $1 million per year paid to certain employees. The Tax Act eliminates certain exceptions to the $1 million limit applicable under prior to law related to performance-based compensation, such as equity grants and cash bonuses that are paid only on the attainment of performance goals. |
| · | Business Asset Expensing. The Tax Act allows taxpayers immediately to expense the entire cost (instead of only 50%, as under prior law) of certain depreciable tangible property and real property improvements acquired and placed in service after September 27, 2017 and before January 1, 2023 (with an additional year for certain property). This 100% “bonus” depreciation is phased out proportionately for property placed in service on or after January 1, 2023 and before January 1, 2027 (with an additional year for certain property). |
| · | Interest Expense. The Tax Act limits a taxpayer’s annual deduction of business interest expense to the sum of (i) business interest income and (ii) 30% of “adjusted taxable income,” defined as a business’s taxable income without taking into account business interest income or expense, net operating losses, and, for 2018 through 2021, depreciation, amortization and depletion. |
| - 19 - |
Future Legislation
The Registrant cannot predict what legislation might be enacted or what regulations might be adopted, or if enacted or adopted, the effect thereof on the Registrant’s operations.
An investment in the Registrant’s common stock involves certain risks. The following discussion highlights the risks that management believes are material for the Registrant, but does not necessarily include all the risks that we may face. Additional risks and uncertainties that are not currently known or that management does not currently deem material could also have a material adverse impact on our business, results of our operations and financial condition. You should carefully consider the risk factors and uncertainties described below and elsewhere in this Report in evaluating an investment in the Registrant’s common stock.
Risks Related to Our Business
We may experience unexpected credit losses in connection with the loans we make, which could have a material adverse effect on our capital, financial condition, and results of operations.
As a lender, we face the risk that our borrowers will not repay their loans and guarantors or other related parties will also fail to perform in accordance with the loan terms. A borrower’s failure to repay us is usually preceded by missed monthly payments. In some instances, however, a borrower may declare bankruptcy prior to missing payments, and, following a borrower filing bankruptcy, a lender’s recovery of the credit extended is often limited. Since many of our loans are secured by collateral, we may attempt to seize the collateral if and when a borrower defaults on a loan. However, the value of the collateral might not equal the amount of the unpaid loan, and we may be unsuccessful in recovering the remaining balance from our borrower. The resolution of nonperforming assets, including the initiation of foreclosure proceedings, requires significant commitments of time from management, which can be detrimental to the performance of their other responsibilities, and which expose us to additional legal costs. Elevated levels of loan delinquencies and bankruptcies in our market areas, generally, and among our borrowers specifically, can be precursors of future charge-offs and may require us to increase our allowance for loan losses. Higher charge-off rates, delays in the foreclosure process or in obtaining judgments against defaulting borrowers or an increase in our allowance for loan losses may negatively impact our overall financial performance, may increase our cost of funds, and could materially adversely affect our business, results of operations and financial condition.
Our allowance for loan losses may be insufficient and significant loan losses could require us to increase our allowance for loan losses through a charge to earnings.
To account for the risk that our borrowers will not repay their loans, we maintain an allowance for loan losses, which is a reserve established through a charge to earnings. The level of the allowance reflects management’s continuing evaluation of industry concentrations; specific credit risks; loan loss experience; current loan portfolio quality and trends; present economic, political, and regulatory conditions and unidentified losses inherent in the current loan portfolio. The determination of the appropriate level of the allowance for loan losses inherently involves a high degree of subjectivity and requires us to make significant estimates and assumptions regarding current credit risks and future trends, all of which may undergo material changes. We might underestimate the loan losses inherent in our loan portfolio and have loan losses in excess of the amount recorded in our allowance for loan losses. Changes in economic conditions affecting borrowers, new information regarding existing loans, identification of additional problem loans and other factors, both within and outside our control, may require an increase in the allowance for loan losses. There may be a significant increase in the number of borrowers who are unable or unwilling to repay their loans, resulting in our charging off more loans and increasing our allowance. Furthermore, when real estate values decline, the potential severity of loss on a real estate-secured loan can increase significantly, especially in the case of loans with high combined loan-to-value ratios. Downturns in the national economy and the local economies of the areas in which our loans are concentrated could result in an increase in loan delinquencies, foreclosures or repossessions resulting in increased charge-off amounts and the need for additional loan loss provisions in future periods. If charge-offs in future periods exceed the allowance for probable loan losses; we will need additional provisions to increase the allowance for loan losses. Any increases in the allowance for loan losses will result in a decrease in net income and, possibly, capital, and may have a material adverse effect on our financial condition and results of operations.
| - 20 - |
In addition, our determination as to the amount of our allowance for loan losses is subject to review by our primary regulators, the FDIC and the Commissioner, as part of their examination process, which may result in the establishment of an additional allowance based upon the judgment of either of these regulators after a review of the information available at the time of their examination. Our allowance for loan losses amounted to $8.8 million and $8.4 million, or 0.90% and 1.24% of total loans outstanding and 127% and 89% of nonperforming loans, at December 31, 2017 and 2016, respectively. See Item 7 of Part II, Management’s Discussion and Analysis of Financial Condition and Results of Operations, and Note E to our consolidated financial statements presented under Item 8 of Part II of this Form 10-K, for further discussion related to our process for determining the appropriate level of the allowance for probable loan losses.
An increase in our nonperforming assets will negatively affect our earnings.
Our nonperforming assets adversely affect our net income in various ways. We do not record interest income on non-accrual loans or other real estate owned. We must reserve for probable losses, which is established through a current period charge to the provision for loan losses, and, from time to time as appropriate, write down the value of properties in our other real estate owned portfolio to reflect changing market values. Additionally, there are legal fees associated with the resolution of problem assets as well as carrying costs such as taxes, insurance and maintenance related to our other real estate owned. Further, the resolution of nonperforming assets requires the active involvement of management, which can distract them from other responsibilities. Finally, if our estimate for the recorded allowance for loan losses proves to be incorrect and our allowance is inadequate, we will have to increase the allowance accordingly, which would decrease our net income and may have a material adverse effect on our financial condition and results of operations.
The geographic concentration of our loan portfolio and lending activities makes us vulnerable to a downturn in the local economy.
Nearly all of our loans are secured by real estate or made to businesses in our market area, which includes portions of central and eastern North Carolina and northwestern South Carolina. As a result of this geographic concentration, our results may correlate to the economic conditions in these areas. Declines in these markets’ economic conditions may adversely affect the quality of our loan portfolio and the demand for our products and services, and accordingly, our results of operations. Adverse conditions in the local economy such as inflation, unemployment, recession or other factors beyond our control could impact the ability of our borrowers to repay their loans, which could impact our financial condition and results of operations.
A decline in local economic conditions could adversely affect the values of real property used as collateral for our loans. Consequently, a decline in local economic conditions may have a greater effect on our earnings and capital than on the earnings and capital of larger financial institutions whose real estate loan portfolios are more geographically diverse. At December 31, 2017, approximately 83.5% of the Bank’s loans had real estate as a primary or secondary component of collateral. The real estate collateral in each case provides an alternate source of repayment in the event of default by the borrower and may deteriorate in value during the time the credit is extended. If the value of real estate in our market area were to decline materially, a significant portion of our loan portfolio could become under collateralized and/or cause us to realize a loss in the event of a foreclosure. If we are required to liquidate the collateral securing a loan to satisfy the debt during a period of reduced real estate values, our earnings and capital could be adversely affected.
| - 21 - |
A significant portion of our loan portfolio consists of loans for commercial real estate and construction, which carry greater historical credit risk than residential mortgage loans.
We originate commercial real estate loans and commercial and industrial loans, most often secured by commercial properties and construction loans primarily within our market area. These loans tend to involve larger loan balances to a single borrower or groups of related borrowers, more complex underlying collateral, and are most susceptible to a risk of loss during a downturn in the business cycle. These loans also have historically had greater credit risk than residential real estate other loans for the following reasons:
| · | Commercial Real Estate Loans. Repayment is dependent on income being generated in amounts sufficient to cover operating expenses and debt service. These loans also involve greater risk because they are generally not fully amortizing over a loan period, but rather have a balloon payment due at maturity. A borrower’s ability to make a balloon payment typically will depend on being able to either refinance the loan or timely sell the underlying property. As of December 31, 2017, commercial real estate loans were approximately 41.0% of the Bank’s total loan portfolio. |
| · | Commercial and Industrial Loans. Repayment is generally dependent upon the successful operation of the borrower’s business. In addition, the collateral securing the loans may depreciate over time, be difficult to appraise, be more difficult to liquidate than residential real estate, or fluctuate in value based on the success of the business. As of December 31, 2017, commercial and industrial loans were approximately 10.8% of the Bank’s total loan portfolio. |
| · | Construction Loans. Repayment is dependent on completion of the project and the subsequent financing of the completed project as a commercial real estate or residential real estate loan, and in some instances on the rent or sale of the underlying project. The risk of loss is largely dependent on our initial estimate of whether the property’s value at completion equals or exceeds the cost of property construction and the availability of take-out financing. During the construction phase, a number of factors can result in delays or cost overruns. If our estimate is inaccurate or if actual construction costs exceed estimates, the value of the property securing our loan may be insufficient to ensure full repayment when completed through a permanent loan, sale of the property, or by seizure of collateral. As of December 31, 2017, construction loans were approximately 18.1% of the Bank’s total loan portfolio. |
Our commercial real estate loans include both owner and non-owner occupied properties. Non-owner occupied properties expose us to a greater risk of non-payment and loss than loans secured by owner-occupied properties because repayment of such loans depends primarily on the tenant’s continuing ability to pay rent to the property owner, who is our borrower, or, if the property owner is unable to find a tenant, the property owner’s ability to repay the loan without the benefit of a rental income stream, or other events beyond the borrower’s control. In addition, the physical condition of non-owner-occupied properties is often below that of owner-occupied properties due to lax property maintenance standards, which has a negative impact on the value of the collateral properties. Furthermore, some of our non-owner-occupied borrowers have more than one loan outstanding with us, which may expose us to a greater risk of loss compared to residential and commercial borrowers with only one loan.
| - 22 - |
We are exposed to risks in connection with residential mortgage loans.
We originate fixed and adjustable rate loans secured by one-to-four family residential real estate. As of December 31, 2017, we had $156.9 million in residential mortgage loans, which comprised 15.97% of our total loan portfolio. The residential loans in our loan portfolio are sensitive to regional and local economic conditions that significantly impact the ability of borrowers to meet their loan payment obligations, making loss levels difficult to predict. Residential loans with high combined loan-to-value ratios generally are more sensitive and may experience a higher incidence of default and severity of losses. In addition, if the borrowers sell their homes, the borrowers may be unable to repay their loans in full from the sale proceeds. As a result, these loans may experience higher rates of delinquencies, defaults and losses, which could in turn adversely affect our financial condition and results of operations.
We depend on the accuracy and completeness of information about clients and counterparties.
In deciding whether to extend credit or enter into other transactions with clients and counterparties, we may rely on information furnished to us by or on behalf of clients and counterparties, including financial statements and other financial information. We also may rely on representations of clients and counterparties as to the accuracy and completeness of that information and, with respect to financial statements, on reports of independent auditors. For example, in deciding whether to extend credit to clients, we may assume that a customer’s audited financial statements conform to accounting principles generally accepted in the United States of America (“GAAP”) and present fairly, in all material respects, the financial condition, results of operations and cash flows of the customer. Our earnings are significantly affected by our ability to properly originate, underwrite and service loans. Our financial condition and results of operations could be negatively impacted to the extent we incorrectly assess the creditworthiness of our borrowers, fail to detect or respond to deterioration in asset quality in a timely manner, or rely on financial statements that do not comply with GAAP or are materially misleading.
We may be forced to foreclose on the collateral property securing our loans and own the underlying real estate, which may subject us to the increased costs associated with the ownership of real property.
We originate loans secured by real estate and from time to time are forced to foreclose on the collateral property to protect our investment and may thereafter own and operate such property, which exposes us to the inherent risks of real property ownership. The amount that we, as a lender, may realize after a default is dependent upon factors outside of our control, including, but not limited to:
| · | general or local economic conditions; |
| · | environmental cleanup liability; |
| · | neighborhood values; |
| · | interest rates; |
| · | real estate tax rates; |
| · | operating expenses of the mortgaged properties; |
| · | supply of and demand for rental units or properties; |
| · | ability to obtain and maintain adequate occupancy of the properties; |
| · | zoning laws; |
| · | governmental rules, regulations and fiscal policies; and |
| · | natural or other disasters. |
Certain expenditures associated with the ownership of real estate, principally real estate taxes and maintenance costs, may adversely affect the income from the real estate. Therefore, the cost of operating real property may exceed the rental income earned from such property, and we may have to advance funds in order to protect our investment or we may be required to dispose of the real property at a loss. This may result in reduced net income, which may have a material adverse effect on our financial condition and results of operations.
| - 23 - |
Our expansion strategy may expose us to additional risks related to our acquisition of other financial institutions.
Our acquisition of other financial institutions, such as the recent merger with Carolina Premier Bank, or parts of other institutions, such as with branch acquisitions, involves a number of risks, including the risk that:
| · | we may incur substantial costs in identifying and evaluating potential acquisitions and merger partners, or in evaluating new markets, hiring experienced, local managers, and opening new offices; |
| · | our estimates and judgments used to evaluate credit, operations, management and market risks relating to target institutions may not be accurate; |
| · | the institutions we acquire may have distressed assets and there can be no assurance that we will be able to realize the value we predict from those assets or that we will make sufficient provisions or have sufficient capital for future losses; |
| · | we may be required to take write-downs or write-offs, restructuring and impairment, or other charges related to the institutions we acquire that could have a significant negative effect on our financial condition and results of operations; |
| · | there may be substantial lag-time between completing an acquisition and generating sufficient assets and deposits to support costs of the expansion; |
| · | our management’s attention in negotiating a transaction and integrating the operations and personnel of the combining businesses may be diverted from our existing business and we may not be able to successfully integrate such operations and personnel; |
| · | we may enter new markets where we lack local experience or that introduce new risks to our operations, or that otherwise result in adverse effects on our results of operations; |
| · | we may introduce new products and services we are not equipped to manage or that introduce new risks to our operations, or that otherwise result in adverse effects on our results of operations; |
| · | we may incur intangible assets in connection with an acquisition, or the intangible assets we incur may become impaired, which could result in adverse short-term effects on our results of operations; |
| · | we may assume liabilities in connection with an acquisition, including unrecorded liabilities that are not discovered at the time of the transaction, and the repayment of those liabilities may have an adverse effect on our results of operations, financial condition and stock price; or |
| · | we may lose key employees and customers that were part of the reason we pursued an acquisition. |
We cannot assure you that we will be able to successfully integrate any banks or banking offices that we acquire into our operations or retain the customers that we acquire in any acquisition. If any of these risks occur in connection with our expansion efforts, it may have a material and adverse effect on our results of operations and financial condition.
We may be subject to environmental liability associated with our lending activities.
A significant portion of our loan portfolio is secured by real property. During the ordinary course of business, we may foreclose on and take title to properties securing certain loans. In doing so, there is a risk that hazardous or toxic substances could be found on these properties. If hazardous or toxic substances are found, we may be liable for remediation costs, as well as for personal injury and property damage. Environmental laws may require us to incur substantial expenses and may materially reduce the affected property’s value or limit our ability to use or sell the affected property. In addition, future laws or more stringent interpretations or enforcement policies with respect to existing laws may increase our exposure to environmental liability. Although we have policies and procedures to perform an environmental review before initiating any foreclosure action on nonresidential real property, these reviews may not be sufficient to detect all potential environmental hazards. The remediation costs and any other financial liabilities associated with an environmental hazard could have a material adverse effect on our financial condition and results of operations.
| - 24 - |
Changes in interest rates affect our profitability and the value of our interest-earning assets.
The Bank derives its income primarily from the difference or “spread” between the interest earned on loans, securities and other interest-earning assets, and interest paid on deposits, borrowed funds and other interest-bearing liabilities. In general, the larger the spread, the more the Bank earns. When market rates of interest change, the interest the Bank receives on its assets and the interest the Bank pays on its liabilities will fluctuate. Changes in market interest rates could adversely affect our interest rate spread and, as a result, our net interest income. Although the yield we earn on our assets and our funding costs tend to move in the same direction in response to changes in interest rates, one can rise or fall faster than the other, causing our interest rate spread to expand or contract. Our liabilities are shorter in duration than our assets, so they will adjust faster in response to changes in interest rates. As a result, when interest rates rise, our funding costs generally will rise faster than the yield we earn on our assets, causing our interest rate spread to contract until the yield catches up. Changes in the slope of the “yield curve”—or the spread between short-term and long-term interest rates—will also reduce our interest rate spread. Normally, the yield curve is upward sloping, meaning short-term rates are lower than long-term rates. Because our liabilities are shorter in duration than our assets, when the yield curve flattens or even inverts, we will experience pressure on our interest rate spread as our cost of funds increases relative to the yield we can earn on our assets. In addition, our mortgage banking income is sensitive to changes in interest rates. During periods of rising and relatively higher interest rates, mortgage originations for purchased homes can decline considerably and refinanced mortgage activity can severely decrease. During periods of falling and relatively lower interest rates, the opposite effects can occur.
Changes in market interest rates could reduce the value of the Bank’s financial assets. Fixed-rate investments, mortgage-backed and related securities and mortgage loans generally decrease in value as interest rates rise. In addition, interest rates affect how much money the Bank lends. For example, when interest rates rise, the cost of borrowing increases and the loan originations tend to decrease.
Interest rates are highly sensitive to many factors that are beyond our control, including general economic conditions and policies of various governmental and regulatory agencies and, in particular, the Federal Open Market Committee of the Federal Reserve Board. Changes in monetary policy, including changes in interest rates, could influence not only the interest we receive on loans and securities and the amount of interest we pay on deposits and borrowings, but such changes could also affect our ability to originate loans and obtain deposits. Rates have been historically low for a long period of time and at this point, should rates rise steadily, we will be operating in an environment different from that in which we have been operating for the last decade. This change could pressure our margins if we are unable to adjust our business practices. If the Bank is unsuccessful in managing the effects of changes in interest rates, the financial condition and results of operations could suffer. Any substantial, unexpected, prolonged change in market interest rates could have a material adverse effect on our business, financial condition and results of operations.
We are subject to extensive regulation that could restrict our activities, have an adverse impact on our operations, and impose financial requirements or limitations on the conduct of our business.
We operate in a highly regulated industry and are subject to examination, supervision, and comprehensive regulation by various regulatory agencies. The Company is subject to Federal Reserve Board regulation, and the Bank is subject to extensive regulation, supervision, and examination by the FDIC and the Commissioner. In addition, as a member of the FHLB of Atlanta, the Bank must comply with applicable regulations of the Federal Housing Finance Board and the FHLB. The Bank’s activities are also regulated under consumer protection laws applicable to our lending, deposit, and other activities. A claim against us under these laws could have a material adverse effect on our results of operations.
| - 25 - |
Regulation by these agencies is intended primarily for the protection of our depositors and the deposit insurance fund and not for the benefit of our shareholders. Federal and state regulators have the ability to impose substantial sanctions, restrictions, and requirements on us if they identify violations of laws with which we must comply or weaknesses or failures with respect to general standards of safety and soundness. Such enforcement may be formal or informal and can include directors’ resolutions, memoranda of understanding, written supervisory agreements, cease-and-desist orders, civil money penalties and termination of deposit insurance and bank closures. Enforcement actions may be taken regardless of the capital levels of the institutions, and regardless of prior examination findings. Any of these consequences could damage our reputation, restrict our ability to expand our business or could require us to raise additional capital or sell assets on terms that are not advantageous to us or our shareholders and could have a material adverse effect on our business, financial condition and results of operations. While we have policies and procedures designed to prevent any such violations, such violations may occur despite our best efforts.
Changes in laws and regulations and the cost of regulatory compliance with new laws and regulations may adversely affect our operations.
Congress and federal regulatory agencies continually review banking laws, regulations and policies for possible changes. The Dodd-Frank Wall Street Reform and Consumer Protection Act, enacted in July 2010, instituted major changes to the banking and financial institutions regulatory regimes and is one example of how legislative changes can greatly impact our business. Changes to statutes, regulations or regulatory policies or supervisory guidance, including changes in interpretation or implementation of statutes, regulations, policies or supervisory guidance, could affect us in substantial and unpredictable ways, including, among other things, subjecting us to increased capital requirements, liquidity and risk management requirements, creating additional costs, limiting the types of financial services and products we may offer and/or increasing the ability of non-banks to offer competing financial services and products. While we cannot predict the extent to which additional legislation will be enacted or the extent we will become subject to increased regulatory scrutiny by any of these regulatory agencies, any regulatory changes or scrutiny could increase or decrease the cost of doing business, limit or expand our permissible activities, or affect the competitive balance among banks, credit unions, savings and loan associations, and other institutions.
We face a risk of noncompliance and enforcement action with the Bank Secrecy Act and other anti-money laundering statutes and regulations.
The federal Bank Secrecy Act, the Uniting and Strengthening America by Providing Appropriate Tools Required to Intercept and Obstruct Terrorism Act of 2001 (the “Patriot Act”) and other laws and regulations require financial institutions, among other duties, to institute and maintain effective anti-money laundering programs, conduct enhanced customer due diligence, and file suspicious activity and currency transaction reports as appropriate. The federal Financial Crimes Enforcement Network, established by the U.S. Treasury Department to administer the Bank Secrecy Act, is authorized to impose significant civil money penalties for violations of those requirements and has recently engaged in coordinated enforcement efforts with the individual federal banking regulators, as well as the U.S. Department of Justice, Drug Enforcement Administration and Internal Revenue Service. There is also increased scrutiny of compliance with the rules enforced by the U.S. Treasury’s Office of Foreign Assets Control. Federal and state bank regulators also focus on compliance with the Bank Secrecy Act and anti-money laundering regulations. If our policies, procedures and systems are deemed deficient or the policies, procedures and systems of the financial institutions that we have already acquired or may acquire in the future are deficient, we would be subject to liability, including fines and regulatory actions such as restrictions on our ability to proceed with certain aspects of our business plan, including our acquisition plans, which would negatively impact our business, financial condition and results of operations. Failure to maintain and implement adequate programs to combat money laundering and terrorist financing could also have serious reputational consequences for us.
| - 26 - |
Federal, state and local consumer lending laws may restrict our ability to originate certain mortgage loans or increase our risk of liability with respect to such loans and could increase our cost of doing business.
Federal, state and local laws have been adopted that are intended to eliminate certain lending practices considered “predatory.” These laws prohibit practices such as steering borrowers away from more affordable products, selling unnecessary insurance to borrowers, repeatedly refinancing loans and making loans without a reasonable expectation that the borrowers will be able to repay the loans irrespective of the value of the underlying property. Loans with certain terms and conditions and that otherwise meet the definition of a “qualified mortgage” may be protected from liability to a borrower for failing to make the necessary determinations. It is our policy not to make predatory loans and to determine borrowers’ ability to repay in accordance with regulatory standards, but the law and related rules create the potential for increased liability with respect to our lending and loan investment activities. They increase our cost of doing business and, ultimately, may prevent us from making certain loans and impact the cost and pricing of loans that we make.
We are subject to federal and state fair lending laws, and failure to comply with these laws could lead to material penalties.
Federal and state fair lending laws and regulations, such as the Equal Credit Opportunity Act and the Fair Housing Act, impose nondiscriminatory lending requirements on financial institutions. The Department of Justice, CFPB and other federal and state agencies are responsible for enforcing these laws and regulations. Private parties may also have the ability to challenge an institution’s performance under fair lending laws in private class action litigation. A successful challenge to our performance under the fair lending laws and regulations could adversely impact our rating under the Community Reinvestment Act and result in a wide variety of sanctions, including the required payment of damages and civil money penalties, injunctive relief, imposition of restrictions on merger and acquisition activity and restrictions on expansion activity, which could negatively impact our reputation, business, financial condition and results of operations.
The Federal Reserve Board may require us to commit capital resources to support the Bank.
The Federal Reserve Board requires a bank holding company to act as a source of financial and managerial strength to a subsidiary bank and to commit resources to support such subsidiary bank. Under the “source of strength” doctrine, the Federal Reserve Board may require a bank holding company to make capital injections into a troubled subsidiary bank and may charge the bank holding company with engaging in unsafe and unsound practices for failure to commit resources to such a subsidiary bank. In addition, the Dodd-Frank Act directs the federal bank regulators to require that all companies that directly or indirectly control an insured depository institution serve as a source of strength for the institution. Under these requirements, in the future, we could be required to provide financial assistance to our Bank if the Bank experiences financial distress.
A capital injection may be required at times when we do not have the resources to provide it, and therefore we may be required to borrow the funds. In the event of a bank holding company’s bankruptcy, the bankruptcy trustee will assume any commitment by the holding company to a federal bank regulatory agency to maintain the capital of a subsidiary bank. Moreover, bankruptcy law provides that claims based on any such commitment will be entitled to a priority of payment over the claims of the holding company’s general unsecured creditors, including the holders of its note obligations. Thus, any borrowing that must be done by the holding company in order to make the required capital injection becomes more difficult and expensive and will adversely impact the holding company’s cash flows, financial condition, results of operations and prospects.
| - 27 - |
If we fail to maintain an effective system of internal control over financial reporting, we may not be able to accurately report our financial results. As a result, current and potential shareholders could lose confidence in our financial reporting, which would harm our business and the trading price of our securities.
If we identify material weaknesses in our internal control over financial reporting or are otherwise required to restate our financial statements, we could be required to implement expensive and time-consuming remedial measures and could lose investor confidence in the accuracy and completeness of our financial reports. We may also face regulatory enforcement or other actions, including the potential delisting of our securities from NASDAQ. This could have a material adverse effect on our business, financial condition and results of operations, and could subject us to litigation.
Changes in accounting standards and management’s selection of accounting methods, including assumptions and estimates, could materially impact our financial statements.
We are also subject to the accounting rules and regulations of the Securities and Exchange Commission (the “SEC”) and the Financial Accounting Standards Board (the “FASB”). From time to time the SEC and the FASB, update accounting principles generally accepted in the United States that govern the preparation of our financial statements and may also require extraordinary efforts or additional costs to implement. Any of these rules or regulations may be modified or changed from time to time, and we cannot be assured that such modifications or changes will not adversely affect us. These changes can be hard to predict and can materially impact how we record and report our financial condition and results of operations. In some cases, we could be required to apply a new or revised standard retroactively, resulting in changes to previously reported financial results, or a cumulative charge to retained earnings. In addition, management is required to use certain assumptions and estimates in preparing our financial statements, including determining the fair value of certain assets and liabilities, among other items. If the assumptions or estimates are incorrect, we may experience unexpected material adverse consequences that could negatively affect our business, results of operations and financial condition.
The FASB has recently issued an accounting standard update that will result in a significant change in how we recognize credit losses and may have a material impact on our financial condition or results of operations.
In June 2016, the FASB issued an accounting standard update, “Financial Instruments-Credit Losses (Topic 326), Measurement of Credit Losses on Financial Instruments,” which replaces the current “incurred loss” model for recognizing credit losses with an “expected loss” model referred to as the Current Expected Credit Loss (“CECL”) model. Under the CECL model, we will be required to present certain financial assets carried at amortized cost, such as loans held for investment and held-to-maturity debt securities, at the net amount expected to be collected over the contractual life of the financial instrument. The measurement of expected credit losses is to be based on information about past events, including historical experience, current conditions, and reasonable and supportable forecasts that affect the collectability of the reported amount. This measurement will take place at the time the financial asset is first added to the balance sheet and periodically thereafter. This differs significantly from the “incurred loss” model required under current GAAP, which delays recognition until it is probable a loss has been incurred. Accordingly, we expect that the adoption of the CECL model will materially affect how we determine our allowance for loan losses and could require us to significantly increase our allowance. Moreover, the CECL model may create more volatility in the level of our allowance for loan losses. If we are required to materially increase our level of allowance for loan losses for any reason, such increase could adversely affect our business, financial condition and results of operations.
The new CECL standard will become effective for us on January 1, 2020. We are currently evaluating the impact the CECL model will have on our accounting, but we expect to recognize a one-time cumulative-effect adjustment to our allowance for loan losses as of the beginning of the first reporting period in which the new standard is effective, consistent with regulatory expectations set forth in interagency guidance issued at the end of 2016. We cannot yet determine the magnitude of any such one-time cumulative adjustment or of the overall impact of the new standard on our financial condition or results of operations.
| - 28 - |
We may be required to raise additional capital in the future, including to comply with increased minimum capital thresholds established by our regulators as part of their implementation of Basel III, but that capital may not be available when it is needed and could be dilutive to our existing shareholders, which could adversely affect our financial condition and results of operations.
In July 2013, the Federal Reserve, FDIC and Office of the Comptroller of the Currency approved final rules that established an integrated regulatory capital framework that addressed perceived shortcomings in certain capital requirements. The rules implement in the United States the Basel III regulatory capital reforms from the Basel Committee on Banking Supervision and certain changes required by the Dodd-Frank Act. Compliance by the Registrant and the Bank with these capital requirements affects our business by increasing the amount of capital required to conduct operations. In order to support the operations at the Bank, we may need to raise capital in the future. Our ability to raise capital will depend in part on conditions in the capital markets at that time, which are outside our control. Accordingly, we may be unable to raise capital on terms acceptable to us if at all. If we cannot raise capital when needed, our ability to operate or further expand our operations could be materially impaired. In addition, if we decide to raise equity capital under such conditions, the interests of our shareholders could be diluted.
We may need additional access to capital, which we may be unable to obtain on attractive terms or at all.
We may need to incur additional debt or equity financing in the future to make strategic acquisitions or investments, for future growth, to fund losses or additional provision for loan losses in the future, or to strengthen our capital ratios. Our ability to raise additional capital, if needed, will depend in part on conditions in the capital markets at that time, which are outside our control, and on our financial performance. Accordingly, we may be unable to raise additional capital, if and when needed, on terms acceptable to us, or at all. If we cannot raise additional capital when needed, our ability to further expand our operations through internal growth and acquisitions could be materially impaired and our stock price could be negatively affected. In addition, if we decide to raise additional equity capital, our current shareholders’ interests could be diluted.
Liquidity is essential to our business.
The primary sources of our Bank’s funds are client deposits and loan repayments. While scheduled loan repayments are a relatively stable source of funds, they are subject to the ability of borrowers to repay the loans. The ability of borrowers to repay loans can be adversely affected by a number of factors, including changes in economic conditions, adverse trends or events affecting business industry groups, reductions in real estate values or markets, business closings or lay-offs, inclement weather, natural disasters, and international instability. Additionally, deposit levels may be affected by a number of factors, including rates paid by competitors, general interest rate levels, regulatory capital requirements, returns available to clients on alternative investments and general economic conditions.
Accordingly, we may be required from time to time to rely on secondary sources of liquidity to meet withdrawal demands or otherwise fund operations. Such sources include FHLB advances, sales of securities and loans, and federal funds lines of credit from correspondent banks, as well as out-of-market time deposits. While we believe that these sources are currently adequate, there can be no assurance they will be sufficient to meet future liquidity demands, particularly if we continue to grow and experience increasing loan demand. We may be required to slow or discontinue loan growth, capital expenditures or other investments or liquidate assets should such sources not be adequate, which could have a material adverse effect on our earnings and financial condition.
| - 29 - |
Increases in FDIC insurance premiums may adversely affect our net income and profitability.
The last economic recession caused a high level of bank failures, which dramatically increased FDIC resolution costs and led to a significant reduction in the balance of the Deposit Insurance Fund. As a result, the FDIC significantly increased the initial base assessment rates paid by financial institutions for deposit insurance. We are generally unable to control the amount of premiums that the Bank is required to pay for FDIC insurance. If there are bank or financial institution failures that exceed the FDIC’s expectations, the Bank may be required to pay higher FDIC premiums than those currently in force. Any future increases or required prepayments of FDIC insurance premiums may adversely impact our earnings and financial condition.
We rely on other companies to provide key components of our business infrastructure.
Third-party vendors provide key components of our business infrastructure such as internet connections, network access, core application processing, and operational software. While we have selected these third-party vendors carefully, we do not control their actions. Any problems caused by these third parties, including as a result of their not providing us their services for any reason or their performing their services poorly, could adversely affect our ability to deliver products and services to our customers and otherwise to conduct our business. Any such failures could damage our reputation, which could negatively affect our operating results. Replacing these third-party vendors could also entail significant delay and expense.
Security breaches and other information system disruptions, such as cyber-attacks, could compromise our information and expose us to liability, which would cause our business and reputation to suffer.
The banking industry has experienced increasing efforts on the part of third parties, including through cyber-attacks, to breach data security at financial institutions or with respect to financial transactions. There have been several recent instances involving financial services and consumer-based companies reporting the unauthorized disclosure of client or customer information or the destruction or theft of corporate data. In addition, because the techniques used to cause such security breaches change frequently, often are not recognized until launched against a target and may originate from less regulated and remote areas around the world, we may be unable to proactively address these techniques or to implement adequate preventative measures. The ability of our customers to bank remotely, including online and through mobile devices, requires secure transmission of confidential information and increases the risk of data security breaches.
In the ordinary course of our business, we collect and store sensitive data, including our proprietary business information and that of our customers, and personally identifiable information of our customers and employees, on our networks. The secure processing, maintenance and transmission of this information is critical to our operations. Despite our security measures, our information technology and infrastructure may be vulnerable to attacks by hackers or breached due to employee error, malfeasance or other disruptions. Any failure, interruption, or breach in security or operational integrity of these systems could compromise our networks and the information stored there could be accessed, publicly disclosed, lost or stolen. Any such access, disclosure or other loss of information could result in legal claims or proceedings, liability under laws that protect the privacy of personal information, and regulatory penalties, disrupt our operations and the services we provide to customers, damage our reputation, and cause a loss of confidence in our products and services, which could adversely affect our financial condition, revenues and competitive position.
| - 30 - |
Failure to keep pace with technological change could adversely affect our business.
The banking industry undergoes frequent technological changes with introductions of new technology-driven products and services. In addition to improving customer services, the effective use of technology increases efficiency and enables financial institutions to reduce costs. Our future success will depend, in part, on our ability to address the needs of our customers by using technology to provide products and services that will satisfy customer demands for convenience as well as to create additional efficiencies in our operations. Many of our competitors have substantially greater resources to invest in continuous technological improvements than we do. We may not be able to quickly deploy these new products and services or be successful in marketing these products and services to our customers. Additionally, the implementation of changes and maintenance to current systems may cause service interruptions, transaction processing errors and system conversion delays. Failure to successfully keep pace with technological change affecting the banking industry while avoiding interruptions, errors and delays could have a material adverse effect on our business, financial condition or results of operations.
We generally outsource a portion of the operational and technological modifications and improvements we make to third parties, and they may experience errors or disruptions that could adversely impact us and over which we may have limited control. In addition, these third parties could also be the source of an attack on, or breach of, our operational systems, data or infrastructure. We also face risk from the integration of new infrastructure platforms and/or new third-party providers of such platforms into our existing businesses.
We may not be able to realize the remaining benefit of our deferred tax assets.
As of December 31, 2017 and 2016, we had a net deferred tax asset of $4.5 million and $3.2 million, respectively. A deferred tax asset is reduced by a valuation allowance if, based on the weight of the evidence available, it is more likely than not that some portion or all of the total deferred tax asset will not be realized. In assessing the future ability of the Company to realize the deferred tax assets, management considers whether it is more likely than not that some portion or all of the deferred tax assets will not be realized. The ultimate realization of deferred tax assets is dependent upon the generation of future taxable income during the periods in which those temporary differences become deductible. The Company will continue to monitor its deferred tax assets closely to evaluate whether we will be able to realize the full benefit of our net deferred tax asset or whether there is any need for a valuation allowance. Significant negative trends in credit quality, losses from operations, or other factors could impact the realization of the deferred tax asset in the future. If we are unable to realize the full benefit of the deferred tax assets, it could negatively impact our results of operations.
If our goodwill becomes impaired, we may be required to record a significant charge to earnings.
We have goodwill recorded on our balance sheet as an asset with a carrying value as of December 31, 2017 of $24.9 million. Under GAAP, goodwill is required to be tested for impairment at least annually and between annual tests if an event occurs or circumstances change that would more likely than not reduce the fair value of a reporting unit below its carrying amount. The test for goodwill impairment involves comparing the fair value of a company’s reporting units to their respective carrying values. The Bank is our only reporting unit. The price of our common stock is one of several factors available for estimating the fair value of our reporting units. Although the price of our common stock is currently trading above book value, it has traded below book value in the past and may do so again in the future. Subject to the results of other valuation techniques, if this situation were to return and persist, it could indicate that a portion of our goodwill is impaired. Accordingly, for this reason or other reasons that indicate that the goodwill at any of our reporting units is impaired, we may be required to record a significant charge to earnings in our financial statements during the period in which any impairment of our goodwill is determined, which could have a negative impact on our results of operations.
We may not be able to effectively compete with larger financial institutions for business.
Commercial banking in North Carolina and South Carolina is extremely competitive. The Bank competes with some of the largest banking organizations in the state and the country and other financial institutions, such as federally and state-chartered savings and loan institutions and credit unions, as well as consumer finance companies, mortgage companies and other lenders engaged in the business of extending credit. Many of these competitors have broader geographic markets, higher lending limits, more services, and more media advertising. We may not be able to compete effectively in our markets, and our results of operations could be adversely affected by the nature or pace of change in competition.
| - 31 - |
Consumers may decide not to use banks to complete their financial transactions.
Technology and other changes are allowing parties to complete financial transactions that historically have involved banks through alternative methods. For example, consumers can now maintain funds that historically would have been held as bank deposits in brokerage accounts or mutual funds. Consumers can also complete transactions such as peer-to-peer payments, paying bills and/or transferring funds directly without the assistance of banks. The process of eliminating banks as intermediaries could result in the loss of fee income, as well as the loss of customer deposits resulting in reduced liquidity and loss of income generated from those deposits. Additionally, our customer base of consumers and small businesses has increasing non-bank options for credit. Now that credit is available through the Internet, competition for small balance loans is expected to increase. The loss of these revenue streams and the lower cost deposits as a source of funds could have a material adverse effect on our financial condition and results of operations.
We may not be able to attract and retain skilled people and the lack of sufficient talent could adversely impact our operations.
Our success depends in part on our ability to retain key executives and to attract and retain additional qualified management personnel who have experience both in sophisticated banking matters and in operating a small- to mid-size bank. Competition for such personnel is strong in the banking industry and we may not be successful in attracting or retaining the personnel we require. Consequently the loss of one or more members of our executive management team may have a material adverse effect on our operations.
Hurricanes or other adverse weather events could disrupt our operations, which could have an adverse effect on our business or results of operations.
North Carolina’s coastal region and inland areas of eastern North Carolina are affected, from time to time, by adverse weather events, particularly hurricanes. We cannot predict whether, or to what extent, damage caused by future hurricanes or other weather events will affect our operations. Weather events could cause a disruption in our day-to-day business activities and could have a material adverse effect on our business, results of operations and financial condition.
Our business reputation is important and any damage to it could have a material adverse effect on our business.
Our reputation is very important to sustain our business, as we rely on our relationships with our current, former and potential customers and shareholders, and the industries that we serve. Any damage to our reputation, whether arising from legal, regulatory, supervisory or enforcement actions, matters affecting our financial reporting or compliance with SEC and exchange listing requirements, negative publicity, the conduct of our business or otherwise could have a material adverse effect on our business, results of operations and financial condition.
Risks Related to an Investment in Our Common Stock
The relatively low trading volume in our common stock may adversely affect your ability to resell shares at prices that you find attractive or at all.
Our common stock is listed for quotation on the Nasdaq Global Market under the ticker symbol “SLCT”. The average daily trading volume for our common stock is less than that of larger financial institutions. Due to its relatively low trading volume, sales of our common stock may place significant downward pressure on the market price of our common stock. Furthermore, it may be difficult for holders to resell their shares at prices they find attractive, or at all.
| - 32 - |
The market price of our common stock may be volatile and subject to fluctuations in response to numerous factors, including, but not limited to, the factors discussed in other risk factors and the following:
| · | actual or anticipated fluctuation in our operating results; |
| · | changes in interest rates; |
| · | changes in the legal or regulatory environment in which we operate; |
| · | press releases, announcements or publicity relating to us or our competitors or relating to trends in our industry; |
| · | changes in expectations as to our future financial performance, including financial estimates or recommendations by securities analysts and investors; |
| · | future sales of our common stock; |
| · | changes in economic conditions in our market, general conditions in the U.S. economy, financial markets or the banking industry; and |
| · | other developments affecting our competitors or us. |
These factors may adversely affect the trading price of our common stock, regardless of our actual operating performance, and could prevent a shareholder from selling common stock at or above the current market price. These factors may also adversely affect our ability to raise capital in the open market if needed. In addition, we cannot say with any certainty that a more active and liquid trading market for its common stock will develop.
Additional issuances of common stock or securities convertible into common stock may dilute holders of our common stock.
We may, in the future, determine that it is advisable, or we may encounter circumstances where it is determined that it is necessary, to issue additional shares of common stock, securities convertible into, exchangeable for or that represent an interest in common stock, or common stock-equivalent securities to fund strategic initiatives or other business needs or to build additional capital. Our board of directors is authorized to cause us to issue additional shares of common stock from time to time for adequate consideration without any additional action on the part of our shareholders in some cases. The market price of our common stock could decline as a result of other offerings, as well as other sales of a large block of common stock or the perception that such sales could occur.
Offerings of debt, which would rank senior to our common stock upon liquidation, may adversely affect the market price of our common stock.
We may attempt to increase our capital resources or, if regulatory capital ratios fall below the required minimums, we could be forced to raise additional capital by making additional offerings of debt or equity securities, senior or subordinated notes, preferred stock and common stock. Upon liquidation, holders of our debt securities and lenders with respect to other borrowings will receive distributions of available assets prior to the holders of our common stock.
Anti-takeover provisions could adversely affect our shareholders.
In some cases, shareholders would receive a premium for their shares if we were acquired by another company. However, state and federal law and our articles of incorporation and bylaws make it difficult for anyone to acquire us without approval of our board of directors. For example, our articles of incorporation require a supermajority vote of two-thirds of our outstanding common stock in order to effect a sale or merger of the Company in certain circumstances. Consequently, a takeover attempt may prove difficult, and shareholders may not realize the highest possible price for their securities.
| - 33 - |
An investment in our common stock is not an insured deposit and may lose value.
Shares of our common stock are not savings accounts, deposits or other obligations of any depository institution and are not insured or guaranteed by the FDIC or any other governmental agency or instrumentality, any other deposit insurance fund or by any other public or private entity. An investment in our common stock is inherently risky for the reasons described in this “Risk Factors” section. As a result, if you acquire shares of our common stock, you may lose some or all of your investment.
Item 1B – UNRESOLVED STAFF COMMENTS
None.
| - 34 - |
The following table sets forth the location of the main office, branch offices, and operation centers of the Registrant’s subsidiary depository institution, Select Bank & Trust Company, as well as certain information relating to these offices.
| Office Location | Year Opened | Approximate Square Footage | Owned or Leased | |||||
| Select Bank & Trust Main Office | 2001 | 12,600 | Owned | |||||
| 700 West Cumberland Street | ||||||||
| Dunn, NC 28334 | ||||||||
| Blacksburg Office | 2017 | 2,898 | Owned | |||||
| 203 W Cherokee Street | ||||||||
| Blacksburg, SC 29702 | ||||||||
| Burlington Office | 2015 | 5,056 | Owned | |||||
| 3158 South Church Street | ||||||||
| Burlington, NC 27217 | ||||||||
| Charlotte Office | 2017 | 15,191 | Leased | |||||
| 13024 Ballantyne Corporate Place | ||||||||
| Charlotte, NC 28277 | ||||||||
| Clinton Office | 2008 | 3,100 | Owned | |||||
| 111 Northeast Boulevard | ||||||||
| Clinton, NC 28328 | ||||||||
| Elizabeth City Office | 2014 | 3,229 | Owned | |||||
| 416 Hughes Boulevard | ||||||||
| Elizabeth City, NC 27909 | ||||||||
| Fayetteville Office | 2004 | 10,000 | Owned | |||||
| 2818 Raeford Road | ||||||||
| Fayetteville, NC 28303 | ||||||||
| Goldsboro Office | 2005 | 6,300 | Owned | |||||
| 431 North Spence Avenue | ||||||||
| Goldsboro, NC 27534 | ||||||||
| Greenville Charles Blvd Office | 2014 | 6,860 | Owned | |||||
| 3600 Charles Blvd. | ||||||||
| Greenville, NC 27858 | ||||||||
| Leland Office | 2015 | 3,731 | Owned | |||||
| 1101 New Pointe Boulevard | ||||||||
| Leland, NC 28451 | ||||||||
| Lillington Office | 2007 | 4,500 | Owned | |||||
| 818 McKinney Parkway | ||||||||
| Lillington, NC 27546 | ||||||||
| Lumberton Office | 2006 | 3,500 | Owned | |||||
| 4400 Fayetteville Road | ||||||||
| Lumberton, NC 28358 | ||||||||
| Morehead City Office | 2015 | 3,731 | Leased | |||||
| 168 N.C. 24 | ||||||||
| Morehead City, NC 28577 | ||||||||
| Raleigh Office | 2016 | 6,538 | Leased | |||||
| 4505 Falls of Neuse Road, Suite #100 | ||||||||
| Raleigh, NC 27609 | ||||||||
| Rock Hill Office | 2017 | 2,030 | Leased | |||||
| 201 Oakland Avenue | ||||||||
| Rock Hill, SC 29730 | ||||||||
| Six Mile Office | 2017 | 700 | Leased | |||||
| 115 N Main Street | ||||||||
| Six Mile, SC 29682 | ||||||||
| Washington Office | 2014 | 1,126 | Leased | |||||
| 155 North Market Street, Suite 103 | ||||||||
| Washington, NC 27889 | ||||||||
| Wilmington Office | 2017 | 8,500 | Leased | |||||
| 1001 Military Cutoff Road, Suite 100 | ||||||||
| Wilmington, NC 28405 | ||||||||
| Operations Center | 2010 | 7,500 | Owned | |||||
| 861 Tilghman Drive | ||||||||
| Dunn, NC 28335 | ||||||||
| Operations Center - Annex | 2010 | 5,000 | Owned | |||||
| 863 Tilghman Drive | ||||||||
| Dunn, NC 28335 | ||||||||
| - 35 - |
In the ordinary course of operations, the Registrant and the Bank are at times involved in legal proceedings. In the opinion of management, as of December 31, 2017 there are no material pending legal proceedings to which the Registrant, or any of its subsidiaries, is a party, or of which any of their property is the subject.
Item 4 – mine safety disclosureS
Not applicable.
| - 36 - |
Item 5 - Market for registrant’s Common Equity, Related Stockholder Matters and ISSUER PURCHASES OF EQUITY SECURITIES
The Registrant’s common stock is quoted on the NASDAQ Global Market under the trading symbol “SLCT.” Raymond James & Associates, Inc., Automated Trading Desk Financial Services, B-Trade Services, Citadel Securities, Domestic Securities, Hill Thompson Magid & Company, Hudson Securities, J. P. Morgan Securities, Janney Montgomery Scott, LLC, Knight Capital Americas, L.P., Monroe Financial Partners, UBS Securities, Sandler O’Neill & Partners, L.P., and Scott & Stringfellow provide bid and ask quotes for our common stock. At March 9, 2018, there were 14,013,917 shares of common stock issued and outstanding, which were held by 1,149 shareholders of record.
| Sales Prices | ||||||||
| High | Low | |||||||
| 2017 | ||||||||
| First Quarter | $ | 11.22 | $ | 9.71 | ||||
| Second Quarter | 12.25 | 10.91 | ||||||
| Third Quarter | 12.70 | 11.25 | ||||||
| Fourth Quarter | 12.64 | 11.55 | ||||||
| 2016 | ||||||||
| First Quarter | $ | 8.18 | $ | 7.70 | ||||
| Second Quarter | 8.25 | 8.00 | ||||||
| Third Quarter | 8.72 | 7.89 | ||||||
| Fourth Quarter | 10.48 | 8.02 | ||||||
The Registrant did not declare or pay common stock cash dividends during 2017 and 2016, and it is not currently anticipated that cash dividends will be declared and paid to common shareholders at any time in the foreseeable future.
Securities Authorized for Issuance under Equity Compensation Plans
See Item 12 of this report for disclosure regarding securities authorized for issuance under equity compensation plans required by Item 201(d) of Regulation S-K.
| - 37 - |
Performance Graph
| Select Bancorp, Inc. |
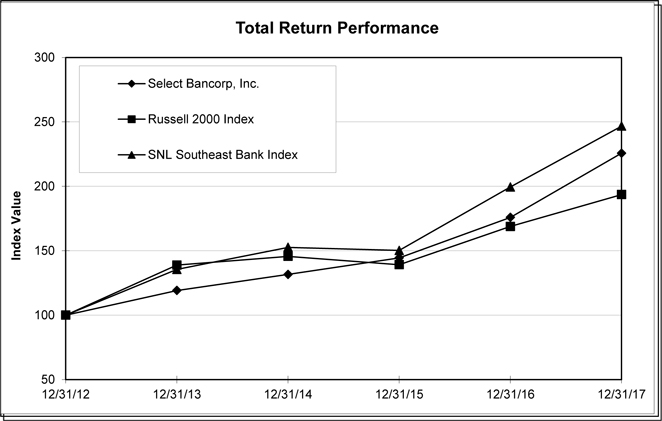
| Period Ending | ||||||||||||||||||||||||
| Index | 12/31/12 | 12/31/13 | 12/31/14 | 12/31/15 | 12/31/16 | 12/31/17 | ||||||||||||||||||
| Select Bancorp, Inc. | 100.00 | 119.13 | 131.61 | 144.46 | 175.89 | 225.71 | ||||||||||||||||||
| Russell 2000 Index | 100.00 | 138.82 | 145.62 | 139.19 | 168.85 | 193.58 | ||||||||||||||||||
| SNL Southeast Bank Index | 100.00 | 135.52 | 152.63 | 150.24 | 199.45 | 246.72 | ||||||||||||||||||
Source: S&P Global Market Intelligence
© 2017
| - 38 - |
Issuer Purchases of Equity Securities
The following table sets forth information regarding the Registrant’s repurchases of its common stock. There were no share repurchases during the fourth quarter of the fiscal year covered by this annual report.
| Period | Total number of shares purchased | Average price paid per share | Total number of shares purchased as part of publicly announced plans or programs(1) | Maximum number of shares that may yet be purchased under the plans or programs(1) | ||||||||||||
| October 2017 Beginning Date: 10/1 Ending Date: 10/31 | — | $ | — | — | 581,518 | |||||||||||
| November 2017 Beginning Date: 11/1 Ending Date: 11/30 | — | — | — | 581,518 | ||||||||||||
| December 2017 Beginning Date: 12/1 Ending Date: 12/31 | — | — | — | 581,518 | ||||||||||||
(1) On August 31, 2016, the Registrant announced that its board of directors had authorized a repurchase plan under which the Registrant may repurchase up 581,518 shares of its common stock through open market purchases or privately negotiated transactions. The Registrant’s purchase plan has no time limit.
| - 39 - |
ITEM 6 – SELECTED FINANCIAL DATA
| At or for the year ended December 31, | ||||||||||||||||||||
| 2017 | 2016 | 2015 | 2014 | 2013 | ||||||||||||||||
| (dollars in thousands, except per share data) | ||||||||||||||||||||
| Operating Data: | ||||||||||||||||||||
| Total interest income | $ | 39,617 | $ | 34,709 | $ | 33,341 | $ | 26,104 | $ | 22,903 | ||||||||||
| Total interest expense | 5,106 | 3,733 | 3,542 | 4,519 | 5,258 | |||||||||||||||
| Net interest income | 34,511 | 30,976 | 29,799 | 21,585 | 17,645 | |||||||||||||||
| Provision (Recovery) for loan losses | 1,367 | 1,516 | 890 | (194 | ) | (325 | ) | |||||||||||||
| Net interest income after provision (recovery) for loan losses | 33,144 | 29,460 | 28,909 | 21,779 | 17,970 | |||||||||||||||
| Total non-interest income | 3,072 | 3,222 | 3,292 | 2,675 | 2,629 | |||||||||||||||
| Merger related expenses | 2,166 | - | 378 | 1,941 | 428 | |||||||||||||||
| Other non-interest expense | 25,153 | 22,281 | 21,852 | 18,719 | 15,427 | |||||||||||||||
| Income before income taxes | 8,897 | 10,401 | 9,971 | 3,794 | 4,744 | |||||||||||||||
| Provision for income taxes | 5,712 | 3,647 | 3,418 | 1,437 | 1,803 | |||||||||||||||
| Net Income | 3,185 | 6,754 | 6,553 | 2,357 | 2,941 | |||||||||||||||
| Dividends on Preferred Stock | - | 4 | 77 | 38 | - | |||||||||||||||
| Net income available to common shareholders | $ | 3,185 | $ | 6,750 | $ | 6,476 | $ | 2,319 | $ | 2,941 | ||||||||||
| Per Share Data: | ||||||||||||||||||||
| Earnings per share - basic | $ | 0.27 | $ | 0.58 | $ | 0.56 | $ | 0.26 | $ | 0.43 | ||||||||||
| Earnings per share - diluted | 0.27 | 0.58 | 0.56 | 0.26 | 0.43 | |||||||||||||||
| Market Price | ||||||||||||||||||||
| High | 12.70 | 10.48 | 8.47 | 10.78 | 7.42 | |||||||||||||||
| Low | 9.71 | 7.70 | 6.62 | 6.25 | 5.43 | |||||||||||||||
| Close | 12.64 | 9.85 | 8.09 | 7.37 | 6.67 | |||||||||||||||
| Book value | 9.72 | 8.95 | 8.38 | 8.59 | 8.09 | |||||||||||||||
| Tangible book value | 7.72 | 8.29 | 7.67 | 7.82 | 8.07 | |||||||||||||||
| Selected Year-End Balance Sheet Data: | ||||||||||||||||||||
| Loans, gross of allowance | $ | 982,626 | $ | 677,195 | $ | 617,398 | $ | 552,038 | $ | 346,500 | ||||||||||
| Allowance for loan losses | 8,835 | 8,411 | 7,021 | 6,844 | 7,054 | |||||||||||||||
| Other interest-earning assets | 89,531 | 93,093 | 134,368 | 138,198 | 138,406 | |||||||||||||||
| Goodwill | 24,904 | 6,931 | 6,931 | 6,931 | - | |||||||||||||||
| Core deposit intangible | 3,101 | 810 | 1,241 | 1,625 | 182 | |||||||||||||||
| Total assets | 1,194,135 | 846,640 | 817,015 | 766,121 | 525,646 | |||||||||||||||
| Deposits | 995,044 | 679,661 | 651,161 | 618,902 | 448,458 | |||||||||||||||
| Borrowings | 47,651 | 60,129 | 58,376 | 46,324 | 18,677 | |||||||||||||||
| Shareholders’ equity | 136,115 | 104,273 | 104,702 | 97,685 | 56,004 | |||||||||||||||
| Selected Average Balances: | ||||||||||||||||||||
| Total assets | $ | 898,943 | $ | 829,315 | $ | 765,274 | $ | 631,905 | $ | 555,354 | ||||||||||
| Loans, gross of allowance | 732,089 | 639,412 | 578,759 | 430,571 | 354,871 | |||||||||||||||
| Total interest-earning assets | 813,773 | 744,024 | 686,663 | 565,264 | 511,597 | |||||||||||||||
| Goodwill | 7,719 | 6,931 | 9,931 | 2,946 | - | |||||||||||||||
| Core deposit intangible | 640 | 1,020 | 1,330 | 884 | 237 | |||||||||||||||
| Deposits | 738,310 | 665,764 | 607,214 | 523,954 | 470,526 | |||||||||||||||
| Total interest-bearing liabilities | 787,073 | 723,111 | 659,676 | 554,405 | 413,419 | |||||||||||||||
| Shareholders’ equity | 108,709 | 102,110 | 102,068 | 73,660 | 55,701 | |||||||||||||||
| Selected Performance Ratios: | ||||||||||||||||||||
| Return on average assets | 0.35 | % | 0.81 | % | 0.86 | % | 0.37 | % | 0.53 | % | ||||||||||
| Return on average equity | 2.93 | % | 6.61 | % | 6.42 | % | 3.12 | % | 5.28 | % | ||||||||||
| Net interest margin (4) | 4.14 | % | 4.06 | % | 4.34 | % | 3.88 | % | 3.46 | % | ||||||||||
| Net interest spread (4) | 4.09 | % | 4.04 | % | 4.18 | % | 3.60 | % | 3.22 | % | ||||||||||
| Efficiency ratio (1) | 72.69 | % | 65.15 | % | 67.18 | % | 77.16 | % | 78.20 | % | ||||||||||
| Asset Quality Ratios: | ||||||||||||||||||||
| Nonperforming loans to period-end loans (2) | 0.71 | % | 1.02 | % | 1.41 | % | 2.15 | % | 4.58 | % | ||||||||||
| Allowance for loan losses to period-end loans (3) 0.90% | 1.24 | % | 1.14 | % | 1.24 | % | 2.04 | % | ||||||||||||
| Net loan charge-offs (recoveries) to average loans | 0.13 | % | 0.02 | % | 0.12 | % | (0.03 | )% | 0.15 | % | ||||||||||
| - 40 - |
| At or for the year ended December 31, | ||||||||||||||||||||
| 2017 | 2016 | 2015 | 2014 | 2013 | ||||||||||||||||
| (dollars in thousands, except per share data) | ||||||||||||||||||||
| Capital Ratios: | ||||||||||||||||||||
| Total risk-based capital | 11.86 | % | 15.12 | % | 16.01 | % | 17.70 | % | 19.26 | % | ||||||||||
| Tier 1 risk-based capital | 11.04 | % | 14.03 | % | 15.04 | % | 16.56 | % | 18.00 | % | ||||||||||
| Common equity Tier 1 Capital | 9.94 | % | 12.48 | % | 12.33 | % | - | - | ||||||||||||
| Leverage ratio | 12.64 | % | 12.99 | % | 13.81 | % | 13.10 | % | 12.62 | % | ||||||||||
| Tangible equity to assets | 9.05 | % | 11.40 | % | 10.88 | % | 11.65 | % | 10.62 | % | ||||||||||
| Equity to assets ratio | 11.40 | % | 12.57 | % | 13.68 | % | 15.46 | % | 10.65 | % | ||||||||||
| Other Data: | ||||||||||||||||||||
| Number of banking offices | 18 | 13 | 14 | 14 | 8 | |||||||||||||||
| Number of full time equivalent employees | 202 | 150 | 153 | 154 | 97 | |||||||||||||||
| (1) | Efficiency ratio is calculated as non-interest expenses divided by the sum of net interest income and non-interest income. |
| (2) | Nonperforming loans consist of non-accrual loans and restructured loans. |
| (3) | Allowance for loan losses to period-end loans ratio excludes loans held for sale. |
| (4) | Fully taxable equivalent basis. |
| - 41 - |
Item 7 - ManageMent’s Discussion and Analysis of Financial Condition and Results of OperationS
The following presents management’s discussion and analysis of our financial condition and results of operations and should be read in conjunction with the financial statements and related notes contained elsewhere in this annual report. This discussion contains forward-looking statements that involve risks and uncertainties. Our actual results could differ significantly from those anticipated in these forward-looking statements as a result of various factors, many of which are beyond our control. The following discussion is intended to assist in understanding the financial condition and results of operations of Select Bancorp, Inc. Because Select Bancorp, Inc. has no material operations and conducts no business on its own other than owning its consolidated subsidiary, Select Bank & Trust Company, and its unconsolidated subsidiary, New Century Statutory Trust I, the discussion contained in this Management's Discussion and Analysis concerns primarily the business of the bank subsidiary. However, for ease of reading and because the financial statements are presented on a consolidated basis, Select Bancorp, Inc. and Select Bank & Trust are collectively referred to herein as the Company unless otherwise noted.
DESCRIPTION OF BUSINESS
The Company is a commercial bank holding company that was incorporated on May 14, 2003 and has one wholly-owned banking subsidiary, Select Bank & Trust Company (referred to as the “Bank”), which became a subsidiary of the Company as part of a holding company reorganization. In September 2004, the Company formed New Century Statutory Trust I, which issued trust preferred securities to provide additional capital for general corporate purposes, including the expansion of the Bank. New Century Statutory Trust I is not a consolidated subsidiary of the Company. The Company’s only business activity is the ownership of the Bank. Accordingly, this discussion focuses primarily on the financial condition and operating results of the Bank.
The Bank’s lending activities are oriented to the consumer/retail customer as well as to the small-to-medium sized businesses located in central and eastern North Carolina in addition to northwest South Carolina. The Bank offers the standard complement of commercial, consumer, and mortgage lending products, as well as the ability to structure products to fit specialized needs. The deposit services offered by the Bank include small business and personal checking, savings accounts and certificates of deposit. The Bank concentrates on customer relationships in building its customer deposit base and competes aggressively in the area of transaction accounts.
FINANCIAL CONDITION
DECEMBER 31, 2017 AND 2016
Overview
Total assets at December 31, 2017 were $1.2 billion, which represents an increase of $347.5 million or 41.0% from December 31, 2016. Interest earning assets at December 31, 2017 totaled $1.1 billion and consisted of $973.8 million in net loans, $63.8 million in investment securities, and $46.1 million in overnight investments and interest-bearing deposits in other banks. Total deposits and shareholders’ equity at December 31, 2017 were $995.0 million and $136.1 million, respectively.
On December 15, 2017 the Company acquired Premara Financial, Inc. through the merger of Premara with and into the Company. Immediately following the parent merger, Premara’s wholly owned subsidiary, Carolina Premier Bank, was merged with and into Select Bank. As a result of the mergers, the Company acquired a branch in Charlotte, North Carolina and branches in Rock Hill, Blacksburg and Six Mile, South Carolina. The Company also added additional assets of $278.8 million, net loans of $198.4 million and $226.3 million in deposits through the acquisition. The Company now operates 18 full-service offices in two states, having also added a full-service branch in Wilmington, North Carolina during 2017 and a branch in Raleigh, North Carolina during 2016.
| - 42 - |
Investment Securities
Investment securities increased to $63.8 million at December 31, 2017 from $62.3 million at December 31, 2016. The Company’s investment portfolio at December 31, 2017, which consisted of U.S. government sponsored entities agency securities (GSE’s), mortgage-backed securities, corporate bonds and bank-qualified municipal securities, aggregated $63.8 million with a weighted average taxable equivalent yield of 2.88%. The Company also holds an investment of $2.5 million in Federal Home Loan Bank Stock with a weighted average yield of 5.86%. The investment portfolio increased $1.5 million in 2017 as a result of $4.3 million of maturities and $6.0 million prepayments, $22.0 million in disposals, offset by $34.4 million in purchases of which $32.8 million were from the Premara merger and a decrease of $42,000 in the market value of securities available for sale and net accretion of investment discounts.
The following table summarizes the securities portfolio by major classification as of December 31, 2017:
Securities Portfolio Composition
(dollars in thousands)
| Tax | ||||||||||||
| Amortized | Fair | Equivalent | ||||||||||
| Cost | Value | Yield | ||||||||||
| U. S. government agency securities - GSE’s: | ||||||||||||
| Due within one year | $ | 324 | $ | 327 | 2.66 | % | ||||||
| Due after one but within five years | 9,636 | 9,718 | 2.49 | % | ||||||||
| Due after five but within ten years | 3,155 | 3,189 | 2.75 | % | ||||||||
| Due after ten years | 126 | 130 | 3.91 | % | ||||||||
| 13,241 | 13,364 | 2.57 | % | |||||||||
| Mortgage-backed securities: | ||||||||||||
| Due within one year | - | - | -% | |||||||||
| Due after one but within five years | 27,667 | 27,774 | 2.47 | % | ||||||||
| Due after five but within ten years | 1,904 | 1,910 | 2.83 | % | ||||||||
| Due after ten years | - | - | -% | |||||||||
| 29,571 | 29,684 | 2.48 | % | |||||||||
| Corporate bonds: | ||||||||||||
| Due within one year | - | - | -% | |||||||||
| Due after one but within five years | 593 | 607 | 8.57 | % | ||||||||
| Due after five but within ten years | 1,265 | 1,281 | 4.76 | % | ||||||||
| Due after ten years | - | - | -% | |||||||||
| 1,858 | 1,888 | 5.56 | % | |||||||||
| State and local governments: | ||||||||||||
| Due within one year | 651 | 653 | 3.05 | % | ||||||||
| Due after one but within five years | 7,522 | 7,600 | 2.91 | % | ||||||||
| Due after five but within ten years | 1,499 | 1,510 | 3.30 | % | ||||||||
| Due after ten years | 8,911 | 9,075 | 3.94 | % | ||||||||
| 18,583 | 18,838 | 3.40 | % | |||||||||
| Total securities available for sale: | ||||||||||||
| Due within one year | 975 | 980 | 2.43 | % | ||||||||
| Due after one but within five years | 45,418 | 45,699 | 2.61 | % | ||||||||
| Due after five but within ten years | 7,823 | 7,890 | 3.45 | % | ||||||||
| Due after ten years | 9,037 | 9,205 | 3.86 | % | ||||||||
| $ | 63,253 | $ | 63,774 | 2.88 | % | |||||||
| - 43 - |
Loans Receivable
The loan portfolio at December 31, 2017 totaled $982.6 million, which was a $305.5 million, or 45.1%, increase from December 31, 2016. At December 31, 2017, the portfolio was composed of $867.5 million in real estate loans, $106.2 million in commercial and industrial loans, and $10.2 million in loans to individuals. Also included in loans outstanding is $1.3 million in net deferred loan fees. The increase in loans outstanding during 2017 was due primarily to loan growth and the acquisition of Carolina Premier, which acquisition accounted for $198.4 million of net loans at December 31, 2017.
The following table describes the Company’s loan portfolio composition by category at the dates indicated:
| At December 31, | ||||||||||||||||||||||||||||||||||||||||
| 2017 | 2016 | 2015 | 2014 | 2013 | ||||||||||||||||||||||||||||||||||||
| % of | % of | % of | % of | % of | ||||||||||||||||||||||||||||||||||||
| Total | Total | Total | Total | Total | ||||||||||||||||||||||||||||||||||||
| Amount | Loans | Amount | Loans | Amount | Loans | Amount | Loans | Amount | Loans | |||||||||||||||||||||||||||||||
| (dollars in thousands) | ||||||||||||||||||||||||||||||||||||||||
| Real estate loans: | ||||||||||||||||||||||||||||||||||||||||
| 1-to-4 family residential | $ | 156,901 | 16.0 | % | $ | 97,978 | 14.5 | % | $ | 87,955 | 14.2 | % | $ | 90,903 | 16.5 | % | $ | 35,006 | 10.1 | % | ||||||||||||||||||||
| Commercial real estate | 403,100 | 41.0 | % | 281,723 | 41.6 | % | 259,259 | 42.0 | % | 233,630 | 42.3 | % | 169,176 | 48.9 | % | |||||||||||||||||||||||||
| Multi-family residential | 76,983 | 7.8 | % | 56,119 | 8.3 | % | 40,738 | 6.6 | % | 42,224 | 7.6 | % | 19,739 | 5.7 | % | |||||||||||||||||||||||||
| Construction | 177,933 | 18.1 | % | 100,911 | 14.9 | % | 107,688 | 17.4 | % | 83,593 | 15.1 | % | 53,325 | 15.3 | % | |||||||||||||||||||||||||
| Home equity lines of credit | 52,606 | 5.3 | % | 41,158 | 6.1 | % | 42,002 | 6.8 | % | 38,093 | 6.9 | % | 31,863 | 9.2 | % | |||||||||||||||||||||||||
| Total real estate loans | 867,523 | 88.2 | % | 577,889 | 85.4 | % | 537,642 | 87.0 | % | 488,443 | 88.4 | % | 309,109 | 89.2 | % | |||||||||||||||||||||||||
| Other loans: | ||||||||||||||||||||||||||||||||||||||||
| Commercial and industrial | 106,164 | 10.8 | % | 90,678 | 13.4 | % | 73,491 | 11.9 | % | 58,217 | 10.6 | % | 29,166 | 8.4 | % | |||||||||||||||||||||||||
| Loans to individuals & overdrafts | 10,244 | 1.1 | % | 9,827 | 1.4 | % | 7,255 | 1.2 | % | 6,017 | 1.1 | % | 8,775 | 2.5 | % | |||||||||||||||||||||||||
| Total other loans | 116,408 | 11.9 | % | 100,505 | 14.8 | % | 80,746 | 13.1 | % | 64,234 | 11.7 | % | 37,941 | 10.9 | % | |||||||||||||||||||||||||
| Less: | ||||||||||||||||||||||||||||||||||||||||
| Deferred loan origination (fees) cost, net | (1,305 | ) | (0.1 | )% | (1,199 | ) | (0.2 | )% | (990 | ) | (0.1 | )% | (639 | ) | (0.1 | )% | (550 | ) | (0.1 | )% | ||||||||||||||||||||
| Total loans | 982,626 | 100.0 | % | 677,195 | 100 | % | 617,398 | 100.0 | % | 552,038 | 100.0 | % | 346,500 | 100.0 | % | |||||||||||||||||||||||||
| Allowance for loan losses | (8,835 | ) | (8,411 | ) | (7,021 | ) | (6,844 | ) | (7,054 | ) | ||||||||||||||||||||||||||||||
| Total loans, net | $ | 973,791 | $ | 668,784 | $ | 610,377 | $ | 545,194 | $ | 339,446 | ||||||||||||||||||||||||||||||
The majority of the Company’s loan portfolio is comprised of real estate loans. This category, which includes both commercial and consumer loan balances, increased from 85.4% of the loan portfolio at December 31, 2016 to 88.2% at December 31, 2017. There was a $121.4 million increase in commercial real estate loans, a $59.0 million increase in 1-to-4 family residential loans, a $11.4 million increase in HELOC loans, a $77.0 million increase in construction loans, and a $20.9 million increase in multi-family residential loans.
Management monitors trends in the loan portfolio that may indicate more than normal risk. A discussion of certain risk factors follows. Some loans or groups of loans may contain one or more of these individual loan risk factors. Therefore, an accumulation of the amounts or percentages of the individual loan risk factors may not necessarily be an indication of the cumulative risk in the total loan portfolio.
| - 44 - |
Acquisition, Development and Construction Loans
The Company originates construction loans for the purpose of acquisition, development, and construction of both residential and commercial properties (“ADC” loans).
Acquisition, Development and Construction Loans
As of December 31, 2017
(dollars in thousands)
| Construction | Land and Land Development | Total | ||||||||||
| Total ADC loans | $ | 149,856 | $ | 28,077 | $ | 177,933 | ||||||
| Average Loan Size | $ | 262 | $ | 265 | ||||||||
| Percentage of total loans | 15.25 | % | 2.86 | % | 18.11 | % | ||||||
| Non-accrual loans | $ | 384 | $ | - | $ | 384 | ||||||
Management closely monitors the ADC portfolio as to collateral value, funding based on project completeness, and the performance of similar loans in the Company’s market area.
Included in ADC loans and residential real estate loans as of December 31, 2017 were certain loans that exceeded regulatory loan to value (“LTV”) guidelines. As of that date, the Company had $24.6 million in non-1-to-4 family residential loans that exceeded the regulatory LTV limits and $13.8 million of 1-to-4 family residential loans that exceeded the regulatory LTV limits. The banking regulators recognize that it may be appropriate in individual cases to originate or purchase loans with LTV ratios in excess of regulatory limits based on the support provided by other credit factors. The Bank has established a review and approval procedure for such loans. Under applicable guidance, the total amount of all loans in excess of regulatory LTV limits should not exceed 100% of total capital. The total amount of these loans represented 31.2% of total risk-based capital as of December 31, 2017, which is less than the 100% maximum specified in regulatory guidance. These loans may present more than ordinary risk to the Company if the real estate market softens for both market activity and collateral valuations. Similar information with respect to the Company’s ADC portfolio at December 31, 2016 is set forth below:
Acquisition, Development and Construction Loans
As of December 31, 2016
(dollars in thousands)
| Construction | Land and Land Development | Total | ||||||||||
| Total ADC loans | $ | 76,037 | $ | 24,874 | $ | 100,911 | ||||||
| Average Loan Size | $ | 166 | $ | 350 | ||||||||
| Percentage of total loans | 11.23 | % | 3.67 | % | 14.90 | % | ||||||
| Non-accrual loans | $ | 151 | $ | - | $ | 151 | ||||||
Included in ADC loans and residential real estate loans as of December 31, 2016 were certain loans that exceeded regulatory loan to value (“LTV”) guidelines. As of that date, the Company had $21.7 million in non-1-to-4 family residential loans that exceeded the regulatory LTV limits and $4.8 million of 1-to-4 family residential loans that exceeded the regulatory LTV limits. The total amount of these loans represented 23.6% of total risk-based capital as of December 31, 2016, which is less than the 100% maximum specified in regulatory guidance.
| - 45 - |
Business Sector Concentrations
Loan concentrations in certain business sectors impacted by lower than normal retail sales, higher unemployment, higher vacancy rates, and weakened real estate market values may also pose additional risk to the Company’s capital position. The Company has established an internal commercial real estate guideline of 40% of Risk-Based Capital for any single product type.
At December 31, 2017, the Company exceeded the 40% guideline in five product types. The 1-to-4 Family Residential Rental category represented 52% of Risk-Based Capital or $64.4 million, Real Estate Commercial Construction represented 51% of Risk-Based Capital or $62.3 million, Real Estate Construction Spec & Presold represented 42% or $51.6 million, Office Building category represented 56% or $68.8 million, and the Multi-family Residential category represented 61% of Risk-Based Capital or $74.6 million. All other commercial real estate product types were under the 40% threshold. These product types exceeded established guidelines as a result of loans acquired in the merger with Carolina Premier and recent loan growth.
At December 31, 2016, the Company exceeded the 40% guideline in two product types. The 1-to-4 Family Residential Rental category represented 66% of Risk-Based Capital or $74.2 million and the Multi-family Residential category represented 49% of Risk-Based Capital or $54.5 million at December 31, 2016. All other commercial real estate product types were under the 40% threshold.
Geographic Concentrations
Certain risks exist arising from the geographic location of specific types of higher than normal risk real estate loans. Below is a table showing geographic concentrations for ADC and home equity lines of credit (“HELOC”) loans at December 31, 2017.
| ADC Loans | Percent | HELOC | Percent | |||||||||||||
| (dollars in thousands) | ||||||||||||||||
| Harnett County | $ | 5,076 | 2.85 | % | $ | 5,365 | 10.20 | % | ||||||||
| Alamance County | 1,727 | 0.97 | % | 1,075 | 2.04 | % | ||||||||||
| Beaufort County | 147 | 0.08 | % | 1,649 | 3.13 | % | ||||||||||
| Brunswick County | 8,509 | 4.78 | % | 1,696 | 3.22 | % | ||||||||||
| Carteret County | 3,279 | 1.84 | % | 2,795 | 5.31 | % | ||||||||||
| Craven County | 923 | 0.52 | % | 578 | 1.10 | % | ||||||||||
| Cherokee County | - | -% | 59 | 0.11 | % | |||||||||||
| Cumberland County | 23,105 | 12.99 | % | 4,196 | 7.98 | % | ||||||||||
| Mecklenburg County | 10,826 | 6.08 | % | 3,249 | 6.18 | % | ||||||||||
| New Hanover County | 19,445 | 10.93 | % | 2,136 | 4.06 | % | ||||||||||
| Pasquotank County | 1,115 | 0.63 | % | 1,730 | 3.29 | % | ||||||||||
| Pickens County | - | -% | 72 | 0.14 | % | |||||||||||
| Pitt County | 17,421 | 9.79 | % | 6,727 | 12.79 | % | ||||||||||
| Robeson County | 837 | 0.47 | % | 3,606 | 6.86 | % | ||||||||||
| Sampson County | 26 | 0.01 | % | 1,694 | 3.22 | % | ||||||||||
| Wake County | 25,785 | 14.49 | % | 1,281 | 2.43 | % | ||||||||||
| Wayne County | 10,475 | 5.89 | % | 4,185 | 7.96 | % | ||||||||||
| Wilson County | 85 | 0.05 | % | 71 | 0.13 | % | ||||||||||
| York County | 408 | 0.23 | % | 1,454 | 2.76 | % | ||||||||||
| All other locations | 48,744 | 27.40 | % | 8,988 | 17.09 | % | ||||||||||
| Total | $ | 177,933 | 100.00 | % | $ | 52,606 | 100.00 | % | ||||||||
| - 46 - |
Below is a table showing geographic concentrations for ADC and HELOC loans at December 31, 2016.
| ADC Loans | Percent | HELOC | Percent | |||||||||||||
| (dollars in thousands) | ||||||||||||||||
| Harnett County $ 4,505 | 4.46 | % | $ | 5,817 | 14.13 | % | ||||||||||
| Alamance County | 1,169 | 1.16 | % | 1,065 | 2.59 | % | ||||||||||
| Beaufort County | 182 | 0.18 | % | 1,026 | 2.49 | % | ||||||||||
| Brunswick County | 4,506 | 4.47 | % | 1,899 | 4.61 | % | ||||||||||
| Carteret County | 585 | 0.58 | % | 2,350 | 5.71 | % | ||||||||||
| Cumberland County | 22,610 | 22.40 | % | 5,278 | 12.82 | % | ||||||||||
| Pasquotank County | 947 | 0.94 | % | 1,258 | 3.06 | % | ||||||||||
| Pitt County | 13,697 | 13.57 | % | 5,151 | 12.52 | % | ||||||||||
| Robeson County | 803 | 0.80 | % | 3,709 | 9.01 | % | ||||||||||
| Sampson County | 71 | 0.07 | % | 1,574 | 3.83 | % | ||||||||||
| Wake County | 15,689 | 15.55 | % | 1,536 | 3.73 | % | ||||||||||
| Wayne County | 9,734 | 9.65 | % | 4,281 | 10.40 | % | ||||||||||
| All other locations | 26,413 | 26.17 | % | 6,214 | 15.10 | % | ||||||||||
| Total | $ | 100,911 | 100.00 | % | $ | 41,158 | 100.00 | % | ||||||||
Interest Only Payments
Another risk factor that exists in the total loan portfolio pertains to loans with interest only payment terms. At December 31, 2017, the Company had $291.8 million in loans that had terms permitting interest only payments. This represented 29.70% of the total loan portfolio. At December 31, 2016, the Company had $161.5 million in loans that had terms permitting interest only payments. This represented 23.85% of the total loan portfolio. In light of the risk inherent with interest only loans, it is customary and general industry practice that loans in the ADC portfolio are interest only payments during the acquisition, development, and construction phases of such projects but then convert to amortizing term loans with scheduled payments of principal and interest.
Large Dollar Concentrations
Concentrations of high dollar loans or large customer relationships may pose additional risk in the total loan portfolio. The Company’s ten largest loans or lines of credit concentrations totaled $66.7 million or 6.8% of total loans at December 31, 2017 compared to $62.9 million or 9.3% of total loans at December 31, 2016. The Company’s ten largest customer loan relationship concentrations totaled $90.0 million, or 9.2% of total loans, at December 31, 2017 compared to $80.9 million, or 11.9% of total loans at December 31, 2016. Deterioration or loss in any one or more of these high dollar loan or customer concentrations could have a material adverse impact on the capital position of the Company and on our results of operations.
| - 47 - |
Maturities and Sensitivities of Loans to Interest Rates
The following table presents the maturity distribution of the Company’s loans at December 31, 2017. The table also presents the portion of loans that have fixed interest rates or variable interest rates that fluctuate over the life of the loans in accordance with changes in an interest rate index such as the prime rate:
| At December 31, 2017 | ||||||||||||||||
| Due after one | ||||||||||||||||
| Due within | year but within | Due after | ||||||||||||||
| one year | five years | five years | Total | |||||||||||||
| (dollars in thousands) | ||||||||||||||||
| Fixed rate loans: | ||||||||||||||||
| 1-to-4 family residential | $ | 12,954 | $ | 83,495 | $ | 28,564 | $ | 125,013 | ||||||||
| Commercial real estate | 42,618 | 239,719 | 63,656 | 345,993 | ||||||||||||
| Multi-family residential | 8,499 | 48,100 | 4,889 | 61,488 | ||||||||||||
| Construction | 3,617 | 40,803 | 12,906 | 57,326 | ||||||||||||
| Home equity lines of credit | - | 137 | 136 | 273 | ||||||||||||
| Commercial and industrial | 7,350 | 52,732 | 8,700 | 68,782 | ||||||||||||
| Loans to individuals & overdrafts | 1,905 | 3,358 | 1,833 | 7,096 | ||||||||||||
| Total at fixed rates | 76,943 | 468,344 | 120,684 | 665,971 | ||||||||||||
| Variable rate loans: | ||||||||||||||||
| 1-to-4 family residential | 6,725 | 10,357 | 14,035 | 31,117 | ||||||||||||
| Commercial real estate | 8,745 | 35,891 | 11,943 | 56,579 | ||||||||||||
| Multi-family residential | 983 | 11,710 | 2,802 | 15,495 | ||||||||||||
| Construction | 105,968 | 12,853 | 1,402 | 120,223 | ||||||||||||
| Home equity lines of credit | 3,042 | 16,095 | 32,867 | 52,004 | ||||||||||||
| Commercial and industrial | 23,450 | 5,915 | 7,921 | 37,286 | ||||||||||||
| Loans to individuals & overdrafts | 1,810 | 617 | 714 | 3,141 | ||||||||||||
| Total at variable rates | 150,723 | 93,438 | 71,684 | 315,845 | ||||||||||||
| Subtotal | 227,666 | 561,782 | 192,368 | 981,816 | ||||||||||||
| Non-accrual loans | 799 | 803 | 513 | 2,115 | ||||||||||||
| Gross loans | $ | 228,465 | $ | 562,585 | $ | 192,881 | $ | 983,931 | ||||||||
| Deferred loan origination (fees) costs, net | (1,305 | ) | ||||||||||||||
| Total loans | $ | 982,626 | ||||||||||||||
The Company may renew loans at maturity when requested by a customer whose financial strength appears to support such renewal or when such renewal appears to be in the Company’s best interest. In such instances, the Company generally requires payment of accrued interest and may require a principal reduction or modify other terms of the loan at the time of renewal.
Past Due Loans and Nonperforming Assets
At December 31, 2017, the Company had $6.2 million in loans that were 30 days or more past due. This represented 0.63% of gross loans outstanding on that date. This is an increase from December 31, 2016 when there were $3.0 million in loans that were past due 30 days or more, or 0.44% of gross loans outstanding. Non-accrual loans decreased to $2.1 million at December 31, 2017 from $5.8 million at December 31, 2016. As of December 31, 2017, the Company had thirty-six loans totaling $5.8 million that were considered to be troubled debt restructurings, of which twenty-two loans totaling $4.9 million were still accruing interest. As of December 31, 2016, the Company had thirty-seven loans totaling $6.0 million that were considered to be troubled debt restructurings, of which twenty-three loans totaling $3.6 million were still accruing interest. There were eleven loans in the aggregate amount of $1.5 million greater than 90 days past due and still accruing interest at December 31, 2017 and there were three loans in the amount of $529,000 greater than 90 days past due and still accruing interest at December 31, 2016. Tables included in Note E of the Notes to Consolidated Financial Statements included under Item 8 of this report present an age analysis of past due loans, including acquired credit-impaired loans, or PCI Loans, segregated by class of loans as of December 31, 2017.
| - 48 - |
The table below sets forth, for the periods indicated, information about the Company’s non-accrual loans, loans past due 90 days or more and still accruing interest, total non-performing loans (non-accrual loans plus restructured loans), and total non-performing assets.
| As December 31, | ||||||||||||||||||||
| 2017 | 2016 | 2015 | 2014 | 2013 | ||||||||||||||||
| (dollars in thousands) | ||||||||||||||||||||
| Non-accrual loans | $ | 2,115 | $ | 5,805 | $ | 6,635 | $ | 6,938 | $ | 9,319 | ||||||||||
| Restructured loans | 4,863 | 3,625 | 2,077 | 4,938 | 6,537 | |||||||||||||||
| Total non-performing loans | 6,978 | 9,430 | 8,712 | 11,876 | 15,856 | |||||||||||||||
| Foreclosed real estate | 1,258 | 599 | 1,401 | 1,585 | 2,008 | |||||||||||||||
| Total non-performing assets | $ | 8,236 | $ | 10,029 | $ | 10,113 | $ | 13,461 | $ | 17,864 | ||||||||||
| Accruing loans past due 90 days or more | $ | 1,476 | $ | 529 | $ | 142 | $ | 2,230 | $ | - | ||||||||||
| Allowance for loan losses | $ | 8,835 | $ | 8,411 | $ | 7,021 | $ | 6,844 | $ | 7,054 | ||||||||||
| Non-performing loans to period end loans | 0.71 | % | 1.39 | % | 1.41 | % | 2.15 | % | 4.58 | % | ||||||||||
| Non-performing loans and accruing loans past due 90 days or more to period end loans | 0.86 | % | 1.47 | % | 1.43 | % | 2.56 | % | 4.58 | % | ||||||||||
| Allowance for loan losses to period end loans | 0.90 | % | 1.24 | % | 1.14 | % | 1.24 | % | 2.04 | % | ||||||||||
| Allowance for loan losses to non-performing loans | 127 | % | 89 | % | 81 | % | 58 | % | 44 | % | ||||||||||
| Allowance for loan losses to non-performing assets | 107 | % | 84 | % | 69 | % | 51 | % | 39 | % | ||||||||||
| Allowance for loan losses to non-performing assets and accruing loans past due 90 days or more | 91 | % | 80 | % | 68 | % | 44 | % | 39 | % | ||||||||||
| Non-performing assets to total assets | 0.69 | % | 1.18 | % | 1.24 | % | 1.76 | % | 3.40 | % | ||||||||||
| Non-performing assets and accruing loans past due 90 days or more to total assets | 0.81 | % | 1.25 | % | 1.26 | % | 2.05 | % | 3.40 | % | ||||||||||
In addition to the above, the Company had $4.9 million in loans that were considered to be impaired for reasons other than their past due, accrual or restructured status. In total, there were $8.0 million in loans that were considered to be impaired at December 31, 2017, which is a $3.0 million decrease from the $11.0 million that was impaired at December 31, 2016. Impaired loans have been evaluated by management in accordance with Accounting Standards Codification (“ASC”) 310 and $61,000 has been included in the allowance for loan losses as of December 31, 2017 for these loans. All troubled debt restructurings and other non-performing loans are included within impaired loans as of December 31, 2017.
| - 49 - |
Allowance for Loan Losses
The allowance for loan losses is a reserve established through provisions for loan losses charged to expense and represents management’s best estimate of probable loan losses that will be incurred within the existing portfolio of loans. The allowance, in the judgment of management, is necessary to reserve for estimated losses and risk inherent in the loan portfolio. The Company’s allowance for loan loss methodology is based on historical loss experience by type of credit and internal risk grade, specific homogeneous risk pools and specific loss allocations, with adjustments for current events and conditions. The Company’s process for determining the appropriate level of reserves is designed to account for changes in credit quality as they occur. The provision for loan losses reflects loan quality trends, including the levels of and trends related to past due loans and economic conditions at the local and national levels. It also considers the quality and risk characteristics of the Company’s loan origination and servicing policies and practices. Individual reserves are calculated according to ASC 310-10-35 against loans evaluated individually and deemed to most likely be impaired. Impaired loans include all loans in non-accrual status, all troubled debt restructures, all substandard loans that are deemed to be collateral dependent, and other loans that management determines require reserves.
The following table presents the Company’s allowance for loan losses by loan type as well as each loan type as a percentage of total loans at December 31 for the years indicated.
| At December 31, | ||||||||||||||||||||||||||||||||||||||||
| % of | % of | % of | % of | % of | ||||||||||||||||||||||||||||||||||||
| Total | Total | Total | Total | Total | ||||||||||||||||||||||||||||||||||||
| 2017 | loans | 2016 | loans | 2015 | loans | 2014 | loans | 2013 | loans | |||||||||||||||||||||||||||||||
| (dollars in thousands) | ||||||||||||||||||||||||||||||||||||||||
| 1-to-4 family residential | $ | 1,058 | 11.98 | % | $ | 846 | 10.05 | % | $ | 605 | 14.25 | % | $ | 628 | 16.47 | % | $ | 826 | 10.10 | % | ||||||||||||||||||||
| Commercial real estate | 3,370 | 38.15 | % | 3,448 | 41.12 | % | 3,005 | 41.99 | % | 2,938 | 42.32 | % | 4,599 | 48.82 | % | |||||||||||||||||||||||||
| Multi-family residential | 791 | 8.95 | % | 628 | 7.48 | % | 393 | 6.60 | % | 279 | 7.65 | % | 74 | 5.70 | % | |||||||||||||||||||||||||
| Construction | 1,955 | 22.13 | % | 1,301 | 15.47 | % | 1,386 | 17.44 | % | 1,103 | 15.14 | % | 565 | 15.39 | % | |||||||||||||||||||||||||
| Home equity lines of credit | 549 | 6.21 | % | 623 | 7.42 | % | 573 | 6.80 | % | 985 | 6.90 | % | 680 | 9.20 | % | |||||||||||||||||||||||||
| Commercial and industrial | 807 | 9.13 | % | 1,248 | 14.84 | % | 922 | 11.90 | % | 726 | 10.55 | % | 245 | 8.42 | % | |||||||||||||||||||||||||
| Loans to individuals & overdrafts | 305 | 3.60 | % | 317 | 3.76 | % | 137 | 1.18 | % | 185 | 1.09 | % | 65 | 2.53 | % | |||||||||||||||||||||||||
| Deferred loan origination (fees) cost, net | (0.15 | )% | - | (0.14 | )% | - | (0.16 | )% | - | (0.12 | )% | - | (0.16 | )% | ||||||||||||||||||||||||||
| Total allocated | 8,835 | 100.00 | % | 8,411 | 100.00 | % | 7,021 | 100.00 | % | 6,844 | 100.00 | % | 7,054 | 100.00 | % | |||||||||||||||||||||||||
| Unallocated | - | - | - | - | - | |||||||||||||||||||||||||||||||||||
| Total | $ | 8,835 | $ | 8,411 | $ | 7,021 | $ | 6,844 | $ | 7,054 | ||||||||||||||||||||||||||||||
The allowance for loan losses as a percentage of gross loans outstanding decreased by 0.34% during 2017 to 0.90% of gross loans at December 31, 2017 primarily due to the accounting impact of the purchase of Premara which doesn’t allow for their ALLL to be carried over. The change in the allowance during 2017 resulted from net charge-offs of $1.0 million and a provision of $1.4 million. General reserves totaled $8.8 million or 0.90% of gross loans outstanding as of December 31, 2017, as compared to year-end 2016 when they totaled $8.4 million or 1.22% of loans outstanding. At December 31, 2017, specific reserves on impaired loans constituted $61,000 or 0.01% of gross loans outstanding compared to $117,000 or 0.02% of loans outstanding as of December 31, 2016. The loans that were acquired from Premara are included in the gross loan number used in the calculations above. The acquired loans are accounted for under ASC 310-20 and ASC 310-30 which results in initial credit marks for the inherent loss risk for those loans being established as part of the initial fair value mark and is not included in the Allowance for Loan Losses. Total acquired loans represent $273.0 million of the gross loan total at December 31, 2017 of which $23.3 million are purchased credit impaired loans.
| - 50 - |
The following table presents information regarding changes in the allowance for loan losses in detail for the years indicated:
| As of December 31, | ||||||||||||||||||||
| 2017 | 2016 | 2015 | 2014 | 2013 | ||||||||||||||||
| (dollars in thousands) | ||||||||||||||||||||
| Allowance for loan losses at beginning of year | $ | 8,411 | $ | 7,021 | $ | 6,844 | $ | 7,054 | $ | 7,897 | ||||||||||
| Provision (recovery) for loan losses | 1,367 | 1,516 | 890 | (194 | ) | (325 | ) | |||||||||||||
| 9,778 | 8,537 | 7,734 | 6,860 | 7,572 | ||||||||||||||||
| Loans charged off: | ||||||||||||||||||||
| Commercial and industrial | (73 | ) | (182 | ) | (141 | ) | (63 | ) | (135 | ) | ||||||||||
| Construction | (17 | ) | (2 | ) | (79 | ) | (4 | ) | (28 | ) | ||||||||||
| Commercial real estate | (914 | ) | (189 | ) | (663 | ) | (150 | ) | (384 | ) | ||||||||||
| Multi-family residential | (-) | (-) | (5 | ) | - | - | ||||||||||||||
| Home equity lines of credit | (179 | ) | (205 | ) | (115 | ) | (327 | ) | (316 | ) | ||||||||||
| 1-to-4 family residential | (22 | ) | (7 | ) | (70 | ) | (26 | ) | (325 | ) | ||||||||||
| Loans to individuals & overdrafts | (101 | ) | (90 | ) | (54 | ) | (98 | ) | (135 | ) | ||||||||||
| Total charge-offs | (1,306 | ) | (675 | ) | (1,127 | ) | (668 | ) | (1,323 | ) | ||||||||||
| Recoveries of loans previously charged off: | ||||||||||||||||||||
| Commercial and industrial | 211 | 22 | 48 | 32 | 137 | |||||||||||||||
| Construction | 29 | 22 | 29 | 63 | 25 | |||||||||||||||
| Multi-family residential | 2 | - | 106 | - | - | |||||||||||||||
| Commercial real estate | 16 | 151 | 84 | 364 | 96 | |||||||||||||||
| Home equity lines of credit | 25 | 35 | 21 | 78 | 81 | |||||||||||||||
| 1-to-4 family residential | 46 | 299 | 102 | 92 | 398 | |||||||||||||||
| Loans to individuals & overdrafts | 34 | 20 | 24 | 23 | 68 | |||||||||||||||
| Total recoveries | 363 | 549 | 414 | 652 | 805 | |||||||||||||||
| Net recoveries (charge-offs) | (943 | ) | (126 | ) | (713 | ) | (16 | ) | (518 | ) | ||||||||||
| Allowance for loan losses at end of year | $ | 8,835 | $ | 8,411 | $ | 7,021 | $ | 6,844 | $ | 7,054 | ||||||||||
| Ratios: | ||||||||||||||||||||
| Net charge-offs (recoveries) as a percent of average loans | 0.13 | % | 0.02 | % | 0.12 | % | 0.00 | % | 0.15 | % | ||||||||||
| Allowance for loan losses as a percent of loans at end of year | 0.90 | % | 1.24 | % | 1.14 | % | 1.24 | % | 2.04 | % | ||||||||||
While the Company believes that it uses the best information available to establish the allowance for loan losses, future adjustments to the allowance may be necessary and results of operations could be adversely affected if circumstances differ substantially from the assumptions used in making determinations regarding the allowance.
| - 51 - |
The table below presents information detailing the allowance for loan losses for originated and purchased credit impaired acquired loans:
Analysis of Allowance for Credit Losses
(dollars in thousands)
| Beginning | Charge | Ending | ||||||||||||||||||
| Balance | Offs | Recoveries | Provision | Balance | ||||||||||||||||
| Year ended December 31, 2017 | ||||||||||||||||||||
| Total loans | ||||||||||||||||||||
| Commercial and Industrial | $ | 1,248 | $ | 73 | $ | 211 | $ | (579 | ) | $ | 807 | |||||||||
| Construction | 1,301 | 17 | 29 | 642 | 1,955 | |||||||||||||||
| Commercial real estate | 3,448 | 914 | 16 | 820 | 3,370 | |||||||||||||||
| Multi-family residential | 628 | - | 2 | 161 | 791 | |||||||||||||||
| Home Equity Lines of credit | 623 | 179 | 25 | 80 | 549 | |||||||||||||||
| 1-to-4 family residential | 846 | 22 | 46 | 188 | 1,058 | |||||||||||||||
| Loans to individuals & overdrafts | 317 | 101 | 34 | 55 | 305 | |||||||||||||||
| Total | $ | 8,411 | $ | 1,306 | $ | 363 | $ | 1,367 | $ | 8,835 | ||||||||||
| PCI loans | ||||||||||||||||||||
| Commercial and Industrial | $ | 37 | $ | - | $ | - | $ | 28 | $ | 65 | ||||||||||
| Construction | - | - | - | - | - | |||||||||||||||
| Commercial real estate | - | - | - | 66 | 66 | |||||||||||||||
| Multi-family residential | - | - | - | - | - | |||||||||||||||
| Home Equity Lines of credit | 12 | - | - | (12 | ) | - | ||||||||||||||
| 1-to-4 family residential | - | - | - | - | - | |||||||||||||||
| Loans to individuals & overdrafts | - | - | - | - | - | |||||||||||||||
| Total | $ | 49 | $ | - | $ | - | $ | 82 | $ | 131 | ||||||||||
| Loans – excluding PCI | ||||||||||||||||||||
| Commercial and Industrial | $ | 1,211 | $ | 73 | $ | 211 | $ | (607 | ) | $ | 742 | |||||||||
| Construction | 1,301 | 17 | 29 | 642 | 1,955 | |||||||||||||||
| Commercial real estate | 3,448 | 914 | 16 | 754 | 3,304 | |||||||||||||||
| Multi-family residential | 628 | - | 2 | 161 | 791 | |||||||||||||||
| Home Equity Lines of credit | 611 | 179 | 25 | 92 | 549 | |||||||||||||||
| 1-to-4 family residential | 846 | 22 | 46 | 188 | 1,058 | |||||||||||||||
| Loans to individuals & overdrafts | 317 | 101 | 34 | 55 | 305 | |||||||||||||||
| Total | $ | 8,362 | $ | 1,306 | $ | 363 | $ | 1,285 | $ | 8,704 | ||||||||||
Determining the fair value of PCI loans at acquisition required the Company to estimate cash flows expected to result from those loans and to discount those cash flows at appropriate rates of interest. For such loans, the excess of cash flows expected to be collected at acquisition over the estimated fair value is recognized as interest income over the remaining lives of the loans and is called the accretable yield. The difference between contractually required payments at acquisition and the cash flows expected to be collected at acquisition reflects the impact of estimated credit losses and is called the nonaccretable difference. In accordance with GAAP, there was no carry-over of previously established allowance for credit losses from the acquired company.
Management believes the level of the allowance for loan losses as of December 31, 2017 is appropriate in light of the risk inherent within the Company’s loan portfolio.
Other Assets
At December 31, 2017, non-earning assets totaled $78.4 million, an increase of $61.5 million from $52.1 million at December 31, 2016. Non-earning assets at December 31, 2017 consisted of: cash and due from banks of $16.6 million, premises and equipment totaling $18.3 million, foreclosed real estate totaling $1.3 million, accrued interest receivable of $4.0 million, goodwill of $24.9 million and other assets totaling $13.3 million, including net deferred taxes of $4.5 million.
| - 52 - |
The Company has an investment in bank owned life insurance of $28.4 million, which increased $5.7 million from the Premara merger plus $575,000 due to earnings since December 31, 2016. The increase in BOLI in 2016 was from earnings. Since the income on this investment is included in non-interest income, the asset is not included in the Company’s calculation of earning assets.
Deposits
Total deposits at December 31, 2017 were $995.0 million and consisted of $227.1 million in non-interest-bearing demand deposits, $250.9 million in money market and NOW accounts, $69.5 million in savings accounts, and $447.6 million in time deposits. Total deposits increased by $315.4 million from $679.7 million as of December 31, 2016. Non-interest-bearing demand deposits increased by $63.5 million from $163.6 million as of December 31, 2016. MMDA and NOW accounts increased by $76.7 million from $174.2 million as of December 31, 2016. Savings accounts increased by $31.1 million from $38.4 million as of December 31, 2016. Time deposits increased by $144.2 million during 2017. The deposit growth of $315.4 million in 2017 was primarily due to the Carolina Premier acquisition which represented $226.3 million plus organic generation of $89.1 million and in 2016 the increase was due to organic deposit growth of $28.5 million.
The following table shows historical information regarding the average balances outstanding and average interest rates for each major category of deposits:
| For the Period Ended December 31, | ||||||||||||||||||||||||||||||||||||||||
| 2017 | 2016 | 2015 | 2014 | 2013 | ||||||||||||||||||||||||||||||||||||
| Average | Average | Average | Average | Average | Average | Average | Average | Average | Average | |||||||||||||||||||||||||||||||
| Amount | Rate | Amount | Rate | Amount | Rate | Amount | Rate | Amount | Rate | |||||||||||||||||||||||||||||||
| (dollars in thousands) | ||||||||||||||||||||||||||||||||||||||||
| Savings, NOW and money market deposits | $ | 220,249 | 0.25 | % | $ | 209,769 | 0.19 | % | $ | 205,792 | 0.19 | % | $ | 170,183 | 0.19 | % | $ | 147,800 | 0.23 | % | ||||||||||||||||||||
| Time deposits > $100,000 | 258,141 | 1.09 | % | 204,120 | 0.82 | % | 158,704 | 0.85 | % | 137,911 | 1.52 | % | 122,166 | 2.13 | % | |||||||||||||||||||||||||
| Other time deposits | 94,420 | 1.03 | % | 91,573 | 1.08 | % | 104,388 | 1.19 | % | 112,990 | 1.50 | % | 117,564 | 1.61 | % | |||||||||||||||||||||||||
| Total interest-bearing deposits | 572,810 | 0.76 | % | 505,462 | 0.60 | % | 468,884 | 0.64 | % | 421,084 | 0.98 | % | 387,530 | 1.25 | % | |||||||||||||||||||||||||
| Noninterest-bearing deposits | 173,608 | - | 160,302 | - | 138,330 | - | 102,870 | - | 82,996 | - | ||||||||||||||||||||||||||||||
| Total deposits | $ | 746,418 | 0.58 | % | $ | 665,764 | 0.46 | % | $ | 607,214 | 0.49 | % | $ | 523,954 | 0.79 | % | $ | 470,526 | 1.02 | % | ||||||||||||||||||||
Short-Term and Long-Term Debt
As of December 31, 2017, the Company had $28.3 million in short-term debt which consisted of FHLB advances, and $19.4 million in long-term debt, which included $12.4 million in junior subordinated debentures issued to New Century Statutory Trust I in connection with the Company’s 2004 issuance of trust preferred securities. The Company acquired $29.0 million in FHLB advances with the December 2017 acquisition of Carolina Premier Bank. However, we were still able to reduce oustanding short-term and long-term debt by $12.5 million compared to the prior year end as a result of increased deposits and the liquidation of investment securities.
Shareholders’ Equity
Total shareholders’ equity at December 31, 2017 was $136.1 million, an increase of $31.8 million from $104.3 million as of December 31, 2016. Changes in shareholders’ equity included $3.2 million in net income, $115,000 in stock based compensation, proceeds of $166,000 from stock option exercises, and other comprehensive income of $40,000 related to the increase in the unrealized gain in the Company’s available for sale investment security portfolio. In addition, the December 15, 2017 merger with Premara resulted in a $28.3 million increase in shareholders’ equity.
| - 53 - |
RESULTS OF OPERATIONS
FOR THE YEARS ENDED DECEMBER 31, 2017 AND 2016
Overview
During 2017, the Company had net income of $3.2 million compared to net income of $6.8 million for 2016. Both basic and diluted net income per share for the year ended December 31, 2017 were $0.27, compared with basic and diluted net income per share of $0.58 for 2016.
Embedded in the Company's net income numbers for the year ended December 31, 2017, are net after tax merger expenses of $1.4 million, related to the acquisition of Carolina Premier. In addition, due to the Tax Act that was signed into law on December 22, 2017, the Company was required to calculate a "tax re-measurement" for the associated rate change for its deferred taxes. This tax re-calculation resulted in an increase of approximately $2.5 million of income tax expense for the year, which directly impacted the Company's reported GAAP results.
Net Interest Income
Like most financial institutions, the primary component of earnings for the Company is net interest income. Net interest income is the difference between interest income, principally from loans and investment securities portfolios, and interest expense, principally on customer deposits and borrowings. Changes in net interest income result from changes in volume, spread and margin. For this purpose, volume refers to the average dollar level of interest-earning assets and interest-bearing liabilities, spread refers to the difference between the average yield on interest-earning assets and the average cost of interest-bearing liabilities, and margin refers to net interest income divided by the average interest-earning assets. Margin is influenced by the level and relative mix of interest-earning assets and interest-bearing liabilities, as well as by the levels of non-interest bearing liabilities and capital.
Net interest income increased by $3.5 million to $34.5 million for the year ended December 31, 2017. The Company’s total interest income was impacted by an increase in interest earning assets and a slow rising interest rate environment in 2017. Average total interest-earning assets were $835.6 million in 2017 compared with $744.0 million in 2016. The yield on those assets increased by 7 basis points from 4.70% in 2016 to 4.77% in 2017 primarily because of increasing investment yields of 31 basis points. Meanwhile, average interest-bearing liabilities increased by $59.9 million from $622.7 million for the year ended December 31, 2016 to $562.8 million for the year ended December 31, 2017. Cost of these funds increased by 16 basis points in 2017 to 0.82% from 0.66% in 2016 which was primarily due to an increase of 25 basis points on larger time deposits and 38 basis points on borrowings. In 2017, the Company’s net interest margin was 4.16% and net interest spread was 3.95%. In 2016, net interest margin was 4.20% and net interest spread was 4.04%.
Provision for Loan Losses
The allowance for loan losses is a reserve established through provisions for loan losses charged to income and represents management’s best estimate of probable loan losses that have been incurred within the existing portfolio of loans. The allowance, in the judgment of management, is necessary to reserve for estimated losses and risk inherent in the loan portfolio. The Company’s allowance for loan loss methodology is based on historical loss experience by type of credit and internal risk grade, specific homogeneous risk pools and specific loss allocations, with adjustments for current events and conditions. The Company’s process for determining the appropriate level of reserves is designed to account for changes in credit quality as they occur. The provision for loan losses reflects loan quality trends, including the levels of and trends related to past due loans and economic conditions at the local and national levels. It also considers the quality and risk characteristics of the Company’s loan origination and servicing policies and practices.
| - 54 - |
The Company recorded a $1.4 million provision for loan losses in 2017 compared to a provision of $1.5 million recorded in 2016. The decrease in provision was due to improving asset quality and was offset by loan growth. For more information on changes in the allowance for loan losses, refer to Note E of the notes to the consolidated financial statements in the section titled Allowance for Loan Losses.
Non-Interest Income
Non-interest income for the year ended December 31, 2017 was $3.1 million down $150,000 from $3.2 million from 2016. Contributing to the decrease were a decrease in deposit service charges of $67,000 due to lower overdraft fee income, a decrease in gain on sale of securities of $21,000 and a decrease in other non-interest income of $62,000 primarily due to debit cards and pin replacements.
Non-Interest Expenses
Non-interest expenses increased by $5.0 million or 22.6% to $27.3 million for the year ended December 31, 2017, from $22.3 million for the same period in 2016. The following are highlights of the significant changes in non-interest expenses from 2016 to 2017.
| · | Personnel expenses increased $1.8 million to $15.6 million primarily due to cost of living increases and the Bank’s branch expansion plus starting a mortgage department. |
| · | Occupancy and equipment expenses decreased $112,000 to $2.2 million primarily due to lease maturities and reductions in repairs and maintenance. |
| · | Information systems increased $187,000 to $2.3 million from $2.1 million in 2016 due largely to the increase in security related applications. |
| · | Professional fees increased to $1.2 million in 2017 from $977,000 in 2016, a 21.0% increase due to legal fees and consulting fees. |
| · | No merger /acquisition related expenses were recognized in 2016 compared to $2.2 million in 2017. |
| · | Other operating expense increased primarily due to increased franchise taxes, dues and subscriptions, and other sundry expenses by $447,000 or 14.0%. |
Provision for Income Taxes
The Company’s effective tax rate in 2017 was 64.2%, compared to 35.1% in 2016. Included in the effective tax rate for 2017 is the effect of the tax law legislation change enacted December 22, 2017. The tax law change required a re-measurement of the deferred taxes of the Company that resulted in a corresponding increase in income tax expense of $2.6 million. It is anticipated that the effective rate for 2018 will be approximately 23.4% to 23.6%. For further discussion pertaining to the Company’s tax position, refer to Note L of the consolidated financial statements.
| - 55 - |
RESULTS OF OPERATIONS
FOR THE YEARS ENDED DECEMBER 31, 2016 AND 2015
Overview
During 2016, the Company had net income of $6.8 million compared to net income of $6.6 million for 2015. Both basic and diluted net income per share for the year ended December 31, 2016 were $0.58, compared with basic and diluted net income per share of $0.56 for 2015.
Net Interest Income
Net interest income increased by $1.2 million to $31.0 million for the year ended December 31, 2016. The Company’s total interest income was impacted by an increase in interest earning assets and a slow rising interest rate environment in 2016. Average total interest-earning assets were $744.0 million in 2016 compared with $686.7 million in 2015. The yield on those assets decreased by 20 basis points from 4.90% in 2015 to 4.70% in 2016 primarily because of declining loan yields of 23 basis points. Meanwhile, average interest-bearing liabilities increased by $41.5 million from $521.3 million for the year ended December 31, 2015 to $562.8 million for the year ended December 31, 2016. Cost of these funds decreased by 2 basis points in 2016 to 0.66% from 0.68% in 2015 which was primarily due to lower average time deposits of 11 basis points. In 2016, the Company’s net interest margin was 4.20% and net interest spread was 4.04%. In 2015, net interest margin was 4.39% and net interest spread was 4.22%.
Provision for Loan Losses
The Company recorded a $1.5 million provision for loan losses in 2016 compared to a provision of $890,000 recorded in 2015 as a result of loan recoveries. The increase in provision was due to loan growth, offset by lower net charge offs. For more information on changes in the allowance for loan losses, refer to Note E of the notes to consolidated financial statements in the section titled Allowance for Loan Losses.
Non-Interest Income
Non-interest income for the year ended December 31, 2016 was $3.2 million, down from $3.3 million from 2015. Contributing to the decrease were a decrease in deposit service charges of $90,000 due to lower overdraft fee income, a decrease in gain on sale of securities of $310,000 and an increase in other non-interest income of $330,000 primarily due to debit cards and pin replacements.
Non-Interest Expenses
Non-interest expenses increased by $51,000 or 0.2% to $22.3 million for the year ended December 31, 2016, from $22.2 million for the same period in 2015. The following are highlights of the significant changes in non-interest expenses from 2015 to 2016.
| · | Personnel expenses increased $531,000 to $12.7 million primarily due to cost of living increases and the 2015 branch acquisitions. |
| · | Occupancy and equipment expenses increased $72,000 to $2.3 million primarily due to repairs and maintenance. |
| · | Information systems increased $128,000 to $2.1 million from $1.9 million in 2015 due largely to the increase in security related applications. |
| · | Professional fees decreased to $977,000 in 2016 from $1.2 million in 2015, a 19.8% decrease due to a reduction in legal fees and consulting fees. |
| · | No merger /acquisition related expenses were recognized in 2016 compared to $378,000 in 2015. |
| · | Other operating expense increased primarily due to increased advertising and marketing expenses and other sundry expenses by $162,000 or 5.3%. |
Provision for Income Taxes
The Company’s effective tax rate in 2016 was 35.1%, compared to 34.3% in 2015. For further discussion pertaining to the Company’s tax position, refer to Note L of the notes to consolidated financial statements.
| - 56 - |
NET INTEREST INCOME
The following table sets forth, for the periods indicated, information with regard to average balances of assets and liabilities, as well as the total dollar amounts of interest income from interest-earning assets and interest expense on interest-bearing liabilities, resultant yields or costs, net interest income, net interest spread, net interest margin and ratio of average interest-earning assets to average interest-bearing liabilities. Non-accrual loans have been included in determining average loans.
| For the Years Ended December 31, | ||||||||||||||||||||||||||||||||||||
| 2017 | 2016 | 2015 | ||||||||||||||||||||||||||||||||||
| (dollars in thousands) | ||||||||||||||||||||||||||||||||||||
| Average | Average | Average | Average | Average | Average | |||||||||||||||||||||||||||||||
| balance | Interest | rate | balance | Interest | rate | balance | Interest | rate | ||||||||||||||||||||||||||||
| Interest-earning assets: | ||||||||||||||||||||||||||||||||||||
| Loans, gross of allowance | $ | 732,289 | $ | 37,853 | 5.17 | % | $ | 631,791 | $ | 33,062 | 5.23 | % | $ | 578,759 | $ | 31,576 | 5.46 | % | ||||||||||||||||||
| Investment securities | 59,082 | 1,523 | 2.58 | % | 72,244 | 1,638 | 2.27 | % | 91,790 | 2,027 | 2.21 | % | ||||||||||||||||||||||||
| Other interest-earning assets | 44,204 | 480 | 1.09 | % | 39,989 | 257 | 0.64 | % | 16,114 | 71 | 0.44 | % | ||||||||||||||||||||||||
| Total interest-earning assets | 835,575 | 39,856 | 4.77 | % | 744,024 | 34,957 | 4.70 | % | 686,663 | 33,674 | 4.90 | % | ||||||||||||||||||||||||
| Other assets | 75,269 | 85,288 | 78,611 | |||||||||||||||||||||||||||||||||
| Total assets | $ | 910,844 | $ | 829,312 | $ | 765,274 | ||||||||||||||||||||||||||||||
| Interest-bearing liabilities: | ||||||||||||||||||||||||||||||||||||
| Deposits: | ||||||||||||||||||||||||||||||||||||
| Savings, NOW and money market | $ | 220,249 | 547 | 0.25 | % | $ | 209,769 | 390 | 0.19 | % | $ | 205,792 | 393 | 0.19 | % | |||||||||||||||||||||
| Time deposits over $100,000 | 258,141 | 2,811 | 1.09 | % | 204,120 | 1,678 | 0.82 | % | 158,704 | 1,356 | 0.85 | % | ||||||||||||||||||||||||
| Other time deposits | 94,420 | 968 | 1.03 | % | 91,573 | 986 | 1.08 | % | 104,388 | 1,242 | 1.19 | % | ||||||||||||||||||||||||
| Borrowings | 49,891 | 780 | 1.56 | % | 57,348 | 679 | 1.18 | % | 52,462 | 551 | 1.05 | % | ||||||||||||||||||||||||
| Total interest-bearing liabilities | 622,701 | 5,106 | 0.82 | % | 562,810 | 3,733 | 0.66 | % | 521,346 | 3,542 | 0.68 | % | ||||||||||||||||||||||||
| Non-interest-bearing deposits | 173,608 | 160,302 | 138,330 | |||||||||||||||||||||||||||||||||
| Other liabilities | 4,712 | 4,090 | 3,530 | |||||||||||||||||||||||||||||||||
| Shareholders' equity | 109,823 | 102,110 | 102,068 | |||||||||||||||||||||||||||||||||
| Total liabilities and shareholders' equity | $ | 910,844 | $ | 829,312 | $ | 765,274 | ||||||||||||||||||||||||||||||
| Net interest income/interest rate spread (taxable-equivalent basis) | $ | 34,750 | 3.95 | % | $ | 31,224 | 4.04 | % | $ | 30,132 | 4.22 | % | ||||||||||||||||||||||||
| Net interest margin (taxable-equivalent basis) | 4.16 | % | 4.20 | % | 4.39 | % | ||||||||||||||||||||||||||||||
| Ratio of interest-earning assets to interest-bearing liabilities | 134.19 | % | 132.20 | % | 131.71 | % | ||||||||||||||||||||||||||||||
| Reported net interest income | ||||||||||||||||||||||||||||||||||||
| Net interest income/net interest margin (taxable-equivalent basis) | $ | 34,750 | 4.00 | % | $ | 31,224 | 4.00 | % | $ | 30,132 | 4.36 | % | ||||||||||||||||||||||||
| Less: | ||||||||||||||||||||||||||||||||||||
| taxable-equivalent adjustment | 239 | 248 | 333 | |||||||||||||||||||||||||||||||||
| Net Interest Income | $ | 34,511 | $ | 30,976 | $ | 29,799 | ||||||||||||||||||||||||||||||
| - 57 - |
RATE/VOLUME ANALYSIS
The following table analyzes the dollar amount of changes in interest income and interest expense for major components of interest-earning assets and interest-bearing liabilities. The table distinguishes between (i) changes attributable to volume (changes in volume multiplied by the prior period’s rate), (ii) changes attributable to rate (changes in rate multiplied by the prior period’s volume), and (iii) net change (the sum of the previous columns). The change attributable to both rate and volume (changes in rate multiplied by changes in volume) has been allocated equally to both the changes attributable to volume and the changes attributable to rate.
| Year Ended | Year Ended | Year Ended | ||||||||||||||||||||||||||||||||||
| December 31, 2017 vs. 2016 | December 31, 2016 vs. 2015 | December 31, 2015 vs. 2014 | ||||||||||||||||||||||||||||||||||
| Increase (Decrease) Due to | Increase (Decrease) Due to | Increase (Decrease) Due to | ||||||||||||||||||||||||||||||||||
| Volume | Rate | Total | Volume | Rate | Total | Volume | Rate | Total | ||||||||||||||||||||||||||||
| (dollars in thousands) | ||||||||||||||||||||||||||||||||||||
| Interest income: | ||||||||||||||||||||||||||||||||||||
| Loans | $ | 5,227 | $ | (436 | ) | $ | 4,791 | $ | 2,834 | $ | (1,348 | ) | $ | 1,486 | $ | 8,641 | $ | (1,212 | ) | $ | 7,429 | |||||||||||||||
| Investment securities | (318 | ) | 208 | (110 | ) | (437 | ) | 43 | (394 | ) | 12 | (234 | ) | (222 | ) | |||||||||||||||||||||
| Other interest-earning assets | 36 | 187 | 223 | 129 | 57 | 186 | (141 | ) | 55 | (86 | ) | |||||||||||||||||||||||||
| Total interest income (taxable-equivalent basis) | 4,945 | (41 | ) | 4,904 | 2,562 | (1,248 | ) | 1,278 | 8,512 | (1,391 | ) | 7,121 | ||||||||||||||||||||||||
| Interest expense: | ||||||||||||||||||||||||||||||||||||
| Deposits: | ||||||||||||||||||||||||||||||||||||
| Savings, NOW and money market | 23 | 134 | 157 | 7 | (10 | ) | (3 | ) | 68 | (1 | ) | 67 | ||||||||||||||||||||||||
| Time deposits over $100,000 | 516 | 617 | 1,133 | 381 | (59 | ) | 322 | 247 | (987 | ) | (740 | ) | ||||||||||||||||||||||||
| Other time deposits | 30 | (48 | ) | (18 | ) | (145 | ) | (111 | ) | (256 | ) | (116 | ) | (339 | ) | (455 | ) | |||||||||||||||||||
| Borrowings | (102 | ) | 203 | 101 | 55 | 73 | 128 | 260 | (109 | ) | 151 | |||||||||||||||||||||||||
| Total interest expense | 466 | 906 | 1,373 | 298 | (107 | ) | 191 | 459 | (1,436 | ) | (977 | ) | ||||||||||||||||||||||||
| Net interest income | ||||||||||||||||||||||||||||||||||||
| Increase/(decrease) (taxable-equivalent basis) | $ | 4,478 | $ | (947 | ) | 3,531 | $ | 2,228 | $ | (1,141 | ) | 1,087 | $ | 8,053 | $ | (45 | ) | 8,098 | ||||||||||||||||||
| Less: | ||||||||||||||||||||||||||||||||||||
| Taxable-equivalent adjustment | (9 | ) | 248 | 333 | ||||||||||||||||||||||||||||||||
| Net interest income Increase/(decrease) | $ | 3,540 | $ | 1,335 | $ | 7,765 | ||||||||||||||||||||||||||||||
During 2017, we experienced an increase in the interest rate component of our net interest income as a result of higher asset yields which were offset by increases in funding rate costs. In 2017 and 2016, increasing loan volume was the major contributor to increased net interest income. In 2017 interest rates increased for both interest income and interest expense. The volume component had a positive variance which also resulted in an overall increase in net interest income.
| - 58 - |
LIQUIDITY
Market and public confidence in the Company’s financial strength and in the strength of financial institutions in general will largely determine the Company’s access to appropriate levels of liquidity. This confidence depends significantly on the Company’s ability to maintain sound asset quality and appropriate levels of capital resources. The term “liquidity” refers to the Company’s ability to generate adequate amounts of cash to meet current needs for funding loan originations, deposit withdrawals, maturities of borrowings and operating expenses. Management measures the Company’s liquidity position by giving consideration to both on and off-balance sheet sources of, and demands for, funds on a daily and weekly basis.
Liquid assets (consisting of cash and due from banks, interest-earning deposits with other banks, federal funds sold and investment securities classified as available for sale) comprised 10.6% and 13.9% of total assets at December 31, 2017 and 2016, respectively.
The Company has been a net seller of federal funds, maintaining liquidity sufficient to fund new loan demand. When the need arises, the Company has the ability to sell securities classified as available for sale, sell loan participations to other banks, or to borrow funds as necessary. The Company has established credit lines with other financial institutions to purchase up to $223.3 million in federal funds. Also, as a member of the Federal Home Loan Bank of Atlanta (“FHLB”), the Company may obtain advances of up to 10% of assets, subject to our available collateral. A floating lien of $117.4 million on qualifying loans is pledged to FHLB to secure such borrowings. In addition, the Company may borrow at the Federal Reserve discount window and has pledged $1.0 million in securities for that purpose. As another source of short-term borrowings, the Company also utilizes securities sold under agreements to repurchase. At December 31, 2017 and 2016, borrowings consisted of securities sold under agreements to repurchase of $0 and $12.0 million, respectively.
At December 31, 2017, the Company’s outstanding commitments to extend credit totaled $178.1 million and consisted of loan commitments and undisbursed lines of credit of $176.0 million, and letters of credit of $2.5 million. The Company believes that its combined aggregate liquidity position from all sources is sufficient to meet the funding requirements of loan demand and deposit maturities and withdrawals in the near term.
Total deposits were $995.0 million and $679.7 million at December 31, 2017 and 2016, respectively. Time deposits, which are the only deposit accounts that have stated maturity dates, are generally considered to be rate sensitive. Time deposits represented 45.0% and 44.7% of total deposits at December 31, 2017 and 2016, respectively. Time deposits of $250,000 or more represented 9.7% and 9.5%, respectively, of the total deposits at December 31, 2017 and 2016. Management believes most other time deposits are relationship-oriented. While competitive rates will need to be paid to retain these deposits at their maturities, there are other subjective factors that will determine their continued retention. Based upon prior experience, management anticipates that a substantial portion of outstanding certificates of deposit will renew upon maturity.
Management believes that current sources of funds provide adequate liquidity for the Bank’s current cash flow needs. The Company maintains minimal cash balances. Management believes that the current cash balances plus taxes receivable will provide adequate liquidity for the Company’s current cash flow needs. Subject to certain regulatory dividend restrictions and maintenance of required capital levels, dividends paid by the Bank to the Company may also be a source of liquidity for the Company.
| - 59 - |
CAPITAL
A significant measure of the strength of a financial institution is its capital base. Federal regulations have classified and defined capital into the following components: (1) Tier 1 capital, which includes common shareholders’ equity and qualifying preferred equity (including qualifying trust preferred securities), and (2) Tier 2 capital, which includes a portion of the allowance for loan losses, certain qualifying long-term debt and preferred stock which does not qualify as Tier 1 capital. Financial institutions and holding companies became subject to the Basel III capital requirements beginning on January 1, 2015. A new part of the capital ratios profile is the Common Equity Tier 1 risk-based ratio, which does not include limited life components such as trust preferred securities and the preferred stock we previously had outstanding under the Small Business Lending Fund Program. Minimum capital levels are regulated by risk-based capital adequacy guidelines that require a financial institution to maintain capital as a percent of its assets and certain off-balance sheet items adjusted for predefined credit risk factors (risk-adjusted assets). A financial institution is required to maintain, at a minimum, Tier 1 capital as a percentage of risk-adjusted assets of 6.0% and combined Tier 1 and Tier 2 capital as a percentage of risk-adjusted assets of 8.0%. In addition to the risk-based guidelines, federal regulations require that we maintain a minimum leverage ratio (Tier 1 capital as a percentage of tangible assets) of 4.0%. The new capital rules that took effect in 2015 require banks, subject to a four-year phase in period, to hold Common Equity Tier 1 capital in excess of minimum risk-based capital ratios by at least 2.5 percent to avoid limits on capital distributions and certain discretionary bonus payments to executive officers and similar employees. The Company’s equity to assets ratio was 11.4% at December 31, 2017. As the following table indicates, at December 31, 2017, the Company and its bank subsidiary exceeded minimum regulatory capital requirements.
| At December 31, 2017 | ||||||||
| Actual | Minimum | |||||||
| Ratio | Requirement | |||||||
| Select Bancorp, Inc. | ||||||||
| Total risk-based capital ratio | 11.86 | % | 8.00 | % | ||||
| Tier 1 risk-based capital ratio | 11.04 | % | 6.00 | % | ||||
| Common equity Tier 1 risk-based capital ratio | 9.94 | % | 4.50 | % | ||||
| Leverage ratio | 12.64 | % | 4.00 | % | ||||
| Select Bank & Trust | ||||||||
| Total risk-based capital ratio | 11.38 | % | 8.00 | % | ||||
| Tier 1 risk-based capital ratio | 10.56 | % | 6.00 | % | ||||
| Common equity Tier 1 risk-based capital ratio | 10.56 | % | 4.50 | % | ||||
| Leverage ratio | 12.08 | % | 4.00 | % | ||||
During 2004, the Company issued $12.4 million of junior subordinated debentures to a special purpose subsidiary, New Century Statutory Trust I, which in turn issued $12.0 million of trust preferred securities to investors. The proceeds provided additional capital for the expansion of the Bank. Under the current applicable regulatory guidelines, all of the trust preferred securities qualify as Tier 1 capital. Management expects that the Company and the Bank will remain “well-capitalized” for regulatory purposes, although there can be no assurance that additional capital will not be required in the future.
The Company’s amended Articles of Incorporation, subject to certain limitations, authorize the Company’s board of directors from time to time by resolution and without further shareholder action, to provide for the issuance of shares of preferred stock, in one or more series, and to fix the preferences, limitations and relative rights of such shares of preferred stock. The Company previously had a series of preferred stock outstanding that it assumed in connection with its 2014 acquisition of Legacy Select Bancorp (Greenville, NC); all such preferred shares, however, were redeemed at par during January 2016.
| - 60 - |
ASSET/LIABILITY MANAGEMENT
The Company’s results of operations depend substantially on its net interest income. Like most financial institutions, the Company’s interest income and cost of funds are affected by general economic conditions and by competition in the marketplace.
The purpose of asset/liability management is to provide stable net interest income growth by protecting the Company’s earnings from undue interest rate risk, which arises from volatile interest rates and changes in the balance sheet mix, and by managing the risk/return relationships between liquidity, interest rate risk, market risk, and capital adequacy. The Company maintains, and has complied with, a board approved asset/liability management policy that provides guidelines for controlling exposure to interest rate risk by utilizing the following ratios and trend analyses: liquidity, equity, volatile liability dependence, portfolio maturities, maturing assets and maturing liabilities. The Company’s policy is to control the exposure of its earnings to changing interest rates by generally endeavoring to maintain a position within a narrow range around an “earnings neutral position,” which is defined as the mix of assets and liabilities that generate a net interest margin that is least affected by interest rate changes.
When suitable lending opportunities are not sufficient to utilize available funds, the Company has generally invested such funds in securities, primarily securities issued by governmental agencies, mortgage-backed securities and municipal obligations. The securities portfolio contributes to the Company’s income and plays an important part in overall interest rate management. However, management of the securities portfolio alone cannot balance overall interest rate risk. The securities portfolio must be used in combination with other asset/liability techniques to actively manage the balance sheet. The primary objectives in the overall management of the securities portfolio are safety, liquidity, yield, asset/liability management (interest rate risk), and investing in securities that can be pledged for public deposits.
In reviewing the needs of the Company with regard to proper management of its asset/liability program, the Company’s management estimates its future needs, taking into consideration historical periods of high loan demand and low deposit balances, estimated loan and deposit increases (due to increased demand through marketing), and forecasted interest rate changes.
The analysis of an institution’s interest rate gap (the difference between the re-pricing of interest-earning assets and interest-bearing liabilities during a given period of time) is a standard tool for the measurement of exposure to interest rate risk. The following table sets forth the amounts of interest-earning assets and interest-bearing liabilities outstanding at December 31, 2017, of which are projected to re-price or mature in each of the future time periods shown. Except as stated below, the amounts of assets and liabilities shown which re-price or mature within a particular period were determined in accordance with the contractual terms of the assets or liabilities. Loans with adjustable rates are shown as being due at the end of the next upcoming adjustment period. Money market deposit accounts and negotiable order of withdrawal or other transaction accounts are assumed to be subject to immediate re-pricing and depositor availability and have been placed in the shortest period. In making the gap computations, none of the assumptions sometimes made regarding prepayment rates and deposit decay rates have been used for any interest-earning assets or interest-bearing liabilities. In addition, the table does not reflect scheduled principal payments that will be received throughout the lives of the loans. The interest rate sensitivity of the Company’s assets and liabilities illustrated in the following table would vary substantially if different assumptions were used or if actual experience differs from that indicated by such assumptions.
| - 61 - |
| Terms to Re-pricing at December 31, 2017 | ||||||||||||||||||||
| More Than | More Than | |||||||||||||||||||
| 1 Year | 1 Year to | 3 Years to | More Than | |||||||||||||||||
| or Less | 3 Years | 5 Years | 5 Years | Total | ||||||||||||||||
| (dollars in thousands) | ||||||||||||||||||||
| Interest-earning assets: | ||||||||||||||||||||
| Loans | $ | 377,862 | $ | 170,211 | $ | 309,693 | $ | 124,860 | $ | 982,626 | ||||||||||
| Securities, available for sale | 9,235 | 16,785 | 5,742 | 32,012 | 63,774 | |||||||||||||||
| Interest-earning deposits in other banks | 39,496 | - | - | - | 39,496 | |||||||||||||||
| Federal funds sold | 6,645 | - | - | - | 6,645 | |||||||||||||||
| Stock in the Federal Home Loan Bank of Atlanta | 2,490 | - | - | - | 2,490 | |||||||||||||||
| Other non-marketable securities | 1,019 | - | - | - | 1,019 | |||||||||||||||
| Total interest-earning assets | $ | 436,747 | $ | 186,996 | $ | 315,435 | $ | 156,872 | $ | 1,096,050 | ||||||||||
| Interest-bearing liabilities: | ||||||||||||||||||||
| Deposits: | ||||||||||||||||||||
| Savings, NOW and money market | $ | 320,367 | $ | - | $ | - | $ | - | $ | 320,367 | ||||||||||
| Time | 84,670 | 28,758 | 7,622 | - | 121,050 | |||||||||||||||
| Time over $100,000 | 231,382 | 78,113 | 17,066 | - | 326,561 | |||||||||||||||
| Short-term debt | 28,279 | - | - | - | 28,279 | |||||||||||||||
| Long-term debt | - | 7,000 | - | 12,372 | 19,372 | |||||||||||||||
| Total interest-bearing liabilities | $ | 664,698 | $ | 113,871 | $ | 24,688 | $ | 12,372 | $ | 815,629 | ||||||||||
| Interest sensitivity gap per period $ (227,951) | $ | 73,125 | $ | 290,747 | $ | 144,500 | $ | 280,421 | ||||||||||||
| Cumulative interest sensitivity gap $ (227,951) | $ | (154,826 | ) | $ | 135,921 | $ | 280,421 | $ | 280,421 | |||||||||||
| Cumulative gap as a percentage of total interest-earning assets | (51.19 | )% | (24.82 | )% | 14.47 | % | 25.58 | % | 25.58 | % | ||||||||||
| Cumulative interest-earning assets as a percentage of interest-bearing liabilities | 65.71 | % | 80.11 | % | 116.92 | % | 134.38 | % | 134.38 | % | ||||||||||
CRITICAL ACCOUNTING POLICIES
A critical accounting policy is one that is both very important to the portrayal of the Company's financial condition and results, and requires management to make difficult, subjective or complex judgments. What makes these judgments difficult, subjective and/or complex is the need to make estimates about the effects of matters that are inherently uncertain. The following is a summary of the Company’s most complex accounting policies: the allowance for loan losses, business combinations and deferred tax asset.
Asset Quality and the Allowance for Loan Losses
The financial statements are prepared on the accrual basis of accounting, including the recognition of interest income on the loan portfolio, unless a loan is placed on a non-accrual basis. Loans are placed on a non-accrual basis when there are serious doubts about the collectability of principal or interest. Amounts received on non-accrual loans generally are applied first to principal and then to interest only after all principal has been collected. Restructured loans are those for which concessions, including the reduction of interest rates below a rate otherwise available to that borrower or which the deferral of interest or principal have been granted due to the borrower’s weakened financial condition. Interest on restructured loans is accrued at the restructured rates when it is anticipated that no loss of original principal will occur. See the previous section titled “Past Due Loans and Nonperforming Assets” for a discussion on past due loans, non-performing assets and other impaired loans.
| - 62 - |
The allowance for loan losses is maintained at a level considered appropriate in light of the risk inherent within the Company’s loan portfolio, based on management’s assessment of various factors affecting the loan portfolio, including a review of problem loans, business conditions and loss experience and an overall evaluation of the quality of the underlying collateral. The allowance is increased by provisions charged to operations and reduced by loans charged off, net of recoveries. Additional information regarding the Company’s allowance for loan losses and loan loss experience is presented above in the discussion of the allowance for loan losses and in Note E to the accompanying notes to consolidated financial statements.
Business combinations and method of accounting for loans acquired
The Company accounts for acquisitions under FASB ASC Topic 805, Business Combinations, which requires the use of the acquisition method of accounting. All identifiable assets acquired, including loans, and liabilities assumed, are recorded at fair value along with the identifiable intangible assets. The recognized net goodwill is associated with the difference from the fair value and the acquired book value of the assets and liabilities of the transaction. No allowance for credit losses related to the acquired loans is recorded on the acquisition date because the fair value of the loans acquired incorporates assumptions regarding credit risk.
The acquired loans were segregated between those considered to be performing (“acquired performing”) and those with evidence of credit deterioration based on such factors as past due status, nonaccrual status and credit risk ratings. Acquired credit-impaired loans (PCI loans) are accounted for under the accounting guidance for loans and debt securities acquired with deteriorated credit quality, found in FASB ASC Topic 310-30, Receivables—Loans and Debt Securities Acquired with Deteriorated Credit Quality, formerly American Institute of Certified Public Accountants ("AICPA") Statement of Position (SOP) 03-3, Accounting for Certain Loans or Debt Securities Acquired in a Transfer, and initially measured at fair value, which includes estimated future credit losses expected to be incurred over the lives of the loans. Loans acquired in business combinations with evidence of credit deterioration are considered impaired. Loans acquired through business combinations that do not meet the specific criteria of FASB ASC Topic 310-30, but for which a discount is attributable, at least in part to credit quality, are also accounted for under this guidance. Certain acquired loans, such as acquired performing loans and lines of credit (consumer and commercial) are accounted for in accordance with FASB ASC Topic 310-20, where the discount is accreted through earnings based on estimated cash flows over the estimated lives of the loans.
For further discussion of the Company's loan accounting and acquisitions, see Note B—Summary of Significant Accounting Policies, Note C— Business Combinations, and Note E—Loans of the Notes to Consolidated Financial Statements.
Allowance for loan losses
The allowance for loan losses reflects the estimated losses that will result from the inability of the Bank's borrowers to make required loan payments. The allowance for loan losses is established for estimated credit losses through a provision for credit losses charged to earnings. Credit losses are charged against the allowance when management believes that the collectability of the principal is unlikely. Subsequent recoveries, if any, are credited to the allowance.
The Company’s allowance for loan loss methodology incorporates several quantitative and qualitative risk factors used to establish an appropriate allowance for credit losses at each reporting date. Quantitative factors include our historical loss experience, delinquency and charge-off trends, collateral values, changes in the level of nonperforming loans and other factors. Qualitative factors include the economic condition of our operating markets, composition of the loan portfolio and the state of certain industries. Specific changes in the risk factors are based on actual loss experience, as well as perceived risk of similar groups of loans classified by collateral type, purpose and term. A three-year loss history is incorporated into the allowance calculation model. Due to the credit concentration of our loan portfolio in real estate secured loans, the value of collateral is heavily dependent on real estate values in North Carolina.
| - 63 - |
Allowance for loan losses for acquired loans
Subsequent to the acquisition date, decreases in cash flows expected to be received on FASB ASC Topic 310-30 acquired loans from the Company's initial estimates are recognized as impairment through the provision for credit losses. Probable and significant increases in cash flows (in a loan pool where an allowance for acquired credit losses was previously recorded) reduces the remaining allowance for acquired credit losses before recalculating the amount of accretable yield percentage for the loan pool in accordance with ASC 310-30.
Acquired loans that are not subject to FASB ASC Topic 310-30 are accounted for in accordance with FASB ASC Topic 310-20, where the discount is accreted through earnings based on contractual cash flows over the estimated life of the loan. The allowance for these loans will be determined in a similar manner to the non-acquired credit losses.
Deferred Tax Asset
The Company’s net deferred tax asset was $4.3 million at December 31, 2017. In evaluating whether we will realize the full benefit of our net deferred tax asset, we consider both positive and negative evidence, including, among other things, recent earnings trends, projected earnings, and asset quality. As of December 31, 2017, management concluded that the Company’s net deferred tax assets were fully realizable. The Company will continue to monitor deferred tax assets closely to evaluate whether we will be able to realize the full benefit of our net deferred tax asset or whether there is any need for a valuation allowance. Significant negative trends in credit quality, losses from operations, tax law changes or other factors could impact the realization of the deferred tax asset in the future.
OFF-BALANCE SHEET ARRANGEMENTS
Information about the Company’s off-balance sheet risk exposure is presented in Note N to the accompanying financial statements. During 2004, the Company formed an unconsolidated subsidiary trust to which the Company issued $12.4 million of junior subordinated debentures (see Note K to the consolidated financial statements). Otherwise, as part of its ongoing business, the Company has not participated in, nor does it anticipate participating in, transactions that generate relationships with unconsolidated entities or financial partnerships, such as entities often referred to as special purpose entities, which generally are established for the purpose of facilitating off-balance sheet arrangements or other contractually narrow or limited purposes.
Recent Accounting Pronouncements
See Note B to the Company’s audited financial statements for a full description of recent accounting pronouncements, including the respective expected dates of adoption and anticipated effects on results of operations and financial condition.
IMPACT OF INFLATION AND CHANGING PRICES
A commercial bank has an asset and liability make-up that is distinctly different from that of a company with substantial investments in plant and inventory because the major portions of a commercial bank’s assets are monetary in nature. As a result, a bank’s performance may be significantly influenced by changes in interest rates. Although the banking industry is more affected by changes in interest rates than by inflation in the prices of goods and services, inflation is a factor that may influence interest rates. However, the frequency and magnitude of interest rate fluctuations do not necessarily coincide with changes in the general inflation rate. Inflation does affect operating expenses in that personnel expenses and the cost of supplies and outside services tend to increase more during periods of high inflation.
| - 64 - |
CONTRACTUAL OBLIGATIONS AND COMMITMENTS
In the normal course of business there are various outstanding contractual obligations of the Company that will require future cash outflows. In addition, there are commitments and contingent liabilities, such as commitments to extend credit that may or may not require future cash outflows. The following table reflects contractual obligations of the Company outstanding as of December 31, 2017.
| Payments Due by Period | ||||||||||||||||||||
| On Demand | ||||||||||||||||||||
| Or Within | After | |||||||||||||||||||
| Contractual Obligations | Total | 1 Year | 1-3 Years | 4-5 Years | 5 Years | |||||||||||||||
| (dollars in thousands) | ||||||||||||||||||||
| Short-term debt | $ | 28,279 | $ | 28,279 | $ | - | $ | - | $ | - | ||||||||||
| Long-term debt | 19,372 | - | 7,000 | - | 12,372 | |||||||||||||||
| Lease obligations | 4,780 | 1,203 | 1,940 | 1,307 | 330 | |||||||||||||||
| Deposits | 995,044 | 863,485 | 106,871 | 24,688 | - | |||||||||||||||
| Total contractual cash obligations | $ | 1,047,475 | $ | 892,967 | $ | 115,811 | $ | 25,995 | $ | 12,702 | ||||||||||
The following table reflects other commitments outstanding as of December 31, 2017.
| Amount of Commitment Expiration Per Period | ||||||||||||||||||||
| (dollars in thousands) | ||||||||||||||||||||
| Total | ||||||||||||||||||||
| Amounts | Less than | After | ||||||||||||||||||
| Other Commitments | Committed | 1 Year | 1-3 Years | 4-5 Years | 5 Years | |||||||||||||||
| Undisbursed home equity credit lines | $ | 36,258 | $ | 1,376 | $ | 2,192 | $ | 8,788 | $ | 23,902 | ||||||||||
| Other commitments and credit lines | 50,064 | 36,374 | 5,218 | 3,932 | 4,540 | |||||||||||||||
| Un-disbursed portion of constructions loans | 89,225 | 61,037 | 12,854 | 12,062 | 3,272 | |||||||||||||||
| Letters of credit | 2,523 | 2,359 | 89 | - | 75 | |||||||||||||||
| Total loan commitments | $ | 178,070 | $ | 101,146 | $ | 20,353 | $ | 24,782 | $ | 31,789 | ||||||||||
In addition, the Company has legally binding delayed equity commitments to private investment funds. These commitments are not currently expected to be called, and therefore, are not reflected in the financial statements. The amount of these commitments at December 31, 2017 and 2016 was $525,000 and $200,000, respectively.
FORWARD-LOOKING INFORMATION
Statements contained in this annual report, which are not historical facts, are forward-looking statements, as that term is defined in the Private Securities Litigation Reform Act of 1995. Such forward-looking statements are subject to risks and uncertainties that could cause actual results to differ materially from those results currently anticipated. Such forward-looking statements may be identified by the use of such words as “believe,” “expect,” “anticipate,” “should,” “might,” “planned,” “estimated,” and “potential.” Factors that could cause results and outcomes to vary include, but are not limited to: fluctuations in general economic conditions; changes in interest rates, deposit flows, loan demand, real estate values, and competition; changes in accounting principles, policies, or guidelines; changes in legislation or regulation; and other economic, competitive, governmental, regulatory, and technological factors affecting the Company's operations, pricing, products and services. The Company does not undertake a duty to update any forward-looking statements in this report.
| - 65 - |
ITEM 7A – Quantitative and qualitative disclosure about market risk
The Company intends to reach its strategic financial objectives through the effective management of market risk. Like many financial institutions, the Company’s most significant market risk exposure is interest rate risk. The Company's primary goal in managing interest rate risk is to minimize the effect that changes in market interest rates have on earnings and capital. This goal is accomplished through the active management of the balance sheet. The goal of these activities is to structure the maturity and repricing of assets and liabilities to produce stable net interest income despite changing interest rates. The Company's overall interest rate risk position is governed by policies approved by the Board of Directors and guidelines established and monitored by the Bank’s Asset/Liability Committee (“ALCO”).
To measure, monitor, and report on interest rate risk, the Company begins with two models: (1) net interest income ("NII") at risk, which measures the impact on NII over the next twelve and twenty-four months to immediate changes in interest rates and (2) net economic value of equity ("EVE"), which measures the impact on the present value of net assets to immediate changes in interest rates. NII at risk is designed to measure the potential short-term impact of changes in interest rates on NII. EVE is a long-term measure of interest rate risk to the Company's balance sheet, or equity. Gap analysis, which is the difference between the amount of balance sheet assets and liabilities repricing within a specified time period, is used as a secondary measure of the Company's interest rate risk position. All of these models are subject to ALCO guidelines and are monitored regularly.
In calculating NII at risk, the Company begins with a base amount of NII that is projected over the next twelve and twenty-four months, assuming that the balance sheet is static and the yield curve remains unchanged over the period. The current yield curve is then “shocked,” or moved immediately, ±1.0 percent, ±2.0 percent, ±3.0 percent and ±4.0 percent in a parallel fashion, or at all points along the yield curve. New twelve-month and twenty four-month NII projections are then developed using the same balance sheet but with the new yield curves and these results are compared to the base scenario. The Company also models other scenarios to evaluate potential NII at risk such as a gradual ramp in interest rates, a flattening yield curve, a steepening yield curve, and others that management deems appropriate.
EVE at risk is based on the change in the present value of all assets and liabilities under different interest rate scenarios. The present value of existing cash flows with the current yield curve serves as the base case. The Company then applies an immediate parallel shock to that yield curve of ±1.0 percent, ±2.0 percent, ±3.0 percent and ±4.0 percent and recalculates the cash flows and related present values.
Key assumptions used in the models described above include the timing of cash flows, the maturity and repricing of assets and liabilities, changes in market conditions, and interest-rate sensitivities of the Company's non-maturity deposits with respect to interest rates paid and the level of balances. These assumptions are inherently uncertain and, as a result, the models cannot precisely calculate future NII or predict the impact of changes in interest rates on NII and EVE. Actual results could differ from simulated results due to the timing, magnitude and frequency of changes in interest rates and market conditions, changes in spreads and management strategies, among other factors. Projections of NII are assessed as part of the Company's forecasting process.
| - 66 - |
NII and EVE Analysis. The following table presents the estimated exposure to NII for the next twelve months due to immediate changes in interest rates and the estimated exposure to EVE due to immediate changes in interest rates. All information is presented as of September 30, 2017.
| September 30, 2017 | ||||||||
| (Dollars in thousands) | Estimated Effect on NII | Estimated Effect on EVE | ||||||
| Immediate change in interest rates: | ||||||||
| + 4.0% | 12.5 | % | 1.9 | % | ||||
| + 3.0% | 10.0 | 2.1 | ||||||
| + 2.0% | 6.9 | 2.3 | ||||||
| + 1.0% | 3.3 | 1.4 | ||||||
| No change | - | - | ||||||
| - 1.0% | (4.5 | ) | (3.7 | ) | ||||
While the measures presented in the table above are not a prediction of future NII or EVE valuations, they do suggest that if all other variables remained constant, immediate increases in interest rates at all points on the yield curve may produce higher NII in the short term. Other important factors that impact the levels of NII are balance sheet size and mix, interest rate spreads, the slope of the yield curve, the speed of interest rates changes, and management actions taken in response to the preceding conditions.
| - 67 - |
Item 8 - Financial Statements AND SUPPLEMEnTARY DATA
Selected Quarterly Financial Data (Unaudited)
(dollars in thousands, except per share data)
| 2017 | ||||||||||||||||
| Quarterly Periods Ended | ||||||||||||||||
| December 31 | September 30 | June 30 | March 31 | |||||||||||||
| Selected Results of Operations | ||||||||||||||||
| Total interest income | $ | 10,981 | $ | 10,042 | $ | 9,469 | $ | 9,125 | ||||||||
| Total interest expense | 1,505 | 1,357 | 1,197 | 1,047 | ||||||||||||
| Net interest income | 9,476 | 8,685 | 8,272 | 8,078 | ||||||||||||
| Provision for (recovery of) loan losses | 276 | 202 | 1,083 | (194 | ) | |||||||||||
| Net interest income after provision | 9,200 | 8,483 | 7,189 | 8,272 | ||||||||||||
| Noninterest income | 786 | 778 | 778 | 730 | ||||||||||||
| Merger/acquisition related expenses | 1,888 | 278 | — | — | ||||||||||||
| Noninterest expense | 7,207 | 6,161 | 5,980 | 5,805 | ||||||||||||
| Income before income taxes | 891 | 2,822 | 1,987 | 3,197 | ||||||||||||
| Provision for income taxes (benefit) | 2,936 | 1,043 | 651 | 1,082 | ||||||||||||
| Net income (loss) | (2,045 | ) | 1,779 | 1,336 | 2,115 | |||||||||||
| Dividends on Preferred Stock | — | — | — | — | ||||||||||||
| Net income available to common | ||||||||||||||||
| shareholders | $ | (2,045 | ) | $ | 1,779 | $ | 1,336 | $ | 2,115 | |||||||
| Common Share Data | ||||||||||||||||
| Basic earnings per share | $ | 0.17 | $ | 0.15 | $ | 0.11 | $ | 0.18 | ||||||||
| Diluted earnings per share | $ | 0.17 | $ | 0.15 | $ | 0.11 | $ | 0.18 | ||||||||
| Cash dividends declared per share | $ | — | $ | — | $ | — | $ | — | ||||||||
| Weighted Average Common Shares | ||||||||||||||||
| Outstanding | ||||||||||||||||
| Basic | 12,071,392 | 11,662,580 | 11,662,117 | 11,652,612 | ||||||||||||
| Diluted | 12,071,392 | 11,717,533 | 11,727,110 | 11,714,336 | ||||||||||||
| Market Data | ||||||||||||||||
| High Sales Price | 12.64 | 12.70 | 12.25 | 11.22 | ||||||||||||
| Low Sales Price | 11.55 | 11.25 | 10.91 | 9.71 | ||||||||||||
| Period-end Closing | 12.64 | 11.71 | 12.22 | 10.90 | ||||||||||||
| Average Daily Trading Volume | 6,273 | 11,971 | 10,240 | 6,990 | ||||||||||||
- 68 -
(dollars in thousands, except per share data)
| 2016 | ||||||||||||||||
| Quarterly Periods Ended | ||||||||||||||||
| December 31 | September 30 | June 30 | March 31 | |||||||||||||
| Selected Results of Operations | ||||||||||||||||
| Total interest income | $ | 8,877 | $ | 8,755 | $ | 8,645 | $ | 8,432 | ||||||||
| Total interest expense | 985 | 909 | 912 | 927 | ||||||||||||
| Net interest income | 7,892 | 7,846 | 7,733 | 7,505 | ||||||||||||
| Provision for loan losses | 669 | 337 | 158 | 352 | ||||||||||||
| Net interest income after provision | 7,223 | 7,509 | 7,575 | 7,153 | ||||||||||||
| Noninterest income | 740 | 785 | 831 | 866 | ||||||||||||
| Merger/acquisition related expenses | — | — | — | — | ||||||||||||
| Noninterest expense | 5,511 | 5,631 | 5,519 | 5,620 | ||||||||||||
| Income before income taxes | 2,452 | 2,663 | 2,887 | 2,399 | ||||||||||||
| Provision for income taxes | 847 | 924 | 980 | 896 | ||||||||||||
| Net income | 1,605 | 1,739 | 1,907 | 1,503 | ||||||||||||
| Dividends on Preferred Stock | — | — | — | 4 | ||||||||||||
| Net income available to common | ||||||||||||||||
| shareholders | $ | 1,605 | $ | 1,739 | $ | 1,907 | $ | 1,499 | ||||||||
| Common Share Data | ||||||||||||||||
| Basic earnings per share | $ | 0.14 | $ | 0.15 | $ | 0.16 | $ | 0.13 | ||||||||
| Diluted earnings per share | $ | 0.14 | $ | 0.15 | $ | 0.16 | $ | 0.13 | ||||||||
| Cash dividends declared per share | $ | — | $ | — | $ | — | $ | — | ||||||||
| Weighted Average Common Shares | ||||||||||||||||
| Outstanding | ||||||||||||||||
| Basic | 11,636,647 | 11,627,270 | 11,594,995 | 11,583,440 | ||||||||||||
| Diluted | 11,677,958 | 11,666,280 | 11,642,726 | 11,626,609 | ||||||||||||
| Market Data | ||||||||||||||||
| High Sales Price | 10.48 | 8.72 | 8.25 | 8.18 | ||||||||||||
| Low Sales Price | 8.02 | 7.89 | 8.00 | 7.70 | ||||||||||||
| Period-end Closing | 9.85 | 8.00 | 8.08 | 8.00 | ||||||||||||
| Average Daily Trading Volume | 23,306 | 12,122 | 7,534 | 9,833 | ||||||||||||
- 69 -

Report of Independent Registered Public Accounting Firm
To the Shareholders and the Board of Directors
Select Bancorp, Inc.
Dunn, North Carolina
Opinion on Internal Control Over Financial Reporting
We have audited Select Bancorp, Inc. (the “Company”)’s internal control over financial reporting as of December 31, 2017, based on criteria established in Internal Control—Integrated Framework (2013) issued by the Committee of Sponsoring Organizations of the Treadway Commission. In our opinion, the Company maintained, in all material respects, effective internal control over financial reporting as of December 31, 2017, based on criteria established in Internal Control—Integrated Framework (2013) issued by the Committee of Sponsoring Organizations of the Treadway Commission.
We also have audited, in accordance with the standards of the Public Company Accounting Oversight Board (United States) (“PCAOB”), the consolidated financial statements of Select Bancorp, Inc. for each of the three years in the period ended December 31, 2017, and our report dated March 16, 2018, expressed an unqualified opinion on those consolidated financial statements.
Basis for Opinion
The Company's management is responsible for maintaining effective internal control over financial reporting, and for its assessment of the effectiveness of internal control over financial reporting, included in the accompanying Management’s Annual Report on Internal Control Over Financial Reporting. Our responsibility is to express an opinion on the Company's internal control over financial reporting based on our audit. We are a public accounting firm registered with the PCAOB and are required to be independent with respect to the Company in accordance with the U.S. federal securities laws and the applicable rules and regulations of the Securities and Exchange Commission and the PCAOB.
We conducted our audit in accordance with the standards of the PCAOB. Those standards require that we plan and perform the audit to obtain reasonable assurance about whether effective internal control over financial reporting was maintained in all material respects. Our audit included obtaining an understanding of internal control over financial reporting, assessing the risk that a material weakness exists, testing and evaluating the design and operating effectiveness of internal control based on the assessed risk, and performing such other procedures as we considered necessary in the circumstances. We believe that our audit provides a reasonable basis for our opinion.
As described in Management’s Annual Report on Internal Control Over Financial Reporting, the scope of management’s assessment of internal control over financial reporting as of December 31, 2017 has excluded Premara Financial, Inc. acquired on December 15, 2017. We have also excluded Premara Financial, Inc. from the scope of our audit of internal control over financial reporting. Premara Financial, Inc. represented 1 percent of consolidated revenues (total interest income and noninterest income) for the year ended December 31, 2017, and 23 percent of consolidated total assets as of December 31, 2017.
Definition and Limitations of Internal Control Over Financial Reporting
A company's internal control over financial reporting is a process designed to provide reasonable assurance regarding the reliability of financial reporting and the preparation of financial statements for external purposes in accordance with generally accepted accounting principles. A company's internal control over financial reporting includes those policies and procedures that (1) pertain to the maintenance of records that, in reasonable detail, accurately and fairly reflect the transactions and dispositions of the assets of the company; (2) provide reasonable assurance that transactions are recorded as necessary to permit preparation of financial statements in accordance with generally accepted accounting principles, and that receipts and expenditures of the company are being made only in accordance with authorizations of management and directors of the company; and (3) provide reasonable assurance regarding prevention or timely detection of unauthorized acquisition, use, or disposition of the company's assets that could have a material effect on the financial statements.
Because of its inherent limitations, internal control over financial reporting may not prevent or detect misstatements. Also, projections of any evaluation of effectiveness to future periods are subject to the risk that controls may become inadequate because of changes in conditions, or that the degree of compliance with the policies or procedures may deteriorate.
| /s/ Dixon Hughes Goodman LLP |
Raleigh, North Carolina
March 16, 2018
- 70 -
Report of Independent Registered Public Accounting Firm
To the Shareholders and the Board of Directors
Select Bancorp, Inc.
Dunn, North Carolina
Opinion on the Consolidated Financial Statements
We have audited the accompanying consolidated balance sheets of Select Bancorp, Inc. (the "Company") as of December 31, 2017 and 2016, the related consolidated statements of operations, comprehensive income, changes in shareholders’ equity and cash flows, for each of the three years in the period ended December 31, 2017, and the related notes (collectively referred to as the "financial statements"). In our opinion, the financial statements present fairly, in all material respects, the financial position of the Company as of December 31, 2017 and 2016, and the results of their operations and their cash flows for each of the three years in the period ended December 31, 2017, in conformity with U.S. generally accepted accounting principles.
We also have audited, in accordance with the standards of the Public Company Accounting Oversight Board (United States) ("PCAOB"), the Company's internal control over financial reporting as of December 31, 2017, based on criteria established in Internal Control - Integrated Framework (2013) issued by the Committee of Sponsoring Organizations of the Treadway Commission and our report dated March 16, 2018 expressed an unqualified opinion thereon.
Basis for Opinion
These consolidated financial statements are the responsibility of the Company's management. Our responsibility is to express an opinion on the Company's financial statements based on our audits. We are a public accounting firm registered with the Public Company Accounting Oversight Board (United States) ("PCAOB") and are required to be independent with respect to the Company in accordance with the U.S. federal securities laws and the applicable rules and regulations of the Securities and Exchange Commission and the PCAOB.
We conducted our audits in accordance with the standards of the PCAOB. Those standards require that we plan and perform the audit to obtain reasonable assurance about whether the financial statements are free of material misstatement, whether due to error or fraud.
Our audits included performing procedures to assess the risks of material misstatement of the financial statements, whether due to error or fraud, and performing procedures that respond to those risks. Such procedures included examining, on a test basis, evidence regarding the amounts and disclosures in the financial statements. Our audits also included evaluating the accounting principles used and significant estimates made by management, as well as evaluating the overall presentation of the financial statements. We believe that our audits provide a reasonable basis for our opinion.
| /s/ Dixon Hughes Goodman LLP |
We have served as the Company’s auditor since 2000.
Raleigh, North Carolina
March 16, 2018
- 71 -
| SELECT BANCORP, INC. |
| CONSOLIDATED BALANCE SHEETS |
| December 31, 2017 and 2016 |
| 2017 | 2016 | |||||||
| (In thousands, except share | ||||||||
| and per share data) | ||||||||
| ASSETS | ||||||||
| Cash and due from banks | $ | 16,554 | $ | 14,372 | ||||
| Interest-earning deposits in other banks | 37,996 | 40,342 | ||||||
| Certificates of deposit | 1,500 | 1,000 | ||||||
| Federal funds sold | 6,645 | - | ||||||
| Investment securities available for sale, at fair value | 63,774 | 62,257 | ||||||
| Loans held for sale | 98 | - | ||||||
| Loans | 982,626 | 677,195 | ||||||
| Allowance for loan losses | (8,835 | ) | (8,411 | ) | ||||
| NET LOANS | 973,791 | 668,784 | ||||||
| Accrued interest receivable | 3,997 | 2,768 | ||||||
| Stock in Federal Home Loan Bank of Atlanta (“FHLB”), at cost | 2,490 | 2,251 | ||||||
| Other non-marketable securities | 1,019 | 703 | ||||||
| Foreclosed real estate | 1,258 | 599 | ||||||
| Premises and equipment, net | 18,268 | 17,931 | ||||||
| Bank owned life insurance | 28,431 | 22,183 | ||||||
| Goodwill | 24,904 | 6,931 | ||||||
| Core deposit intangible (“CDI”) | 3,101 | 810 | ||||||
| Assets held for sale | 846 | 846 | ||||||
| Other assets | 9,463 | 4,863 | ||||||
| TOTAL ASSETS | $ | 1,194,135 | $ | 846,640 | ||||
| LIABILITIES AND SHAREHOLDERS’ EQUITY | ||||||||
| Deposits: | ||||||||
| Demand | $ | 227,066 | $ | 163,569 | ||||
| Savings | 69,503 | 38,394 | ||||||
| Money market and NOW | 250,864 | 174,205 | ||||||
| Time | 447,611 | 303,493 | ||||||
| TOTAL DEPOSITS | 995,044 | 679,661 | ||||||
| Short-term debt | 28,279 | 37,090 | ||||||
| Long-term debt | 19,372 | 23,039 | ||||||
| Accrued interest payable | 427 | 221 | ||||||
| Accrued expenses and other liabilities | 14,898 | 2,356 | ||||||
| TOTAL LIABILITIES | 1,058,020 | 742,367 | ||||||
| Shareholders’ Equity | ||||||||
| Preferred stock, no par value, 5,000,000 shares authorized; no preferred shares were issued and outstanding | - | - | ||||||
| Common stock, $1 par value, 25,000,000 shares authorized; 14,009,137 and 11,645,413 shares issued and outstanding at December 31, 2017 and 2016, respectively | 14,009 | 11,645 | ||||||
| Additional paid-in capital | 95,850 | 69,597 | ||||||
| Retained earnings | 25,858 | 22,673 | ||||||
| Common stock issued to deferred compensation trust, at cost, 291,964 and 280,432 shares outstanding at December 31, 2017 and 2016, respectively | (2,518 | ) | (2,340 | ) | ||||
| Directors’ Deferred Compensation Plan Rabbi Trust | 2,518 | 2,340 | ||||||
| Accumulated other comprehensive income | 398 | 358 | ||||||
| TOTAL SHAREHOLDERS’ EQUITY | 136,115 | 104,273 | ||||||
| TOTAL LIABILITIES AND SHAREHOLDERS’ EQUITY | $ | 1,194,135 | $ | 846,640 | ||||
See accompanying notes.
- 72 -
| SELECT BANCORP, INC. |
| CONSOLIDATED STATEMENTS OF OPERATIONS |
| Years Ended December 31, 2017, 2016 and 2015 |
| 2017 | 2016 | 2015 | ||||||||||
| (In thousands, except share and per share data) | ||||||||||||
| INTEREST INCOME | ||||||||||||
| Loans | $ | 37,849 | $ | 33,058 | $ | 31,576 | ||||||
| Federal funds sold and interest-earning deposits in other banks | 480 | 257 | 71 | |||||||||
| Investments | 1,288 | 1,394 | 1,694 | |||||||||
| TOTAL INTEREST INCOME | 39,617 | 34,709 | 33,341 | |||||||||
| INTEREST EXPENSE | ||||||||||||
| Money market, NOW and savings deposits | 547 | 390 | 393 | |||||||||
| Time deposits | 3,779 | 2,664 | 2,598 | |||||||||
| Short-term debt | 357 | 127 | 65 | |||||||||
| Long-term debt | 423 | 552 | 486 | |||||||||
| TOTAL INTEREST EXPENSE | 5,106 | 3,733 | 3,542 | |||||||||
| NET INTEREST INCOME | 34,511 | 30,976 | 29,799 | |||||||||
| PROVISION FOR LOAN LOSSES | 1,367 | 1,516 | 890 | |||||||||
| NET INTEREST INCOME AFTER PROVISION FOR LOAN LOSSES | 33,144 | 29,460 | 28,909 | |||||||||
| NON-INTEREST INCOME | ||||||||||||
| Gain on the sale of securities | 1 | 22 | 332 | |||||||||
| Service charges on deposit accounts | 899 | 966 | 1,056 | |||||||||
| Other fees and income | 2,172 | 2,234 | 1,904 | |||||||||
| TOTAL NON-INTEREST INCOME | 3,072 | 3,222 | 3,292 | |||||||||
| NON-INTEREST EXPENSE | ||||||||||||
| Personnel | 14,552 | 12,711 | 12,180 | |||||||||
| Occupancy and equipment | 2,192 | 2,304 | 2,232 | |||||||||
| Deposit insurance | 357 | 393 | 498 | |||||||||
| Professional fees | 1,181 | 977 | 1,218 | |||||||||
| Core deposit intangible amortization | 409 | 431 | 544 | |||||||||
| Merger/acquisition related expenses | 2,166 | - | 378 | |||||||||
| Information systems | 2,257 | 2,070 | 1,942 | |||||||||
| Foreclosure-related expenses | 562 | 199 | 205 | |||||||||
| Other | 3,643 | 3,196 | 3,033 | |||||||||
| TOTAL NON-INTEREST EXPENSE | 27,319 | 22,281 | 22,230 | |||||||||
| INCOME BEFORE INCOME TAX | 8,897 | 10,401 | 9,971 | |||||||||
| INCOME TAX | 5,712 | 3,647 | 3,418 | |||||||||
| NET INCOME | 3,185 | 6,754 | 6,553 | |||||||||
| DIVIDENDS ON PREFERRED STOCK | - | 4 | 77 | |||||||||
| NET INCOME AVAILABLE TO COMMON SHAREHOLDERS | $ | 3,185 | $ | 6,750 | $ | 6,476 | ||||||
| Basic | $ | 0.27 | $ | 0.58 | $ | 0.56 | ||||||
| Diluted | $ | 0.27 | $ | 0.58 | $ | 0.56 | ||||||
| WEIGHTED AVERAGE COMMON SHARES OUTSTANDING | ||||||||||||
| Basic | 11,763,050 | 11,610,705 | 11,502,800 | |||||||||
| Diluted | 11,826,977 | 11,655,111 | 11,567,811 | |||||||||
See accompanying notes.
- 73 -
| SELECT BANCORP, INC. |
| CONSOLIDATED STATEMENTS OF COMPREHENSIVE INCOME |
| Years Ended December 31, 2017, 2016 and 2015 |
| 2017 | 2016 | 2015 | ||||||||||
| (Amounts in thousands) | ||||||||||||
| Net income | $ | 3,185 | $ | 6,754 | $ | 6,553 | ||||||
| Other comprehensive income (loss): | ||||||||||||
| Unrealized gains (losses) on investment securities-available for sale | (41 | ) | (185 | ) | (176 | ) | ||||||
| Tax effect | 82 | 67 | 65 | |||||||||
| 41 | (118 | ) | (111 | ) | ||||||||
| Reclassification adjustment for (gains) losses included in net income | (1 | ) | (22 | ) | (332 | ) | ||||||
| Tax effect | - | 8 | 124 | |||||||||
| (1 | ) | (14 | ) | (208 | ) | |||||||
| Total | 40 | (132 | ) | (319 | ) | |||||||
| Total comprehensive income | $ | 3,225 | $ | 6,622 | $ | 6,234 | ||||||
See accompanying notes.
- 74 -
| SELECT BANCORP, INC. |
| CONSOLIDATED STATEMENTS OF CHANGES IN SHAREHOLDERS’ EQUITY |
| Years Ended December 31, 2017, 2016 and 2015 (Amounts in thousands except share data) |
| Common Stock | Accumulated | |||||||||||||||||||||||||||||||||||||||
| Issued | Other | |||||||||||||||||||||||||||||||||||||||
| Additional | to Deferred | Compre- | Total | |||||||||||||||||||||||||||||||||||||
| Preferred Stock | Common Stock | paid-in | Retained | Deferred | Compensation | hensive | Shareholders’ | |||||||||||||||||||||||||||||||||
| Shares | Amount | Shares | Amount | Capital | Earnings | Comp Plan | Trust | Income | Equity | |||||||||||||||||||||||||||||||
| Balance at December 31, 2014 | 7,645 | $ | 7,645 | 11,377,980 | $ | 11,378 | $ | 68,406 | $ | 9,447 | $ | 2,121 | $ | (2,121 | ) | $ | 809 | $ | 97,685 | |||||||||||||||||||||
| Net income | - | - | - | - | - | 6,553 | - | - | - | 6,553 | ||||||||||||||||||||||||||||||
| Other comprehensive loss | - | - | - | - | - | - | - | - | (319 | ) | (319 | ) | ||||||||||||||||||||||||||||
| Preferred stock dividends paid | - | - | - | - | - | (77 | ) | - | - | - | (77 | ) | ||||||||||||||||||||||||||||
| Stock option exercises | - | - | 205,031 | 205 | 616 | - | - | - | - | 821 | ||||||||||||||||||||||||||||||
| Stock based compensation | - | - | - | - | 39 | - | - | - | - | 39 | ||||||||||||||||||||||||||||||
| Director equity incentive plan, net | - | - | - | - | - | - | 18 | (18 | ) | - | - | |||||||||||||||||||||||||||||
| Balance at December 31, 2015 | 7,645 | 7,645 | 11,583,011 | 11,583 | 69,061 | 15,923 | 2,139 | (2,139 | ) | 490 | 104,702 | |||||||||||||||||||||||||||||
| Net income | - | - | - | - | - | 6,754 | - | - | - | 6,754 | ||||||||||||||||||||||||||||||
| Other comprehensive loss | - | - | - | - | - | - | - | - | (132 | ) | (132 | ) | ||||||||||||||||||||||||||||
| Preferred stock dividends paid | - | - | - | - | - | (4 | ) | - | - | - | (4 | ) | ||||||||||||||||||||||||||||
| Preferred stock redemption | (7,645 | ) | (7,645 | ) | - | - | - | - | - | - | - | (7,645 | ) | |||||||||||||||||||||||||||
| Stock option exercises | - | - | 62,402 | 62 | 465 | - | - | - | - | 527 | ||||||||||||||||||||||||||||||
| Stock based compensation | - | - | - | - | 71 | - | - | - | - | 71 | ||||||||||||||||||||||||||||||
| Director equity incentive plan, net | - | - | - | - | - | - | 201 | (201 | ) | - | - | |||||||||||||||||||||||||||||
| Balance at December 31, 2016 | - | - | 11,645,413 | 11,645 | 69,597 | 22,673 | 2,340 | (2,340 | ) | 358 | 104,273 | |||||||||||||||||||||||||||||
| Net income | - | - | - | - | - | 3,185 | - | - | - | 3,185 | ||||||||||||||||||||||||||||||
| Other comprehensive income | - | - | - | - | - | - | - | - | 40 | 40 | ||||||||||||||||||||||||||||||
| Shares issued for Premara merger | - | - | 2,334,999 | 2,335 | 26,001 | - | - | - | - | 28,336 | ||||||||||||||||||||||||||||||
| Stock option exercises | - | - | 28,725 | 29 | 137 | - | - | - | - | 166 | ||||||||||||||||||||||||||||||
| Stock based compensation | - | - | - | - | 115 | - | - | - | - | 115 | ||||||||||||||||||||||||||||||
| Director equity incentive plan, net | - | - | - | - | - | - | 178 | (178 | ) | - | - | |||||||||||||||||||||||||||||
| Balance at December 31, 2017 | - | $ | - | 14,009,137 | $ | 14,009 | $ | 95,850 | $ | 25,858 | $ | 2,518 | $ | (2,518 | ) | $ | 398 | $ | 136,115 | |||||||||||||||||||||
See accompanying notes.
- 75 -
| SELECT BANCORP, INC. |
| CONSOLIDATED STATEMENTS OF CASH FLOWS |
| Years Ended December 31, 2017, 2016 and 2015 |
| 2017 | 2016 | 2015 | ||||||||||
| (Amounts in thousands) | ||||||||||||
| CASH FLOWS FROM OPERATING ACTIVITIES | ||||||||||||
| Net income | $ | 3,185 | $ | 6,754 | $ | 6,553 | ||||||
| Adjustments to reconcile net income to net cash provided by operating activities: | ||||||||||||
| Provision for loan losses | 1,367 | 1,516 | 890 | |||||||||
| Depreciation and amortization of premises and equipment | 1,144 | 1,090 | 1,043 | |||||||||
| Amortization and accretion of investment securities | 556 | 741 | 971 | |||||||||
| Amortization of deferred loan fees and costs | (602 | ) | (485 | ) | (346 | ) | ||||||
| Amortization of core deposit intangible | 409 | 431 | 544 | |||||||||
| Amortization of acquisition premium on time deposits | (292 | ) | (662 | ) | (829 | ) | ||||||
| Amortization of acquisition premium on borrowings | (89 | ) | (256 | ) | (376 | ) | ||||||
| Deferred income taxes | 2,325 | 151 | 970 | |||||||||
| Stock-based compensation | 115 | 71 | 39 | |||||||||
| Accretion on acquired loans | (1,061 | ) | (1,146 | ) | (1,363 | ) | ||||||
| Originations of loans held for sale | (98 | ) | - | - | ||||||||
| Gain on the sale of securities | (1 | ) | (22 | ) | (332 | ) | ||||||
| Increase in cash surrender value of bank owned life insurance | (575 | ) | (591 | ) | (626 | ) | ||||||
| Loss (gain) on sale of premises and equipment | (5 | ) | 20 | 279 | ||||||||
| Net loss on sale and write-downs of foreclosed real estate | 442 | 158 | 139 | |||||||||
| Change in assets and liabilities: | ||||||||||||
| Net change in accrued interest receivable | (432 | ) | (418 | ) | 94 | |||||||
| Net change in other assets | 526 | 1,328 | (313 | ) | ||||||||
| Net change in accrued expenses and other liabilities | (356 | ) | (199 | ) | (454 | ) | ||||||
| NET CASH PROVIDED BY OPERATING ACTIVITIES | 6,558 | 8,481 | 6,883 | |||||||||
| CASH FLOWS FROM INVESTING ACTIVITIES | ||||||||||||
| Redemption (purchase) of FHLB stock | 1,265 | (139 | ) | (588 | ) | |||||||
| Purchase of investment securities available for sale | (1,523 | ) | (2,016 | ) | (9,339 | ) | ||||||
| Maturities of investment securities available for sale | 4,255 | 10,693 | 12,430 | |||||||||
| Mortgage-backed securities pay-downs | 6,015 | 8,223 | 9,210 | |||||||||
| Proceeds from sale of investment securities available for sale | 21,972 | 624 | 8,086 | |||||||||
| Net change in loans outstanding | (108,814 | ) | (59,711 | ) | (56,073 | ) | ||||||
| Cash received from acquisition | 28,513 | - | 21,229 | |||||||||
| Net change in other non-marketable securities | 73 | 2 | 191 | |||||||||
| Proceeds from sale of foreclosed real estate | 1,442 | 2,062 | 635 | |||||||||
| Proceeds from sale of premises and equipment | 9 | 6 | 1,159 | |||||||||
| Proceeds from sale of assets held for sale | - | (781 | ) | - | ||||||||
| Purchases of premises and equipment | (931 | ) | 812 | (3,900 | ) | |||||||
| NET CASH USED IN INVESTING ACTIVITIES | (47,724 | ) | (40,225 | ) | (16,960 | ) | ||||||
See accompanying notes.
- 76 -
| SELECT BANCORP, INC. |
| CONSOLIDATED STATEMENTS OF CASH FLOWS (Continued) |
| Years Ended December 31, 2017, 2016 and 2015 |
| 2017 | 2016 | 2015 | ||||||||||
| (Amounts in thousands) | ||||||||||||
| CASH FLOWS FROM FINANCING ACTIVITIES | ||||||||||||
| Net change in deposits | $ | 89,356 | $ | 29,162 | $ | 1,904 | ||||||
| Proceeds from short-term debt | - | 27,000 | 48,111 | |||||||||
| Proceeds from long-term debt | - | - | 10,000 | |||||||||
| Repayments of short-term debt | (26,722 | ) | (19,327 | ) | (38,972 | ) | ||||||
| Repayments of long-term debt | (14,653 | ) | (5,664 | ) | (6,711 | ) | ||||||
| Preferred stock dividends paid | - | (4 | ) | (77 | ) | |||||||
| Redemption of preferred stock | - | (7,645 | ) | - | ||||||||
| Proceeds from stock options exercised | 166 | 527 | 821 | |||||||||
| NET CASH PROVIDED BY FINANCING ACTIVITIES | 48,147 | 24,049 | 15,076 | |||||||||
| NET CHANGE IN CASH AND CASH EQUIVALENTS | 6,981 | (7,695 | ) | 4,999 | ||||||||
| CASH AND CASH EQUIVALENTS, BEGINNING | 55,714 | 63,409 | 58,410 | |||||||||
| CASH AND CASH EQUIVALENTS, ENDING | $ | 62,695 | $ | 55,714 | $ | 63,409 | ||||||
| SUPPLEMENTAL DISCLOSURES OF CASH FLOW INFORMATION | ||||||||||||
| Cash paid during the period for: | ||||||||||||
| Interest paid | $ | 4,900 | $ | 3,744 | $ | 3,586 | ||||||
| Income taxes paid | 3,471 | 2,591 | 2,983 | |||||||||
| Non-cash transactions: | ||||||||||||
| Change in fair value of investment securities available for sale, net of tax | (41 | ) | (132 | ) | (319 | ) | ||||||
| Transfer from loans to foreclosed real estate | 2,543 | 1,418 | 590 | |||||||||
| Transfer from premises and equipment to assets held for sale | - | 781 | 846 | |||||||||
| Acquisition: | ||||||||||||
| Assets acquired (excluding goodwill) | 278,772 | - | 9,975 | |||||||||
| Liabilities assumed | 256,052 | - | 31,204 | |||||||||
| Purchase price | 40,693 | - | 21,277 | |||||||||
| Goodwill recorded | 17,973 | - | - | |||||||||
See accompanying notes.
- 77 -
| SELECT BANCORP, INC. |
| NOTES TO CONSOLIDATED FINANCIAL STATEMENTS |
| Years Ended December 31, 2017, 2016 and 2015 |
NOTE A - ORGANIZATION AND OPERATIONS
Select Bancorp, Inc. (“Company”) is a bank holding company whose principal business activity consists of ownership of Select Bank & Trust Company (referred to as the “Bank”). All significant intercompany transactions and balances have been eliminated in consolidation. In 2004, the Company formed New Century Statutory Trust I, which issued trust preferred securities to provide additional capital for general corporate purposes, including the current and future expansion of the Company. New Century Statutory Trust I is not a consolidated subsidiary of the Company. The Company is subject to the rules and regulations of the Board of Governors of the Federal Reserve and the North Carolina Commissioner of Banks.
The Bank was originally incorporated as New Century Bank on May 19, 2000 and began banking operations on May 24, 2000. On July 25, 2014, the Company acquired Select Bank & Trust Company, Greenville, North Carolina, and changed the Bank’s legal name to Select Bank & Trust Company. On December 15, 2017, the Company acquired Premara Financial, Inc. and its subsidiary Carolina Premier Bank through the merger of Premara with and into the Company, followed immediately by the merger of Carolina Premier with and into the Bank. The Bank continues as the only banking subsidiary of the Company with its headquarters and operations center located in Dunn, NC. The Bank is engaged in general commercial and retail banking in central and eastern North Carolina, as well as now in Charlotte, North Carolina and northwest South Carolina. The Bank is subject to the supervision and regulation of the Federal Deposit Insurance Corporation and the North Carolina Commissioner of Banks.
Reclassification
Certain items for prior years have been reclassified to conform to the current year presentation. Such reclassifications had no effect on net income, total assets or shareholders’ equity as previously reported.
NOTE B - SUMMARY OF SIGNIFICANT ACCOUNTING POLICIES
Use of Estimates
The preparation of financial statements in conformity with accounting principles generally accepted in the United States of America requires management to make estimates and assumptions that affect the reported amounts of assets and liabilities and the disclosure of contingent assets and liabilities at the date of the financial statements and the reported amounts of revenues and expenses during the reporting period. Actual results could differ from those estimates. Material estimates that are particularly susceptible to significant change relate to the determination of the allowance for loan losses, business combinations, goodwill, deferred tax assets and the valuation of other real estate owned.
Business Combinations
Business combinations are accounted for under the acquisition method of accounting in accordance with Financial Accounting Standards Board (“FASB”) Accounting Standards Codification (“ASC”) 805, “Business Combinations.” Under the acquisition method, the acquiring entity in a business combination recognizes all of the acquired assets and assumed liabilities at their estimated fair values as of the date of acquisition. Any excess of the purchase price over the fair value of net assets and other identifiable intangible assets acquired is recorded as goodwill. To the extent the fair value of net assets acquired, including identified intangible assets, exceeds the purchase price, a bargain purchase gain is recognized.
Assets acquired and liabilities assumed from contingencies must also be recognized at fair value if the fair value can be determined during the measurement period. Results of operations of an acquired business are included in the Statement of Operations from the date of acquisition. Acquisition-related costs, including conversion and restructuring charges, are expensed as incurred.
- 78 -
| SELECT BANCORP, INC. |
| NOTES TO CONSOLIDATED FINANCIAL STATEMENTS |
| Years Ended December 31, 2017, 2016 and 2015 |
NOTE B - SUMMARY OF SIGNIFICANT ACCOUNTING POLICIES (Continued)
The acquired assets and assumed liabilities are recorded at estimated fair values. Management makes significant estimates and exercises significant judgment in accounting for business combinations. Management uses its judgment to assign risk ratings to loans based on credit quality, appraisals and estimated collateral values, and estimated expected cash flows to measure fair values for loans. Real estate acquired in settlement of loans is valued based upon pending sales contracts and appraised values, adjusted for current market conditions. Core deposit intangibles are valued based on a weighted combination of the income and market approach where the income approach converts anticipated economic benefits to a present value and the market approach evaluates the market in which the asset is traded to find an indication of prices from actual transactions. Management uses quoted or current market prices to determine the fair value of investment securities. Fair values of deposits and borrowings are based on current market interest rates and are inclusive of any applicable prepayment penalties.
Cash and Due from Banks, Interest-Earning Deposits in Other Banks and Federal Funds Sold
For the purpose of presentation in the statements of cash flows, cash and cash equivalents are defined as those amounts included in the balance sheet captions “Cash and due from banks,” “Interest-earning deposits in other banks,” “Certificates of Deposit” and “Federal funds sold.”
Certificates of Deposit
Certificates of deposit are cash instruments that management has the intent and ability to hold for the foreseeable future or until maturity and are reported at cost.
Investment Securities Available for Sale
Investment securities available for sale are reported at fair value and consist of debt instruments that are not classified as either trading securities or as held to maturity securities. Unrealized holding gains and losses, net of deferred income tax, on available for sale securities are reported as a net amount in accumulated other comprehensive income. Gains and losses on the sale of investment securities available for sale are determined using the specific-identification method.
Loans
Loans that management has the intent and ability to hold for the foreseeable future or until maturity are reported at their outstanding principal balance adjusted for any charge-offs, the allowance for loan losses, and any deferred fees or costs on originated loans and unamortized premiums or discounts on purchased loans. Loan origination fees and certain direct origination costs are capitalized and recognized as an adjustment of the yield of the related loan. The accrual of interest on impaired loans is discontinued when, in management’s opinion, the borrower may be unable to meet payment obligations as they become due. When interest accrual is discontinued, all unpaid accrued interest is reversed. Interest income is subsequently recognized only to the extent cash payments are received in excess of principal due. Loans are returned to accrual status when all of the principal and interest amounts contractually due are brought current and future payments are reasonably assured.
The acquired loans are segregated between those considered to be performing (“acquired performing”) and those with evidence of credit deterioration based on such factors as past due status, nonaccrual status and credit risk ratings (“purchased credit-impaired loans”).
- 79 -
| SELECT BANCORP, INC. |
| NOTES TO CONSOLIDATED FINANCIAL STATEMENTS |
| Years Ended December 31, 2017, 2016 and 2015 |
NOTE B - SUMMARY OF SIGNIFICANT ACCOUNTING POLICIES (Continued)
In determining the acquisition date fair value of purchased credit-impaired (“PCI”) loans, and in subsequent accounting, the Company generally aggregates purchased loans into pools of loans with common risk characteristics within the following loan categories: 1-to-4 family residential loans other than junior liens, 1-to-4 family residential junior liens, construction and land development, farm land, commercial real estate (nonowner-occupied), commercial real estate (owner-occupied), commercial and industrial, and all other loan categories. Expected cash flows at the acquisition date in excess of the fair value of loans are referred to as the “accretable yield” and recorded as interest income over the life of the loans using a level yield method if the timing and amount of the future cash flows of the pool is reasonably estimable. Subsequent to the acquisition date, significant increases in cash flows over those expected at the acquisition date are recognized as interest income prospectively. Accordingly, such loans are not classified as nonaccrual and they are considered to be accruing because their interest income relates to the accretable yield recognized under accounting for PCI loans and not to contractual interest payments. The difference between the contractually required payments and the cash flows expected to be collected at acquisition, considering the impact of prepayments, is referred to as the nonaccretable difference.
The difference between the fair value of an acquired performing loan pool and the contractual amounts due at the acquisition date (the “fair value discount”) is accreted into income over the estimated life of the pool. The Company’s policy for determining when to discontinue accruing interest on acquired performing loans and the subsequent accounting for such loans is essentially the same as the policy for originated loans described earlier.
Loans are deemed uncollectible based on a variety of credit, collateral, documentation and other issues. In the case where a loan is unsecured and in default it is fully charged off.
Non-accrual Loans
Loans are placed on non-accrual when it has been determined that all contractual principal and interest will not be received. Any payments received on these loans are applied to principal first and then to interest only after all principal has been collected. Impaired loans include all loans in non-accrual status, all troubled debt restructures, all substandard loans that are deemed to be collateral dependent, and other loans that management determines require impairment. In the case of an impaired loan that is still on accrual basis, payments are applied to both principal and interest.
Allowance for Loan Losses
The provision for loan losses is based upon management’s estimate of the amount needed to maintain the allowance for loan losses at an adequate level in light of the risk inherent in the loan portfolio. In making the evaluation of the adequacy of the allowance for loan losses, management gives consideration to current economic conditions, statutory examinations of the loan portfolio by regulatory agencies, delinquency information and management’s internal review of the loan portfolio. Loans are considered impaired when it is probable that all amounts due will not be collected in accordance with the contractual terms of the loan agreement. The measurement of impaired loans is generally based on the present value of expected future cash flows discounted at the historical effective interest rate, or upon the fair value of the collateral if the loan is collateral-dependent. If the recorded investment in the loan exceeds the measure of fair value, a valuation allowance is established as a component of the allowance for loan losses. Interest payments on impaired loans are typically applied to principal unless collectability of the principal amount is reasonably assured, in which case, interest is recognized on a cash basis. Impaired loans, or portions thereof, are charged off when deemed uncollectible. While management uses the best information available to make evaluations, future adjustments to the allowance may be necessary if conditions differ substantially from the assumptions used in making the evaluations. In addition, regulatory examiners may require the Company to recognize adjustments to the allowance for loan losses based on their judgments about information available to them at the time of their examination.
- 80 -
| SELECT BANCORP, INC. |
| NOTES TO CONSOLIDATED FINANCIAL STATEMENTS |
| Years Ended December 31, 2017, 2016 and 2015 |
NOTE B - SUMMARY OF SIGNIFICANT ACCOUNTING POLICIES (Continued)
Decreases in expected cash flows of PCI loans after the acquisition date are recognized by recording an allowance for credit loss. For any significant increases in cash flows expected to be collected, the Company first adjusts any prior recorded allowance for loan and lease losses through a reversal of previously recognized allowance through provision expense, and then increases the amount of accretable yield to be recognized on a prospective basis over the pool’s remaining life. Management analyzes these acquired loan pools using various assessments of risk to determine and calculate an expected loss. The expected loss is derived using an estimate of a loss given default based upon the collateral type and/or specific review by loan officers. Trends are reviewed in terms of traditional credit metrics such as accrual status, past due status, and weighted average risk grade of the loans within each of the accounting pools. In addition, the relationship between the change in the unpaid principal balance and change in the fair value mark is assessed to correlate the directional consistency of the expected loss for each pool.
Loans Held for Sale
Mortgage loans originated and intended for sale in the secondary market are classified as held for sale and are carried at the lower of cost or fair value. Upon closing, these loans are sold to mortgage loan investors under pre-arranged terms. Origination fees are recognized upon the sale and are included in non-interest income. Related to the mortgage business, the Company enters into interest rate lock commitments and commitments to sell mortgages to investors. Interest rate lock commitments are used to manage interest rate risk associated with the fixed rate loan commitments, and forward sale commitments are entered into with investors to manage the interest rate risk associated with the customer interest rate lock commitments, both of which are considered derivative financial instruments. The period of time between the issuance of a loan commitment and the closing and sale of the loan generally ranges from 10 to 60 days. Interest rate lock commitments and forward sale commitments are derivative instruments and are carried at fair value. These derivative instruments do not qualify for hedge accounting. The fair value of interest rate lock commitments is based on current secondary market pricing and is included in other assets on the balance sheet. The fair value of the forward sale commitments is based on changes in the value of the commitment, principally because of changes in interest rates, and is included on the consolidated balance sheets in other assets or other liabilities. Changes in fair value for these instruments are reflected in non-interest income on the income statement. Gains and losses from sales of the mortgage loans are recognized when the Company ultimately sells the loans, and such gains and losses are also recorded in non-interest income. An asset is recorded for the value of the servicing rights and is amortized over the remaining life of the loan on the effective interest method. The servicing asset is included in other assets and the amortization of the servicing asset is included in non-interest expense. Servicing fees are recorded in non-interest income.
- 81 -
| SELECT BANCORP, INC. |
| NOTES TO CONSOLIDATED FINANCIAL STATEMENTS |
| Years Ended December 31, 2017, 2016 and 2015 |
NOTE B - SUMMARY OF SIGNIFICANT ACCOUNTING POLICIES (Continued)
Stock in Federal Home Loan Bank of Atlanta
As a requirement for membership, the Bank invests in stock of the Federal Home Loan Bank of Atlanta (“FHLB”). This investment was carried at cost at December 31, 2017 and 2016. The Company continually monitors the financial strength of the FHLB and evaluates the investment for potential impairment. There can be no assurance that the impact of recent or future legislation on the Federal Home Loan Banks will not cause a decrease in the value of the Bank’s investment in FHLB stock.
Other Non-Marketable Securities
Other non-marketable securities are equity instruments that are reported at cost.
Foreclosed Real Estate
Real estate acquired through, or in lieu of, loan foreclosure is recorded at fair value, less the estimated cost to sell, at the date of foreclosure. After foreclosure, management periodically performs valuations of the property and adjusts the value down when the carrying value of the property exceeds the estimated net realizable value. Revenue and expenses from operations and changes in the valuation allowance are included in foreclosure-related expense.
Premises and Equipment
Premises and equipment are stated at cost less accumulated depreciation. Depreciation is calculated on the straight-line method over the estimated useful lives of the assets. Estimated useful lives are 40 years for buildings and 3 to 10 years for furniture, fixtures and equipment. Leasehold improvements are amortized over the terms of the respective leases or the estimated useful lives of the improvements, whichever is shorter.
Repairs and maintenance costs are charged to operations as incurred and additions and improvements to premises and equipment are capitalized. Upon sale or retirement, the cost and related accumulated depreciation are removed from the accounts and any gains or losses are reflected in current operations.
Income Taxes
Deferred tax assets and liabilities are recognized for the estimated future tax consequences attributable to differences between the tax basis of assets and liabilities and their carrying amounts for financial reporting purposes. Deferred tax assets are also recognized for operating loss carry-forwards. Deferred tax assets and liabilities are measured using enacted tax rates in effect for the year in which the temporary differences are expected to be recovered or settled. Deferred tax assets are reduced by a valuation allowance if it is more likely than not that the tax benefits will not be realized.
Public law No. 115-97, known as the Tax
Cuts and Jobs Act (the "Act"), enacted on December 22, 2017, reduced the U.S. federal corporate tax rate from 35% to
21%. Also on December 22, 2017, the Securities and Exchange Commission issued Staff Accounting Bulletin No. 118 (SAB 118), which
provides guidance on accounting for tax effects of the Act. SAB 118 provides a measurement period of up to one year from the enactment
date to complete the accounting. Any adjustments during this measurement period will be included in net earnings from continuing
operations as an adjustment to income tax expense in the reporting period when such adjustments are determined. Based on the information
available and current interpretation of the rules, the Company has made estimates of the impact of the reduction in the corporate
tax rate and re-measurement of certain deferred tax assets and liabilities. The provisional amount recorded related
to the re-measurement of the Company's deferred tax balance was $2.6 million. The final impact of the Act may differ from these
estimates as a result of changes in management’s interpretations and assumptions, as well as new guidance that may be issued
by the Internal Revenue Service (IRS). See Note L Income Taxes for more information.
- 82 -
| SELECT BANCORP, INC. |
| NOTES TO CONSOLIDATED FINANCIAL STATEMENTS |
| Years Ended December 31, 2017, 2016 and 2015 |
NOTE B - SUMMARY OF SIGNIFICANT ACCOUNTING POLICIES (Continued)
Bank Owned Life Insurance
Bank Owned Life Insurance ("BOLI") is carried at its cash surrender value on the balance sheet and is classified as a non-interest-earning asset. Death benefit proceeds received in excess of the policy's cash surrender value are recognized to income. Returns on the BOLI assets are added to the carrying value and included as non-interest income in the consolidated statement of operations. Any receipt of benefit proceeds is recorded as a reduction to the carrying value of the BOLI asset. At December 31, 2017 and 2016, the Company held no loans against its BOLI cash surrender values.
Goodwill
Goodwill represents the cost in excess of the fair value of net assets acquired (including identifiable intangibles) in transactions accounted for as business combinations. Goodwill has an indefinite useful life and is evaluated for impairment annually, or more frequently if events and circumstances indicate that the asset might be impaired. An impairment loss is recognized to the extent that the carrying amount exceeds the asset’s fair value. The goodwill impairment analysis is a two-step test. The first, used to identify potential impairment, involves comparing each reporting unit’s estimated fair value to its carrying value, including goodwill. If the estimated fair value of a reporting unit exceeds its carrying value, goodwill is considered not to be impaired.
In September 2011, the FASB issued ASU 2011-08, which gives entities the option of first performing a qualitative assessment to test goodwill for impairment on a reporting-unit-by-reporting-unit basis. If, after performing the qualitative assessment, an entity concludes that it is more likely than not that the fair value of a reporting unit is less than its carrying amount, the entity would perform the two-step goodwill impairment test described in the impairment test described above. However, if, after applying the qualitative assessment, the entity concludes that it is not more likely than not that the fair value is less than the carrying amount, the two-step goodwill impairment test is not required.
The Company performed the qualitative assessment as outlined in ASU 2011-08 in assessing the carrying value of goodwill related to its acquisitions as of October 5, 2017, its annual test date, and determined that it was unlikely that the fair value was less than the carrying amount and that no further testing or impairment charge was necessary. Should the Company’s future earnings and cash flows decline and/or discount rates increase, an impairment charge to goodwill and other intangible assets may be required. There have been no events subsequent to the October 5, 2017 evaluation that caused the Company to perform an interim review of the carrying value of goodwill.
- 83 -
| SELECT BANCORP, INC. |
| NOTES TO CONSOLIDATED FINANCIAL STATEMENTS |
| Years Ended December 31, 2017, 2016 and 2015 |
NOTE B - SUMMARY OF SIGNIFICANT ACCOUNTING POLICIES (Continued)
Core Deposit Intangible
The Company considers its core deposits to be intangible assets with finite lives. Core deposit intangibles are being amortized using the effective interest method over six years.
Derivative Financial Instruments
The Company utilizes interest rate lock commitments and forward sale commitments, which are considered derivative instruments, in its mortgage banking operations. For 2017 the amount of interest rate lock commitments is less than $1,000 and is considered immaterial.
Stock-Based Compensation
The Company has certain stock-based employee compensation plans, described more fully in Note P. Generally accepted accounting principles (“GAAP”) require recognition of the cost of employee services received in exchange for an award of equity instruments in the financial statements over the period the employee is required to perform the services in exchange for the award (usually the vesting period). GAAP also requires the compensation cost for all awards granted after the date of adoption and any unvested awards that remained outstanding as of the date of adoption to be measured based on the fair value of the award on the grant date.
Comprehensive Income
The Company reports as comprehensive income all changes in shareholders' equity during the year from sources other than shareholders. Other comprehensive income refers to all components (revenues, expenses, gains, and losses) of comprehensive income that are excluded from net income. The Company's only component of other comprehensive income is unrealized gains and losses on investment securities available for sale.
Segment Information
The Company follows the provisions of ASC 280, Segment Reporting, which specifies guidelines for determining an entity’s operating segments and the type and level of financial information to be disclosed. Based on these guidelines, management has determined that the Bank operates as a single business segment; the providing of general commercial and retail financial services to customers located in the Company’s market areas. The various products, as well as the methods used to distribute them, are those generally offered by community banks.
- 84 -
| SELECT BANCORP, INC. |
| NOTES TO CONSOLIDATED FINANCIAL STATEMENTS |
| Years Ended December 31, 2017, 2016 and 2015 |
NOTE B - SUMMARY OF SIGNIFICANT ACCOUNTING POLICIES (Continued)
Net Income per Common Share and Common Shares Outstanding
Basic earnings per share represents income available to common shareholders divided by the weighted-average number of common shares outstanding during the period. Diluted earnings per share reflect additional common shares that would have been outstanding if dilutive potential common shares had been issued, as well as any adjustment to income that would result from the assumed issuance. Potential common shares that may be issued by the Company relate to outstanding stock options. Basic and diluted net income per share have been computed based upon net income as presented in the accompanying statements of operations divided by the weighted average number of common shares outstanding or assumed to be outstanding as summarized below:
| 2017 | 2016 | 2015 | ||||||||||
| Weighted average number of common shares used in computing basic net income per share | 11,763,050 | 11,610,705 | 11,502,800 | |||||||||
| Effect of dilutive stock options | 63,927 | 44,406 | 65,011 | |||||||||
| Weighted average number of common shares and dilutive potential common shares used in computing diluted net income per share | 11,826,977 | 11,655,111 | 11,567,811 | |||||||||
At December 31, 2017, 2016 and 2015, there were 121,300; 88,000 and 97,800 anti-dilutive options, respectively.
Recent Accounting Pronouncements
The following summarizes recent accounting pronouncements and their expected impact on the Company:
In January 2018, the FASB issued ASU 2018-02, Income Statement - Reporting Comprehensive Income (Topic 220): Reclassification of Certain Tax Effects from Accumulated Other Comprehensive Income. This ASU requires a reclassification from accumulated other comprehensive income (AOCI) to retained earnings for stranded tax effects resulting from the newly enacted federal corporate income tax rate in the Tax Cuts and Jobs Act of 2017 (Tax Act), which was enacted on December 22, 2017. The Tax Act included a reduction to the corporate income tax rate from 35 percent to 21 percent effective January 1, 2018. The amount of the reclassification would be the difference between the historical corporate income tax rate and the newly enacted 21 percent corporate income tax rate.
The amendments in this ASU are effective for fiscal years beginning after December 15, 2018, including interim periods within those fiscal years. Early adoption is permitted and the Company adopted this ASU as of December 31, 2017 resulting in an immaterial adjustment.
- 85 -
| SELECT BANCORP, INC. |
| NOTES TO CONSOLIDATED FINANCIAL STATEMENTS |
| Years Ended December 31, 2017, 2016 and 2015 |
NOTE B - SUMMARY OF SIGNIFICANT ACCOUNTING POLICIES (Continued)
Recent Accounting Pronouncements (Continued)
ASU 2014-09, Revenue from Contracts with Customers (Topic 606), ASU 2015-14 Revenue from Contracts with Customers (Topic 606): Deferral of the Effective Date, ASU 2016-08 Revenue from Contracts with Customers (Topic 606): Principal versus Agent Considerations (Reporting Revenue Gross versus Net), ASU 2016-10 Revenue from Contracts with Customers (Topic 606): Identifying Performance Obligations and Licensing, ASU 2016-11 Revenue Recognition (Topic 605) and Derivatives and Hedging (Topic 815): Rescission of SEC Guidance Because of Accounting Standards Updates 2014-09 and 2014-16 Pursuant to Staff Announcements at the March 3, 2016 EITF Meeting, ASU 2016-12 Revenue from Contracts with Customers (Topic 606): Narrow-Scope Improvements and Practical Expedients, ASU 2016-20 Technical Corrections and Improvements to Topic 606, Revenue from Contracts with Customers, and ASU 2017-05 Other Income - Gains and losses from the Derecognition of Nonfinancial Assets (Subtopic 610-20) - Clarifying the Scope of Asset Derecognition Guidance and Accounting for Partial Sales of Nonfinancial Assets —The new guidance, which does not apply to financial instruments, provides that revenue should be recognized for the transfer of goods and services to customers in an amount equal to the consideration it receives or expects to receive. The guidance also includes expanded disclosure requirements that provide comprehensive information about the nature, amount, timing, and uncertainty of revenue and cash flows arising from contracts with customers. This guidance is effective for fiscal years, and interim periods within those fiscal years, beginning after December 15, 2017. The Company currently plans to adopt the guidance using the modified retrospective method and without electing any of the practical expedients available. The Company has performed an analysis of the guidance and it is not expected to have a significant impact on the Company's financial position or results of operations but will increase disclosures of revenue.
In March 2016, the FASB issued ASU 2016-09, Compensation-Stock Compensation (Topic 718): Improvements to Employee Share-based Payment Accounting, to simplify several aspects of the accounting for share-based payment award transactions including the income tax consequences, the classification of awards as either equity or liabilities, including the tax effect of forfeitures and the classification on the statement of cash flows. Additionally, the guidance simplifies two areas specific to entities other than public business entities allowing them to apply a practical expedient to estimate the expected term for all awards with performance or service conditions that have certain characteristics and also allowing them to make a one-time election to switch from measuring all liability-classified awards at fair value to measuring them at intrinsic value. The amendments were effective for the Company for annual periods beginning after December 15, 2016 and interim periods within those annual periods. The Company adopted these amendments to its financial statements during the first quarter of 2017 with a positive impact to net earnings as an excess tax benefit of $4,000 was recorded through the income statement rather than additional paid in capital.
In January 2016, FASB issued ASU No. 2016-01, Financial Instruments - Overall (Subtopic 825-10): Recognition and Measurement of Financial Assets and Financial Liabilities. The amendments in this ASU (i) requires equity investments, with certain exceptions, to be measured at fair value with changes in fair value recognized in net income, (ii) simplifies the impairment assessment of equity investments without readily determinable fair values by requiring a qualitative assessment to identify impairment, (iii) eliminates the requirement for public business entities to disclose the methods and significant assumptions used to estimate the fair value that is required to be disclosed for financial instruments measured at amortized cost on the balance sheet, (iv) requires public business entities to use the exit price notion when measuring the fair value of financial instruments for disclosure purposes, (v) requires an entity to present separately in other comprehensive income the portion of the total change in the fair value of a liability resulting from a change in the instrument-specific credit risk when the entity has elected to measure the liability at fair value in accordance with the fair value option for financial instruments, (vi) requires separate presentation of financial assets and financial liabilities by measurement category and form of financial asset on the balance sheet or the accompanying notes to the financial statements and (vii) clarifies that an entity should evaluate the need for a valuation allowance on a deferred tax asset related to available-for-sale securities in combination with the entity's other deferred tax assets. The accounting guidance is effective for fiscal years, and interim periods within those years, beginning after December 15, 2017. Early adoption is prohibited except for the presentation in other comprehensive income of the portion of the total change in the fair value of a liability resulting from a change in the instrument-specific credit risk which may be early adopted. The guidance is not expected to have a significant impact on the Company's financial position, results of operations or disclosures.
- 86 -
| SELECT BANCORP, INC. |
| NOTES TO CONSOLIDATED FINANCIAL STATEMENTS |
| Years Ended December 31, 2017, 2016 and 2015 |
NOTE B - SUMMARY OF SIGNIFICANT ACCOUNTING POLICIES (Continued)
Recent Accounting Pronouncements (Continued)
In February 2016, the FASB issued ASU 2016-02, Leases (Topic 842). ASU 2016-02 applies a right-of-use (ROU) model that requires a lessee to record, for all leases with a lease term of more than 12 months, an asset representing its right to use the underlying asset and a liability to make lease payments. For leases with a term of 12 months or less, a practical expedient is available whereby a lessee may elect, by class of underlying asset, not to recognize an ROU asset or lease liability. At inception, lessees must classify all leases as either finance or operating based on five criteria. Balance sheet recognition of finance and operating leases is similar, but the pattern of expense recognition in the income statement, as well as the effect on the statement of cash flows, differs depending on the lease classification. For public business entities, the amendments in ASU 2016-02 are effective for interim and annual periods beginning after December 15, 2018. In transition, lessees and lessors are required to recognize and measure leases at the beginning of the earliest period presented using a modified retrospective approach which includes a number of optional practical expedients that entities may elect to apply. The Company has reviewed its outstanding lease agreements and has centrally documented the terms of its leases. The Company is currently evaluating the provisions of ASU 2016-02 in relation to its outstanding leases to determine the potential impact the new standard will have to the Company’s financial statements.
In June 2016, the FASB issued ASU 2016-13, Financial Instruments – Credit Losses (Topic 326): Measurement of Credit Losses on Financial Instruments guidance to change the accounting for credit losses and modify the impairment model for certain debt securities. ASU 2016-13 requires an entity to utilize a new impairment model known as the current expected credit loss ("CECL") model to estimate its lifetime "expected credit loss" and record an allowance that, when deducted from the amortized cost basis of the financial asset, presents the net amount expected to be collected on the financial asset. The CECL model is expected to result in earlier recognition of credit losses. ASU 2016-13 also requires new disclosures for financial assets measured at amortized cost, loans and available-for-sale debt securities. The updated guidance is effective for interim and annual reporting periods beginning after December 15, 2019, including interim periods within those fiscal years. Early adoption is permitted. Entities will apply the standard's provisions as a cumulative-effect adjustment to retained earnings as of the beginning of the first reporting period in which the guidance is adopted. The Company has dedicated staff and resources in place evaluating the Company’s options including evaluating the appropriate model options and collecting and reviewing loan data for use in these models. The Company is still assessing the impact that this new guidance will have on its consolidated financial statements.
In August 2016, the FASB amended the ASU 2016-15, Statement of Cash Flows (Topic 230): Classifications of Certain Cash Receipts and Cash Payments, of the Accounting Standards Codification to clarify how certain cash receipts and cash payments are presented and classified in the statement of cash flows. The amendments will be effective for the Company for fiscal years beginning after December 15, 2017 including interim periods within those fiscal years. The Company does not expect these amendments to have a material effect on its financial statements.
- 87 -
| SELECT BANCORP, INC. |
| NOTES TO CONSOLIDATED FINANCIAL STATEMENTS |
| Years Ended December 31, 2017, 2016 and 2015 |
NOTE B - SUMMARY OF SIGNIFICANT ACCOUNTING POLICIES (Continued)
Recent Accounting Pronouncements (Continued)
In January 2017, the FASB ASU 2016-07, Investments-Equity Method and Joint Ventures (Topic 323): Simplifying the Transition to the Equity Method of Accounting was updated. The ASU incorporates into the Accounting Standards Codification recent SEC guidance about disclosing, under SEC SAB Topic 11.M, the effect on financial statements of adopting the revenue, leases, and credit losses standards. The ASU was effective upon issuance. The Company is currently evaluating the impact on additional disclosure requirements as each of the standards is adopted; however, it does not expect these amendments to have a material effect on its financial position, results of operations or cash flows.
In January 2017, the FASB ASU 2017-04, Intangibles - Goodwill and Other (Topic 350):Simplifying the Test for Goodwill Impairment was amended to simplify the accounting for goodwill impairment for public business entities and other entities that have goodwill reported in their financial statements and have not elected the private company alternative for the subsequent measurement of goodwill. The amendment removes Step 2 of the goodwill impairment test. A goodwill impairment will now be the amount by which a reporting unit’s carrying value exceeds its fair value, not to exceed the carrying amount of goodwill. The effective date and transition requirements for the technical corrections will be effective for the Company for reporting periods beginning after December 15, 2019. Early adoption is permitted for interim or annual goodwill impairment tests performed on testing dates after January 1, 2017. The Company does not expect these amendments to have a material effect on its financial statements.
In February 2017, the FASB ASU2017-05, Other Income – Gains and Losses from the Derecognition of Nonfinancial Assets (Subtopic610-20) clarified the scope of the guidance on nonfinancial asset derecognition as well as the accounting for partial sales of nonfinancial assets. The amendments conform the derecognition guidance on nonfinancial assets with the model for transactions in the new revenue standard. The amendments will be effective for the Company for reporting periods beginning after December 15, 2017. The Company does not expect these amendments to have a material effect on its financial statements.
In May 2017, the FASB ASU 2017-07, Compensation – Retirement Benefits (Topic 715): Improving the Presentation of Net Periodic Pension Cost and Net Periodic Postretirement Benefit Cost amended the requirements in the changes to the terms or conditions of a share-based payment award. The amendments provide guidance about which changes to the terms or conditions of a share-based payment award require an entity to apply modification accounting. The amendments will be effective for the Company for annual periods, and interim periods within those annual periods, beginning after December 15, 2017. Early adoption is permitted. The Company does not expect these amendments to have a material effect on its financial statements.
From time to time, the FASB issues exposure drafts for proposed statements of financial accounting standards. Such exposure drafts are subject to comment from the public, to revisions by the FASB and to final issuance by the FASB as statements of financial accounting standards. Management considers the effect of the proposed statements on the consolidated financial statements of the Company and monitors the status of changes to and proposed effective dates of exposure drafts.
- 88 -
| SELECT BANCORP, INC. |
| NOTES TO CONSOLIDATED FINANCIAL STATEMENTS |
| Years Ended December 31, 2017, 2016 and 2015 |
Note C – Business Combinations
On July 20, 2017, the Company executed a merger agreement with Premara Financial, Inc. (“Premara”), a bank holding company headquartered in Charlotte, North Carolina, whose wholly owned subsidiary, Carolina Premier Bank, was a North Carolina state-chartered commercial bank. On December 15, 2017, Select completed its previously announced acquisition of Premara and pursuant to the terms of the merger agreement, Premara was merged with and into the Company, followed immediately by the merger of Carolina Premier Bank with and into the Bank. Carolina Premier had approximately $279.6 million in assets as of the merger date, December 15, 2017. The merger expanded the Bank’s North Carolina presence with a branch in Charlotte and marked the Bank’s initial entry into South Carolina with the acquisition of branches in Rock Hill, Blacksburg and Six Mile, South Carolina.
Premara had 3,179,808 shares of common stock outstanding as of the merger closing date. Under the terms of the merger agreement, 948,080 shares of Premara common stock (equivalent to 30% of Premara’s outstanding shares of common stock as of the date of the merger agreement) were converted to the $12.65 per share cash merger consideration, for aggregate cash consideration of $11,993,212 (exclusive of cash paid-in-lieu of fractional shares) which was paid out subsequent to year end. Pursuant to the Merger Agreement, each warrant or stock option to acquire shares of Premara common stock issued and outstanding as of the effective time of the Merger was converted into the right to receive from the Company a cash payment equal to $12.65 less the exercise price of such warrant or option, as applicable and paid out prior to year end. The remaining 2,231,728 Premara common shares were converted into stock consideration at the merger exchange ratio of 1.0463 shares of Company common stock for each share of Premara common stock, resulting in the issuance of 2,334,999 new shares of Company common stock. The transaction was valued at approximately $40.6 million in the aggregate based on 3,179,808 shares of Premara common stock outstanding on December 15, 2017. The Premara common stock shares converted to Select common stock are valued at $12.14 per share, the low price of Select common stock on December 15, 2017.
The merger with Premara was accounted for under the acquisition method of accounting with the Company as the legal and accounting acquirer and Premara as the legal and accounting acquiree. The assets and liabilities of Premara, as of the effective date of the acquisition, are recorded at their respective fair values. For the acquisition of Premara, estimated fair values of assets acquired and liabilities assumed are based on the information that is available, and the Company believes this information provides a reasonable basis for determining fair values.
- 89 -
| SELECT BANCORP, INC. |
| NOTES TO CONSOLIDATED FINANCIAL STATEMENTS |
| Years Ended December 31, 2017, 2016 and 2015 |
Note C – Business Combinations (continued)
The following table provides the carrying value of acquired assets and assumed liabilities, as recorded by the Company, the fair value adjustments calculated at the time of the merger and the resulting fair value recorded by the Company.
| December 15, 2017 | ||||||||||||
| As recorded by | Fair Value | As recorded by | ||||||||||
| Premara | adjustments | the Company | ||||||||||
| (Dollars in thousands) | ||||||||||||
| Assets | ||||||||||||
| Cash and cash equivalents | $ | 28,513 | $ | - | $ | 28,513 | ||||||
| Investment securities | 32,939 | (106 | ) | 32,833 | ||||||||
| Loans | 203,780 | (5,340 | ) | 198,440 | ||||||||
| Less: allowance for loan losses | (2,341 | ) | 2,341 | - | ||||||||
| Premises and equipment | 928 | (233 | ) | 695 | ||||||||
| Accrued interest receivable | 853 | (56 | ) | 797 | ||||||||
| Bank owned life insurance | 5,673 | - | 5,673 | |||||||||
| Goodwill | 325 | (325 | ) | - | ||||||||
| Core deposit intangible | 223 | 2,477 | 2,700 | |||||||||
| Other assets | 8,701 | 790 | 9,491 | |||||||||
| Total assets acquired | $ | 279,594 | $ | (452 | ) | $ | 279,142 | |||||
| Liabilities | ||||||||||||
| Deposits: | ||||||||||||
| Noninterest-bearing | $ | 55,617 | $ | - | $ | 55,617 | ||||||
| Interest-bearing | 170,873 | 171 | 171,044 | |||||||||
| Total deposits | 226,490 | 171 | 226,661 | |||||||||
| Borrowings | 29,000 | 14 | 29,014 | |||||||||
| Other liabilities | 747 | - | 747 | |||||||||
| Total liabilities assumed | $ | 256,237 | $ | 185 | $ | 256,422 | ||||||
| Fair value of net assets assumed | 22,720 | |||||||||||
| Value of common shares of Premara shareholders | 40,693 | |||||||||||
| Goodwill recorded for Premara | $ | 17,973 | ||||||||||
Goodwill recorded for Premara represents future revenues to be derived from the existing customer base, including efficiencies that will result from combining operations.
- 90 -
| SELECT BANCORP, INC. |
| NOTES TO CONSOLIDATED FINANCIAL STATEMENTS |
| Years Ended December 31, 2017, 2016 and 2015 |
Note C – Business Combinations (continued)
In determining the acquisition date fair value of purchased credit-impaired (“PCI”) loans, and in subsequent accounting, the Company generally aggregates loans into pools of loans with common risk characteristics. Expected cash flows at the acquisition date in excess of the fair value of loans are referred to as the “accretable yield” and recorded as interest income prospectively.
PCI loans acquired totaled $8.6 million at estimated fair value and acquired performing loans totaling $189.6 million at estimated fair value. For PCI loans acquired from Premara, the contractually required payments including principal and interest, cash flows expected to be collected and fair values as of the closing date of the merger were:
| (Dollars in thousands) | December 15, 2017 | |||
| Contractually required payments | $ | 11,752 | ||
| Nonaccretable difference | 1,768 | |||
| Cash flows expected to be collected | 9,984 | |||
| Accretable yield | 1,392 | |||
| Fair value at acquisition date | $ | 8,592 | ||
Merger-related expense in 2017 totaled $2.2 million which were recorded as noninterest expense as incurred.
The following tables reflect the pro forma total net interest income, noninterest income and net income for the twelve months ended December 31, 2017 and 2016 as though the acquisition of Premara had taken place on January 1, 2016. The pro forma results have not been adjusted to remove non-recurring acquisition-related expenses, and are not necessarily indicative of the results of operations that would have occurred had the acquisition actually taken place on January 1, 2016, nor of future results of operations.
| Twelve Months Ended December 31 | ||||||||
| 2017 | 2016 | |||||||
| (Dollars in thousands, except per share) | ||||||||
| Net interest income | $ | 44,248 | $ | 42,329 | ||||
| Non-interest income | 4,332 | 4,166 | ||||||
| Net income available to common shareholders | 5,530 | 8,665 | ||||||
| Earnings per share, basic | $ | 0.44 | $ | 0.58 | ||||
| Earnings per share, diluted | $ | 0.44 | $ | 0.58 | ||||
| Weighted average common shares outstanding, basic | 13,995,692 | 13,945,704 | ||||||
| Weighted average common shares outstanding, diluted | 14,059,619 | 13,990,110 | ||||||
- 91 -
| SELECT BANCORP, INC. |
| NOTES TO CONSOLIDATED FINANCIAL STATEMENTS |
| Years Ended December 31, 2017, 2016 and 2015 |
NOTE D - INVESTMENT SECURITIES
The amortized cost and fair value of available for sale (“AFS”) investments, with gross unrealized gains and losses, follow:
| December 31, 2017 | ||||||||||||||||
| Gross | Gross | |||||||||||||||
| Amortized | unrealized | unrealized | Fair | |||||||||||||
| cost | gains | losses | value | |||||||||||||
| (dollars in thousands) | ||||||||||||||||
| Securities available for sale: | ||||||||||||||||
| U.S. government agencies – GSE’s | $ | 13,241 | $ | 148 | $ | (25 | ) | $ | 13,364 | |||||||
| Mortgage-backed securities – GSE’s | 29,571 | 213 | (100 | ) | 29,684 | |||||||||||
| Corporate bonds | 1,858 | 44 | (14 | ) | 1,888 | |||||||||||
| Municipal bonds | 18,583 | 255 | - | 18,838 | ||||||||||||
| $ | 63,253 | $ | 660 | $ | (139 | ) | $ | 63,774 | ||||||||
| December 31, 2016 | ||||||||||||||||
| Gross | Gross | |||||||||||||||
| Amortized | unrealized | unrealized | Fair | |||||||||||||
| cost | gains | losses | value | |||||||||||||
| (dollars in thousands) | ||||||||||||||||
| Securities available for sale: | ||||||||||||||||
| U.S. government agencies – GSE’s | $ | 14,086 | $ | 98 | $ | (25 | ) | $ | 14,159 | |||||||
| Mortgage-backed securities – GSE’s | 32,082 | 382 | (101 | ) | 32,363 | |||||||||||
| Municipal bonds | 15,527 | 209 | (1 | ) | 15,735 | |||||||||||
| $ | 61,695 | $ | 689 | $ | (127 | ) | $ | 62,257 | ||||||||
Securities with a carrying value of $7.5 million and $34.3 million at December 31, 2017 and 2016, respectively, were pledged to secure public monies on deposit as required by law, customer repurchase agreements, and access to the Federal Reserve Discount Window.
- 92 -
| SELECT BANCORP, INC. |
| NOTES TO CONSOLIDATED FINANCIAL STATEMENTS |
| Years Ended December 31, 2017, 2016 and 2015 |
NOTE D - INVESTMENT SECURITIES (Continued)
The following tables show gross unrealized losses and fair value, aggregated by investment category and length of time that the individual securities have been in a continuous unrealized loss position as of December 31, 2017 and 2016.
| 2017 | ||||||||||||||||||||||||
| Less Than 12 Months | 12 Months or More | Total | ||||||||||||||||||||||
| Fair | Unrealized | Fair | Unrealized | Fair | Unrealized | |||||||||||||||||||
| value | losses | value | losses | value | losses | |||||||||||||||||||
| (dollars in thousands) | ||||||||||||||||||||||||
| Securities available for sale: | ||||||||||||||||||||||||
| U.S. government agencies – GSE’s | $ | 1,651 | $ | (9 | ) | $ | 1,415 | $ | (16 | ) | $ | 3,066 | $ | (25 | ) | |||||||||
| Mortgage-backed securities- GSE’s | 8,137 | (55 | ) | 2,449 | (45 | ) | 10,586 | (100 | ) | |||||||||||||||
| Corporate bonds | 1,752 | (14 | ) | - | - | 1,752 | (14 | ) | ||||||||||||||||
| Municipal bonds | 1,101 | 0 | - | - | 1,101 | - | ||||||||||||||||||
| Total temporarily impaired securities | $ | 12,641 | $ | (78 | ) | $ | 3,864 | $ | (61 | ) | $ | 16,505 | $ | (139 | ) | |||||||||
At December 31, 2017, the Company had two AFS mortgage-backed GSE’s and two U.S Government agencies – GSE’s with an unrealized loss for twelve or more consecutive months totaling $61,000. The Company had 16 AFS securities with a loss for twelve months or less. Two U.S. government agency GSE’s, three municipals, two corporates and nine mortgage-backed GSE’s had unrealized losses for less than twelve months totaling $78,000 at December 31, 2017. All unrealized losses are attributable to the general trend of interest rates and the abnormal spreads of all debt instruments to U.S. Treasury securities. The Company did not incur a loss on any securities sold during 2017.
| 2016 | ||||||||||||||||||||||||
| Less Than 12 Months | 12 Months or More | Total | ||||||||||||||||||||||
| Fair | Unrealized | Fair | Unrealized | Fair | Unrealized | |||||||||||||||||||
| value | losses | value | losses | value | losses | |||||||||||||||||||
| (dollars in thousands) | ||||||||||||||||||||||||
| Securities available for sale: | ||||||||||||||||||||||||
| U.S. government agencies – GSE’s | $ | 2,748 | $ | (13 | ) | $ | 1,651 | $ | (12 | ) | $ | 4,399 | $ | (25 | ) | |||||||||
| Mortgage-backed securities- GSE’s | 8,778 | (101 | ) | - | - | 8,778 | (101 | ) | ||||||||||||||||
| Municipal bonds | 110 | (1 | ) | - | - | 110 | (1 | ) | ||||||||||||||||
| Total temporarily impaired securities | $ | 11,636 | $ | (115 | ) | $ | 1,651 | $ | (12 | ) | $ | 13,287 | $ | (127 | ) | |||||||||
- 93 -
| SELECT BANCORP, INC. |
| NOTES TO CONSOLIDATED FINANCIAL STATEMENTS |
| Years Ended December 31, 2017, 2016 and 2015 |
NOTE D - INVESTMENT SECURITIES (Continued)
At December 31, 2016, the Company had two AFS securities with an unrealized loss for twelve or more consecutive months. The two U.S. government agency GSE’s had unrealized losses for more than twelve months totaling $12,000 at December 31, 2016. Two U.S. government agency GSE’s, one municipal and eight mortgage-backed GSE’s had unrealized losses for less than twelve months totaling $115,000 at December 31, 2016. All unrealized losses are attributable to the general trend of interest rates and the abnormal spreads of all debt instruments to U.S. Treasury securities. The Company did not incur a loss on any securities sold during 2016.
Since none of the unrealized losses relate to the liquidity of the securities or the issuer’s ability to honor redemption obligations and the Company has the intent and ability to hold these securities to recovery, no other than temporary impairments were identified for these investments having unrealized losses for the periods ended December 31, 2017 and December 31, 2016. In 2017 the Company realized gains of $1,000 on proceeds of $22.0 million related to the disposal of fifty one securities, in 2016 the Company realized gains of $22,000 on proceeds of $624,000 related to the disposal of eleven securities and in 2015 the Company had gains of $332,000 on proceeds of $8.1 million related to the disposal of forty-three securities.
- 94 -
| SELECT BANCORP, INC. |
| NOTES TO CONSOLIDATED FINANCIAL STATEMENTS |
| Years Ended December 31, 2017, 2016 and 2015 |
NOTE D - INVESTMENT SECURITIES (Continued)
The following table sets forth certain information regarding the amortized costs, carrying values and contractual maturities of the Company’s investment portfolio at December 31, 2017.
| Amortized | Fair | |||||||
| Cost | Value | |||||||
| (dollars in thousands) | ||||||||
| Securities available for sale: | ||||||||
| U.S. government agencies – GSE’s | ||||||||
| Due within one year | $ | 324 | $ | 327 | ||||
| Due after one but within five years | 9,636 | 9,718 | ||||||
| Due after five but within ten years | 3,155 | 3,189 | ||||||
| Due after ten years | 126 | 130 | ||||||
| 13,241 | 13,364 | |||||||
| Mortgage-backed securities – GSE’s | ||||||||
| Due within one year | - | - | ||||||
| Due after one but within five years | 27,667 | 27,774 | ||||||
| Due after five but within ten years | 1,904 | 1,910 | ||||||
| Due after ten years | - | - | ||||||
| 29,571 | 29,684 | |||||||
| Corporate bonds | ||||||||
| Due within one year | - | - | ||||||
| Due after one but within five years | 593 | 607 | ||||||
| Due after five but within ten years | 1,265 | 1,281 | ||||||
| Due after ten years | - | - | ||||||
| 1,858 | 1,888 | |||||||
| Municipal bonds | ||||||||
| Due within one year | 651 | 653 | ||||||
| Due after one but within five years | 7,522 | 7,600 | ||||||
| Due after five but within ten years | 1,499 | 1,510 | ||||||
| Due after ten years | 8,911 | 9,075 | ||||||
| 18,583 | 18,838 | |||||||
| Total securities available for sale | ||||||||
| Due within one year | 975 | 980 | ||||||
| Due after one but within five years | 45,418 | 45,699 | ||||||
| Due after five but within ten years | 7,823 | 7,890 | ||||||
| Due after ten years | 9,037 | 9,205 | ||||||
| $ | 63,253 | $ | 63,774 | |||||
For purposes of the maturity table, mortgage-backed securities, which are not due at a single maturity date, have been allocated over maturity groupings based on the weighted-average contractual maturities of underlying collateral. The mortgage-backed securities may mature earlier than their weighted-average contractual maturities because of principal prepayments.
- 95 -
| SELECT BANCORP, INC. |
| NOTES TO CONSOLIDATED FINANCIAL STATEMENTS |
| Years Ended December 31, 2017, 2016 and 2015 |
NOTE E - LOANS
The following is a summary of loans at December 31, 2017 and 2016:
| 2017 | 2016 | |||||||||||||||
| Percent | Percent | |||||||||||||||
| Amount | of total | Amount | of total | |||||||||||||
| (dollars in thousands) | ||||||||||||||||
| Real estate loans: | ||||||||||||||||
| 1-to-4 family residential | $ | 156,901 | 15.97 | % | $ | 97,978 | 14.47 | % | ||||||||
| Commercial real estate | 403,100 | 41.02 | % | 281,723 | 41.60 | % | ||||||||||
| Multi-family residential | 76,983 | 7.83 | % | 56,119 | 8.29 | % | ||||||||||
| Construction | 177,933 | 18.11 | % | 100,911 | 14.90 | % | ||||||||||
| Home equity lines of credit (“HELOC”) | 52,606 | 5.35 | % | 41,158 | 6.08 | % | ||||||||||
| Total real estate loans | 867,523 | 88.28 | % | 577,889 | 85.34 | % | ||||||||||
| Other loans: | ||||||||||||||||
| Commercial and industrial | 106,164 | 10.80 | % | 90,678 | 13.39 | % | ||||||||||
| Loans to individuals | 10,097 | 1.04 | % | 9,756 | 1.44 | % | ||||||||||
| Overdrafts | 147 | 0.01 | % | 71 | 0.01 | % | ||||||||||
| Total other loans | 116,408 | 11.85 | % | 100,505 | 14.84 | % | ||||||||||
| Gross loans | 983,931 | 678,394 | ||||||||||||||
| Less deferred loan origination fees, net | (1,305 | ) | (.13 | )% | (1,199 | ) | (.18 | )% | ||||||||
| Total loans | 982,626 | 100.00 | % | 677,195 | 100.00 | % | ||||||||||
| Allowance for loan losses | (8,835 | ) | (8,411 | ) | ||||||||||||
| Total loans, net | $ | 973,791 | $ | 668,784 | ||||||||||||
Loans are primarily made in central and eastern North Carolina and northwest South Carolina. Real estate loans can be affected by the condition of the local real estate market and can be affected by the local economic conditions.
At December 31, 2017, the Company had pre-approved but unused lines and letters of credit totaling $178.1 million. In management’s opinion, these commitments, and undisbursed proceeds on loans reflected above, represent no more than normal lending risk to the Company and will be funded from normal sources of liquidity.
- 96 -
| SELECT BANCORP, INC. |
| NOTES TO CONSOLIDATED FINANCIAL STATEMENTS |
| Years Ended December 31, 2017, 2016 and 2015 |
NOTE E - LOANS (Continued)
A description of the various loan products provided by the Bank is presented below.
Residential 1-to-4 Family Loans
Residential 1-to-4 family loans are mortgage loans that typically convert from construction loans into permanent financing and are secured by properties within the Bank’s market areas.
Commercial Real Estate Loans
Commercial real estate loans are underwritten based on the borrower’s ability to generate adequate cash flow to repay the subject debt within reasonable terms. Commercial real estate loans typically include both owner and non-owner occupied properties with higher principal loan amounts and the repayment of these loans is generally dependent on the successful management of the property. Commercial real estate loans are sensitive to market and general economic conditions. Repayment analysis must be performed and consists of an identified primary/cash flow source of repayment and a secondary/liquidation source of repayment. The primary source of repayment is cash flow from income generated from rental or lease of the property. However, the cash flow can be supplemented with the borrower's and guarantor's global cash flow position. Other credit issues such as the business fundamentals and financial strength of the borrower/guarantor can be considered in determining adequacy of repayment ability. The secondary source of repayment is liquidation of the collateral, supplemented by liquidation cushion provided by the financial assets of the borrower/guarantor. Management monitors and evaluates commercial real estate loans based on collateral, market area, and risk grade.
Multi-family Residential Loans
Multi-family residential loans are typically nonfarm properties with 5 or more dwelling units in structures which include apartment buildings used primarily to accommodate households on a more or less permanent basis. Successful performance of these types of loans is primarily dependent on occupancy rates, rental rates, and property management.
Construction Loans
Construction loans are non-revolving extensions of credit secured by real property of which the proceeds are used to acquire and develop land and to construct commercial or residential buildings. The primary source of repayment for these types of loans is the sale of the improved property or permanent financing in which case the property is expected to generate the cash flow necessary for repayment on a permanent loan basis. Property cash flow may be supplemented with financial support from the borrowers/guarantors. Proper underwriting of a construction loan consists of the initial process of obtaining, analyzing, and approving various aspects of information pertaining to: the analysis of the permanent financing source, creditworthiness of the borrower and guarantors, ability of contractor to perform under the terms of the contract, and the feasibility, marketability, and valuation of the project.
Also, consideration is given to the cost of the project and sources of funds needed to complete construction as well as identifying any sources of equity funding. Construction loans are traditionally considered to be higher risk loans involving technical and legal requirements inherently different from other types of loans; however with thorough credit underwriting, proper loan structure, and diligent loan servicing, these risks can be mitigated. Some examples of risks inherent in this type of lending include: underestimated costs, inflation of material and labor costs, site difficulties (i.e. rock, soil), project not built to plans, weather delays and natural disasters, borrower/contractor/subcontractor disputes which prompt liens, and interest rates increasing beyond budget.
- 97 -
| SELECT BANCORP, INC. |
| NOTES TO CONSOLIDATED FINANCIAL STATEMENTS |
| Years Ended December 31, 2017, 2016 and 2015 |
NOTE E - LOANS (Continued)
Home Equity Lines of Credit
Home equity lines of credit are consumer-purpose revolving extensions of credit which are secured by first or second liens on owner-occupied residential real estate. Appropriate risk management and compliance practices are exercised to ensure that loan-to-value, lien perfection, and compliance risks are addressed and managed within the Bank’s established guidelines. The degree of utilization of revolving commitments within this loan segment is reviewed periodically to identify changes in the behavior of this borrowing group.
Commercial and Industrial Loans
Commercial and industrial loans are underwritten after evaluating and understanding the borrower’s ability to generate positive cash flow, operate profitably and prudently expand its business. Underwriting standards are designed to promote relationships to include a full range of loan, deposit, and cash management services. Commercial and industrial loans are primarily made based on the identified cash flows of the borrower and secondarily on the underlying collateral provided by the borrower and the guarantors. The cash flows of the borrower, however, may not be as expected and the collateral securing these loans may fluctuate in value. In the case of loans secured by accounts receivable, the availability of funds for repayment can be impacted by the borrower’s ability to collect amounts due from its customers.
Loans to Individuals
Consumer loans are approved using Bank policies and procedures established to evaluate each credit request. All lending decisions and credit risks are clearly documented. Several factors are considered in making these decisions such as credit score, adjusted net worth, liquidity, debt ratio, disposable income, credit history, and loan-to-value of the collateral. This process, combined with the relatively smaller loan amounts, spreads the risk among many individual borrowers.
Overdrafts
Overdrafts on customer accounts are classified as loans for reporting purposes.
- 98 -
| SELECT BANCORP, INC. |
| NOTES TO CONSOLIDATED FINANCIAL STATEMENTS |
| Years Ended December 31, 2017, 2016 and 2015 |
NOTE E - LOANS (Continued)
Non-Accrual and Past Due Loans
The following tables present as of December 31, 2017 and 2016 an age analysis of past due loans, segregated by class of loans:
| 30+ | Non- | Total | ||||||||||||||||||
| Days | Accrual | Past | Total | |||||||||||||||||
| 2017 | Past Due | Loans | Due | Current | Loans | |||||||||||||||
| (dollars in thousands) | ||||||||||||||||||||
| Total Loans | ||||||||||||||||||||
| Commercial and industrial | $ | 611 | $ | 96 | $ | 707 | $ | 105,457 | $ | 106,164 | ||||||||||
| Construction | 386 | 384 | 770 | 177,163 | 177,933 | |||||||||||||||
| Multi-family residential | 30 | - | 30 | 76,953 | 76,983 | |||||||||||||||
| Commercial real estate | 1,464 | 528 | 1,992 | 401,108 | 403,100 | |||||||||||||||
| Loans to individuals & overdrafts | 22 | 7 | 29 | 10,215 | 10,244 | |||||||||||||||
| 1-to-4 family residential | 3,545 | 771 | 4,316 | 152,585 | 156,901 | |||||||||||||||
| HELOC | 103 | 329 | 432 | 52,174 | 52,606 | |||||||||||||||
| Deferred loan (fees) cost, net | - | - | - | - | (1,305 | ) | ||||||||||||||
| $ | 6,161 | $ | 2,115 | $ | 8,276 | $ | 975,655 | $ | 982,626 | |||||||||||
| Loans- PCI | ||||||||||||||||||||
| Commercial and industrial | $ | 429 | $ | - | $ | 429 | $ | 2,504 | $ | 2,933 | ||||||||||
| Construction | 360 | - | 360 | 709 | 1,069 | |||||||||||||||
| Multi-family residential | - | - | - | 971 | 971 | |||||||||||||||
| Commercial real estate | 712 | - | 712 | 8,344 | 9,056 | |||||||||||||||
| Loans to individuals & overdrafts | - | - | - | 67 | 67 | |||||||||||||||
| 1-to-4 family residential | 2,634 | - | 2,634 | 6,485 | 9,119 | |||||||||||||||
| HELOC | - | - | - | 46 | 46 | |||||||||||||||
| $ | 4,135 | $ | - | $ | 4,135 | $ | 19,126 | $ | 23,261 | |||||||||||
| Loans- excluding PCI | ||||||||||||||||||||
| Commercial and industrial | $ | 182 | $ | 96 | $ | 278 | $ | 102,953 | $ | 103,231 | ||||||||||
| Construction | 26 | 384 | 410 | 176,454 | 176,864 | |||||||||||||||
| Multi-family residential | 30 | - | 30 | 75,982 | 76,012 | |||||||||||||||
| Commercial real estate | 752 | 528 | 1,280 | 392,764 | 394,044 | |||||||||||||||
| Loans to individuals & overdrafts | 22 | 7 | 29 | 10,148 | 10,177 | |||||||||||||||
| 1-to-4 family residential | 911 | 771 | 1,682 | 146,100 | 147,782 | |||||||||||||||
| HELOC | 103 | 329 | 432 | 52,128 | 52,560 | |||||||||||||||
| Deferred loan (fees) cost, net | - | - | - | - | (1,305 | ) | ||||||||||||||
| $ | 2,026 | $ | 2,115 | $ | 4,141 | $ | 956,529 | $ | 959,365 | |||||||||||
- 99 -
| SELECT BANCORP, INC. |
| NOTES TO CONSOLIDATED FINANCIAL STATEMENTS |
| Years Ended December 31, 2017, 2016 and 2015 |
NOTE E - LOANS (Continued)
Non-Accrual and Past Due Loans
| 30+ | Non- | Total | ||||||||||||||||||
| Days | Accrual | Past | Total | |||||||||||||||||
| 2016 | Past Due | Loans | Due | Current | Loans | |||||||||||||||
| (dollars in thousands) | ||||||||||||||||||||
| Total Loans | ||||||||||||||||||||
| Commercial and industrial | $ | 1,459 | $ | 73 | $ | 1,532 | $ | 89,146 | $ | 90,678 | ||||||||||
| Construction | 221 | 151 | 372 | 100,539 | 100,911 | |||||||||||||||
| Multi-family residential | 46 | 346 | 392 | 55,727 | 56,119 | |||||||||||||||
| Commercial real estate | 589 | 3,807 | 4,396 | 277,327 | 281,723 | |||||||||||||||
| Loans to individuals & overdrafts | 23 | 46 | 69 | 9,758 | 9,827 | |||||||||||||||
| 1-to-4 family residential | 631 | 602 | 1,233 | 96,745 | 97,978 | |||||||||||||||
| HELOC | 24 | 780 | 804 | 40,354 | 41,158 | |||||||||||||||
| Deferred loan (fees) cost, net | - | - | - | - | (1,199 | ) | ||||||||||||||
| $ | 2,993 | $ | 5,805 | $ | 8,798 | $ | 669,596 | $ | 677,195 | |||||||||||
| Loans- PCI | ||||||||||||||||||||
| Commercial and industrial | $ | 29 | $ | 73 | $ | 102 | $ | 117 | $ | 219 | ||||||||||
| Construction | - | 83 | 83 | 849 | 932 | |||||||||||||||
| Multi-family residential | - | - | - | 669 | 669 | |||||||||||||||
| Commercial real estate | 404 | - | 404 | 7,770 | 8,174 | |||||||||||||||
| Loans to individuals & overdrafts | - | - | - | 100 | 100 | |||||||||||||||
| 1-to-4 family residential | 122 | 373 | 495 | 6,934 | 7,429 | |||||||||||||||
| HELOC | - | - | - | 197 | 197 | |||||||||||||||
| $ | 555 | $ | 529 | $ | 1,084 | $ | 16,636 | $ | 17,720 | |||||||||||
| Loans- excluding PCI | ||||||||||||||||||||
| Commercial and industrial | $ | 1,430 | $ | - | $ | 1,430 | $ | 89,029 | $ | 90,459 | ||||||||||
| Construction | 221 | 68 | 289 | 99,690 | 99,979 | |||||||||||||||
| Multi-family residential | 46 | 346 | 392 | 55,058 | 55,450 | |||||||||||||||
| Commercial real estate | 185 | 3,807 | 3,992 | 269,557 | 273,549 | |||||||||||||||
| Loans to individuals & overdrafts | 23 | 46 | 69 | 9,658 | 9,727 | |||||||||||||||
| 1-to-4 family residential | 509 | 229 | 738 | 89,811 | 90,549 | |||||||||||||||
| HELOC | 24 | 780 | 804 | 40,157 | 40,961 | |||||||||||||||
| Deferred loan (fees) cost, net | - | - | - | - | (1,199 | ) | ||||||||||||||
| $ | 2,438 | $ | 5,276 | $ | 7,714 | $ | 652,960 | $ | 659,475 | |||||||||||
There were eleven loans in the aggregate amount of $1.5 million greater than 90 days past due and still accruing interest at December 31, 2017 and there were three loans in the aggregate amount of $529,000 greater than 90 days past due and still accruing interest at December 31, 2016. All loans greater than 90 days past due and still accruing are acquired loans that are considered past due rather than non-accrual loans due to the accounting treatment of acquired loans. In accordance with the ASC 310-20 guidance, if the loan pays different than contractually required, then a discount / (premium) adjustment is made in order to maintain the same effective interest rate.
- 100 -
| SELECT BANCORP, INC. |
| NOTES TO CONSOLIDATED FINANCIAL STATEMENTS |
| Years Ended December 31, 2017, 2016 and 2015 |
NOTE E - LOANS (Continued)
Non-Accrual and Past Due Loans
Loans are placed on non-accrual status when it has been determined that all contractual principal and interest will not be received. Any payments received on these loans are applied to principal first and then to interest only after all principal has been collected. Impaired loans include all loans in non-accrual status, all troubled debt restructures, all substandard loans that are deemed to be collateral dependent, and other loans that management determines require reserves. In the case of an impaired loan that is still on accrual basis, payments are applied to both principal and interest.
- 101 -
| SELECT BANCORP, INC. |
| NOTES TO CONSOLIDATED FINANCIAL STATEMENTS |
| Years Ended December 31, 2017, 2016 and 2015 |
NOTE E - LOANS (Continued)
Impaired Loans
The following tables present information on loans, excluding PCI loans and loans evaluated collectively as a homogenous group, that were considered to be impaired as of December 31, 2017 and December 31, 2016:
| December 31, 2017 | ||||||||||||||||||||
| Contractual | Year to Date | |||||||||||||||||||
| Unpaid | Related | Average | Interest Income | |||||||||||||||||
| Recorded | Principal | Allowance | Recorded | Recognized on | ||||||||||||||||
| Investment | Balance | for Loan Losses | Investment | Impaired Loans | ||||||||||||||||
| (dollars in thousands) | ||||||||||||||||||||
| 2017: | ||||||||||||||||||||
| With no related allowance recorded: | ||||||||||||||||||||
| Commercial and industrial | $ | 940 | $ | 1,234 | $ | - | $ | 1,203 | $ | 97 | ||||||||||
| Construction | 385 | 490 | - | 308 | 30 | |||||||||||||||
| Commercial real estate | 4,428 | 5,606 | - | 4,396 | 264 | |||||||||||||||
| Loans to individuals & overdrafts | 1 | 1 | - | - | - | |||||||||||||||
| Multi-family residential | 234 | 234 | - | 290 | 12 | |||||||||||||||
| HELOC | 602 | 926 | - | 887 | 44 | |||||||||||||||
| 1-to-4 family residential | 1,077 | 1,209 | - | 842 | 54 | |||||||||||||||
| Subtotal: | 7,667 | 9,700 | - | 7,926 | 501 | |||||||||||||||
| With an allowance recorded: | ||||||||||||||||||||
| Commercial and industrial | 142 | 142 | 50 | 72 | 8 | |||||||||||||||
| Construction | - | - | - | - | - | |||||||||||||||
| Commercial real estate | - | - | - | - | - | |||||||||||||||
| Loans to individuals & overdrafts | - | - | - | - | - | |||||||||||||||
| Multi-family Residential | - | - | - | - | - | |||||||||||||||
| HELOC | 202 | 202 | 11 | 249 | 12 | |||||||||||||||
| 1-to-4 family residential | - | - | - | - | - | |||||||||||||||
| Subtotal: | 344 | 344 | 61 | 321 | 20 | |||||||||||||||
| Totals: | ||||||||||||||||||||
| Commercial | 6,129 | 7,706 | 50 | 6,269 | 411 | |||||||||||||||
| Consumer | 1 | 1 | - | - | - | |||||||||||||||
| Residential | 1,881 | 2,337 | 11 | 1,978 | 110 | |||||||||||||||
| Grand Total: | $ | 8,011 | $ | 10,044 | $ | 61 | $ | 8,247 | $ | 521 | ||||||||||
Impaired loans at December 31, 2017 were approximately $8.0 million and were comprised of $2.1 million in non-accrual loans and $5.9 million in loans still in accruing status. Recorded investment represents the current principal balance for the loan. Approximately $344,000 of the $8.0 million in impaired loans at December 31, 2017 had specific allowances aggregating $61,000 while the remaining $7.7 million had no specific allowances recorded. Of the $7.7 million with no allowance recorded, partial charge-offs to date amounted to $2.0 million.
- 102 -
| SELECT BANCORP, INC. |
| NOTES TO CONSOLIDATED FINANCIAL STATEMENTS |
| Years Ended December 31, 2017, 2016 and 2015 |
NOTE E - LOANS (Continued)
Impaired Loans (Continued)
| December 31, 2016 | ||||||||||||||||||||
| Contractual | Year to Date | |||||||||||||||||||
| Unpaid | Related | Average | Interest Income | |||||||||||||||||
| Recorded | Principal | Allowance | Recorded | Recognized on | ||||||||||||||||
| Investment | Balance | for Loan Losses | Investment | Impaired Loans | ||||||||||||||||
| (dollars in thousands) | ||||||||||||||||||||
| 2016: | ||||||||||||||||||||
| With no related allowance recorded: | ||||||||||||||||||||
| Commercial and industrial | $ | 46 | $ | 46 | $ | - | $ | 23 | $ | 4 | ||||||||||
| Construction | 231 | 318 | - | 423 | 9 | |||||||||||||||
| Commercial real estate | 4,364 | 5,983 | - | 4,685 | 205 | |||||||||||||||
| Loans to individuals & overdrafts | 1,139 | 1,144 | - | 622 | 69 | |||||||||||||||
| Multi-family residential | 346 | 365 | - | 387 | 19 | |||||||||||||||
| HELOC | 1,041 | 1,378 | - | 870 | 51 | |||||||||||||||
| 1-to-4 family residential | 1,000 | 1,278 | - | 1,530 | 83 | |||||||||||||||
| Subtotal: | 8,167 | 10,512 | - | 8,540 | 440 | |||||||||||||||
| With an allowance recorded: | ||||||||||||||||||||
| Commercial and industrial | - | - | - | - | - | |||||||||||||||
| Construction | - | - | - | - | - | |||||||||||||||
| Commercial real estate | 2,496 | 2,905 | 80 | 1,872 | 40 | |||||||||||||||
| Loans to individuals & overdrafts | 1 | 1 | 1 | 9 | - | |||||||||||||||
| Multi-family Residential | - | - | - | - | - | |||||||||||||||
| HELOC | 34 | 35 | 19 | 17 | 1 | |||||||||||||||
| 1-to-4 family residential | 296 | 296 | 17 | 293 | 14 | |||||||||||||||
| Subtotal: | 2,827 | 3,237 | 117 | 2,191 | 55 | |||||||||||||||
| Totals: | ||||||||||||||||||||
| Commercial | 7,483 | 9,617 | 80 | 7,390 | 277 | |||||||||||||||
| Consumer | 1,140 | 1,145 | 1 | 631 | 69 | |||||||||||||||
| Residential | 2,371 | 2,987 | 36 | 2,710 | 149 | |||||||||||||||
| Grand Total: | $ | 10,994 | $ | 13,749 | $ | 117 | $ | 10,731 | $ | 495 | ||||||||||
Impaired loans at December 31, 2016 were approximately $11.0 million and were comprised of $5.8 million in non-accrual loans and $5.2 million in loans still in accruing status. Recorded investment represents the current principal balance for the loan. Approximately $2.8 million of the $11.0 million in impaired loans at December 31, 2016 had specific allowances aggregating $117,000 while the remaining $8.2 million had no specific allowances recorded. Of the $8.2 million with no allowance recorded, partial charge-offs to date amounted to $2.3 million with a remaining recorded amount of $3.2 million.
- 103 -
| SELECT BANCORP, INC. |
| NOTES TO CONSOLIDATED FINANCIAL STATEMENTS |
| Years Ended December 31, 2017, 2016 and 2015 |
NOTE E - LOANS (Continued)
Troubled Debt Restructurings
The following tables present loans that were modified as troubled debt restructurings (“TDRs”) within the previous twelve months with a breakdown of the types of concessions made by loan class during the twelve months ended December 31, 2017 and 2016:
| Twelve Months Ended December 31, 2017 | ||||||||||||
| Pre-Modification | Post-Modification | |||||||||||
| Number | Outstanding | Outstanding | ||||||||||
| of | Recorded | Recorded | ||||||||||
| loans | Investments | Investments | ||||||||||
| (dollars in thousands) | ||||||||||||
| Extended payment terms: | ||||||||||||
| Commercial and industrial | 4 | 602 | 598 | |||||||||
| Commercial real estate | 3 | 845 | 839 | |||||||||
| 1-to-4 family residential | 2 | 86 | 82 | |||||||||
| HELOC | 1 | 126 | 126 | |||||||||
| Total | 10 | $ | 1,659 | $ | 1,645 | |||||||
As noted in the tables above, there were ten loans that were considered TDRs during the year ended December 31, 2017, for reasons due to extended terms. These loans were renewed at terms that vary from those that the Company would enter into for new loans of this type.
| Twelve Months Ended December 31, 2016 | ||||||||||||
| Pre-Modification | Post-Modification | |||||||||||
| Number | Outstanding | Outstanding | ||||||||||
| of | Recorded | Recorded | ||||||||||
| loans | Investments | Investments | ||||||||||
| (dollars in thousands) | ||||||||||||
| Extended payment terms: | ||||||||||||
| Commercial and industrial | 6 | 1,326 | 1,194 | |||||||||
| Construction | 1 | 139 | 66 | |||||||||
| Commercial real estate | 1 | 923 | 911 | |||||||||
| 1-to-4 family residential | 2 | 126 | 126 | |||||||||
| Total | 10 | $ | 2,514 | $ | 2,297 | |||||||
As noted in the tables above, there were ten loans that were considered TDRs during the year ended December 31, 2016, for reasons due to extended terms. These loans were renewed at terms that vary from those that the Company would enter into for new loans of this type.
- 104 -
| SELECT BANCORP, INC. |
| NOTES TO CONSOLIDATED FINANCIAL STATEMENTS |
| Years Ended December 31, 2017, 2016 and 2015 |
NOTE E - LOANS (continued)
Troubled Debt Restructurings (Continued)
The following tables present loans that were modified as TDRs within the previous twelve months for which there was a payment default together with a breakdown of the types of concessions made by loan class during the twelve months ended December 31, 2017 and 2016:
| Twelve months ended | ||||||||
| December 31, 2017 | ||||||||
| Number | Recorded | |||||||
| of loans | investment | |||||||
| (dollars in thousands) | ||||||||
| Extended payment terms: | ||||||||
| Commercial and industrial | 1 | 37 | ||||||
| 1-to-4 family residential | 1 | 13 | ||||||
| Total | 2 | $ | 50 | |||||
| Twelve months ended | ||||||||
| December 31, 2016 | ||||||||
| Number | Recorded | |||||||
| of loans | investment | |||||||
| (dollars in thousands) | ||||||||
| Extended payment terms: | ||||||||
| Commercial and industrial | 4 | 660 | ||||||
| Construction | 1 | 66 | ||||||
| 1-to-4 family residential | 1 | 48 | ||||||
| Total | 6 | $ | 774 | |||||
- 105 -
| SELECT BANCORP, INC. |
| NOTES TO CONSOLIDATED FINANCIAL STATEMENTS |
| Years Ended December 31, 2017, 2016 and 2015 |
NOTE E - LOANS (Continued)
Troubled Debt Restructurings (Continued)
At December 31, 2017, the Company had thirty-six loans with an aggregate balance of $5.8 million that were considered to be troubled debt restructurings. Of those TDRs, twenty-two loans with a balance totaling $4.9 million were still accruing as of December 31, 2017. The remaining fourteen TDRs with a balance totaling $958,000 were in non-accrual status. All TDRs are included in non-performing assets and impaired loans.
Credit Quality Indicators
As part of the on-going monitoring of the credit quality of the loan portfolio, management utilizes a risk grading matrix to assign a risk grade to each of the Company’s loans. All non-consumer loans are graded on a scale of 1 to 9. A description of the general characteristics of these nine different risk grades is as follows:
| · | Risk Grade 1 (Superior) - Credits in this category are virtually risk-free and are well-collateralized by cash-equivalent instruments. The repayment program is well-defined and achievable. Repayment sources are numerous. No material documentation deficiencies or exceptions exist. |
| · | Risk Grade 2 (Very Good) - This grade is reserved for loans secured by readily marketable collateral, or loans within guidelines to borrowers with liquid financial statements. A liquid financial statement is a financial statement with substantial liquid assets relative to debts. These loans have excellent sources of repayment, with no significant identifiable risk of collection, and conform in all respects to Bank policy, guidelines, underwriting standards, and Federal and State regulations (no exceptions of any kind). |
| · | Risk Grade 3 (Good) - These loans have excellent sources of repayment, with no significant identifiable risk of collection. Generally, loans assigned this risk grade will demonstrate the following characteristics: |
| o | Conformity in all respects with Bank policy, guidelines, underwriting standards, and Federal and State regulations (no exceptions of any kind). |
| o | Documented historical cash flow that meets or exceeds required minimum Bank guidelines, or that can be supplemented with verifiable cash flow from other sources. |
| o | Adequate secondary sources to liquidate the debt, including combinations of liquidity, liquidation of collateral, or liquidation value to the net worth of the borrower or guarantor. |
| · | Risk Grade 4 (Acceptable) - This grade is given to acceptable loans. These loans have adequate sources of repayment, with little identifiable risk of collection. Loans assigned this risk grade will demonstrate the following characteristics: |
| o | General conformity to the Bank's policy requirements, product guidelines and underwriting standards, with limited exceptions. Any exceptions that are identified during the underwriting and approval process have been adequately mitigated by other factors. |
| o | Documented historical cash flow that meets or exceeds required minimum Bank guidelines, or that can be supplemented with verifiable cash flow from other sources. |
| o | Adequate secondary sources to liquidate the debt, including combinations of liquidity, liquidation of collateral, or liquidation value to the net worth of the borrower or guarantor. |
- 106 -
| SELECT BANCORP, INC. |
| NOTES TO CONSOLIDATED FINANCIAL STATEMENTS |
| Years Ended December 31, 2017, 2016 and 2015 |
NOTE E - LOANS (Continued)
Credit Quality Indicators (Continued)
| · | Risk Grade 5 (Acceptable With Care) - This grade is given to acceptable loans that show signs of weakness in either adequate sources of repayment or collateral, but have demonstrated mitigating factors that minimize the risk of delinquency or loss. Loans assigned this grade may demonstrate some or all of the following characteristics: |
| o | Additional exceptions to the Bank's policy requirements, product guidelines or underwriting standards that present a higher degree of risk to the Bank. Although the combination and/or severity of identified exceptions is greater, all exceptions have been properly mitigated by other factors. |
| o | Unproven, insufficient or marginal primary sources of repayment that appear sufficient to service the debt at this time. Repayment weaknesses may be due to minor operational issues, financial trends, or reliance on projected (not historic) performance. |
| o | Marginal or unproven secondary sources to liquidate the debt, including combinations of liquidation of collateral and liquidation value to the net worth of the borrower or guarantor. |
| · | Risk Grade 6 (Watch List or Special Mention) – Loans in this category can have the following characteristics: |
| o | Loans with underwriting guideline tolerances and/or exceptions and with no mitigating factors. |
| o | Extending loans that are currently performing satisfactorily but with potential weaknesses that may, if not corrected, weaken the asset or inadequately protect the Bank's position at some future date. Potential weaknesses are the result of deviations from prudent lending practices. |
| o | Loans where adverse economic conditions that develop subsequent to the loan origination that do not jeopardize liquidation of the debt but do substantially increase the level of risk may also warrant this rating. |
| · | Risk Grade 7 (Substandard) - A Substandard loan is inadequately protected by the current sound net worth and paying capacity of the obligor or of the collateral pledged, if any. Loans classified as Substandard must have a well-defined weakness or weaknesses that jeopardize the liquidation of the debt; they are characterized by the distinct possibility that the institution will sustain some loss if the deficiencies are not corrected. Loans consistently not meeting the repayment schedule should be downgraded to substandard. Loans in this category are characterized by deterioration in quality exhibited by any number of well-defined weaknesses requiring corrective action. |
| · | Risk Grade 8 (Doubtful) - Loans classified Doubtful have all the weaknesses inherent in loans classified Substandard, plus the added characteristic that the weaknesses make collection or liquidation in full on the basis of currently existing facts, conditions, and values highly questionable and improbable. However, these loans are not yet rated as loss because certain events may occur which would salvage the debt. |
| · | Risk Grade 9 (Loss) - Loans classified as Loss are considered uncollectable and of such little value that their continuance as bankable assets is not warranted. This classification does not mean that the asset has absolutely no recovery or salvage value, but rather that it is not practical or desirable to defer writing off the loan even though partial recovery may be affected in the future. |
- 107 -
| SELECT BANCORP, INC. |
| NOTES TO CONSOLIDATED FINANCIAL STATEMENTS |
| Years Ended December 31, 2017, 2016 and 2015 |
NOTE E - LOANS (Continued)
Credit Quality Indicators (Continued)
Consumer loans are graded on a scale of 1 to 9. A description of the general characteristics of the 9 risk grades is as follows:
| · | Risk Grades 1 – 5 (Pass) – The loans in this category range from loans secured by cash with no risk of principal deterioration (Risk Grade 1) to loans that show signs of weakness in either adequate sources of repayment or collateral but have demonstrated mitigating factors that minimize the risk of delinquency or loss (Risk Grade 5). |
| · | Risk Grade 6 (Watch List or Special Mention) - Watch list or Special Mention loans include the following characteristics: |
| o | Loans within guideline tolerances or with exceptions of any kind that have not been mitigated by other economic or credit factors. |
| o | Extending loans that are currently performing satisfactorily but with potential weaknesses that may, if not corrected, weaken the asset or inadequately protect the Bank's position at some future date. Potential weaknesses are the result of deviations from prudent lending practices. |
| o | Loans where adverse economic conditions that develop subsequent to the loan origination that don't jeopardize liquidation of the debt but do substantially increase the level of risk may also warrant this rating. |
| · | Risk Grade 7 (Substandard) - A Substandard loan is inadequately protected by the current sound net worth and paying capacity of the obligor or of the collateral pledged, if any. Loans classified as Substandard must have a well-defined weakness or weaknesses that jeopardize the liquidation of the debt; they are characterized by the distinct possibility that the institution will sustain some loss if the deficiencies are not corrected. |
| · | Risk Grade 8 (Doubtful) - Loans classified Doubtful have all the weaknesses inherent in loans classified Substandard, plus the added characteristic that the weaknesses make collection or liquidation in full on the basis of currently existing facts, conditions, and values highly questionable and improbable. However, these loans are not yet rated as loss because certain events may occur which would salvage the debt. |
| · | Risk Grade 9 (Loss) - Loans classified Loss are considered uncollectable and of such little value that their continuance as bankable assets is not warranted. This classification does not mean that the asset has absolutely no recovery or salvage value, but rather that it is not practical or desirable to defer writing off this worthless loan even though partial recovery may be affected in the future. |
- 108 -
| SELECT BANCORP, INC. |
| NOTES TO CONSOLIDATED FINANCIAL STATEMENTS |
| Years Ended December 31, 2017, 2016 and 2015 |
NOTE E - LOANS (Continued)
Credit Quality Indicators (Continued)
The following tables present information on risk ratings of the commercial and consumer loan portfolios, segregated by loan class as of December 31, 2017 and 2016:
Total Loans:
| December 31, 2017 | ||||||||||||||||
| Commercial | ||||||||||||||||
| Credit | ||||||||||||||||
| Exposure By | Commercial | Commercial | ||||||||||||||
| Internally | and | real | Multi-family | |||||||||||||
| Assigned Grade | industrial | Construction | estate | residential | ||||||||||||
| (dollars in thousands) | ||||||||||||||||
| Superior | $ | 1,207 | $ | - | $ | - | $ | - | ||||||||
| Very good | 2,454 | 111 | 420 | - | ||||||||||||
| Good | 13,161 | 11,343 | 46,790 | 11,394 | ||||||||||||
| Acceptable | 44,968 | 40,558 | 249,988 | 46,246 | ||||||||||||
| Acceptable with care | 38,631 | 124,593 | 97,798 | 18,787 | ||||||||||||
| Special mention | 3,172 | 583 | 3,771 | 322 | ||||||||||||
| Substandard | 2,571 | 745 | 4,333 | 234 | ||||||||||||
| Doubtful | - | - | - | - | ||||||||||||
| Loss | - | - | - | - | ||||||||||||
| $ | 106,164 | $ | 177,933 | $ | 403,100 | $ | 76,983 | |||||||||
| Consumer Credit | ||||||||||||||||
| Exposure By | ||||||||||||||||
| Internally | 1-to-4 family | |||||||||||||||
| Assigned Grade | residential | HELOC | ||||||||||||||
| Pass | $ | 149,767 | $ | 51,326 | ||||||||||||
| Special mention | 3,270 | 253 | ||||||||||||||
| Substandard | 3,864 | 1,027 | ||||||||||||||
| $ | 156,901 | $ | 52,606 | |||||||||||||
| Consumer Credit | ||||||||||||||||
| Exposure Based | Loans to | |||||||||||||||
| On Payment | individuals & | |||||||||||||||
| Activity | overdrafts | |||||||||||||||
| Pass | $ | 10,233 | ||||||||||||||
| Non-pass | 11 | |||||||||||||||
| $ | 10,244 | |||||||||||||||
- 109 -
| SELECT BANCORP, INC. |
| NOTES TO CONSOLIDATED FINANCIAL STATEMENTS |
| Years Ended December 31, 2017, 2016 and 2015 |
NOTE E - LOANS (Continued)
Credit Quality Indicators (Continued)
Total Loans:
| December 31, 2016 | ||||||||||||||||
| Commercial | ||||||||||||||||
| Credit | ||||||||||||||||
| Exposure By | Commercial | Commercial | ||||||||||||||
| Internally | and | real | Multi-family | |||||||||||||
| Assigned Grade | industrial | Construction | estate | residential | ||||||||||||
| (dollars in thousands) | ||||||||||||||||
| Superior | $ | 435 | $ | - | $ | - | $ | - | ||||||||
| Very good | 326 | 245 | 460 | - | ||||||||||||
| Good | 13,632 | 4,506 | 36,501 | 12,139 | ||||||||||||
| Acceptable | 35,720 | 12,922 | 152,608 | 29,873 | ||||||||||||
| Acceptable with care | 37,351 | 82,771 | 81,231 | 13,467 | ||||||||||||
| Special mention | 2,905 | 173 | 4,868 | - | ||||||||||||
| Substandard | 309 | 294 | 6,055 | 640 | ||||||||||||
| Doubtful | - | - | - | - | ||||||||||||
| Loss | - | - | - | - | ||||||||||||
| $ | 90,678 | $ | 100,911 | $ | 281,723 | $ | 56,119 | |||||||||
| Consumer Credit | ||||||||||||||||
| Exposure By | ||||||||||||||||
| Internally | 1-to-4 family | |||||||||||||||
| Assigned Grade | residential | HELOC | ||||||||||||||
| Pass | $ | 92,115 | $ | 39,554 | ||||||||||||
| Special mention | 3,015 | 439 | ||||||||||||||
| Substandard | 2,848 | 1,165 | ||||||||||||||
| $ | 97,978 | $ | 41,158 | |||||||||||||
| Consumer Credit | ||||||||||||||||
| Exposure Based | Loans to | |||||||||||||||
| On Payment | individuals & | |||||||||||||||
| Activity | overdrafts | |||||||||||||||
| Pass | $ | 9,820 | ||||||||||||||
| Non-pass | 7 | |||||||||||||||
| $ | 9,827 | |||||||||||||||
- 110 -
| SELECT BANCORP, INC. |
| NOTES TO CONSOLIDATED FINANCIAL STATEMENTS |
| Years Ended December 31, 2017, 2016 and 2015 |
NOTE E - LOANS (Continued)
The process of determining the allowance for loan losses is driven by the risk grade system and the loss experience on non-risk graded homogeneous types of loans. The Bank’s allowance for loan losses is calculated and determined, at a minimum, each fiscal quarter end. The allowance for loan losses represents management’s estimate of the appropriate level of reserve to provide for probable losses inherent in the loan portfolio. In determining the allowance for loan losses and any resulting provision to be charged against earnings, particular emphasis is placed on the results of the loan review process. Consideration is also given to a review of individual loans, historical loan loss experience, the value and adequacy of collateral and economic conditions in the Bank’s market areas. For loans determined to be impaired, the impairment is based on discounted expected cash flows using the loan’s initial effective interest rate or the fair value of the collateral (less selling costs) for certain collateral dependent loans. This evaluation is inherently subjective as it requires material estimates, including the amounts and timing of future cash flows expected to be received on impaired loans that may be susceptible to significant change. In addition, various regulatory agencies, as an integral part of their examination process, periodically review the Bank’s allowance for loan losses. Such agencies may require the Bank to recognize changes to the allowance based on their judgments about information available to them at the time of their examinations. Loans are charged off when in the opinion of management, they are deemed to be uncollectible. Recognized losses are charged against the allowance, and subsequent recoveries are added to the allowance. The Credit Management Committee of the Board of Directors has responsibility for oversight.
Management believes the allowance for loan losses of $8.8 million at December 31, 2017 is adequate to provide for inherent losses in the loan portfolio; however, assessing the adequacy of the allowance is a process that requires continuous evaluation and considerable judgment. Management’s judgments are based on numerous assumptions about current events which it believes to be reasonable, but which may or may not be valid. Thus, there can be no assurance that credit losses in future periods will not exceed the current allowance or that future increases in the allowance will not be required. No assurance can be given that management’s ongoing evaluation of the loan portfolio in light of changing economic conditions and other relevant circumstances will not require significant future additions to the allowance, thus adversely affecting future operating results of the Bank.
Determining the fair value of PCI loans at acquisition required the Company to estimate cash flows expected to result from those loans and to discount those cash flows at appropriate rates of interest. For such loans, the excess of cash flows expected to be collected at acquisition over the estimated fair value is recognized as interest income over the remaining lives of the loans and is called the accretable yield. The difference between contractually required payments at acquisition and the cash flows expected to be collected at acquisition reflects the impact of estimated credit losses and is called the nonaccretable difference. In accordance with GAAP, there was no carry-over of previously established allowance for credit losses from the acquired company.
- 111 -
| SELECT BANCORP, INC. |
| NOTES TO CONSOLIDATED FINANCIAL STATEMENTS |
| Years Ended December 31, 2017, 2016 and 2015 |
NOTE E - LOANS (Continued)
For PCI loans acquired from Legacy Select and Premara, the contractually required payments including principal and interest, cash flows expected to be collected and fair values as of the closing date of the merger and December 31, 2017 and 2016 were:
| December 31, | December 31, | |||||||
| (Dollars in thousands) | 2017 | 2016 | ||||||
| Contractually required payments | $ | 29,285 | $ | 21,761 | ||||
| Nonaccretable difference | 2,717 | 1,415 | ||||||
| Cash flows expected to be collected | 26,568 | 20,346 | ||||||
| Accretable yield | 3,307 | 2,626 | ||||||
| Fair value | $ | 23,261 | $ | 17,720 | ||||
The following table documents changes to the amount of the PCI accretable yield as of December 31, 2017 and 2016 (dollars in thousands):
| 2017 | 2016 | |||||||
| (dollars in thousands) | ||||||||
| Accretable yield, beginning of period | $ | 2,626 | $ | 2,822 | ||||
| Additions | 1,392 | - | ||||||
| Accretion | (1,043 | ) | (1,055 | ) | ||||
| Reclassification from nonaccretable difference | 131 | 261 | ||||||
| Other changes, net | 201 | 598 | ||||||
| Accretable yield, end of period | $ | 3,307 | $ | 2,626 | ||||
Allowance for Loan Losses
The allowance for loan losses is a reserve established through provisions for loan losses charged to income and represents management’s best estimate of probable loan losses inherent within the existing portfolio of loans. The allowance, in the judgment of management, is necessary to reserve for estimated losses and risk inherent in the loan portfolio. The Company’s allowance for loan loss methodology is based on historical loss experience by type of credit and internal risk grade, specific homogeneous risk pools and specific loss allocations, with adjustments for current events and conditions. The Company’s process for determining the appropriate level of reserves is designed to account for changes in credit quality as they occur. The provision for loan losses reflects loan quality trends, including the levels of, and trends related to, past due loans and economic conditions at the local and national levels. It also considers the quality and risk characteristics of the Company’s loan origination and servicing policies and practices.
Individual reserves are calculated according to ASC Section 310-10-35 against loans evaluated individually and deemed to most likely be impaired. Impaired loans include all loans in non-accrual status, all troubled debt restructures, all substandard loans that are deemed to be collateral dependent, and other loans that management determines require reserves.
- 112 -
| SELECT BANCORP, INC. |
| NOTES TO CONSOLIDATED FINANCIAL STATEMENTS |
| Years Ended December 31, 2017, 2016 and 2015 |
NOTE E - LOANS (Continued)
The Company’s allowance for loan losses model calculates historical loss rates using a loss migration analysis associating losses to the risk-graded pool to which they relate for each of the previous twelve quarters. Then, using a twelve quarter look back period, loss factors are calculated for each risk-graded pool.
The model incorporates various internal and external qualitative and environmental factors as described in the Interagency Policy Statement on the Allowance for Loan and Lease Losses, dated December 2006. Input for these factors is determined on the basis of management observation, judgment, and experience. The factors utilized by the Company are as follows:
Internal Factors
| · | Concentrations – Measures the increased risk derived from concentration of credit exposure in particular industry segments within the portfolio. |
| · | Policy exceptions – Measures the risk derived from granting terms outside of underwriting guidelines. |
| · | Compliance exceptions– Measures the risk derived from granting terms outside of regulatory guidelines. |
| · | Document exceptions– Measures the risk exposure resulting from the inability to collect due to improperly executed documents and collateral imperfections. |
| · | Financial information monitoring – Measures the risk associated with not having current borrower financial information. |
| · | Nonaccrual – Reflects increased risk of loans with characteristics that merit nonaccrual status. |
| · | Delinquency – Reflects the increased risk deriving from higher delinquency rates. |
| · | Personnel turnover – Reflects staff competence in various types of lending. |
| · | Portfolio growth – Measures the impact of growth and potential risk derived from new loan production. |
External Factors
| · | GDP growth rate – Impact of general economic factors that affect the portfolio. |
| · | North Carolina unemployment rate – Impact of local economic factors that affect the portfolio. |
| · | South Carolina unemployment rate – Impact of local economic factors that affect the portfolio. |
| · | Peer group delinquency rate – Measures risk associated with the credit requirements of competitors. |
| · | Prime rate change – Measures the effect on the portfolio in the event of changes in the prime lending rate. |
- 113 -
| SELECT BANCORP, INC. |
| NOTES TO CONSOLIDATED FINANCIAL STATEMENTS |
| Years Ended December 31, 2017, 2016 and 2015 |
NOTE E - LOANS (Continued)
Each pool is assigned an adjustment to the potential loss percentage by assessing its characteristics against each of the factors listed above.
Reserves are generally divided into three allocation segments:
| 1. | Individual reserves. These are calculated according to ASC Section 310-10-35 against loans evaluated individually and deemed to most likely be impaired. All loans in non-accrual status and all substandard loans that are deemed to be collateral dependent are assessed for impairment. Loans are deemed uncollectible based on a variety of credit, collateral, documentation and other issues. In the case of uncollectible receivables, the collateral is considered unsecured and therefore fully charged off. |
| 2. | Formula reserves. Formula reserves are held against loans evaluated collectively. Loans are grouped by type or by risk grade, or some combination of the two. Loss estimates are based on historical loss rates for each respective loan group. Formula reserves represent the Company’s best estimate of losses that may be inherent, or embedded, within the group of loans, even if it is not apparent at this time which loans within any group or pool represent those embedded losses. |
| 3. | Qualitative and external reserves. If individual reserves represent estimated losses tied to specific loans, and formula reserves represent estimated losses tied to a pool of loans but not yet to any specific loan, then these reserves represent an estimate of losses that are likely to be incurred, but are not yet tied to any loan or group of loans. |
All information related to the calculation of the three segments, including data analysis, assumptions, and calculations are documented. Assigning specific individual reserve amounts, formula reserve factors, or unallocated amounts based on unsupported assumptions or conclusions is not permitted.
- 114 -
| SELECT BANCORP, INC. |
| NOTES TO CONSOLIDATED FINANCIAL STATEMENTS |
| Years Ended December 31, 2017, 2016 and 2015 |
NOTE E - LOANS (Continued)
The following tables present a roll forward
of the Company’s allowance for loan losses by loan segment for the twelve month periods ended
December 31, 2017, 2016 and 2015, respectively (in thousands):
| 2017 | Commercial | 1 to 4 | Loans to | Multi- | ||||||||||||||||||||||||||||
| and | Commercial | family | individuals & | family | ||||||||||||||||||||||||||||
| Allowance for loan losses | industrial | Construction | real estate | residential | HELOC | overdrafts | residential | Total | ||||||||||||||||||||||||
| Loans – excluding PCI | ||||||||||||||||||||||||||||||||
| Balance, beginning of period 01/01/2017 | $ | 1,211 | $ | 1,301 | $ | 3,448 | $ | 846 | $ | 611 | $ | 317 | $ | 628 | $ | 8,362 | ||||||||||||||||
| Provision for loan losses | (607 | ) | 642 | 754 | 188 | 92 | 55 | 161 | 1,285 | |||||||||||||||||||||||
| Loans charged-off | (73 | ) | (17 | ) | (914 | ) | (22 | ) | (179 | ) | (101 | ) | - | (1,306 | ) | |||||||||||||||||
| Recoveries | 211 | 29 | 16 | 46 | 25 | 34 | 2 | 363 | ||||||||||||||||||||||||
| Balance, end of period 12/31/2017 | $ | 742 | $ | 1,955 | $ | 3,304 | $ | 1,058 | $ | 549 | $ | 305 | $ | 791 | $ | 8,704 | ||||||||||||||||
| PCI Loans | ||||||||||||||||||||||||||||||||
| Balance, beginning of period 01/01/2017 | $ | 37 | $ | - | $ | - | $ | - | $ | 12 | $ | - | $ | - | $ | 49 | ||||||||||||||||
| Provision for loan losses | 28 | - | 66 | - | (12 | ) | - | - | 82 | |||||||||||||||||||||||
| Loans charged-off | - | - | - | - | - | - | - | - | ||||||||||||||||||||||||
| Recoveries | - | - | - | - | - | - | - | - | ||||||||||||||||||||||||
| Total | $ | 65 | $ | - | $ | 66 | $ | - | $ | - | $ | - | $ | - | $ | 131 | ||||||||||||||||
| Total Loans | ||||||||||||||||||||||||||||||||
| Balance, beginning of period 01/01/2017 | $ | 1,248 | $ | 1,301 | $ | 3,448 | $ | 846 | $ | 623 | $ | 317 | $ | 628 | $ | 8,411 | ||||||||||||||||
| Provision for loan losses | (579 | ) | 642 | 820 | 188 | 80 | 55 | 161 | 1,367 | |||||||||||||||||||||||
| Loans charged-off | (73 | ) | (17 | ) | (914 | ) | (22 | ) | (179 | ) | (101 | ) | - | (1,306 | ) | |||||||||||||||||
| Recoveries | 211 | 29 | 16 | 46 | 25 | 34 | 2 | 363 | ||||||||||||||||||||||||
| Balance, end of period 12/31/2017 | $ | 807 | $ | 1,955 | $ | 3,370 | $ | 1,058 | $ | 549 | $ | 305 | $ | 791 | $ | 8,835 | ||||||||||||||||
| Ending Balance: individually evaluated for impairment | $ | 50 | $ | - | $ | - | $ | 11 | $ | - | $ | - | $ | - | $ | 61 | ||||||||||||||||
| Ending Balance: collectively evaluated for impairment | $ | 757 | $ | 1,955 | $ | 3,370 | $ | 1,047 | $ | 549 | $ | 305 | $ | 791 | $ | 8,774 | ||||||||||||||||
| Loans: | ||||||||||||||||||||||||||||||||
| Ending Balance: collectively evaluated for impairment | $ | 105,081 | $ | 177,548 | $ | 398,673 | $ | 155,623 | $ | 52,004 | $ | 10,243 | $ | 76,748 | $ | 975,920 | ||||||||||||||||
| Ending Balance: individually evaluated for impairment | $ | 1,083 | $ | 385 | $ | 4,427 | $ | 1,278 | $ | 602 | $ | 1 | $ | 235 | $ | 8,011 | ||||||||||||||||
| Ending Balance | $ | 106,164 | $ | 177,933 | $ | 403,100 | $ | 156,901 | $ | 52,606 | $ | 10,244 | $ | 76,983 | $ | 983,931 | ||||||||||||||||
Also included in this table are $23.3 million of acquired loans with deteriorated credit quality.
- 115 -
| SELECT BANCORP, INC. |
| NOTES TO CONSOLIDATED FINANCIAL STATEMENTS |
| Years Ended December 31, 2017, 2016 and 2015 |
NOTE E - LOANS (Continued)
| 2016 | Commercial | 1 to 4 | Loans to | Multi- | ||||||||||||||||||||||||||||
| and | Commercial | family | individuals & | family | ||||||||||||||||||||||||||||
| Allowance for loan losses | industrial | Construction | real estate | residential | HELOC | overdrafts | residential | Total | ||||||||||||||||||||||||
| Loans – excluding PCI | ||||||||||||||||||||||||||||||||
| Balance, beginning of period 01/01/2016 | $ | 922 | $ | 1,386 | $ | 3,005 | $ | 605 | $ | 564 | $ | 137 | $ | 393 | $ | 7,012 | ||||||||||||||||
| Provision for loan losses | 449 | (105 | ) | 481 | (51 | ) | 217 | 250 | 235 | 1,476 | ||||||||||||||||||||||
| Loans charged-off | (182 | ) | (2 | ) | (189 | ) | (7 | ) | (205 | ) | (90 | ) | - | (675 | ) | |||||||||||||||||
| Recoveries | 22 | 22 | 151 | 299 | 35 | 20 | - | 549 | ||||||||||||||||||||||||
| Total | $ | 1,211 | $ | 1,301 | $ | 3,448 | $ | 846 | $ | 611 | $ | 317 | $ | 628 | $ | 8,362 | ||||||||||||||||
| PCI Loans | ||||||||||||||||||||||||||||||||
| Balance, beginning of period 01/01/2016 | $ | - | $ | - | $ | - | $ | - | $ | 9 | $ | - | $ | - | $ | 9 | ||||||||||||||||
| Provision for loan losses | 37 | - | - | - | 3 | - | - | 40 | ||||||||||||||||||||||||
| Loans charged-off | - | - | - | - | - | - | - | - | ||||||||||||||||||||||||
| Recoveries | - | - | - | - | - | - | - | - | ||||||||||||||||||||||||
| Total | $ | 37 | $ | - | $ | - | $ | - | $ | 12 | $ | - | $ | - | $ | 49 | ||||||||||||||||
| Total Loans | ||||||||||||||||||||||||||||||||
| Balance, beginning of period 01/01/2016 | $ | 922 | $ | 1,386 | $ | 3,005 | $ | 605 | $ | 573 | $ | 137 | $ | 393 | $ | 7,021 | ||||||||||||||||
| Provision for loan losses | 486 | (105 | ) | 481 | (51 | ) | 220 | 250 | 235 | 1,516 | ||||||||||||||||||||||
| Loans charged-off | (182 | ) | (2 | ) | (189 | ) | (7 | ) | (205 | ) | (90 | ) | - | (675 | ) | |||||||||||||||||
| Recoveries | 22 | 22 | 151 | 299 | 35 | 20 | - | 549 | ||||||||||||||||||||||||
| Balance, end of period 12/31/2016 | $ | 1,248 | $ | 1,301 | $ | 3,448 | $ | 846 | $ | 623 | $ | 317 | $ | 628 | $ | 8,411 | ||||||||||||||||
| Ending Balance: individually evaluated for impairment | $ | - | $ | - | $ | 80 | $ | 17 | $ | 19 | $ | 1 | $ | - | $ | 117 | ||||||||||||||||
| Ending Balance: collectively evaluated for impairment | $ | 1,248 | $ | 1,301 | $ | 3,368 | $ | 829 | $ | 604 | $ | 316 | $ | 628 | $ | 8,294 | ||||||||||||||||
| Loans: | ||||||||||||||||||||||||||||||||
| Ending Balance: collectively evaluated for impairment | $ | 90,632 | $ | 100,680 | $ | 274,863 | $ | 96,682 | $ | 40,083 | $ | 8,687 | $ | 55,773 | $ | 667,400 | ||||||||||||||||
| Ending Balance: individually evaluated for impairment | $ | 46 | $ | 231 | $ | 6,860 | $ | 1,296 | $ | 1,075 | $ | 1,140 | $ | 346 | $ | 10,994 | ||||||||||||||||
| Ending Balance | $ | 90,678 | $ | 100,911 | $ | 281,723 | $ | 97,978 | $ | 41,158 | $ | 9,827 | $ | 56,119 | $ | 678,394 | ||||||||||||||||
Also included in this table are $17.7 million of acquired loans with deteriorated credit quality.
- 116 -
| SELECT BANCORP, INC. |
| NOTES TO CONSOLIDATED FINANCIAL STATEMENTS |
| Years Ended December 31, 2017, 2016 and 2015 |
NOTE E - LOANS (Continued)
| 2015 | Commercial | 1 to 4 | Loans to | Multi- | ||||||||||||||||||||||||||||
| and | Commercial | family | individuals & | family | ||||||||||||||||||||||||||||
| Allowance for loan losses | industrial | Construction | real estate | residential | HELOC | overdrafts | residential | Total | ||||||||||||||||||||||||
| Loans – excluding PCI | ||||||||||||||||||||||||||||||||
| Balance, beginning of period 01/01/2015 | $ | 803 | $ | 1,103 | $ | 2,914 | $ | 630 | $ | 930 | $ | 185 | $ | 279 | $ | 6,844 | ||||||||||||||||
| Provision for loan losses | 212 | 333 | 670 | (57 | ) | (272 | ) | (18 | ) | 13 | 881 | |||||||||||||||||||||
| Loans charged-off | (141 | ) | (79 | ) | (663 | ) | (70 | ) | (115 | ) | (54 | ) | (5 | ) | (1,127 | ) | ||||||||||||||||
| Recoveries | 48 | 29 | 84 | 102 | 21 | 24 | 106 | 414 | ||||||||||||||||||||||||
| Total | $ | 922 | $ | 1,386 | $ | 3,005 | $ | 605 | $ | 564 | $ | 137 | $ | 393 | $ | 7,012 | ||||||||||||||||
| PCI Loans | ||||||||||||||||||||||||||||||||
| Balance, beginning of period 01/01/2015 | $ | - | $ | - | $ | - | $ | - | $ | - | $ | - | $ | - | $ | - | ||||||||||||||||
| Provision for loan losses | - | - | - | - | 9 | - | - | 9 | ||||||||||||||||||||||||
| Loans charged-off | - | - | - | - | - | - | - | - | ||||||||||||||||||||||||
| Recoveries | - | - | - | - | - | - | - | - | ||||||||||||||||||||||||
| Total | $ | - | $ | - | $ | - | $ | - | $ | 9 | $ | - | $ | - | $ | 9 | ||||||||||||||||
| Total Loans | ||||||||||||||||||||||||||||||||
| Balance, beginning of period 01/01/2015 | $ | 803 | $ | 1,103 | $ | 2,914 | $ | 630 | $ | 930 | $ | 185 | $ | 279 | $ | 6,844 | ||||||||||||||||
| Provision for loan losses | 212 | 333 | 670 | (57 | ) | (263 | ) | (18 | ) | 13 | 890 | |||||||||||||||||||||
| Loans charged-off | (141 | ) | (79 | ) | (663 | ) | (70 | ) | (115 | ) | (54 | ) | (5 | ) | (1,127 | ) | ||||||||||||||||
| Recoveries | 48 | 29 | 84 | 102 | 21 | 24 | 106 | 414 | ||||||||||||||||||||||||
| Balance, end of period 12/31/2015 | $ | 922 | $ | 1,386 | $ | 3,005 | $ | 605 | $ | 573 | $ | 137 | $ | 393 | $ | 7,021 | ||||||||||||||||
| Ending Balance: individually evaluated for impairment | $ | 2 | $ | - | $ | 73 | $ | 15 | $ | - | $ | 4 | $ | - | $ | 94 | ||||||||||||||||
| Ending Balance: collectively evaluated for impairment | $ | 920 | $ | 1,386 | $ | 2,932 | $ | 590 | $ | 573 | $ | 133 | $ | 393 | $ | 6,927 | ||||||||||||||||
| Loans: | ||||||||||||||||||||||||||||||||
| Ending Balance: collectively evaluated for impairment | $ | 73,373 | $ | 107,073 | $ | 253,005 | $ | 85,604 | $ | 41,303 | $ | 7,251 | $ | 40,738 | $ | 608,397 | ||||||||||||||||
| Ending Balance: individually evaluated for impairment | $ | 118 | $ | 615 | $ | 6,254 | $ | 2,351 | $ | 699 | $ | 4 | $ | - | $ | 10,041 | ||||||||||||||||
| Ending Balance | $ | 73,491 | $ | 107,688 | $ | 259,259 | $ | 87,955 | $ | 42,002 | $ | 7,255 | $ | 40,738 | $ | 618,388 | ||||||||||||||||
Also included in this table are $21.1 million of acquired loans with deteriorated credit quality.
- 117 -
| SELECT BANCORP, INC. |
| NOTES TO CONSOLIDATED FINANCIAL STATEMENTS |
| Years Ended December 31, 2017, 2016 and 2015 |
NOTE F– OTHER REAL ESTATE OWNED
The following table explains changes in other real estate owned (“OREO”) during the years ended December 31, 2017 and 2016 (dollars in thousands):
| December 31, | December 31, | |||||||
| 2017 | 2016 | |||||||
| (Dollars in thousands) | ||||||||
| Beginning balance January 1 | $ | 599 | $ | 1,401 | ||||
| Sales | (1,442 | ) | (2,062 | ) | ||||
| Write-downs and loss on sales | (442 | ) | (158 | ) | ||||
| Transfers | 2,543 | 1,418 | ||||||
| Ending balance | $ | 1,258 | $ | 599 | ||||
At December 31, 2017 and December 31, 2016, the Company had $1.3 million and $599,000, respectively, of foreclosed residential real estate property in OREO. The Company did have $376,000 which was comprised of 5 loans with recorded investment in consumer mortgage loans collateralized by residential real estate property in the process of foreclosure at December 31, 2017. The Company did not have any loans with recorded investment in consumer mortgage loans collateralized by residential real estate property in the process of foreclosure at December 31, 2017.
NOTE G - PREMISES AND EQUIPMENT
The following is a summary of premises and equipment at December 31, 2017 and 2016:
| 2017 | 2016 | |||||||
| (dollars in thousands) | ||||||||
| Land | $ | 5,078 | $ | 5,054 | ||||
| Buildings | 14,671 | 14,519 | ||||||
| Furniture and equipment | 6,577 | 5,846 | ||||||
| Leasehold improvements | 453 | 144 | ||||||
| Construction in progress | 100 | - | ||||||
| 26,879 | 25,563 | |||||||
| Less accumulated depreciation | 8,611 | 7,632 | ||||||
| Total | $ | 18,268 | $ | 17,931 | ||||
Depreciation amounting to approximately $1.0 million, $1.1 million, and $1.0 million for the years ended December 31, 2017, 2016, and 2015, respectively, is included in occupancy and equipment expenses.
- 118 -
| SELECT BANCORP, INC. |
| NOTES TO CONSOLIDATED FINANCIAL STATEMENTS |
| Years Ended December 31, 2017, 2016 and 2015 |
NOTE G - PREMISES AND EQUIPMENT (Continued)
The Company has operating leases for its corporate offices and branches that expire at various times through 2024. Future minimum lease payments under the leases for years subsequent to December 31, 2017 are as follows:
| Total Lease Payments | ||||
| (dollars in thousands) | ||||
| 2018 | $ | 1,203 | ||
| 2019 | 1,202 | |||
| 2020 | 738 | |||
| 2021 | 739 | |||
| 2022 | 568 | |||
| Years thereafter | 330 | |||
| $ | 4,780 | |||
During 2017, 2016, and 2015, payments under operating leases were approximately $408,000, $370,000, and $401,000, respectively. Lease expense was accounted for on a straight line basis. Rental income earned on office space leased to third parties was $148,000, $182,000 and $161,000 for 2017, 2016 and 2015, respectively.
NOTE H – GOODWILL AND OTHER INTANGIBLE ASSETS
The table below summarizes the changes in carrying amounts of goodwill and other intangibles (core deposit intangibles) for the periods presented.
| Core Deposit Intangible | ||||||||||||||||
| Accumulated | ||||||||||||||||
| Goodwill | Gross | Amortization | Net | |||||||||||||
| (In thousands) | ||||||||||||||||
| Balance at January 1, 2015 | $ | 6,931 | $ | 3,059 | $ | (1,434 | ) | $ | 1,625 | |||||||
| Core deposit intangible resulting from branch acquisition | - | 160 | - | 160 | ||||||||||||
| Amortization expense | - | - | (544 | ) | (544 | ) | ||||||||||
| Balance at December 31, 2015 | 6,931 | 3,219 | (1,978 | ) | 1,241 | |||||||||||
| Amortization expense | - | - | (431 | ) | (431 | ) | ||||||||||
| Balance at December 31, 2016 | 6,931 | 3,219 | (2,409 | ) | 810 | |||||||||||
| Core deposit intangible resulting from Premara merger | 17,973 | 2,700 | - | 2,700 | ||||||||||||
| Amortization expense | - | - | (409 | ) | (409 | ) | ||||||||||
| Balance at December 31, 2017 | $ | 24,904 | $ | 5,919 | $ | (2,818 | ) | $ | 3,101 | |||||||
Goodwill represents the excess of the purchase price over the fair value of acquired net assets under the acquisition method of accounting.
- 119 -
| SELECT BANCORP, INC. |
| NOTES TO CONSOLIDATED FINANCIAL STATEMENTS |
| Years Ended December 31, 2017, 2016 and 2015 |
NOTE H – GOODWILL AND OTHER INTANGIBLE ASSETS (Continued)
The value of acquired core deposit relationships was determined using the present value of the difference between a market participant's cost of obtaining alternative funds and the cost to maintain the acquired deposit base.
The table below summarizes the remaining core deposit intangible amortization (dollars in thousands):
| 2018 | $ | 1,016 | ||
| 2019 | 791 | |||
| 2020 | 565 | |||
| 2021 | 379 | |||
| 2022 | 239 | |||
| Thereafter | 111 | |||
| $ | 3,101 |
NOTE I – DEPOSITS
The scheduled maturities of time deposits at December 31, 2017 are as follows:
| Total Time Deposits | ||||
| (dollars in thousands) | ||||
| 2017 | $ | 316,051 | ||
| 2018 | 78,240 | |||
| 2019 | 28,631 | |||
| 2020 | 13,967 | |||
| 2021 | 10,722 | |||
| Thereafter | - | |||
| $ | 447,611 | |||
Time deposits with balances of $250,000 or more were $96.9 million and $68.8 million at December 31, 2017 and 2016, respectively.
NOTE J - REPURCHASE AGREEMENTS
We utilize securities sold under agreements to repurchase to facilitate the needs of our customers. Repurchase agreements are transactions whereby we offer to sell to a counterparty an undivided interest in an eligible security at an agreed upon purchase price, and which obligates the Company to repurchase the security on an agreed upon date at an agreed upon repurchase price plus interest at an agreed upon rate. Securities sold under agreements to repurchase are recorded at the amount of cash received in connection with the transaction and are reflected as short-term borrowings.
- 120 -
| SELECT BANCORP, INC. |
| NOTES TO CONSOLIDATED FINANCIAL STATEMENTS |
| Years Ended December 31, 2017, 2016 and 2015 |
NOTE J - REPURCHASE AGREEMENTS (Continued)
We monitor collateral levels on a continuous basis and maintain records of each transaction specifically describing the applicable security and the counterparty’s fractional interest in that security, and we segregate the security from its general assets in accordance with regulations governing custodial holdings of securities. The primary risk with our repurchase agreements is market risk associated with the investments securing the transactions, as we may be required to provide additional collateral based on fair value changes of the underlying investments. Securities pledged as collateral under repurchase agreements are maintained with our safekeeping agents. The carrying value of available for sale investment securities pledged as collateral under repurchase agreements totaled none and $12.1 million at December 31, 2017 and 2016, respectively.
The remaining contractual maturity of the securities sold under agreements to repurchase by class of collateral pledged included in short-term borrowings as of December 31, 2016 is presented in the following table.
| December 31, 2016 | ||||||||||||||||||||
| Remaining Contractual Maturity of the Agreements | ||||||||||||||||||||
| Overnight and | Up to 30 | 30-90 | Greater than | |||||||||||||||||
| (Dollars in thousands) | continuous | Days | Days | 90 Days | Total | |||||||||||||||
| Repurchase agreements | ||||||||||||||||||||
| U.S. Government | ||||||||||||||||||||
| agencies-GSE’s | $ | 5,568 | $ | - | $ | - | $ | - | $ | 5,568 | ||||||||||
| Mortgage-backed | ||||||||||||||||||||
| Securities-GSE’s | 6,496 | - | - | - | 6,496 | |||||||||||||||
| Total borrowings | $ | 12,064 | $ | - | $ | - | $ | - | $ | 12,064 | ||||||||||
| Gross amount of recognized liabilities for repurchase agreements | $ | 12,003 | ||||||||||||||||||
NOTE K – SHORT-TERM AND LONG-TERM DEBT
At December 31, 2017, the Company had $28.3 million in short-term debt and $19.4 million in long-term debt. Short-term debt consisted of $28.3 million in Federal Home Loan Bank advances. Long-term debt consisted of $12.4 million in junior subordinated debentures and $7.0 million in Federal Home Loan Bank advances. The Federal Home Loan Bank advances are collateralized by $117.4 million of loans as of December 31, 2017.
At December 31, 2016, the Company had $37.1 million in short-term debt and $23.0 million in long-term debt. Short-term debt consisted of $25.1 million in Federal Home Loan Bank advances and $12.0 million in repurchase agreements. Long-term debt consisted of $12.4 million in junior subordinated debentures and $10.6 million in Federal Home Loan Bank advances. The Federal Home Loan Bank advances were collateralized by $93.5 million of loans as of December 31, 2016.
Securities sold under agreements to repurchase generally mature within one to four days from the transaction date and are classified as short-term debt. Securities sold under agreements to repurchase are reflected at the amount of cash received in connection with the transaction. These repurchase agreements are collateralized by U. S. Government agency obligations and all are floating rate. During 2017 we terminated our repurchase agreement program. The following table presents certain information for securities sold under agreements to repurchase:
- 121 -
| SELECT BANCORP, INC. |
| NOTES TO CONSOLIDATED FINANCIAL STATEMENTS |
| Years Ended December 31, 2017, 2016 and 2015 |
NOTE K – SHORT-TERM AND LONG-TERM DEBT (Continued)
| 2017 | 2016 | |||||||
| (Dollars in thousands) | ||||||||
| Balance at December 31 | $ | - | $ | 12,003 | ||||
| Weighted average interest rate at December 31 | - | 0.32 | % | |||||
| Maximum amount outstanding at any month-end during the year | $ | 15,235 | $ | 12,003 | ||||
| Average daily balance outstanding during the year | $ | 6,751 | $ | 9,973 | ||||
| Average annual interest rate paid during the year | 0.35 | % | 0.30 | % | ||||
At December 31, 2017, the Company had $35.3 million in advances from the Federal Home Loan Bank of Atlanta and no borrowings from the Federal Reserve Bank discount window. The advances include a premium on borrowings acquired of $12,000. Advances consisted of the following at December 31, 2017:
| Amount | Rate | Maturity | ||||||||
| (dollars in thousands) | ||||||||||
| Advance type: | ||||||||||
| Fixed rate credit | $ | 4,000 | 1.21 | % | 1/26/2018 | |||||
| Fixed rate credit | 2,000 | 1.26 | % | 3/30/2018 | ||||||
| Fixed rate credit | 5,000 | 1.31 | % | 4/30/2018 | ||||||
| Fixed rate credit | 3,000 | 1.42 | % | 6/18/2018 | ||||||
Fixed rate credit | 10,000 | 1.38 | % | 7/30/2018 | ||||||
| Principal Reducing | 266 | 1.09 | % | 8/13/2018 | ||||||
| Fixed rate hybrid | 4,000 | 1.87 | % | 12/17/2018 | ||||||
| Fixed rate credit | 3,000 | 1.51 | % | 6/28/2019 | ||||||
| Fixed rate credit | 4,000 | 1.52 | % | 6/28/2019 | ||||||
On September 20, 2004, $12.4 million of junior subordinated debentures were issued to New Century Statutory Trust I (“the Trust”) in exchange for the proceeds of trust preferred securities issued by the Trust. All of the Trust’s common equity is owned by the Company. The junior subordinated debentures are included in long-term debt and the Company’s equity interest in the Trust is included in other assets.
The Company pays interest on the junior subordinated debentures at an annual rate, reset quarterly, equal to 3 month LIBOR plus 2.15%. The debentures are redeemable on September 20, 2009 or afterwards in whole or in part, on any March 20, June 20, September 20 or December 20. Redemption is mandatory at September 20, 2034. The Company has fully and unconditionally guaranteed repayment of the trust-preferred securities. The Company’s obligation under the guarantee is unsecured and subordinate to senior and subordinated indebtedness of the Company. The trust preferred securities qualify as Tier 1 capital for regulatory capital purposes subject to certain limitations, none of which were applicable at December 31, 2017.
Lines of credit amounted to $223.3 million with various correspondent banks with $60.3 million outstanding and $163.0 million available. Some of the lines of credit are secured and others unsecured with a variety of rates and terms.
- 122 -
| SELECT BANCORP, INC. |
| NOTES TO CONSOLIDATED FINANCIAL STATEMENTS |
| Years Ended December 31, 2017, 2016 and 2015 |
NOTE L - INCOME TAXES
The significant components of the provision for income taxes for the years ended December 31, 2017, 2016 and 2015 are as follows:
| 2017 | 2016 | 2015 | ||||||||||
| (dollars in thousands) | ||||||||||||
| Current tax provision: | ||||||||||||
| Federal | $ | 3,059 | $ | 2,998 | $ | 2,094 | ||||||
| State | 328 | 498 | 354 | |||||||||
| Total current tax provision | 3,387 | 3,496 | 2,448 | |||||||||
| Deferred tax provision: | ||||||||||||
| Federal | 2,328 | 52 | 752 | |||||||||
| State | (3 | ) | 99 | 218 | ||||||||
| Total deferred tax provision | 2,325 | 151 | 970 | |||||||||
| Net income tax provision | $ | 5,712 | $ | 3,647 | $ | 3,418 | ||||||
The difference between the provision for income taxes and the amounts computed by applying the statutory federal income tax rate of 34% to income before income taxes is summarized below:
| 2017 | 2016 | 2015 | ||||||||||
| (dollars in thousands) | ||||||||||||
| Income tax at federal statutory rate | $ | 3,025 | $ | 3,536 | $ | 3,390 | ||||||
| Increase (decrease) resulting from: | ||||||||||||
| State income taxes, net of federal tax effect | 214 | 394 | 377 | |||||||||
| Tax-exempt interest income | (128 | ) | (151 | ) | (172 | ) | ||||||
| Income from life insurance | (195 | ) | (201 | ) | (213 | ) | ||||||
| Incentive stock option expense | 39 | 24 | 13 | |||||||||
| Merger expenses | 209 | - | - | |||||||||
| Impact of changes in tax rates | 2,591 | - | - | |||||||||
| Other permanent differences | (43 | ) | 45 | 23 | ||||||||
| Provision for income taxes | $ | 5,712 | $ | 3,647 | $ | 3,418 | ||||||
- 123 -
| SELECT BANCORP, INC. |
| NOTES TO CONSOLIDATED FINANCIAL STATEMENTS |
| Years Ended December 31, 2017, 2016 and 2015 |
NOTE L - INCOME TAXES (Continued)
Deferred income taxes reflect the net tax effects of temporary differences between the carrying amounts of assets and liabilities for financial reporting purposes and the amounts used for income tax purposes. Significant components of deferred taxes at December 31, 2017 and 2016 are as follows:
| 2017 | 2016 | |||||||
| (dollars in thousands) | ||||||||
| Deferred tax assets relating to: | ||||||||
| Allowance for loan losses | $ | 2,030 | $ | 3,026 | ||||
| Deferred compensation | 172 | 294 | ||||||
| Supplemental executive retirement plan | - | 17 | ||||||
| Net operating loss carryforwards | 1,446 | - | ||||||
| Acquisition accounting | 1,738 | 986 | ||||||
| Core deposit intangible | - | 165 | ||||||
| Write-downs on foreclosed real estate | 116 | 53 | ||||||
| Other | 143 | 184 | ||||||
| Total deferred tax assets | 5,645 | 4,725 | ||||||
| Deferred tax liabilities relating to: | ||||||||
| Premises and equipment | (654 | ) | (1,287 | ) | ||||
| Deferred loan fees/costs | (54 | ) | (70 | ) | ||||
| Unrealized gains on available-for-sale securities | (119 | ) | (204 | ) | ||||
| Core deposit intangible | (319 | ) | - | |||||
| Other | - | (32 | ) | |||||
| Total deferred tax liabilities | (1,146 | ) | (1,593 | ) | ||||
| Net recorded deferred tax asset, included in other assets | $ | 4,499 | $ | 3,132 | ||||
Deferred income taxes are measured at the enacted tax rate for the period in which they are expected to reverse. In December 2017 the U.S. Congress passed and the President signed legislation which reduced the statutory corporate tax rate to 21% effective January 1, 2018 and for all taxable years ending after that date. North Carolina also enacted legislation to reduce its corporate tax rate from 3.0% to 2.5% effective January 1, 2019. Therefore, deferred income taxes as of December 31, 2017 have been measured using the tax rate enacted for subsequent years of 21% and 2.5%. The impact of this change in tax rate is additional income tax expense of $2.6 million.
The Company had $7.0 million of net operating losses which can be carried forward and applied against future taxable income. If unused, these net operating losses will expire in 2027 through 2036. The Company’s policy is to report interest and penalties, if any, related to uncertain tax positions in income tax expense in the Consolidated Statements of Operations. With few exceptions, the Company is no longer subject to U.S. federal, state and local, or non-U.S. income tax examinations by tax authorities for years before 2014. As of December 31, 2017 and 2016, the Company has no uncertain tax positions.
The Company’s net deferred tax asset was $4.5 million and $3.2 million at December 31, 2017 and 2016. In evaluating whether we will realize the full benefit of our net deferred tax asset, we consider both positive and negative evidence, including among other things recent earnings trends, projected earnings, and asset quality. As of December 31, 2017, management concluded that the Company’s net deferred tax assets were fully realizable. As a result of the reduction in the federal corporate tax rate in December 2017 deferred taxes were adjusted to reflect this change. The Company will continue to monitor deferred tax assets closely to evaluate whether we will be able to realize the full benefit of our net deferred tax asset or whether there is any need for a valuation allowance. Significant negative trends in credit quality, losses from operations or other factors could impact the realization of the deferred tax asset in the future.
- 124 -
| SELECT BANCORP, INC. |
| NOTES TO CONSOLIDATED FINANCIAL STATEMENTS |
| Years Ended December 31, 2017, 2016 and 2015 |
NOTE M - REGULATORY MATTERS
The Company is subject to various regulatory capital requirements administered by federal and state banking agencies. Failure to meet minimum capital requirements can initiate certain mandatory, and possibly additional discretionary actions by regulators that, if undertaken, could have a material adverse effect on the Company’s consolidated financial statements. Quantitative measures established by regulation to ensure capital adequacy require the Company to maintain minimum amounts and ratios, as set forth in the table below. Management believes, as of December 31, 2017, that the Company meets all capital adequacy requirements to which it is subject. The Company’s significant assets are its investments in Select Bank & Trust Company and New Century Statutory Trust I.
Regulatory authorities may limit payment of dividends by any bank when it is determined that such a limitation is in the public interest and is necessary to ensure financial soundness of the bank. The North Carolina Commissioner of Banks and the FDIC are also authorized to prohibit the payment of dividends under certain other circumstances.
A significant measure of the strength of a financial institution is its capital base. Federal regulations have classified and defined capital into the following components: (1) Tier 1 capital, which includes common shareholders’ equity and qualifying preferred equity, and (2) Tier 2 capital, which includes a portion of the allowance for loan losses, certain qualifying long-term debt and preferred stock which does not qualify as Tier 1 capital. Financial institutions and holding companies became subject to the Basel III capital requirements beginning on January 1, 2015. A new part of the capital ratios profile is the Common Equity Tier 1 risk-based ratio which does not include limited life components such as trust preferred securities and Small Business Lending Fund (“SBLF”) preferred stock. Minimum capital levels are regulated by risk-based capital adequacy guidelines, which require a financial institution to maintain capital as a percentage of its assets, and certain off-balance sheet items adjusted for predefined credit risk factors (risk-adjusted assets).
As the following tables indicate, at December 31, 2017 and 2016, the Company and its Bank subsidiary both exceeded minimum regulatory capital requirements as specified below.
| Minimum for capital | ||||||||||||||||
| Actual | adequacy purposes | |||||||||||||||
| The Company: | Amount | Ratio | Amount | Ratio | ||||||||||||
| December 31, 2017: | (dollars in thousands) | |||||||||||||||
| Total Capital (to Risk-Weighted Assets) | $ | 129,168 | 11.86 | % | $ | 87,163 | 8.00 | % | ||||||||
| Tier 1 Capital (to Risk-Weighted Assets) | 120,334 | 11.04 | % | 65,372 | 6.00 | % | ||||||||||
| Common Equity Tier 1 (to Risk-Weighted Assets) | 108,334 | 9.94 | % | 49,029 | 4.50 | % | ||||||||||
| Tier 1 Capital (to Average Assets) | 120,334 | 12.64 | % | 38,086 | 4.00 | % | ||||||||||
| Minimum for capital | ||||||||||||||||
| Actual | adequacy purposes | |||||||||||||||
| The Company: | Amount | Ratio | Amount | Ratio | ||||||||||||
| December 31, 2016: | (dollars in thousands) | |||||||||||||||
| Total Capital (to Risk-Weighted Assets) | $ | 116,909 | 15.12 | % | $ | 61,876 | 8.00 | % | ||||||||
| Tier 1 Capital (to Risk-Weighted Assets) | 108,498 | 14.03 | % | 46,407 | 6.00 | % | ||||||||||
| Common Equity Tier 1 (to Risk-Weighted Assets) | 96,498 | 12.48 | % | 34,805 | 4.50 | % | ||||||||||
| Tier 1 Capital (to Average Assets) | 108,498 | 12.99 | % | 33,422 | 4.00 | % | ||||||||||
- 125 -
| SELECT BANCORP, INC. |
| NOTES TO CONSOLIDATED FINANCIAL STATEMENTS |
| Years Ended December 31, 2017, 2016 and 2015 |
NOTE M - REGULATORY MATTERS (Continued)
Select Bank & Trust Company’s actual capital amounts and ratios are presented in the table below as of December 31, 2017 and 2016:
| Minimum to be well | ||||||||||||||||||||||||
| Minimum for capital | capitalized under prompt | |||||||||||||||||||||||
| Actual | adequacy purposes | corrective action provisions | ||||||||||||||||||||||
| The Bank: | Amount | Ratio | Amount | Ratio | Amount | Ratio | ||||||||||||||||||
| December 31, 2017: | (dollars in thousands) | |||||||||||||||||||||||
| Total Capital (to Risk-Weighted Assets) | $ | 123,813 | 11.38 | % | $ | 87,077 | 8.00 | % | 108,846 | 10.00 | % | |||||||||||||
| Tier 1 Capital (to Risk-Weighted Assets) | 114,979 | 10.56 | % | 65,308 | 6.00 | % | 87,077 | 8.00 | % | |||||||||||||||
| Common equity Tier 1 (to Risk-Weight Assets) | 114,979 | 10.56 | % | 48,981 | 4.50 | % | 70,750 | 6.50 | % | |||||||||||||||
| Tier 1 Capital (to Average Assets) | 114,979 | 12.08 | % | 38,086 | 4.00 | % | 47,608 | 5.00 | % | |||||||||||||||
| Minimum to be well | ||||||||||||||||||||||||
| Minimum for capital | capitalized under prompt | |||||||||||||||||||||||
| Actual | adequacy purposes | corrective action provisions | ||||||||||||||||||||||
| The Bank: | Amount | Ratio | Amount | Ratio | Amount | Ratio | ||||||||||||||||||
| December 31, 2016: | (dollars in thousands) | |||||||||||||||||||||||
| Total Capital (to Risk-Weighted Assets) | $ | 112,375 | 14.53 | % | $ | 61,876 | 8.00 | % | 77,346 | 10.00 | % | |||||||||||||
| Tier 1 Capital (to Risk-Weighted Assets) | 103,964 | 13.44 | % | 46,407 | 6.00 | % | 61,876 | 8.00 | % | |||||||||||||||
| Common equity Tier 1 (to Risk-Weight Assets) | 103,964 | 13.44 | % | 34,806 | 4.50 | % | 50,275 | 6.50 | % | |||||||||||||||
| Tier 1 Capital (to Average Assets) | 103,964 | 12.44 | % | 33,422 | 4.00 | % | 41,777 | 5.00 | % | |||||||||||||||
During 2004, the Company issued $12.4 million of junior subordinated debentures to a newly formed subsidiary, New Century Statutory Trust I, which in turn issued $12.0 million of trust preferred securities. The proceeds from the sale of the trust preferred securities provided additional capital for the growth and expansion of the Bank. Under the current applicable regulatory guidelines, all of the proceeds from the issuance of these trust preferred securities qualify as Tier 1 capital as of December 31, 2017.
Management expects that the Bank will remain “well-capitalized” for regulatory purposes, although there can be no assurance that additional capital will not be required in the future.
NOTE N - OFF-BALANCE SHEET RISK
The Company is a party to financial instruments with off-balance sheet credit risk in the normal course of business to meet the financing needs of its customers. These financial instruments include commitments to extend credit and letters of credit. Those instruments involve, to varying degrees, elements of credit and interest rate risk in excess of the amount recognized in the balance sheet. The contract or notional amounts of those instruments reflect the extent of involvement the Company has in particular classes of financial instruments. The Company uses the same credit policies in making commitments and conditional obligations as it does for on-balance-sheet instruments.
Commitments to extend credit are agreements to lend to a customer as long as there is no violation of conditions established in the contract. Commitments generally have fixed expiration dates or other termination clauses and may require payment of a fee. Since some of the commitments are expected to expire without being drawn upon, the total commitment amounts do not necessarily represent future cash requirements. The Company evaluates each customer’s creditworthiness on a case-by-case basis.
- 126 -
| SELECT BANCORP, INC. |
| NOTES TO CONSOLIDATED FINANCIAL STATEMENTS |
| Years Ended December 31, 2017, 2016 and 2015 |
NOTE N - OFF-BALANCE SHEET RISK (Continued)
The amount of collateral obtained, if deemed necessary by the Company, upon extension of credit is based on management’s credit evaluation of the borrower. Collateral obtained varies but may include real estate, stocks, bonds, and certificates of deposit.
A summary of the contract amount of the Company’s exposure to off-balance sheet credit risk as of December 31, 2017 is as follows:
| Financial instruments whose contract amounts represent credit risk: | (In thousands) | |||
| Undisbursed commitments | $ | 178,072 | ||
| Letters of credit | 2,523 | |||
The Company has legally binding delayed equity commitments to private investment funds. These commitments are not expected to be called, and therefore, are not reflected in the financial statements. The amount of these commitments at December 31, 2017 and 2016 was $525,000 and $200,000, respectively.
NOTE O – FAIR VALUE MEASUREMENTS
ASC 820 defines fair value, establishes a framework for measuring fair value, and expands disclosures about fair value measurements. ASC 820 does not require any new fair value measurements, but clarifies and standardizes some divergent practices that have emerged since prior guidance was issued. ASC 820 creates a three-level hierarchy under which individual fair value estimates are to be ranked based on the relative reliability of the inputs used in the valuation.
Fair value estimates are made at a specific moment in time, based on relevant market information and information about the financial instrument. These estimates do not reflect any premium or discount that could result from offering for sale at one time the Company’s entire holdings of a particular financial instrument.
The following methods and assumptions were used to estimate the fair value of each class of financial instruments for which it is practicable to estimate that value:
Fair Value Hierarchy
The Company groups assets and liabilities at fair value in three levels, based on the markets in which the assets and liabilities are traded and the reliability of the assumptions used to determine fair value. These levels are:
| · |
Level 1 – Valuation is based upon quoted prices for identical instruments traded in active markets.
| |
| · |
Level 2 – Valuation is based upon quoted prices for similar instruments in active markets, quoted prices for identical or similar instruments in markets that are not active and model-based valuation techniques for which all significant assumptions are observable in the market.
|
- 127 -
| SELECT BANCORP, INC. |
| NOTES TO CONSOLIDATED FINANCIAL STATEMENTS |
| Years Ended December 31, 2017, 2016 and 2015 |
NOTE O – FAIR VALUE MEASUREMENTS (Continued)
|
|
· | Level 3 – Valuation is generated from model-based techniques that use at least one significant assumption not observable in the market. These unobservable assumptions reflect estimates of assumptions that market participants would use in pricing the asset or liability. Valuation techniques include use of option pricing models, discounted cash flows models and similar techniques. |
The following is a description of valuation methodologies used for assets and liabilities recorded at fair value on a recurring basis.
Investment Securities Available-for-Sale
Investment securities available-for-sale are recorded at fair value on a recurring basis. Fair value measurement is based upon quoted prices, if available. If quoted prices are not available, fair values are measured using independent pricing models or other model-based valuation techniques such as the present value of future cash flows, adjusted for the security’s credit rating, prepayment assumptions and other factors such as credit loss assumptions. Level 1 securities include those traded on an active exchange, such as the New York Stock Exchange, U.S. Treasury securities that are traded by dealers or brokers in active over-the-counter markets and money market funds. Level 2 securities include U.S. government agencies – GSE’s, mortgage-backed securities issued by GSE’s, corporate bonds and municipal bonds. Valuation techniques are consistent with methodologies used in prior periods.
The following tables summarize quantitative disclosures about the fair value measurement for each category of assets carried at fair value on a recurring basis as of December 31, 2017 and December 31, 2016 (dollars in thousands):
| Investment securities available for sale December 31, 2017 | Fair value | Quoted Prices in Active Markets for Identical Assets (Level 1) | Significant Other Observable Inputs (Level 2) | Significant Unobservable Inputs (Level 3) | ||||||||||||
| U.S. government agencies – GSE's | $ | 13,364 | $ | - | $ | 13,364 | $ | - | ||||||||
| Mortgage-backed securities - GSE’s | 29,684 | - | 29,684 | - | ||||||||||||
| Corporate Bonds | 1,888 | - | 1,888 | - | ||||||||||||
| Municipal bonds | 18,838 | - | 18,838 | - | ||||||||||||
| Total investment held for sale | $ | 63,774 | $ | - | $ | 63,774 | $ | - | ||||||||
- 128 -
| SELECT BANCORP, INC. |
| NOTES TO CONSOLIDATED FINANCIAL STATEMENTS |
| Years Ended December 31, 2017, 2016 and 2015 |
NOTE O – FAIR VALUE MEASUREMENTS (Continued)
| Quoted Prices in | Significant | |||||||||||||||
| Investment securities | Active Markets | Other | Significant | |||||||||||||
| available for sale | for Identical | Observable | Unobservable | |||||||||||||
| December 31, 2016 | Fair value | Assets (Level 1) | Inputs (Level 2) | Inputs (Level 3) | ||||||||||||
| U.S. government agencies – GSE's | $ | 14,159 | $ | - | $ | 14,159 | $ | - | ||||||||
| Mortgage-backed securities - GSE’s | 32,363 | - | 32,363 | - | ||||||||||||
| Municipal bonds | 15,735 | - | 15,735 | - | ||||||||||||
| Total | $ | 62,257 | $ | - | $ | 62,257 | $ | - | ||||||||
The following are descriptions of valuation methodologies used for assets and liabilities recorded at fair value on a non-recurring basis.
Loans
The Company does not record loans at fair value on a recurring basis. However, from time to time, a loan is considered impaired and a specific reserve in the allowance for loan losses is established. Loans for which it is probable that payment of interest and principal will not be made in accordance with the contractual terms of the loan agreement are considered impaired. Once a loan is identified as individually impaired, management measures impairment in accordance with ASC 310, “Receivables”. The fair value of impaired loans is estimated using one of several methods, including collateral value, market value of similar debt, enterprise value, or liquidation value and discounted cash flows. Those impaired loans not requiring an allowance represent loans for which the fair value of the expected repayments or collateral exceed the recorded investments in such loans. At December 31, 2017, and 2016, substantially all of the total impaired loans were evaluated based on the fair value of the collateral. Impaired loans where a specific reserve is established based on the fair value of collateral require classification in the fair value hierarchy. When the fair value of the collateral is based on an observable market price or a current appraised value, the Company records the impaired loan as nonrecurring Level 2. When an appraised value is not available or management determines the fair value of the collateral is further impaired below the appraised value and there is no observable market price, the Company records the impaired loan as nonrecurring Level 3. There were no transfers between levels from prior reporting periods. Valuation techniques are consistent with prior periods.
The significant unobservable inputs used in the fair value measurement of the Company’s impaired loans range between 6 - 56% and 6-61% discount from appraisals for expected liquidation and sales costs at December 31, 2017 and 2016.
Foreclosed Real Estate
Foreclosed real estate are properties recorded at estimated fair value, less the estimated costs to sell, at the date of foreclosure. Inputs include appraised values on the properties or recent sales activity for similar assets in the property’s market. Therefore, foreclosed real estate is classified within Level 3 of the hierarchy. Valuation techniques are consistent with prior periods.
The significant unobservable input used in the fair value measurement of the Company’s foreclosed real estate range between 6 – 10% and 6 – 10% discount from appraisals for expected liquidation and sales costs at December 31, 2017 and 2016, respectively.
- 129 -
| SELECT BANCORP, INC. |
| NOTES TO CONSOLIDATED FINANCIAL STATEMENTS |
| Years Ended December 31, 2017, 2016 and 2015 |
NOTE O – FAIR VALUE MEASUREMENTS (Continued)
Assets held for sale
During 2015, a branch facility was taken out of service as part of the Company’s branch restructuring plan and reclassified as held for sale. The property is recorded at the remaining book balance of the asset or an estimated fair value less estimated selling costs, whichever is less. Inputs include appraised values on the properties or recent sales activity for similar assets in the property’s market. The significant unobservable input used is the discount applied to appraised values to account for expected liquidation and selling costs ranged between 1% and 25 % at December 31, 2017. There have been no changes in the valuation techniques.
The following tables summarize quantitative
disclosures about the fair value measurement for each category of assets carried at fair value on a nonrecurring basis as of December
31, 2017 and
December 31, 2016 (dollars in thousands):
| Quoted Prices in | Significant | |||||||||||||||
| Active Markets | Other | Significant | ||||||||||||||
| Asset Category | for Identical | Observable | Unobservable | |||||||||||||
| December 31, 2017 | Fair value | Assets (Level 1) | Inputs (Level 2) | Inputs (Level 3) | ||||||||||||
| Impaired loans | $ | 2,115 | $ | - | $ | - | $ | 2,115 | ||||||||
| Assets held for sale | 846 | - | - | 846 | ||||||||||||
| Foreclosed real estate | 1,258 | - | - | 1,258 | ||||||||||||
| Total | $ | 4,219 | $ | - | $ | - | $ | 4,219 | ||||||||
| Quoted Prices in | Significant | |||||||||||||||
| Active Markets | Other | Significant | ||||||||||||||
| Asset Category | for Identical | Observable | Unobservable | |||||||||||||
| December 31, 2016 | Fair value | Assets (Level 1) | Inputs (Level 2) | Inputs (Level 3) | ||||||||||||
| Impaired loans | $ | 5,805 | $ | - | $ | - | $ | 5,805 | ||||||||
| Assets held for sale | 846 | - | - | 846 | ||||||||||||
| Foreclosed real estate | 599 | - | - | 599 | ||||||||||||
| Total | $ | 7,250 | $ | - | $ | - | $ | 7,250 | ||||||||
As of December 31, 2017, the Bank identified $8.0 million in impaired loans, of which $2.1 million were carried at fair value on a non-recurring basis which included $344,000 in loans that required a specific reserve of $61,000, and an additional $1.7 million in other loans without specific reserves that had partial charge-offs. As of December 31, 2016, the Bank identified $11.0 million in impaired loans, of which $5.8 million were carried at fair value on a non-recurring basis which included $2.8 million in loans that required a specific reserve of $117,000, and an additional $88,000 in other loans without specific reserves that had charge-offs.
- 130 -
| SELECT BANCORP, INC. |
| NOTES TO CONSOLIDATED FINANCIAL STATEMENTS |
| Years Ended December 31, 2017, 2016 and 2015 |
NOTE O – FAIR VALUE MEASUREMENTS (Continued)
Financial instruments include cash and due from banks, interest-earning deposits with banks, investments, loans, deposit accounts and borrowings. Due to the nature of the Company’s business, a significant portion of its assets and liabilities consist of financial instruments, the estimated values of which are disclosed. These estimates do not reflect any premium or discount that could result from offering for sale at one time the Company’s entire holdings of a particular financial instrument. Because no active market readily exists for a portion of the Company’s financial instruments, fair value estimates are based on judgments regarding future expected loss experience, current economic conditions, risk characteristics of various financial instruments, and other factors. These estimates are subjective in nature and involve uncertainties and matters of significant judgment and, therefore, cannot be determined with precision. Changes in assumptions could significantly affect the estimates.
The following table presents the carrying values and estimated fair values of the Company's financial instruments at December 31, 2017 and 2016:
| December 31, 2017 | ||||||||||||||||||||
| Carrying | Estimated | |||||||||||||||||||
| Amount | Fair Value | Level 1 | Level 2 | Level 3 | ||||||||||||||||
| (dollars in thousands) | ||||||||||||||||||||
| Financial assets: | ||||||||||||||||||||
| Cash and due from banks | $ | 16,554 | $ | 16,554 | $ | 16,554 | $ | - | $ | - | ||||||||||
| Certificates of deposits | 1,500 | 1,500 | 1,500 | - | - | |||||||||||||||
| Interest-earning deposits in other banks | 37,996 | 37,996 | 37,996 | - | - | |||||||||||||||
| Federal funds sold | 6,645 | 6,645 | 6,645 | - | - | |||||||||||||||
| Investment securities available for sale | 63,774 | 63,774 | - | 63,774 | - | |||||||||||||||
| Loans held for sale | 98 | 98 | - | 98 | - | |||||||||||||||
| Loans, net | 973,791 | 972,475 | - | - | 972,475 | |||||||||||||||
| Accrued interest receivable | 3,997 | 3,997 | - | 3,997 | - | |||||||||||||||
| Stock in the FHLB | 2,490 | 2,490 | - | - | 2,490 | |||||||||||||||
| Other non-marketable securities | 1,019 | 1,019 | - | - | 1,019 | |||||||||||||||
| Assets held for sale | 846 | 846 | - | - | 846 | |||||||||||||||
| Financial liabilities: | ||||||||||||||||||||
| Deposits | $ | 995,044 | $ | 991,977 | $ | - | $ | 991,977 | $ | - | ||||||||||
| Short-term debt | 28,279 | 28,279 | - | 28,279 | - | |||||||||||||||
| Long-term debt | 19,372 | 14,640 | - | 14,640 | - | |||||||||||||||
| Accrued interest payable | 427 | 427 | - | 427 | - | |||||||||||||||
- 131 -
| SELECT BANCORP, INC. |
| NOTES TO CONSOLIDATED FINANCIAL STATEMENTS |
| Years Ended December 31, 2017, 2016 and 2015 |
NOTE O – FAIR VALUE MEASUREMENTS (Continued)
| December 31, 2016 | ||||||||||||||||||||
| Carrying | Estimated | |||||||||||||||||||
| Amount | Fair Value | Level 1 | Level 2 | Level 3 | ||||||||||||||||
| (dollars in thousands) | ||||||||||||||||||||
| Financial assets: | ||||||||||||||||||||
| Cash and due from banks | $ | 14,372 | $ | 14,372 | $ | 14,372 | $ | - | $ | - | ||||||||||
| Certificates of deposits | 1,000 | 1,000 | 1,000 | - | - | |||||||||||||||
| Interest-earning deposits in other banks | 40,342 | 40,342 | 40,342 | - | - | |||||||||||||||
| Investment securities available for sale | 62,257 | 62,257 | - | 62,257 | - | |||||||||||||||
| Loans, net | 668,784 | 671,208 | - | - | 671,208 | |||||||||||||||
| Accrued interest receivable | 2,768 | 2,768 | - | 2,768 | - | |||||||||||||||
| Stock in the FHLB | 2,251 | 2,251 | - | - | 2,251 | |||||||||||||||
| Other non-marketable securities | 703 | 703 | - | - | 703 | |||||||||||||||
| Assets held for sale | 846 | 846 | - | - | 846 | |||||||||||||||
| Financial liabilities: | ||||||||||||||||||||
| Deposits | $ | 679,661 | $ | 678,328 | $ | - | $ | 678,328 | $ | - | ||||||||||
| Short-term debt | 37,090 | 37,177 | - | 37,177 | - | |||||||||||||||
| Long-term debt | 23,039 | 17,649 | - | 17,649 | - | |||||||||||||||
| Accrued interest payable | 221 | 221 | - | 221 | - | |||||||||||||||
Cash and Due from Banks, Certificates of Deposits, Interest-Earning Deposits in Other Banks and Federal Funds Sold
The carrying amounts for cash and due from banks, certificates of deposit, interest-earning deposits in other banks and federal funds sold approximate fair value because of the short maturities of those instruments.
Investment Securities Available for Sale
Fair value for investment securities available for sale equals the quoted market price if such information is available. If a quoted market price is not available, fair value is estimated using quoted market prices for similar securities.
Loans
For certain homogenous categories of loans, such as residential mortgages, fair value is estimated using the quoted market prices for securities backed by similar loans, adjusted for differences in loan characteristics. The fair value of other types of loans is estimated by discounting the future cash flows using the current rates at which similar loans would be made to borrowers with similar credit ratings and for the same remaining maturities.
Loans Held for Sale
The fair value of loans held for sale is determined using quoted prices for similar assets, adjusted for specific attributes of the loan.
- 132 -
| SELECT BANCORP, INC. |
| NOTES TO CONSOLIDATED FINANCIAL STATEMENTS |
| Years Ended December 31, 2017, 2016 and 2015 |
NOTE O – FAIR VALUE MEASUREMENTS (Continued)
Stock in Federal Home Loan Bank of Atlanta
The fair value for FHLB stock approximates carrying value, based on the redemption provisions of the Federal Home Loan Bank stock.
Other Non-Marketable Securities
The fair value of equity instruments in other non-marketable securities is assumed to approximate carrying value.
Assets Held for Sale
The fair value of assets held for sale approximates the carrying value.
Deposits
The fair value of demand, savings, money market and NOW deposits are the amount payable on demand at the reporting date. The fair values of time deposits are estimated using the rates currently offered for instruments of similar remaining maturities.
Short-Term Debt
Short-term debt consists of repurchase agreements and FHLB advances with maturities of less than twelve months. The carrying values of these instruments is a reasonable estimate of fair value.
Long-Term Debt
The fair values of long-term debt are based on discounting expected cash flows at the interest rate for debt with the same or similar remaining maturities and collateral requirements.
Accrued Interest Receivable and Accrued Interest Payable
The carrying amounts of accrued interest receivable and payable approximate fair value, because of the short maturities of these instruments.
Financial Instruments with Off-Balance Sheet Risk
With regard to financial instruments with off-balance sheet risk, it is not practicable to estimate the fair value of future financing commitments.
NOTE P - EMPLOYEE AND DIRECTOR BENEFIT PLANS
401(k) Plan
The Company has a 401(k) Plan and substantially all employees participate in the plan. The Company matches 100% of the first 6% of an employee’s compensation contributed to the plan. Expenses attributable to the plan amounted to $465,000, $382,000, and $365,000 for the years ended December 31, 2017, 2016 and 2015, respectively.
- 133 -
| SELECT BANCORP, INC. |
| NOTES TO CONSOLIDATED FINANCIAL STATEMENTS |
| Years Ended December 31, 2017, 2016 and 2015 |
NOTE P - EMPLOYEE AND DIRECTOR BENEFIT PLANS (Continued)
Employment Agreements
The Company has entered into employment agreements with five executive officers to promote a stable and competent management base. These agreements provide for benefits as specified in the contracts and cannot be terminated by the Board of Directors, except for cause, without prejudicing the officer’s right to receive certain vested rights, including compensation. In the event of a change in control of the Company, as outlined in the agreements, the acquirer will generally be bound by the terms of those contracts.
Supplemental Executive Retirement Plans
The Company implemented a nonqualified supplemental executive retirement plan for the former Chief Executive Officer during 2003. Benefits accrue and vest during the period of employment, and will be paid in monthly benefit payments over the officer’s life after retirement. Provisions of $53,000, $22,000, and $130,000 were expensed for future benefits to be provided under this plan during 2017, 2016 and 2015, respectively. In conjunction with the implementation of this plan, the Company has purchased life insurance on certain key officers to help offset plan accruals. The life insurance policies provide the payment of a death benefit in the event an insured officer dies prior to attainment of retirement age. The total liability under this plan at December 31, 2017 and 2016 was $198,000 and $306,000, respectively.
As part of the acquisition of Progressive State Bank (“Progressive”), the Company assumed a liability for the supplemental early retirement plan for Progressive’s Chief Executive Officer. Provisions of $36,000, $17,000, and $18,000 and were expensed in 2017, 2016 and 2015, resulting in a total liability of $308,000 and $326,000 as of December 31, 2017 and 2016, respectively. Corresponding to this liability, Progressive had purchased a life insurance policy on a key officer to help offset the expense associated with future benefit payments. This policy was acquired by the Company upon its acquisition of Progressive.
Directors Deferred Compensation
The Company has instituted a Directors’ Deferral Plan (“Deferral Plan”) whereby individual directors may elect annually to defer receipt of all or a designated portion of their directors’ fees for the coming year. Amounts so deferred are used to purchase shares of the Company’s common stock on the open market by the administrator of the Deferral Plan or to issue shares from the Company’s authorized but unissued shares, with such deferred compensation disbursed in the future as specified by the director at the time of his or her deferral election. All deferral amounts and matching contributions, if any, are paid into a rabbi trust with a separate account for each participant under the plan. Net compensation and other expenses attributable to this plan for the years ended December 31, 2017, 2016 and 2015 were $178,000, $201,000, and $18,000, respectively. The Directors’ Deferral Plan was amended and restated on September 22, 2015 to ensure compliance with applicable regulations and to provide that the eventual payment of compensation deferred under the plan may be made only in the form of the Registrant’s common stock. A liability of $2.5 million and $2.3 million related to this plan is included in shareholders’ equity for December 31, 2017 and 2016, respectively.
- 134 -
| SELECT BANCORP, INC. |
| NOTES TO CONSOLIDATED FINANCIAL STATEMENTS |
| Years Ended December 31, 2017, 2016 and 2015 |
NOTE P - EMPLOYEE AND DIRECTOR BENEFIT PLANS (Continued)
Stock Option Plans
The Company has shareholder approved stock option plans under which options are granted to directors and employees of the Company and its subsidiary.
| · | On May 11, 2010, the shareholders of the Company approved the implementation of the New Century Bancorp, Inc. 2010 Omnibus Stock Ownership and Long-Term Incentive Plan (the “Omnibus Plan”). The Omnibus Plan provides for the grant of incentive stock options, non-qualified stock options, restricted stock, long-term incentive compensation units and stock appreciation rights. Officers and other full-time employees of the Company and the Bank, including executive officers and directors, are eligible to receive awards under the Omnibus Plan. Grants under the New Century Bancorp, Inc. 2010 Omnibus Stock Ownership and Long-Term Incentive Plan (the “Omnibus Plan”) to directors are vested over discretionary periods from immediate vesting to five years and grants to employees are vested over a five-year period. However, no projections have been made as to specific award terms or recipients. There were 128,000 and 36,000 incentive stock options granted in 2017 and 2016, respectively. |
- 135 -
| SELECT BANCORP, INC. |
| NOTES TO CONSOLIDATED FINANCIAL STATEMENTS |
| Years Ended December 31, 2017, 2016 and 2015 |
NOTE P - EMPLOYEE AND DIRECTOR BENEFIT PLANS (Continued)
Stock Option Plans (Continued)
For years when stock options were granted the estimated weighted average fair market value of each option awarded, using the Black-Scholes option pricing model, together with the assumptions used in estimating those weighted average fair values, are displayed below:
| 2017 | 2016 | 2015 | ||||||||||
| Estimated fair value of options granted | $ | 5.47 | $ | 4.17 | $ | 3.74 | ||||||
| Assumptions in estimating average option values: | ||||||||||||
| Risk-free interest rate | 2.07 | % | 1.59 | % | 1.87 | % | ||||||
| Dividend yield | - | % | - | % | - | % | ||||||
| Volatility | 42.42 | % | 46.09 | % | 48.13 | % | ||||||
| Expected life (in years) | 8.00 | 8.00 | 8.00 | |||||||||
A summary of the Company’s option plans as of and for the year ended December 31, 2017 is as follows:
| Outstanding Options | Exercisable Options | |||||||||||||||||||
| Shares | Weighted | Weighted | ||||||||||||||||||
| Available | Average | Average | ||||||||||||||||||
| for Future | Number | Exercise | Number | Exercise | ||||||||||||||||
| Grants | Outstanding | Price | Outstanding | Price | ||||||||||||||||
| At December 31, 2016 | 877,977 | 200,982 | $ | 6.46 | 130,066 | $ | 5.92 | |||||||||||||
| Options authorized | - | - | - | - | - | |||||||||||||||
| Options acquired | - | - | - | - | - | |||||||||||||||
| Options granted/vested | (128,000 | ) | 128,000 | 11.04 | 17,100 | 7.27 | ||||||||||||||
| Options exercised | 28,725 | (28,725 | ) | 5.77 | (28,725 | ) | 5.77 | |||||||||||||
| Options expired | (10,000 | ) | (10,000 | ) | 14.15 | (10,000 | ) | 14.15 | ||||||||||||
| Options forfeited | 19,900 | (19,900 | ) | 8.22 | (200 | ) | $ | 8.22 | ||||||||||||
| At December 31, 2017 | 788,602 | 270,357 | $ | 8.29 | 108,241 | $ | 5.41 | |||||||||||||
The aggregate intrinsic value of options outstanding as of December 31, 2017 and 2016 was $1.2 million and $724,000, respectively. The aggregate intrinsic value of options exercisable as of December 31, 2017 and 2016 was $782,000 and $554,000, respectively. The unrecognized compensation expense for outstanding options at December 31, 2017, 2016, and 2015 was $768,000, $279,000, and $29,000, respectively. As of December 31, 2017, this cost is expected to be recognized over a weighted average period of 2.20 years.
- 136 -
| SELECT BANCORP, INC. |
| NOTES TO CONSOLIDATED FINANCIAL STATEMENTS |
| Years Ended December 31, 2017, 2016 and 2015 |
NOTE P - EMPLOYEE AND DIRECTOR BENEFIT PLANS (Continued)
Stock Option Plans (Continued)
The weighted average remaining life of options outstanding and options exercisable as of December 31, 2017 was 6.8 years and 5.41 years, respectively. The weighted average remaining life of options outstanding and options exercisable as of December 31, 2016 was 5.25 years and 3.45 years, respectively. Information regarding the stock options outstanding at December 31, 2017 is summarized below:
| Number | Number | |||||||
| of options | of options | |||||||
| Range of Exercise Prices | outstanding | exercisable | ||||||
| $2.25 - $7.07 | 108,057 | 92,041 | ||||||
| $7.08 - $10.69 | 60,300 | 16,200 | ||||||
| $10.70 - $15.81 | 102,000 | - | ||||||
| Outstanding at end of year | 270,357 | 108,241 | ||||||
A summary of the status of the Company’s non-vested options as of December 31, 2017 and changes during the year ended December 31, 2017, is presented below:
| Weighted-Average | ||||||||
| Grant Date | ||||||||
| Non-vested Options | Options | Fair Value | ||||||
| Non-vested at December 31, 2016 | 70,915 | $ | 3.94 | |||||
| Granted | 128,000 | 5.47 | ||||||
| Vested | (17,100 | ) | 3.86 | |||||
| Expired | - | - | ||||||
| Forfeited | (19,900 | ) | 4.33 | |||||
| Non-vested at December 31, 2017 | 161,915 | 5.11 | ||||||
For the years ended December 31, 2017, 2016 and 2015, the intrinsic value of options exercised was $197,000, $333,000 and $836,000, respectively. For the years ended December 31, 2017, 2016 and 2015, the grant-date fair value of options vested was $66,000, $43,000, and $17,000, respectively. In addition, there were no stock options acquired in the Premara merger. For the years ended December 31, 2017 and 2016, respectively, $93,000 and $75,000 in tax benefits were recognized from non-qualified stock option exercises.
- 137 -
| SELECT BANCORP, INC. |
| NOTES TO CONSOLIDATED FINANCIAL STATEMENTS |
| Years Ended December 31, 2017, 2016 and 2015 |
NOTE Q - PARENT COMPANY FINANCIAL DATA
Following are the condensed balance sheets of Select Bancorp as of and for the years ended December 31, 2017 and 2016 and the related condensed statements of operations and cash flows for each of the years in the three-year period ended December 31, 2017:
Condensed Balance Sheets
December 31, 2017 and 2016
(dollars in thousands)
| 2017 | 2016 | |||||||
| Assets | ||||||||
| Cash balances with Select Bank & Trust | $ | 12,617 | $ | 314 | ||||
| Investment in Select Bank & Trust | 142,762 | 111,739 | ||||||
| Investment in New Century Statutory Trust I | 564 | 551 | ||||||
| Other assets | 4,972 | 4,239 | ||||||
| Total Assets | $ | 160,915 | $ | 116,843 | ||||
| Liabilities and Shareholders’ Equity | ||||||||
| Junior subordinated debentures | $ | 12,372 | $ | 12,372 | ||||
| Accrued interest and other liabilities | 12,428 | 198 | ||||||
| Total Liabilities | 24,800 | 12,570 | ||||||
| Shareholders’ equity: | ||||||||
| Preferred stock | - | - | ||||||
| Common stock | 14,009 | 11,645 | ||||||
| Additional paid-in capital | 95,850 | 69,597 | ||||||
| Retained earnings | 25,858 | 22,673 | ||||||
| Common stock issued to deferred compensation trust | (2,518 | ) | (2,340 | ) | ||||
| Directors’ Deferred Compensation Plan Rabbi Trust | 2,518 | 2,340 | ||||||
| Accumulated other comprehensive income | 398 | 358 | ||||||
| Total Shareholders’ Equity | 136,115 | 104,273 | ||||||
| Total Liabilities and Shareholders’ Equity | $ | 160,915 | $ | 116,843 | ||||
Condensed Statements of Operations
Years Ended December 31, 2017, 2016 and 2015
(dollars in thousands)
| 2017 | 2016 | 2015 | ||||||||||
| Equity in earnings of subsidiaries | $ | (9,236 | ) | $ | (788 | ) | $ | 6,836 | ||||
Dividends in excess of earnings | 13,291 | 8,195 | 257 | |||||||||
| Operating expense | (1,175 | ) | (793 | ) | (814 | ) | ||||||
| Income tax benefit | 305 | 140 | 274 | |||||||||
| Net income | $ | 3,185 | $ | 6,754 | $ | 6,553 | ||||||
- 138 -
| SELECT BANCORP, INC. |
| NOTES TO CONSOLIDATED FINANCIAL STATEMENTS |
| Years Ended December 31, 2017, 2016 and 2015 |
NOTE Q - PARENT COMPANY FINANCIAL DATA (Continued)
Condensed Statements of Cash Flows
Years Ended December 31, 2017, 2016 and 2015
(dollars in thousands)
| 2017 | 2016 | 2015 | ||||||||||
| CASH FLOWS FROM OPERATING ACTIVITIES | ||||||||||||
| Net income | $ | 3,185 | $ | 6,754 | $ | 6,553 | ||||||
| Equity in undistributed income of subsidiaries | 9,236 | 788 | (6,836 | ) | ||||||||
| Stock based compensation | 115 | 71 | 39 | |||||||||
| Net change in other assets | (315 | ) | (308 | ) | (3,375 | ) | ||||||
| Net change in other liabilities | 12,066 | 5 | 11 | |||||||||
| Net cash provided by (used) operating activities | 24,287 | 7,310 | (3,608 | ) | ||||||||
| CASH FLOWS FROM INVESTING ACTIVITIES | ||||||||||||
| Cash received from acquisition | 257 | - | - | |||||||||
| Investment in subsidiary | (12,407 | ) | - | - | ||||||||
| Net cash used in investing activities | (12,150 | ) | - | - | ||||||||
| CASH FLOWS FROM FINANCING ACTIVITIES | ||||||||||||
| Proceeds from stock option exercises | 166 | 527 | 821 | |||||||||
| Redemption of preferred stock | - | (7,645 | ) | - | ||||||||
| Dividends | - | (4 | ) | (77 | ) | |||||||
| Net cash provided by (used) financing activities | 166 | (7,122 | ) | 744 | ||||||||
| Net increase (decrease) in cash and cash equivalents | 12,303 | 188 | (2,864 | ) | ||||||||
| Cash and cash equivalents at beginning of year | 314 | 126 | 2,990 | |||||||||
| Cash and cash equivalents, end of year | $ | 12,617 | $ | 314 | $ | 126 | ||||||
- 139 -
| SELECT BANCORP, INC. |
| NOTES TO CONSOLIDATED FINANCIAL STATEMENTS |
| Years Ended December 31, 2017, 2016 and 2015 |
NOTE R - RELATED PARTY TRANSACTIONS
The Bank has had, and expects to have in the future, banking and other transactions in the ordinary course of business with certain of its current directors, nominees for director, executive officers and associates. All such transactions are made on substantially the same terms, including interest rates, repayment terms and collateral, as those prevailing for comparable transactions with persons not related to the lender, and do not involve more than the normal risk of collection or present other unfavorable features.
The Bank has loan transactions with its directors and executive officers in the regular course of business. Such loans were made in the ordinary course of business and on substantially the same terms and collateral as those for comparable transactions prevailing at the time and did not involve more than the normal risk of collectability or present other unfavorable features. The following table represents loan transactions for directors and executive officers who held that position as of December 31, 2017 and 2016. A summary of related party loan transactions, is as follows:
| 2017 | 2016 | |||||||
| (in thousands) | ||||||||
| Balance at January 1 | $ | 10,534 | $ | 7,127 | ||||
| Exposure of directors/executive officers added | 2,212 | - | ||||||
| Borrowings | 1,469 | 4,143 | ||||||
| Directors/executive officers resigned or retired from board | (67 | ) | - | |||||
| Loan repayments | (628 | ) | (736 | ) | ||||
| Balance at December 31 | $ | 13,520 | $ | 10,534 | ||||
At December 31, 2017, there was $676,000 of unused lines of credit outstanding to directors and executive officers of the Company and its subsidiaries.
NOTE S – CAPITAL TRANSACTIONS
Common Stock
During 2017 the capital of the Company increased primarily due to the acquisition of Premara and its subsidiary bank, Carolina Premier Bank, on December 15, 2017. Premara had 3,179,808 shares of common stock outstanding as of the merger closing date. Under the terms of the merger agreement, 948,080 shares of Premara common stock (equivalent to 30% of Premara’s outstanding shares of common stock as of the date of the merger agreement) were converted to the $12.65 per share cash merger consideration, for aggregate cash consideration of $11,993,212 (exclusive of cash paid-in-lieu of fractional shares). The remaining 2,231,728 Premara common shares were converted into stock consideration at the merger exchange ratio of 1.0463 shares of Company common stock for each share of Premara common stock, resulting in the issuance of 2,334,999 new shares of Company common stock in the merger.
Preferred Stock
As part of the 2014 merger with Legacy Select, the Company issued 7,645 shares of a series A preferred stock in exchange for an equivalent number of shares that Legacy Select Bancorp had previously issued for $7.645 million to the U.S. Treasury as a condition to its participation in the U.S. Treasury’s Small Business Lending Fund (SBLF) program. The U.S. Treasury was the sole holder of the Series A stock. All outstanding shares of the Series A stock held by the U.S. Treasury were redeemed on January 20, 2016, and the Company ceased to have any preferred stock outstanding.
NOTE T – SUBSEQUENT EVENTS
The Company has evaluated for subsequent events through the date and time the financial statements were issued and has determined there are no reportable subsequent events.
- 140 -
ITEM 9 - Changes in and Disagreements with Accountants on Accounting and Financial Disclosure
None.
ITEM 9A – CONTROLS AND PROCEDURES
Evaluation of Disclosure Controls and Procedures
At the end of the period covered by this report, the Company carried out an evaluation, under the supervision and with the participation of the Company’s management, including the Company’s Chief Executive Officer and Chief Financial Officer, of the effectiveness of the design and operation of the Company’s disclosure controls and procedures pursuant to Securities Exchange Act Rule 13a-15.
Based upon that evaluation, the Chief Executive Officer and Chief Financial Officer have concluded that the Company’s disclosure controls and procedures were effective (1) to provide reasonable assurance that information required to be disclosed by the Company in the reports filed or submitted by it under the Securities Exchange Act was recorded, processed, summarized and reported within the time periods specified in the SEC’s rules and forms, and (2) to provide reasonable assurance that information required to be disclosed by the Company in such reports is accumulated and communicated to the Company’s management, including its Chief Executive Officer and Chief Financial Officer, as appropriate to allow for timely decisions regarding required disclosure.
Management's Annual Report on Internal Control over Financial Reporting
Management is responsible for preparing the Company’s annual consolidated financial statements and for establishing and maintaining adequate internal control over financial reporting for the Company. The Company's internal control over financial reporting is a process designed under the supervision of the Company's Chief Executive Officer and Chief Financial Officer to provide reasonable assurance regarding the reliability of financial reporting and the preparation of the Company's financial statements for external reporting purposes in accordance with U.S. generally accepted accounting principles.
As permitted by guidance provided by the staff of the U.S. Securities and Exchange Commission, the scope of management's assessment of internal control over financial reporting as of December 31, 2017 has excluded the operations of Premara Financial, Inc. ("Premara"), which was acquired on December 15, 2017 by the company. Premara represented 1 percent of consolidated revenue (interest income and non-interest income) for the year ended December 31, 2017, and 23 percent of consolidated assets as of December 31, 2017.
All internal control systems, no matter how well designed, have inherent limitations. Therefore, even systems that are deemed to be effective can provide only reasonable assurance with respect to financial statement preparation and presentation. Also, projections of any evaluation of effectiveness to future periods are subject to the risk that controls may become inadequate due to changes in conditions, or that the degree of compliance with the policies or procedures may deteriorate.
- 141 -
Management has made a comprehensive review, evaluation and assessment of the Company's internal control over financial reporting as of December 31, 2017. In making its assessment of internal control over financial reporting as of December 31, 2017, Management used the criteria issued by the Committee of Sponsoring Organizations of the Treadway Commission (“COSO”) in Internal Control−Integrated Framework (2013) (the “2013 Framework”).
Based on this assessment, Management has concluded that that the Company’s internal control over financial reporting as of December 31, 2017 was effective based on those criteria.
The effectiveness of the Company’s internal control over financial reporting as of December 31, 2017 has been audited by Dixon Hughes Goodman LLP, an independent registered public accounting firm, as stated in their report which appears herein.
| Date: March 16, 2018 | /s/ William L. Hedgepeth II |
| William L. Hedgepeth II | |
| President and Chief Executive Officer | |
| Date: March 16, 2018 | /s/ Mark A. Jeffries |
| Mark A. Jeffries | |
| Executive Vice President, Chief Financial Officer |
Changes in Internal Control over Financial Reporting
Management of the Company has evaluated, with the participation of the Company's Chief Executive Officer and Chief Financial Officer, changes in the Company's internal controls over financial reporting (as defined in Rule 13a−15(f) and 15d−15(f) of the Exchange Act) during the fourth quarter of 2017. Management has concluded that there have been no changes to the Company’s internal controls over financial reporting that occurred since the beginning of the Company’s fourth quarter of 2017 that have materially affected, or are likely to materially affect, the Company’s internal control over financial reporting.
None.
- 142 -
Item 10 – Directors, Executive Officers AND CORPORATE GOVERNANCE
Incorporated by reference to the Registrant’s Proxy Statement for the 2018 Annual Meeting of Shareholders.
The Registrant has adopted a code of ethics for its directors as well as a code of ethics specifically for its senior financial officers. Each of these policies is posted in the “Corporate Governance” section of the “Investor Relations” page of the Registrant’s website: www.selectbank.com.
Item 11 - Executive Compensation
Incorporated by reference to the Registrant’s Proxy Statement for the 2018 Annual Meeting of Shareholders.
Item 12 - Security Ownership of Certain Beneficial Owners and Management AND RELATED STOCKHOLDER MATTERS
Incorporated by reference to the Registrant’s Proxy Statement for the 2018 Annual Meeting of Shareholders.
Equity Compensation Plan Information. In 2000, the shareholders of Select Bank & Trust approved the New Century Bank 2000 Nonqualified Stock Option Plan for Directors (the “2000 Nonqualified Plan”) and the New Century Bank 2000 Incentive Stock Option Plan (the “2000 Incentive Plan”). Both plans were adopted by the Registrant upon its organization as the holding company for New Century Bank on September 19, 2003. At the 2004 Annual Meeting of Shareholders, the shareholders approved amendments to the 2000 Nonqualified Plan and the 2000 Incentive Plan and also approved the New Century Bancorp, Inc. 2004 Incentive Stock Option Plan. The maximum number of shares reserved for issuance upon the exercise of outstanding options granted under the 2000 Nonqualified Plan is 478,627 (adjusted for stock dividends). The maximum number of shares reserved for issuance upon the exercise of outstanding options granted under the 2000 Incentive Plan is 278,102 (adjusted for stock dividends). The maximum number of shares reserved for issuance upon exercise of outstanding options granted under the 2004 Incentive Plan is none. Option prices for each of the plans are established at market value at the time of grant.
On May 11, 2010, the shareholders of the Company approved the implementation of the New Century Bancorp, Inc. 2010 Omnibus Stock Ownership and Long-Term Incentive Plan (the “Omnibus Plan”). The Omnibus Plan provides for the grant of incentive stock options, non-qualified stock options, restricted stock, long-term incentive compensation units and stock appreciation rights. Officers and other full-time employees of the Company and the Bank, including executive officers and directors, are eligible to receive awards under the Omnibus Plan. The maximum number of shares reserved for issuance in connection with equity awards granted under the Omnibus Plan is 250,000 (adjusted for stock dividends).
- 143 -
The following chart contains details of the grants:
| Number of securities | ||||||||||||
| remaining available | ||||||||||||
| Weighted-average | for future issuance | |||||||||||
| Number of securities | exercise price of | under equity | ||||||||||
| to be issued upon | outstanding | compensation plans | ||||||||||
| exercise of | options, | (excluding securities | ||||||||||
| Plan Category | outstanding options, | warrants and rights | reflected in column (a)) | |||||||||
| (a) | (b) | (c) | ||||||||||
| Equity compensation plans approved by security holders | 270,357 | $ | 8.29 | 877,977 | ||||||||
| Equity compensation plans not approved by security holders | none | n/a | none | |||||||||
| Total | 270,357 | $ | 8.29 | 877,977 | ||||||||
Item 13 - Certain Relationships and Related Transactions, AND DIRECTOR INDEPENDENCE
Incorporated by reference to the Registrant’s Proxy Statement for the 2018 Annual Meeting of Shareholders.
ITEM 14 – PRINCIPAL ACCOUNTING FEES AND SERVICES
Incorporated by reference to the Registrant’s Proxy Statement for the 2018 Annual Meeting of Shareholders.
- 144 -
Item 15 – Exhibits, FINANCIAL STATEMENT SCHEDULES
| (a) | The following documents are filed as part of this report: |
| 1. | Financial statements required to be filed by Item 8 of this Form: |
Report of Independent Registered Public Accounting Firm
Consolidated Balance Sheets as of December 31, 2017 and 2016
Consolidated Statements of Operations for the years ended December 31, 2017, 2016 and 2015
Consolidated Statements of Comprehensive Income for the years ended December 31, 2017, 2016 and 2015
Consolidated Statements of Changes in Shareholders’ Equity for the years ended December 31, 2017, 2016 and 2015
Consolidated Statements of Cash Flows for the years ended December 31, 2017, 2016 and 2015
Notes to Consolidated Financial Statements.
| 2. | Financial statement schedules required to be filed by Item 8 of this Form: |
None
| 3. | Exhibits: See below exhibit index. |
- 145 -
| 10.10 | Directors’ Deferral Plan, as amended and restated (compensatory plan) | Filed herewith |
- 146 -
| Incorporated by Reference (Unless Otherwise Indicated) | ||||||||||
| Exhibit No. |
Description of Exhibit | Form | Exhibit | Filing Date |
SEC File No. | |||||
| 21.1 | Subsidiaries | Filed herewith | ||||||||
| 23.1 | Consent of Dixon Hughes Goodman LLP | Filed herewith | ||||||||
| 31.1 | Certification of Principal Executive Officer Pursuant to Section 302 of the Sarbanes-Oxley Act | Filed herewith | ||||||||
| 31.2 | Certification of Principal Financial Officer Pursuant to Section 302 of the Sarbanes-Oxley Act | Filed herewith | ||||||||
| 32.1 | Certification of Principal Executive Officer Pursuant to Section 906 of the Sarbanes-Oxley Act | Furnished herewith | ||||||||
| 32.2 | Certification of Principal Financial Officer Pursuant to Section 906 of the Sarbanes-Oxley Act | Furnished herewith | ||||||||
| 101 | The following financial information formatted in XBRL (eXtensible Business Reporting Language) includes: (i) the Consolidated Balance Sheets as of December 31, 2017 and 2016; (ii) the Consolidated Statements of Operations for the years ended December 31, 2017, 2016 and 2015; (ii) the Consolidated Statements of Comprehensive Income for the years ended December 31, 2017, 2016 and 2015; (iv) the Consolidated Statements of Changes in Shareholders’ Equity for the years ended December 31, 2017, 2016 and 2015; (v) the Consolidated Statements of Cash Flows for the years ended December 31, 2017, 2016 and 2015; and (vi) Notes to Consolidated Financial Statements, tagged as blocks of text | Filed herewith | ||||||||
- 147 -
SIGNATURES
Pursuant to the requirements of Section 13 or 15(d) of the Securities Exchange Act of 1934, the Registrant has duly caused this Report to be signed on its behalf by the undersigned thereunto duly authorized.
| SELECT BANCORP, INC. | |
| Registrant |
| By: | /s/ William L. Hedgepeth II | |
| William L. Hedgepeth, II | ||
| Date: March 16, 2018 | President and Chief Executive Officer |
- 148 -
Pursuant to the Securities Exchange Act of 1934, this Report has been signed below by the following persons on behalf of the Registrant and in the capacities and on the dates indicated.
| /s/ William L. Hedgepeth, II | March 16, 2018 |
| William L. Hedgepeth, II., President, | |
| Chief Executive Officer and Director | |
| /s/ Mark A. Jeffries | March 16, 2018 |
| Mark A. Jeffries, Executive Vice President and | |
| Chief Financial Officer | |
| (Principal Financial Officer and Principal Accounting Officer) | |
| /s/ J. Gary Ciccone | March 16, 2018 |
| J. Gary Ciccone, Director | |
| /s/ Charles R. Davis | March 16, 2018 |
| Charles R. Davis, Director | |
| /s/ James H. Glen, Jr. | March 16, 2018 |
| James H. Glen, Jr. Director | |
| /s/ Oscar N. Harris | March 16, 2018 |
| Oscar N. Harris, Director | |
| /s/ Alicia S. Hawk | March 16, 2018 |
| Alicia S. Hawk, Director | |
| /s/ Gerald W. Hayes, Jr. | March 16, 2018 |
| Gerald W. Hayes, Jr., Director | |
| /s/ Ronald V. Jackson | March 16, 2018 |
| Ronald V. Jackson, Director | |
| /s/ John W. McCauley | March 16, 2018 |
| John W. McCauley, Director | |
| /s/ Carlie C. McLamb, Jr. | March 16, 2018 |
| Carlie C. McLamb Jr., Director | |
| /s/ V. Parker Overton | March 16, 2018 |
| V. Parker Overton, Director | |
| /s/ Anthony E. Rand | March 16, 2018 |
| Anthony E. Rand, Director |
- 149 -
| /s/ Sharon L. Raynor | March 16, 2018 |
| Sharon L. Raynor, Director | |
| /s/ K. Clark Stallings | March 16, 2018 |
| K. Clark Stallings, Director | |
| /s/ W. Lyndo Tippett | March 16, 2018 |
| W. Lyndo Tippett, Director | |
| /s/ Seth Wilfong | March 16, 2018 |
| Seth Wilfong, Director |
- 150 -