Attached files
| file | filename |
|---|---|
| 8-K - FB FINANCIAL CORP 8-K - FB Financial Corp | a51500223.htm |
| EX-99.3 - EXHIBIT 99.2 - FB Financial Corp | a51500223ex99_2.htm |
| EX-99.1 - EXHIBIT 99.1 - FB Financial Corp | a51500223ex99_1.htm |
Exhibit 99.3

Fourth Quarter 2016 Earnings Presentation January 27,2017

This presentation contains “forward-looking statements” made pursuant to the safe harbor provisions of the Private Securities Litigation Reform Act of 1995. All statements other than statements of historical fact are forward-looking statements. You can identify these forward-looking statements through the Company’s use of words such as “believes,” “anticipates,” “expects,” “may,” “will,” “assumes,” “should,” “predicts,” “could,” “would,” “intends,” “targets,” “estimates,” “projects,” “plans,” “potential” and other similar words and expressions of the future or otherwise regarding the outlook for the Company’s future business and financial performance and/or the performance of the banking and mortgage industry and economy in general. Investors are cautioned that any such forward-looking statements are not guarantees of future performance and involve known and unknown risks and uncertainties which may cause the actual results, performance or achievements of the Company to be materially different from the future results, performance or achievements expressed or implied by such forward-looking statements. Forward-looking statements are based on the information known to, and current beliefs and expectations of, the Company’s management and are subject to significant risks and uncertainties. Actual results may differ materially from those contemplated by such forward-looking statements. A number of factors could cause actual results to differ materially from those contemplated by the forward-looking statements in this presentation including, without limitation, the risks and other factors set forth in the Company’s final prospectus filed pursuant to Rule 424(b)(4) under the Securities Act of 1933, as amended, filed with the U.S. Securities and Exchange Commission on September 19, 2016 (Registration No. 333-213210) under the captions “Cautionary note regarding forward-looking statements” and “Risk factors.” Many of these factors are beyond the Company’s ability to control or predict. The Company believes the forward-looking statements contained herein are reasonable; however, undue reliance should not be placed on any forward-looking statements, which are based on current expectations and speak only as of the date that they are made. The Company does not assume any obligation to update any forward-looking statements as a result of new information, future developments or otherwise, except as otherwise may be required by law. Forward looking statements

Use of non-GAAP financial measures This presentation contains certain financial measures that are not measures recognized under U.S. generally accepted accounting principles (GAAP) and therefore are considered non-GAAP financial measures. These non-GAAP financial measures include, without limitation, core net income, core diluted earnings per share, core total revenues, core return on average assets, core return on average equity, core return on average tangible common equity and core efficiency ratios, in each case excluding certain income and expense items that the Company’s management considers to be non-core in nature. The Company refers to these non-GAAP measures as core measures. This presentation also uses tangible book value per common share and the tangible common equity to tangible assets ratio, which are non-GAAP measures that exclude the impact of goodwill and other intangibles, and core deposits, which is a non-GAAP measure that excludes jumbo time deposits (greater than $250,000) from total deposits. The Company’s management uses these non-GAAP financial measures in their analysis of the Company’s performance, financial condition and the efficiency of its operations. Management believes that these non-GAAP financial measures provide a greater understanding of ongoing operations and enhance comparability of results with prior periods as well as demonstrating the effects of significant non-core gains and charges in the current period. The Company’s management also believes that investors find these non-GAAP financial measures useful as they assist investors in understanding our underlying operating performance and the analysis of ongoing operating trends. In addition, because intangible assets such as goodwill and other intangibles, and the other items excluded each vary extensively from company to company, the Company believes that the presentation of this information allows investors to more easily compare the Company’s results to the results of other companies. However, the non-GAAP financial measures discussed herein should not be considered in isolation or as a substitute for the most directly comparable or other financial measures calculated in accordance with GAAP. Moreover, the manner in which we calculate the non-GAAP financial measures discussed herein may differ from that of other companies reporting measures with similar names. You should understand how such other banking organizations calculate their financial measures similar or with names similar to the non-GAAP financial measures we have discussed herein when comparing such non-GAAP financial measures. A reconciliation of these non-GAAP financial measures to the most directly comparable GAAP measures are provided on the appendix to this presentation.

Non-GAAP Core results1 3 months endedDecember 31, 2016 Diluted earnings per share $0.43 Net income $10.5 million Return on average assets 1.30% Return on average equity 13.1% Return on average tangible common equity 15.6% Efficiency ratio 73.7% 4Q 2016 Highlights Total revenues of $60.4 million for the quarter, up 22.2% from 4Q 2015Continued customer-focused balance sheet growth resulting in NIM (tax equivalent) of 3.99%Loans (HFI) grew 8.6% to $1.85 billion from 4Q 2015 and 12.4% annualized from 3Q 2016Total deposits grew 9.6% to $2.67 billion from 4Q 2015 and 4.8% annualized from 3Q 2016Record mortgage loan closings totaling $1.55 billion for the quarter, up 126% from 4Q 2015Nonperforming assets to total assets declined to 0.58% from 0.86% at 4Q 2015Tangible book value per share was $11.58 and tangible common equity / tangible assets was 8.65% at 4Q 20161 Key highlights Financial results Note: Financial data as of December 31, 2016. 1 Core results are non-GAAP financial measures that adjust GAAP reported net income and other metrics for non-core income and expense items and pro forma provision for federal income taxes as outlined in the non-GAAP reconciliation calculations, using a combined marginal income tax rate of 39.225% and exclude one-time items. See “Use of non-GAAP financial measures” and the Appendix hereto.

Delivering profitability and growth Drivers of profitability improvement 1 Our pro forma net income and pro forma core net income include a pro forma provision for federal income taxes using a combined effective income tax rate of 38.51%, 37.32%, 37.45%, 37.21% and 34.70% for the quarters ended December 31, 2015, March 31, 2016, June 30, 2016, September 30, 2016, and December 31, 2016, respectively, and also include the exclusion of a one-time tax charge in 3Q 2016.2 Our pro forma core income excludes certain non-core items as described in the non-GAAP disclosures. Pro forma core net income2 ($mm) NIM (%) Noninterest income ($mm) Growth: 30.0% NPA / assets (%) +14 bps (28) bps Pro forma core net income growth: 30% $5.9 $9.8 $10.6 $10.0 $9.0 Loans / deposits (%) Reported net income ($mm) $9.2 $14.6 $15.8 $1.2 $9.0

Net interest margin driven by multiple levers Historical yield and costs Source: Company informationNote: Financial data as of December 31, 20161 Includes tax-equivalent adjustment NIM (%) 3.85% 4.03% 4.40% 4.05% 3.99% NIM, ex-accretion (%) 3.82% 3.90% 4.16% 3.94% 3.94% Deposit cost (%) 0.28% 0.29% 0.28% 0.30% 0.29% Loan (HFI) yield 4Q 2015 3Q 2016 4Q 2016 Contractual interest rate on loans HFI1 4.77% 4.66% 4.79% Origination and other loan fee income 0.21% 0.52% 0.41% 4.99% 5.18% 5.20% Accretion on purchased loans 0.06% 0.19% 0.08% Loan syndication fees -- -- -- Total loan yield (HFI) 5.05% 5.37% 5.27%

Consistent loan growth and balanced portfolio Total loan growth1 ($mm) and commercial real estate concentration Loan portfolio breakdown1 4Q 2015 4Q 2016 Total HFI loans: $1,849mm Source: Company filings; Note: Financial data as of December 31, 20161 Exclude HFS loans, C&I includes owner-occupied CRE2 Risk-based capital at bank level as reported in Call Report. 4Q 2016 calculation is preliminary and subject to change. Commercial real estate (CRE) concentration2 % of risk-based Capital 4Q 2015 4Q 2016 C&D loans subject to 100% risk-based capital limit 99% 81% Total CRE loans subject to 300% risk-based capital limit 208% 185% 4Q16:

Stable, low cost core deposit franchise Total deposits ($mm) Source: Company filings; Note: Financial data as of December 31, 20161 Includes $45.4 million in mortgage servicing-related escrow deposits compared to $61.6 million at 3Q 2016. Noninterest bearing deposits ($mm)1 Growth: 11.2% Deposit composition Cost of deposits Total deposit growth: 9.6%

Mortgage Banking impacted by higher rates, seasonality Mortgage Banking income $26.2 million, down 29% from 3Q 2016 and up 37% from 4Q 2015, primarily due to lower interest rate lock (IRLC) pipelineIRLC pipeline declined 37% from $851 million at 3Q 2016 to $533 million at 4Q 2016Record mortgage closings of $1.55 billion Growth in Correspondent channel shifted overall pipeline mix resulting in a decrease in overall marginsBusiness model beginning to shift to increased purchase volumes given market environment within Consumer Direct and other channelsCompleted sale of $34 million of mortgage servicing rights (MSRs), combined with hedge losses, transaction costs and remaining MSR impairment recovery resulted in net loss of $1.0 million Closings volume by line of business (%) Interest rate driven decline in lock volumes Source: Company filings; Note: Financial data as of December 31, 2016 $17.6 $33.3 $22.4 Gain on Sale ($mm) IRLC pipeline volume mix by purpose (%) IRLC pipeline volume by line of business (%) Consumer Direct Correspondent Reverse Third party originated Retail Retail footprint Refinance Purchase Consumer Direct Correspondent Reverse Third party originated Retail Retail footprint Servicing Revenue ($mm) $1.5 $3.7 $3.8 4Q 2015 3Q 2016 4Q 2016 $684mn $1,592mn $1,334mn IRLC volume: IRLC pipeline: $263mn $851mn $533mn

Improving operating leverage remains a key objective Continued focus to achieve better operating leverageBank’s core system creates a scalable platform designed to drive and support growth across marketsCapacity to grow business in key metropolitan markets, especially Nashville MSA, without adding significant bankers or branchesContinue to centralize operations and support functions while protecting our decentralized client service model Efficiency ratio (tax-equivalent basis)1 Improving operating efficiency Source: Company filings1 See “Use of non-GAAP financial measures” and the Appendix hereto.

Asset quality continues to improve Source: Company filings. Financials as of December 31, 2016. Classified loans ($mm) Net charge-offs / average loans NPAs / assets LLR / loans (28) bps ($10) mm
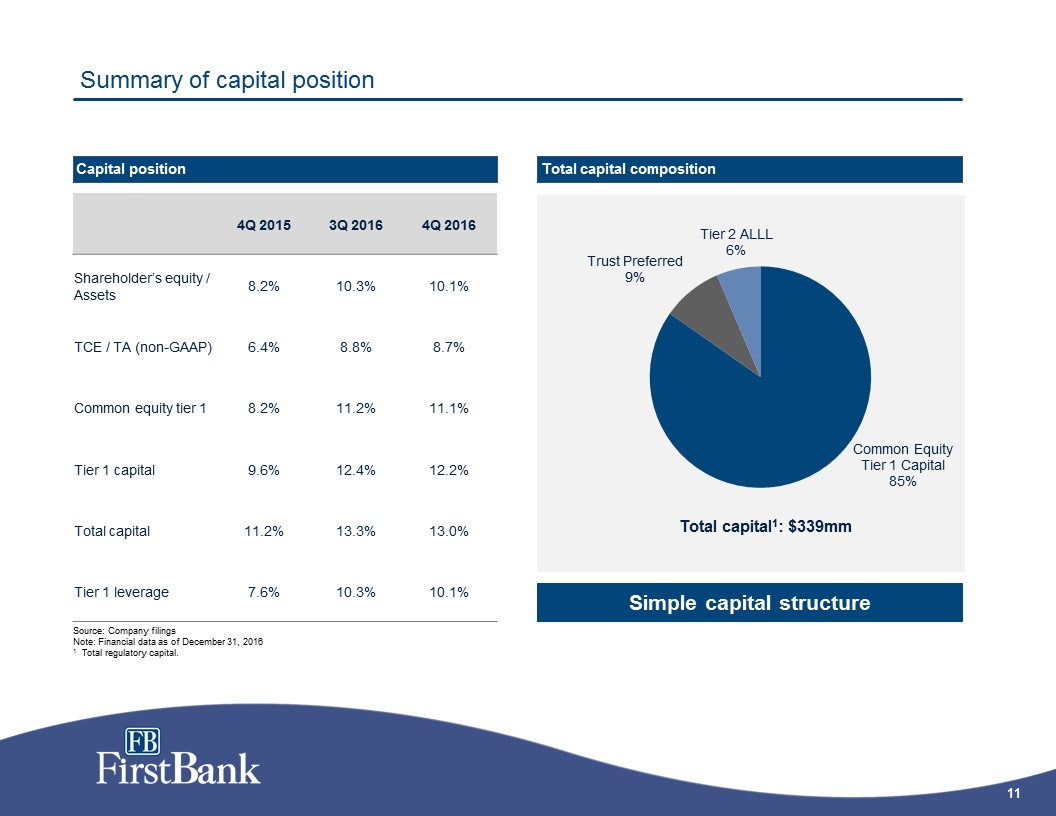
Summary of capital position Source: Company filingsNote: Financial data as of December 31, 20161 Total regulatory capital. Capital position Total capital composition 4Q 2015 3Q 2016 4Q 2016 Shareholder’s equity / Assets 8.2% 10.3% 10.1% TCE / TA (non-GAAP) 6.4% 8.8% 8.7% Common equity tier 1 8.2% 11.2% 11.1% Tier 1 capital 9.6% 12.4% 12.2% Total capital 11.2% 13.3% 13.0% Tier 1 leverage 7.6% 10.3% 10.1% Simple capital structure

Appendix

Strategic drivers Balanced business model buoyed by low-cost core deposit base Experienced senior management team Strong financial performer: delivering profitability and growth Community bank culture and family values Scalable mortgage platform Complementary positions in high growth metropolitan markets and stable community markets

Attractive footprint with balance between community markets and platforms in high growth metropolitan markets 269123Blue dots 193210228Metro markets 130131135Highway 167169172State county outlines 8715487Green dots 148194148Community markets Source files are619754_FirstBank Bancorp.ai and mapinfo Note: Financial data as of December 31, 2016. Market data as of June 30, 2016, pro forma for acquisitions. Size of bubble represents size of company deposits in a given marketSource: Company data and SNL Financial; 1 Statistics based on county data. Nashville MSA Knoxville MSA Chattanooga MSA Huntsville MSA Memphis MSA Jackson MSA Metropolitan marketsCommunity markets Our footprint Total loans (excluding HFS) Total branches Total deposits Market rank by deposits: Nashville (13th)Chattanooga (7th) Jackson (5th) Memphis (41st)Knoxville (43rd) Huntsville (21st) Paris Crossville Dayton Shelbyville Smithville Fayetteville Waverly Linden Parsons Camden Huntingdon Lexington

Selected financial data Source: Company filings. 1 These measures are considered non-GAAP financial measures. See “Use of Non-GAAP financial measures” and the corresponding financial tables below for a reconciliation and discussion of these non-GAAP measures.Note: Financial data as of December 31, 2016
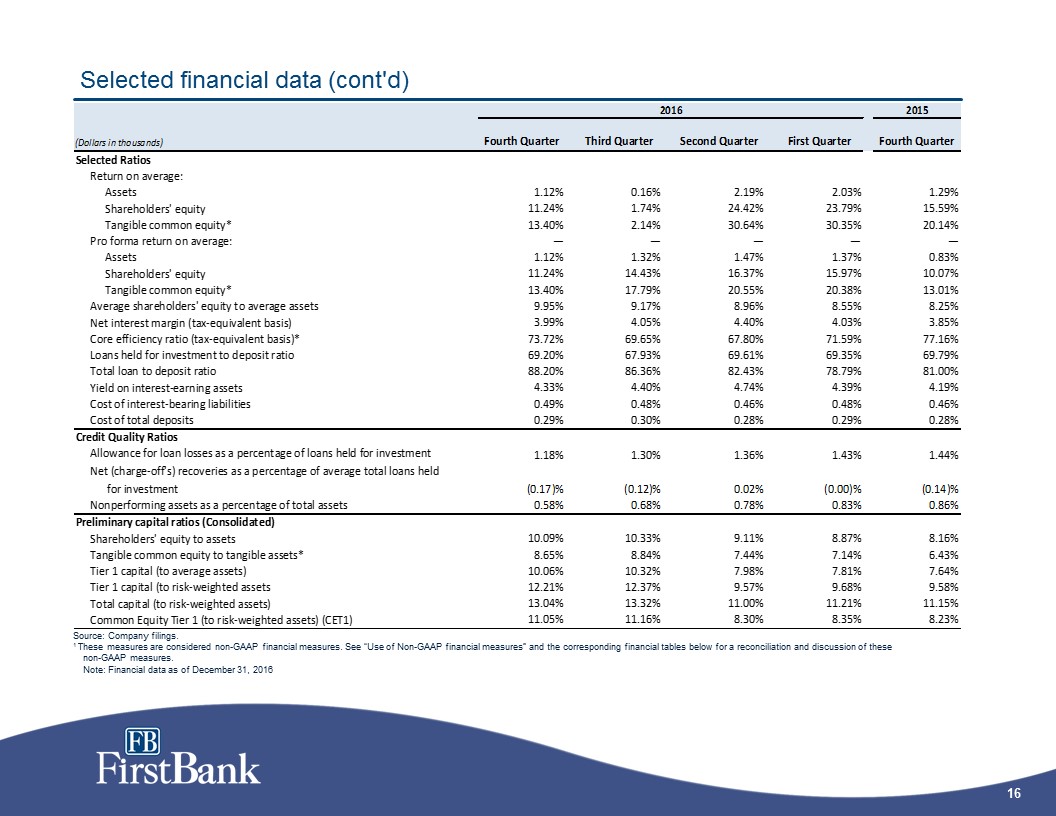
Selected financial data (cont'd) Source: Company filings. 1 These measures are considered non-GAAP financial measures. See “Use of Non-GAAP financial measures” and the corresponding financial tables below for a reconciliation and discussion of these non-GAAP measures.Note: Financial data as of December 31, 2016

4Q 2016 Highlights Source: Company filings. Financial data as of December 31, 2016* These measures are considered non-GAAP financial measures. See “Use of Non-GAAP financial measures” and the corresponding financial tables below for a reconciliation and discussion of these non-GAAP measures. 1 Prior to the IPO in the third quarter of 2016, the Company was an S corporation and did not incur federal income taxes. In conjunction with the IPO, the Company converted to a C corporation. These results are on a pro forma basis to reflect the results of the Company on a C corporation basis. Reported net income as an S corporation was $9,191 with diluted EPS of $0.53 while ROAA, ROAE and ROTCE were 1.29%, 15.59% and 20.14%, respectively.2 Core results are presented pro forma for conversion from S corporation to C corporation status.

GAAP reconciliation and use of non-GAAP financial measures Pro forma core net income Source: Company filings. Note: Financial data as of December 31, 2016

GAAP reconciliation and use of non-GAAP financial measures Tax-equivalent efficiency ratio Source: Company filings. Note: Financial data as of December 31, 2016

GAAP reconciliation and use of non-GAAP financial measures Segment tax-equivalent efficiency ratio Source: Company filings. Note: Financial data as of December 31, 2016

GAAP reconciliation and use of non-GAAP financial measures Tangible assets and equity Return on average tangible equity Source: Company filings. Note: Financial data as of December 31, 2016

GAAP reconciliation and use of non-GAAP financial measures Pro forma return on average tangible common equity Source: Company filings. Note: Financial data as of December 31, 2016 Pro forma core return on average tangible equity Pro forma core return on average assets and equity

GAAP reconciliation and use of non-GAAP financial measures Pro forma core total revenue Core deposits Source: Company filings. Note: Financial data as of December 31, 2016