Attached files
| file | filename |
|---|---|
| EX-99.2 - EXHIBIT-99.2 - Goodman Networks Inc | d288074dex992.htm |
| EX-10.1 - EXHIBIT-10.1 - Goodman Networks Inc | d288074dex101.htm |
| 8-K - FORM 8-K - Goodman Networks Inc | d288074d8k.htm |
Exhibit 99.1

Goodman Networks Financial Review
December 2, 2016
Goodman Networks
Network Knowledge…Delivered
Disclaimer
PROVIDED
PURSUANT TO NON-DISCLOSURE
AGREEMENT
DRAFT – SUBJECT TO REVISION
PREPARED AT DIRECTION OF COUNSEL
This presentation contains forward-looking statements, which are subject to various risks and uncertainties. Forward-looking statements are neither historical facts nor assurances
of future performance. They are based only on our current beliefs, expectations and assumptions regarding the future of our business, future plans and strategies, projections, anticipated events and trends, the economy and other future conditions,
which may be unreliable, and there can be no assurance that such statements will be reflective of actual outcomes. Our results could differ materially from those projected. Forward-looking statements can be identified by words such as:
“anticipate,” “intend,” “plan,” “goal,” “seek,” “believe,” “project,” “estimate,” “expect,” “strategy,” “future,” “likely,”
“may,” “should,” “will” and similar references to future periods. No representation is made as to the accuracy, continued accuracy or completeness of such statements.
The financial forecasts included in this presentation:
are speculative by their nature and is
based upon numerous expectations, beliefs, opinions, and assumptions which are inherently uncertain and many of which are beyond the control of the Company and may not prove to be accurate;
does not reflect future changes in general business or economic conditions, or any other transaction or event that may occur and that was not anticipated at the time the
information was prepared;
may not reflect future performance, which may be significantly more favorable or less favorable than as set forth in the prospective
financial information; and
is not, and should not be regarded as, a representation that any of the expectations contained in, or forming a part of, the forecasts
will be achieved.
All of the financial information contained herein is forward-looking in nature. The information is subjective in many respects and thus subject
to interpretation. Further, the information relates to multiple future years and such information by its nature becomes less predictive with each succeeding day. The Company cannot provide assurance that the financial projections will be realized;
rather, actual future financial results may vary materially from the forward-looking information.
Except as required by law, the Company does not intend to update
or revise publicly any of the prospective financial information to reflect circumstances or other events occurring after the date the financial projections were prepared or to reflect the occurrence of future events. These considerations should be
taken into account in reviewing the financial projections, which were prepared as of an earlier date. For additional information on factors that may cause actual future financial results to vary materially from the prospective financial information,
see the section entitled “Cautionary Note Regarding Forward-Looking Statements” below. 2
Goodman Networks
Network
Knowledge…Delivered
Financial Summary
Financial Projections
PROVIDED PURSUANT TO NON-DISCLOSURE
AGREEMENT
DRAFT – SUBJECT TO REVISION
PREPARED AT DIRECTION OF COUNSEL
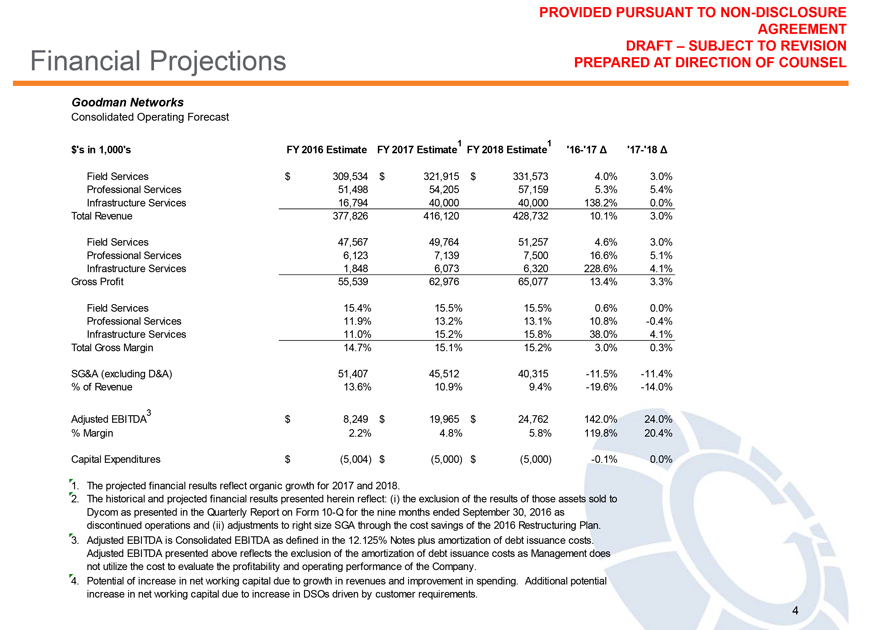
Goodman Networks
Consolidated Operating Forecast
$’s in 1,000’s FY 2016 Estimate FY 2017 Estimate1 FY
2018 Estimate1 ‘16-‘17 ‘17-‘18
Field Services $309,534 $321,915
$331,573 4.0% 3.0%
Professional Services 51,498 54,205 57,159 5.3% 5.4%
Infrastructure Services 16,794 40,000 40,000 138.2% 0.0%
Total Revenue
377,826 416,120 428,732 10.1% 3.0%
Field Services 47,567 49,764 51,257 4.6% 3.0%
Professional Services 6,123 7,139 7,500 16.6% 5.1%
Infrastructure Services 1,848 6,073 6,320
228.6% 4.1%
Gross Profit 55,539 62,976 65,077 13.4% 3.3%
Field Services 15.4%
15.5% 15.5% 0.6% 0.0%
Professional Services 11.9% 13.2% 13.1% 10.8% -0.4%
Infrastructure Services 11.0% 15.2% 15.8% 38.0% 4.1%
Total Gross Margin 14.7%
15.1% 15.2% 3.0% 0.3%
SG&A (excluding D&A) 51,407 45,512 40,315 -11.5% -11.4%
% of Revenue 13.6% 10.9% 9.4% -19.6% -14.0%
Adjusted EBITDA3 $8,249 $19,965 $24,762 142.0%
24.0%
% Margin 2.2% 4.8% 5.8% 119.8% 20.4%
Capital Expenditures $(5,004)
$(5,000) $(5,000) -0.1% 0.0%
1. The projected financial results reflect organic growth for 2017 and 2018.
2. The historical and projected financial results presented herein reflect: (i) the exclusion of the results of those assets sold to Dycom as presented in the Quarterly Report on
Form 10-Q for the nine months ended September 30, 2016 as discontinued operations and (ii) adjustments to right size SGA through the cost savings of the 2016 Restructuring Plan.
3. Adjusted EBITDA is Consolidated EBITDA as defined in the 12.125% Notes plus amortization of debt issuance costs.
Adjusted EBITDA presented above reflects the exclusion of the amortization of debt issuance costs as Management does not utilize the cost to evaluate the profitability and
operating performance of the Company.
4. Potential of increase in net working capital due to growth in revenues and improvement in spending. Additional potential
increase in net working capital due to increase in DSOs driven by customer requirements. 4
Cash Walkforward
PROVIDED
PURSUANT TO NON-DISCLOSURE
AGREEMENT
DRAFT – SUBJECT TO REVISION
PREPARED AT DIRECTION OF COUNSEL
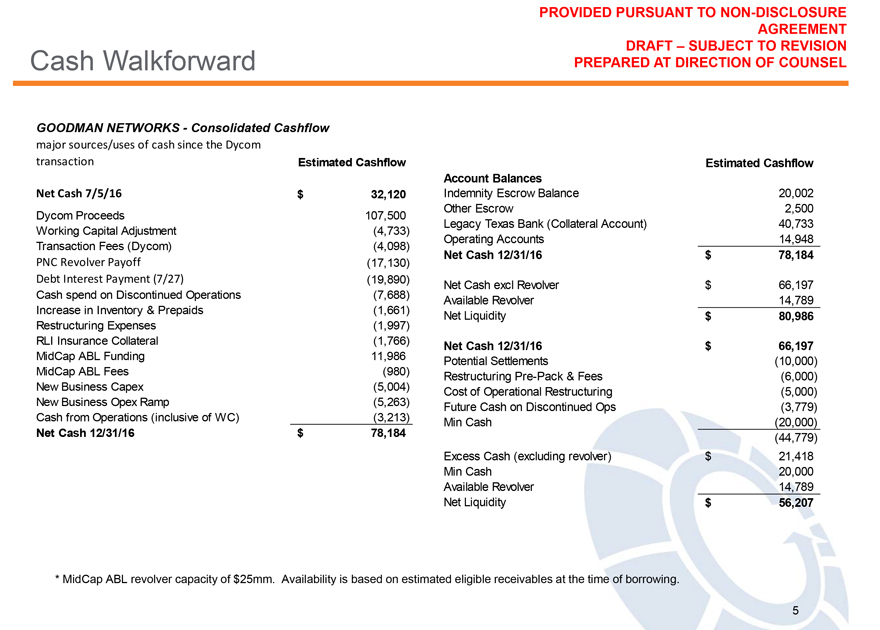
GOODMAN NETWORKS - Consolidated Cashflow major sources/uses of cash since the Dycom
transaction Estimated Cashflow
Net Cash 7/5/16 $32,120
Dycom Proceeds 107,500
Working Capital Adjustment (4,733)
Transaction Fees (Dycom) (4,098)
PNC Revolver Payoff (17,130)
Debt Interest Payment (7/27) (19,890)
Cash spend on Discontinued Operations
(7,688)
Increase in Inventory & Prepaids (1,661)
Restructuring
Expenses (1,997)
RLI Insurance Collateral (1,766)
MidCap ABL Funding 11,986
MidCap ABL Fees (980)
New Business Capex (5,004)
New Business Opex Ramp (5,263)
Cash from Operations (inclusive of WC) (3,213)
Net Cash 12/31/16 $78,184
Estimated Cashflow
Account Balances
Indemnity Escrow Balance 20,002
Other Escrow 2,500
Legacy Texas Bank (Collateral Account) 40,733
Operating Accounts 14,948
Net Cash 12/31/16 $78,184
Net Cash excl Revolver $66,197
Available Revolver 14,789
Net Liquidity $80,986
Net Cash 12/31/16 $66,197
Potential Settlements (10,000)
Restructuring
Pre-Pack & Fees (6,000)
Cost of Operational Restructuring (5,000)
Future Cash on Discontinued Ops (3,779)
Min Cash (20,000)
(44,779)
Excess Cash (excluding revolver) $21,418
Min Cash 20,000
Available Revolver 14,789
Net Liquidity $56,207
* MidCap ABL revolver capacity of $25mm. Availability is based on
estimated eligible receivables at the time of borrowing. 5