Attached files
| file | filename |
|---|---|
| EX-32.1 - EXHIBIT 32.1 - SHILOH INDUSTRIES INC | exhibit321q4fy16.htm |
| EX-31.2 - EXHIBIT 31.2 - SHILOH INDUSTRIES INC | exhibit312q4fy16.htm |
| EX-31.1 - EXHIBIT 31.1 - SHILOH INDUSTRIES INC | exhibit311q4fy16.htm |
| EX-24.1 - EXHIBIT 24.1 - SHILOH INDUSTRIES INC | exhibit241fy16powerofattor.htm |
| EX-23.1 - EXHIBIT 23.1 - SHILOH INDUSTRIES INC | exhibit231fy16consentofind.htm |
| EX-21.1 - EXHIBIT 21.1 - SHILOH INDUSTRIES INC | exhibit211fy16listofsubsid.htm |
| EX-10.23 - EXHIBIT 10.23 - SHILOH INDUSTRIES INC | exhibit1023serviceagreemen.htm |
| EX-10.22 - EXHIBIT 10.22 - SHILOH INDUSTRIES INC | exhibit1022sixthamendmentt.htm |
UNITED STATES
SECURITIES AND EXCHANGE COMMISSION
Washington, DC 20549
______________________________________________________
FORM 10-K
ANNUAL REPORT PURSUANT TO SECTION 13 OR 15(d)
OF THE SECURITIES EXCHANGE ACT OF 1934
For the fiscal year ended October 31, 2016 | Commission file no. 0-21964 |
Shiloh Industries, Inc.
(Exact name of Registrant as specified in its charter)
Delaware | 51-0347683 |
(State or other jurisdiction of incorporation or organization) | (I.R.S. Employer Identification No.) |
880 Steel Drive, Valley City, Ohio 44280
(Address of principal executive offices-zip code)
(330) 558-2600
(Registrant's telephone number, including area code)
——————
Securities registered pursuant to Section 12(b) of the Act:
Title of each class Name of each exchange on which registered
Common Stock, Par Value $0.01 Per Share The NASDAQ Global Select Market
Securities registered pursuant to Section 12(g) of the Act:
None
——————
Indicate by check mark if the registrant is a well-known seasoned issuer, as defined in Rule 405 of the Securities Act. Yes ¨ No x
Indicate by check mark if the registrant is not required to file reports pursuant to Section 13 or 15(d) of the Exchange Act. Yes ¨ No x
Indicate by check mark whether the registrant: (1) has filed all reports required to be filed by Section 13 or 15(d) of the Securities Exchange Act of 1934 during the preceding 12 months (or for such shorter period that the registrant was required to file such reports), and (2) has been subject to such filing requirements for the past 90 days. Yes x No ¨
Indicate by check mark whether the registrant has submitted electronically and posted on its corporate Web site, if any, every Interactive Data File required to be submitted and posted pursuant to Rule 405 of Regulation S-T (§ 232.405 of this chapter) during the preceding 12 months (or for such shorter period that the registrant was required to submit and post such files). Yes x No ¨
Indicate by check mark if disclosure of delinquent filers pursuant to Item 405 of Regulation S-K is not contained herein and will not be contained, to the best of registrant's knowledge, in definitive proxy or information statements incorporated by reference in Part III of this Form 10-K or any amendment to this Form 10-K.x
Indicate by check mark whether the registrant is a large accelerated filer, an accelerated filer, a non-accelerated filer or a smaller reporting company. See the definitions of "large accelerated filer," "accelerated filer" and "smaller reporting company" in Rule 12b-2 of the Exchange Act.
Large accelerated filer ¨ Accelerated filer x Non-accelerated filer ¨ Smaller Reporting Company ¨
Indicate by check mark whether the registrant is a shell company (as defined in the Exchange Act Rule 12b-2). Yes ¨ No x
Aggregate market value of Common Stock held by non-affiliates of the registrant as of April 30, 2016, the last business day of the registrant's most recently completed second fiscal quarter, at a closing price of $6.45 per share as reported by the Nasdaq Global Market, was approximately $55,025,227. Shares of Common Stock beneficially held by each executive officer and director and their respective spouses and affiliates have been excluded since such persons may be deemed to be affiliates. This determination of affiliate status is not necessarily a conclusive determination for other purposes.
Number of shares of Common Stock outstanding as of January 13, 2017 was 17,814,636.
DOCUMENTS INCORPORATED BY REFERENCE
Parts of the following document are incorporated by reference into Part III of this Annual Report on Form 10-K: the Proxy Statement for the registrant's 2017 Annual Meeting of Stockholders (the "Proxy Statement").
Explanatory Note
This Annual Report on Form 10-K for the year ended October 31, 2016 includes the Company's consolidated financial statements at October 31, 2016 and October 31, 2015 and for the years ended October 31, 2016, 2015 and 2014. As discussed in Note 2 - Correction of Immaterial Errors to the Company's consolidated financial statements, the consolidated financial statements for the years ended October 31, 2015, 2014, 2013 and 2012 and the unaudited financial information for the interim periods of fiscal year 2016 and 2015 have been revised.
INDEX TO ANNUAL REPORT | |||
ON FORM 10-K | |||
Table of Contents | |||
Page | |||
PART I: | |||
Item 1. | |||
Item 1A. | |||
Item 1B. | |||
Item 2. | |||
Item 3. | |||
Item 4. | |||
PART II: | |||
Item 5. | |||
Item 6. | |||
Item 7. | |||
Item 7A. | |||
Item 8. | |||
Item 9. | |||
Item 9A. | |||
Item 9B. | |||
PART III: | |||
Item 10. | |||
Item 11. | |||
Item 12. | |||
Item 13. | |||
Item 14. | |||
PART IV: | |||
Item 15. | |||
2
PART I
SHILOH INDUSTRIES, INC.
Item 1. | Business. |
General
Shiloh Industries, Inc. ("Shiloh" or the "Company"or "its") is a Delaware corporation incorporated in 1993. The Company is a leading global supplier of lightweighting, noise and vibration solutions to the automotive, commercial vehicle and industrial markets. The Company, headquartered in Valley City, Ohio, has a global network of manufacturing operations and technical centers in Asia, Europe and North America.
The Company offers one of the broadest portfolios of lightweighting solutions to the automotive, commercial vehicle and industrial markets, capable of delivering solutions in aluminum, magnesium, steel and high strength steel alloys. Shiloh delivers these solutions through the design and manufacturing of its BlankLight®, CastLight™ and StampLight™ brands.
Shiloh delivers solutions in body, chassis and powertrain systems to original equipment manufacturers ("OEMs") and several "Tier 1" suppliers to the OEMs.
The Company operates as one end-customer focused reporting segment.
Products and Manufacturing Processes
The Company produces components primarily for body, chassis and powertrain systems.
• | Body systems components include: shock towers; instrument panel / cross car beams; torque boxes; tunnel supports; seat supports; seat back frames; hinge pillars; liftgates; door inners; roof supports / roof panels; dashpanels; body sides; and B and C pillars. |
• | Chassis systems components include: cross members; frame rails; axle carriers; bearing caps; axle covers; axle housings; clutch housings; PTU covers; axle tubes; rack and pinion housings; steering column housings; knuckles; links; wheel hubs; calipers; master cylinders; steering pumps; brake components; wheel blanks and flanges. |
• | Powertrain systems components include: planetary carriers; clutch housings; transmission gear housings; engine valve covers; valve bodies; rocker arm spacers; heat shields; exhaust manifolds; cones; baffles; muffler shells; engine oil pans; transmission fluid pans; front covers; and transmission covers. |
• | The Company also performs steel processing services, which include: oiling; leveling; cutting-to-length; multi-blanking; slitting; edge trimming of hot and cold-rolled steel coils; and inventory control services. |
Customers
The Company’s customers are primarily in the automotive, commercial vehicle and industrial markets. It works closely with the world’s leading OEM and Tier 1 suppliers and has over 200 customers globally. The Company’s automotive OEM customers include Bayerische Motoren Werke AG ("BMW"), Daimler-Benz AG, Fiat Chrysler Automobiles ("FCA"), Ford Motor Company ("Ford"), General Motors Company ("General Motors"), Honda Motor Co., Ltd ("Honda"), Jaguar Land Rover plc, Nissan Motor Company, Ltd., Porsche AG, Subaru of America, Inc., Tesla Motor Inc., Toyota Motor Corporation and Volvo Car Corporation. Tier 1 customers include Adient, American Axle Manufacturing, Eberspaecher Inc., Faurecia, Gestamp, John Bean Technologies AB, International Automotive Components Group Limited, KTH Parts Industries, Inc., Lear Corporation, Linamar Corporation, Magna International, Nexteer Automotive Group Limited and ZF Friedrichshafen AG. The Company’s commercial vehicle and industrial customers include Cummins Inc., Hendrickson International, PACCAR Inc., Scania AB and Volvo AB.
3
The following customers accounted for more than 10% of the Company's revenues in fiscal 2016, 2015, and 2014:
Customer | 2016 | 2015 | 2014 | |||
FCA | 17.1% | 17.4% | 13.9% | |||
General Motors | 18.2% | 15.5% | 16.4% | |||
Business is awarded as a result of the Company's ability to successfully bid on and win the production and supply of parts for models that will be newly introduced to the market by the OEMs.
Raw Materials
The primary raw materials required for the Company's operations are hot-rolled and cold-rolled coated steel, rolled-aluminum and aluminum and magnesium ingots. The Company obtains steel from a number of primary steel producers and steel service centers. The majority of the steel is purchased through customers' steel buying programs. Under these programs, the Company purchases steel at the price that its customers negotiated with the steel suppliers. The Company's most significant steel suppliers are AK Steel, ArcelorMittal, Kenwal Steel Corporation, SSAB Swedish Steel Corporation, Steel Technologies, Tata Steels and U.S. Steel. The Company takes ownership of the steel in many instances; however, the customers are generally responsible for commodity price fluctuations. Most of the steel owned by the Company is purchased domestically. A portion of the Company's steel products and processing services are provided to customers on a toll processing basis. Under these arrangements, the Company charges a specified fee for operations performed without acquiring ownership of the steel and being burdened with the attendant costs of ownership and risk of loss. Through centralized purchasing, the Company attempts to purchase raw materials at the lowest competitive prices for the quantity purchased. The amount of steel available for processing is a function of the production levels of primary steel producers.
For the Company's aluminum and magnesium, used in the CastLight™ product brand, the cost of raw materials is handled in one of two ways. The primary method used by the Company is to secure quarterly purchase commitments based on customer releases and then pass the quarterly price changes to those customers utilizing published metal indexes. The second method used by the Company is to adjust prices monthly, based on a referenced metal index plus additional material cost spreads agreed to by the Company and its customers. Primary aluminum alloys are used in our proprietary "Thin Tech" castings processes, which allow heat treat and enhanced mechanical properties. The primary supplier for the company is Rio Tinto Alcan. Secondary smelting is the process of recycling aluminum, which has a positive impact environmentally and economically. These types of alloys are used in our conventional die casting process. The secondary aluminum suppliers for the Company include Allied Aluminum, Imperial Aluminum, Real Alloy Holding Incorporated, Spectro Alloy Corporation and Superior Aluminum Alloys. Magnesium alloy is originated from China and delivered from either Chinese magnesium producers or metal trading companies in Europe with pricing based on the Asian Metal price index.
Competition
Shiloh competes in the laser welding, stamping, die casting and close-tolerance machining industries. Competitors within Shiloh’s main product brands vary. BlankLight® competitors include numerous metal blanking companies ranging in all sizes, including raw material manufacturers and customers. Welded blank competition in North America is primarily comprised of TWB Company LLC and ArcelorMittal USA. Most laser welded blank competitors are affiliated with raw material or distribution providers. Competition for sales of automotive stamping and assemblies is also intense. Primary StampLight™ competitors are Gestamp, L&W, Inc., Flex-n-Gate Corporation, Midway Products Group Inc., Narmco Group and Kirchhoff Automotive Group. CastLight™ competitors include Bocar Group, Cosma International (a Magna Company), Georg Fischer, Gnotec AB, KSM Casting Group, Madison Kipp Corporation (MKC), Meridian (subsidiary of Wangfeng Auto Holdings Group), Nemak, Pace Industries, RCM Industries and Ryobi Aluminum Casting (USA), Inc., which are all competing for a growing number of automotive projects. In almost all instances, Shiloh competes through its main strategies of "Lightweighting without compromise®" and "Lightweighting with Benefits®", which provides the Company with the ability to provide solutions that do not compromise part integrity such as performance, safety, sound and efficiency. Development and design optimization to lightweight products allow customers to achieve vehicle weight, fuel economy and/or ride and handling targets while favorably impacting the environment.
Joint Ventures
As of October 31, 2016, the Company had one joint venture in China. Operating activities have been insignificant and are not yet consolidated in the Company's statement of operations.
4
Employees
As of October 31, 2016, the Company had approximately 3,100 employees. Organized labor unions represent approximately 20% of the Company's U.S. hourly employees and approximately 90% of the Company's non-U.S. employees.
Each of the Company's unionized manufacturing facilities has its own labor agreement with its own expiration date. As a result, no contract expiration date affects more than one facility.
Backlog
A significant portion of the Company's business pertains to automobile platforms for various model years. Orders against these platforms are subject to releases by the customer and are not considered firm orders. Backlog, therefore, is not a meaningful indicator of future performance.
Seasonality
The Company's business is moderately seasonal because many North American OEM customers close assembly plants for periods in June and July for model year changeovers and for additional periods during the December and January holiday season. For Europe, July and August and additional periods during December and January are lower volume months due to customer shutdown and the holiday season. Shut-down periods in the rest of world vary by country. Historically, the Company's sales and operating profits have been strongest in the second and fourth quarters. For additional information, refer to the Company's quarterly financial results contained in Note 21 to the Consolidated Financial Statements, included in Item 8 of this report.
Environmental Matters
The Company is subject to environmental laws and regulations concerning emissions to the air, discharges to waterways and generation, handling, storage, transportation, treatment and disposal of waste and hazardous materials.
The Company is also subject to laws and regulations that can require the remediation of contamination that exists at current or former facilities. In addition, the Company is subject to other federal and state laws and regulations regarding health and safety matters. The majority of the Company's production facilities have permits and licenses allowing and regulating air emissions and water discharges. While the Company believes that at the present time its production facilities are in substantial compliance with environmental laws and regulations, these laws and regulations are constantly evolving, and it is impossible to predict whether compliance with these laws and regulations may have a material adverse effect on the Company in the future.
ISO 14001 is a voluntary international standard issued in September 1996 by the International Organization for Standardization. ISO 14001 identifies the elements of an Environmental Management System ("EMS") necessary for an organization to effectively manage its effect on the environment. The ultimate objective of the standard is to integrate the EMS with overall business management processes and systems so that environmental considerations are a routine part of business decisions. The majority of the Company's facilities are certified to the ISO 14001 standard and is actively working with the remaining facilities for improved environmental performance. The Company has completed the certification process at each of its manufacturing facilities to the ISO/TS 16949 standard, which is the global benchmark for an international quality management system ("QMS") in the automotive industry. This certification is a market requirement for doing business in the automotive industry.
Research and Development
The Company performs research, development, design and other engineering activities for the primary reasons:
• | to provide solutions for customers; |
• | to integrate the Company's leading technologies into advanced products and processes; |
• | to provide engineering support for all of the Company's manufacturing sites; and |
• | to provide technological expertise in engineering and design development. |
Along with Shiloh’s global manufacturing locations, the Company maintains technical centers in Asia (Shanghai, China), Europe (Gothenburg, Sweden) and in North America (Valley City, Ohio and Plymouth, Michigan). Furthermore, the Company has Sales and Engineering Offices in the United Kingdom (Evesham, England) and Germany (Munich). Each of the Company’s
5
business units is engaged in engineering, research and development efforts working closely with customers to develop custom solutions to meet their needs.
Intellectual Property
The Company holds 80 issued patents on a worldwide basis, including 38 granted US patents and in excess of 54 patent applications in process. Of the approximately 90 patents and patent applications, approximately 46% are in production use and/or are licensed to third parties, and the remaining 54% are being considered for future production use or provide a strategic technological benefit to the Company. The Company does not materially rely on any single patent, nor will the expiration of any single patent materially affect the Company’s business. The Company’s current patents expire over various periods into the year 2032. The Company is actively introducing and patenting new technology to replace formerly patented technology before the expiration of the existing patents. In the aggregate, the Company's worldwide patent portfolio is materially important to its business because it enables the Company to achieve technological differentiation from its competitors. The Company also maintains more than 35 active trademark registrations and applications worldwide. In excess of 90% of these trademark registrations and applications are in commercial use by the Company or are licensed to third parties.
Segment and Geographic Information
The Company conducts its business and reports its information as one operating segment - Automotive and Commercial Vehicles. The Chief Operating Decision Maker has been identified as the Senior Leadership Team ("SLT"), which includes all Vice Presidents plus the Chief Executive Officer of the Company as this team has the final authority over performance assessment and resource allocation decisions. In determining that one operating segment is appropriate, the Company considered the nature of the business activities, the existence of managers responsible for the operating activities and information presented to the Board of Directors for its consideration and advice. Customers and suppliers are substantially the same in the automotive and commercial vehicle industry.
Financial information regarding Company geographic mix is contained in Note 20 - Business Segment Information of the Notes to Consolidated Financial Statements under Item 8 of this report.
Company Web Site and Access to Filed Reports
The Company's website is located at http://www.shiloh.com. On its website, you can obtain a copy of annual reports on Form 10-K, quarterly reports on Form 10-Q, current reports on Form 8-K, and amendments to those reports filed or furnished pursuant to Section 13(a) or 15(d) of the Exchange Act of 1934 as soon as reasonably practicable after the Company files such material electronically with, or furnishes it to, the Securities and Exchange Commission ("SEC"). The Company does not incorporate its website into this Annual Report on Form 10-K, and information on the website is not and should not be considered part of this document, unless expressly stated otherwise.
The Company files annual, quarterly and current reports, proxy statements and other information with the SEC. You may read and copy any document the Company files with the SEC at its Public Reference Room at 100 F Street, N.E., Washington D.C. 20549. You may obtain information about the operation of the SEC's Public Reference Room by calling the SEC at 1-800-SEC-0330. The SEC also maintains a website that contains reports, proxy and information statements, and other information regarding registrants that file electronically with the SEC (http://www.sec.gov). The Company does not incorporate information on the SEC's website into this Annual Report on Form 10-K, and information on the website is not and should not be considered part of this document, unless expressly stated otherwise.
6
Item 1A.
Risk Factors
(amounts in thousands)
The Company's business is subject to a number of risks. In addition to the various risks described elsewhere in this Annual Report on Form 10-K, the following risk factors should be considered. The Company's business could also be affected by additional factors that are not presently known to the Company or that the Company currently considers to be immaterial to its operations.
Risks Related to the Company's Business
A downturn in the global economy could harm demand for passenger cars and commercial vehicles that are manufactured with the Company's products and, therefore, could adversely affect the Company's business, financial condition, results of operations, and cash flows.
The level of demand for the Company's products depends primarily upon the level of consumer demand for new vehicles that are manufactured with its products. The global economic recession that began in 2008 had a significant adverse effect on the Company's business, customers and suppliers, and contributed to delayed and reduced purchases of passenger cars and commercial vehicles, including those manufactured with its products. Demand for and pricing of its products is also subject to economic conditions and other factors (e.g., energy costs, fuel costs, climate change concerns, vehicle age, consumer spending and preferences, materials used in production, commodity prices and changing technology) present in the various domestic and international markets in which its products are sold. If the global economy were to experience another significant downturn, depending upon its length, duration and severity, or any other event that results in a reduction of demand for automobiles, the Company's financial condition, results of operations, and cash flows could be materially adversely affected.
Deterioration in the United States and world economies could harm the Company's customers’ and suppliers’ ability to access the capital markets, which may affect the Company's business, financial condition, results of operations, and cash flows.
Disruptions in the capital and credit markets could adversely affect the Company's customers and suppliers by making it increasingly difficult for them to obtain financing for their businesses and for their customers to obtain financing for automobile purchases. The Company's OEM customers typically require significant financing for their respective businesses. This financing often comes from securitization markets, which experience severe disruptions during global economic crises. The Company's suppliers, as well as its customers’ suppliers, may face similar difficulties in obtaining financing for their businesses. If capital is not available to the Company's customers or suppliers, or if the cost of capital is prohibitively high, their businesses would be adversely affected, which could result in their restructuring or even reorganization or liquidation under applicable bankruptcy laws. Any such adverse effect on its customers or suppliers could materially adversely affect the Company, either through loss of revenues from any of its customers so affected, or due to its inability to meet its commitments without excess expense, as a result of disruptions in supply caused by the suppliers so affected. Financial difficulties experienced by any of the Company's major customers could have a material adverse effect on the Company if such customer were unable to pay for the products the Company provides or if the Company experienced a loss of, or material reduction in, business from such customer. As a result of such difficulties, the Company could experience lost revenues, significant write-offs of accounts receivable, significant impairment charges, or additional restructurings. In addition, severe financial or other difficulties at any of the Company's major suppliers could have a material adverse effect on the Company if the Company is unable to obtain on a timely basis and on similar economic terms the quantity and quality of components the Company requires to produce products.
Moreover, severe financial or operating difficulties at any automotive vehicle manufacturer or other significant supplier could have a significant disruptive effect on the entire industry, leading to supply chain disruptions and labor unrest, among other things. These disruptions could force OEMs and, in turn, other suppliers, including us, to shut down or reduce production at plants.
The Company's inability to obtain and maintain sufficient capital financing may harm the liquidity and financial condition of the Company.
The Company's working capital requirements can vary significantly, depending, in part, on the level, variability and timing of the Company's customers' production and the payment terms the Company has with its customers and suppliers. The Company's liquidity could be adversely affected if the Company's suppliers were to suspend normal trade credit terms and require payment in advance or payment on delivery. If the Company's available cash flows from operations is not sufficient to fund its ongoing cash needs, the Company would likely look to its cash balances and borrowing availability under its Credit Agreement (as defined below) to satisfy those needs. The Company entered into an amendment to the Credit Agreement on October 28, 2016, which, among other things, increased the permitted leverage ratio under the Credit Agreement. There can be no assurance that the Company will be able to continue to satisfy the financial covenants currently under the Credit Agreement, that it will be able to
7
enter into favorable amendments in the future, that alternative sources of additional capital will be available on satisfactory terms or at all or that it will otherwise continue to have the ability to maintain sufficient capital financing. Insufficient liquidity may increase the risk of not being able to produce products or having to pay higher prices for inputs that may not be recovered in selling prices.
The Company may pursue acquisitions or strategic alliances that the Company may not successfully integrate or that may divert management’s attention and resources.
The Company may pursue acquisitions, joint ventures or strategic alliances in the future. However, the Company may not be able to identify and secure suitable opportunities. The Company's ability to consummate and integrate effectively any future acquisitions or enter into strategic alliances on terms that are favorable to the Company may be limited by a number of factors, such as competition for attractive targets and, to the extent necessary, its ability to obtain financing on satisfactory terms, if at all.
In addition, if a potential acquisition target, joint venture, or strategic alliance candidate is identified, the Company may fail to enter into a definitive agreement with the candidate on commercially reasonable terms or at all. The negotiation and completion of potential acquisitions, joint ventures or strategic alliances, whether or not ultimately consummated, could also require significant diversion of management’s time and resources and potential disruption of existing business. The expected synergies and cost savings from acquisitions, joint ventures or strategic alliances may not be realized and the Company may not achieve the expected results, including the synergies and cost savings the Company expects to realize. The Company may also have to incur significant charges in connection with future acquisitions. Future acquisitions or strategic alliances could also potentially result in the incurrence of additional indebtedness, dilutive issuance of equity securities, costs and contingent liabilities. The Company may also have to obtain approvals and licenses from the relevant government authorities for such transactions to comply with any applicable laws and regulations, which could result in increased costs and delay. Future strategic alliances or acquisitions may expose the Company to additional potential risks, including risks associated with:
• | uncertainties in assessing the value, strengths and potential profitability of, and identifying the extent of all weaknesses, risks and contingent and other liabilities of, acquisition targets or other transaction candidates; |
• | the Company's inability to generate sufficient revenue to recover costs and expenses of the strategic alliances or acquisitions; |
• | potential loss of, or harm to, relationships with employees, customers and suppliers; and |
• | unanticipated changes in business, industry or general economic conditions that affect the assumptions underlying the acquisition rationale. |
Any of the above risks could significantly impair the Company's ability to manage its business and materially harm its business, results of operations and financial condition.
The Company may be unable to realize revenues represented by awarded business, which could materially harm the Company's business, financial condition, results of operations, and cash flows.
The realization of future revenues from awarded business is subject to risks and uncertainties, including the number of vehicles that the Company's customers will actually produce, the timing of that production and the mix of options that its customers may choose.
In addition to not having a commitment from the Company's customers regarding the minimum number of products they must purchase from the Company if it obtains awarded business, the terms and conditions of the agreements with the Company's customers typically provide that they have the contractual right to unilaterally terminate its contracts with only limited notice. If such contracts are terminated by its customers, the Company's ability to obtain compensation from its customers for such termination is generally limited to the direct out-of-pocket costs that the Company incurred for inventory and not fully reimbursed tooling, and in certain rare instances, not fully depreciated capital expenditures.
The Company bases a substantial part of planning on the anticipated lifetime revenues of particular products. The Company calculates the anticipated lifetime revenues of a product by multiplying its expected price for a product by the forecasted production volume for that product during the length of time the Company expects the related vehicle to be in production. The Company uses third-party forecasting services to provide long-term forecasts, which allow the Company to determine how long a vehicle is expected to be in production. If the Company over-estimates the production units or if a customer reduces its level of anticipated purchases of a particular platform as a result of reduced demand, the Company's actual revenues for that platform may be substantially less than the lifetime revenues the Company had anticipated for that platform.
8
Typically, it takes two to three years from the time a manufacturer awards a program until production begins. In many cases, the Company must commit substantial resources in preparation for production under awarded customer business well in advance of the customer’s production start date. The Company's results of operations may be affected due to delay in recovering these types of pre-production costs if the Company's customers cancel awarded business, including cancellation in the event technology supporting the awarded business becomes obsolete.
The Company is dependent upon large customers for current and future revenues. The loss of all or a substantial portion of its sales to any of these customers or the loss of market share by these customers could materially harm the Company.
The Company depends on major vehicle manufacturers for a substantial portion of its net sales. For example, during 2016, FCA and General Motors accounted for 17.1% and 18.2% of the Company's revenues, respectively. In addition, as a result of the Company's recent acquisitions, the Company expects the portion of its revenues attributable to certain of its larger customers to increase. The loss of all or a substantial portion of the Company's sales to any of its large-volume customers could have a material adverse effect on the Company's financial condition and results of operations by reducing cash flows and its ability to spread costs over a larger revenue base. The Company may also make fewer sales to major customers for a variety of reasons other than losses of business relationships, including but not limited to: (1) reduced or delayed customer requirements; (2) strikes or other work stoppages affecting production by the customers; or (3) reduced demand for its customers’ products.
In addition, the Company's OEMs customers compete intensively against each other and other OEMs. The loss of market share by any of the Company's significant OEMs could have a material adverse effect on its business unless the Company is able to achieve increased sales to other OEMs.
The Company's inability to effectively manage the timing, quality and costs of new program launches could harm the Company's financial performance.
In connection with the award of new business, the Company obligates itself to deliver new products and services that are subject to the Company's customers’ timing, performance and quality standards. Additionally, as a Tier 1 supplier, the Company must effectively coordinate the activities of numerous suppliers in order for the program launches of its products to be successful. Given the complexity of new program launches, the Company may experience difficulties managing product quality, timeliness and associated costs. In addition, new program launches require a significant ramp up of costs; however, the Company's sales related to these new programs generally are dependent upon the timing and success of its customers’ introduction of new vehicles. The Company's inability to effectively manage the timing, quality and costs of these new program launches could harm its financial condition, operating results and cash flows. Finally, even if the Company successfully manages the timing, quality and cost of a new program launch with respect to its operations, its customers’ production delays may be caused by other of its customers’ suppliers, which could harm the Company's financial condition, operating results and cash flows.
Automotive production and sales are highly cyclical, which could harm the Company's business, financial condition, results of operations, and cash flows.
The highly cyclical nature of the automotive industry presents a risk that is outside the Company's control and that often cannot be accurately predicted. The cyclical nature depends on general economic conditions and other factors, including interest rates, consumer confidence, consumer preferences, patterns of consumer spending, fuel costs and the automobile replacement cycle. In addition, customer production changeovers or new program launches may result in altered or delayed production cycles, which may reduce or delay purchases of its products by its customers. As a result, automotive production and sales may fluctuate significantly from year-to-year and such fluctuations may give rise to changes in demand for the Company's products. The Company's business is directly related to the volume of automotive production and, because it has significant fixed production costs, declines in the Company's customers’ production levels can have a significant adverse effect on its results of operations. Decreases in demand for automobiles generally, or decreases in demand for the Company's products in particular, could materially and harmfully affect its business, financial condition, results of operations, and cash flows.
The automotive industry is seasonal, which could harm the Company's business, financial condition, results of operations, and cash flows.
The automotive industry is seasonal. Some of the Company's largest OEM customers typically shut down vehicle production during certain months or weeks of the year. For example, the Company's OEM customers in Europe typically shut down operations during portions of July and August and additional periods during the December and January holiday season, while its OEM customers in North America typically close assembly plants for periods in June and July for model year changeovers and for an additional periods during the December and January holiday season. During these downturns, the Company's customers
9
will generally reduce the number of production days because of lower demand and reduce excess vehicle inventory. Such seasonality, or unanticipated changes in plant shutdown schedules, could have a material adverse effect on the Company's business, financial condition and results of operations.
Changes in technology or in the way in which the automotive industry develops could affect the Company’s business, financial condition, results of operations and cash flows.
The automotive industry is undergoing significant change, and the Company believes that the pace of that change will accelerate in the next several years. Technological changes, including the development of autonomous vehicles, new products and services, new business models or new methods of travel may disrupt the historic business model of the industry, reduce the demand for the purchase of automobiles, and adversely impact the sales of the Company’s customers as well as the Company’s sales, financial condition, results of operation and cash flows.
A material disruption at one of the Company's manufacturing facilities could prevent it from meeting customer demand, reduce the Company's revenues or negatively affect the Company's results of operations and financial condition.
Any of the Company's manufacturing facilities, or any of its machines or equipment within an otherwise operational facility, could cease operations unexpectedly due to a number of events, including:
• | unscheduled maintenance outages; |
• | prolonged power failures; |
• | an equipment failure; |
• | labor difficulties; |
• | disruptions in transportation infrastructure, including roads, bridges, railroad tracks and tunnels; |
• | fires, floods, windstorms, earthquakes, hurricanes or other natural catastrophes; |
• | war, terrorism or threats of terrorism or political unrest; |
• | governmental regulations or intervention; and |
• | other unexpected problems. |
Any such disruption could prevent the Company from meeting customer orders, reduce the Company's revenues or profits and negatively affect the Company's results of operations and financial condition.
The decreasing number of automotive parts suppliers and pricing pressures from the Company's automotive customers could make it more difficult for it to compete in the highly competitive automotive industry.
The automotive parts industry is highly competitive. Bankruptcies and consolidation among automotive parts suppliers are reducing the number of competitors, resulting in larger competitors who benefit from purchasing and distribution economies of scale. The Company's inability to compete with these larger suppliers in the future could result in a reduction of, or inability to increase, revenues, which would harm its business, financial condition, results of operations, and cash flows.
The Company faces significant competition within each of its major product areas. The principal competitive factors include price, quality, global presence, service, product performance, design and engineering capabilities, new product innovation, and timely delivery. The Company also faces significant competitive pricing pressures from its automotive customers. Because of their purchasing size, the Company's automotive customers can influence market participants to compete on price terms. If the Company is not able to offset pricing reductions resulting from these pressures by improving operating efficiencies and reducing expenditures, those pricing reductions may have an adverse effect on the Company's business.
The Company cannot provide assurance that it will be able to continue to compete in the highly competitive automotive industry or that increased competition will not have a material adverse effect on the Company's business.
Fluctuations between foreign currencies and the U.S. dollar could harm the Company's financial results.
The Company derived 16.7% of its revenue in fiscal year 2016 from its non-U.S. operations. The financial position and results of operations of certain of the Company's international operations are measured using the foreign currency in the jurisdiction of those operations as the functional currency. As a result, the Company is exposed to currency fluctuations both in receiving cash from its international operations and in translating its financial results back to U.S. dollars. Assets and liabilities of the Company's international operations are translated at the exchange rate in effect at each balance sheet date. The Company's income statement accounts are translated at the average rate of exchange prevailing during each fiscal quarter. A strengthening U.S. dollar against relevant foreign currency reduces the amount of income the Company recognizes from its international operations. The Company
10
cannot predict the effects of exchange rate fluctuations on its future operating results. As exchange rates vary, the Company's results of operations and profitability may be harmed. The Company may use a combination of natural hedging techniques and financial derivatives to protect against certain foreign currency exchange rate risks. Such hedging activities may be ineffective or may not offset more than a portion of the adverse financial effect resulting from foreign currency variations. The gains or losses associated with hedging activities may harm the Company's results of operations. In addition, the portion of the Company's revenue derived from international operations may increase in the future, due to the impact of its acquisitions and overall growth in foreign markets, among other reasons. The risks the Company faces in foreign currency transactions and translation may continue to increase as it further develops and expands its international operations.
The Company is subject to risks related to its international operations.
The Company sells its products worldwide from its manufacturing and distribution facilities in various regions and countries, including the United States, Mexico, Europe and Asia. International operations are subject to various risks which could have a material adverse effect on those operations or its business as a whole, including:
• | exposure to local economic conditions and labor issues; |
• | exposure to local political conditions, including the risk of seizure of assets by a foreign government; |
• | exposure to local social unrest, including any resultant acts of war, terrorism or similar events; |
• | exposure to local public health issues and the resultant impact on economic and political conditions; |
• | currency exchange rate fluctuations; |
• | controls on the repatriation of cash, including imposition or increase of withholding and other taxes on remittances and other payments by foreign subsidiaries; |
• | export and import restrictions; and |
• | difficulties in penetrating new markets due to established and entrenched competitors. |
The risks the Company faces in its international operations may intensify if the Company further develops and expands its international operations.
Significant increases and fluctuations in raw materials pricing could materially harm the Company without proportionate recovery from its customers.
Significant increases in the cost of certain raw materials used in the Company's products, such as aluminum, steel and magnesium ingot, or the cost of utility services required to produce its products, to the extent they are not timely reflected in the price it charges its customers or are otherwise mitigated, could materially and adversely impact the Company's results. Prices for raw material inputs can be impacted by many factors, including developments in global commodities markets, international trade policies and developments in technology. The amount of steel available for processing is a function of the production levels of primary steel producers.
The Company obtains steel from a number of primary steel producers and steel service centers. The majority of the steel is purchased through its customers' steel buying programs. Under these programs, the Company purchases steel at the price that its customers negotiated with the steel suppliers. In these cases, the Company takes ownership of the steel; however, its customers are responsible for commodity price fluctuations. If these programs are discontinued by its customers in the future, the Company would have to purchase materials in the open market, which would subject the Company to additional market risk. With respect to the steel it purchases in the open market, the Company uses centralized purchasing to purchase raw materials at the lowest competitive prices for the quantity purchased.
For the Company's aluminum and magnesium die casting business, the cost of materials is handled in one of two ways. The primary method is to secure quarterly purchase commitments based on customer releases and then pass the quarterly price changes to those customers utilizing published metal indexes. The second method is to adjust prices monthly or quarterly, based on a referenced metal index plus additional material cost spreads agreed to by the Company and its customers. While the Company has been successful in the past recovering a significant portion of raw material costs, there is no assurance that the Company will continue to do so, or that increases in raw material costs will not adversely impact its business, financial condition, results of operations, and cash flows. In addition, significant increases in raw material prices may cause customers to redesign certain components or use alternative materials, which could result in reduced revenues, which could in turn harm the Company's business, financial condition, results of operations and cash flows.
11
The volatility of steel prices could materially harm the Company's results of operations.
A by-product of the Company's production process is the generation of offal. The Company typically sells offal in secondary markets, which are similar to the steel markets. The Company generally shares recoveries from sales of offal with its customers either through scrap sharing agreements, in cases in which the Company is participating in resale programs, or through product pricing, in cases in which it purchases steel directly from steel suppliers. In either situation, the Company may be affected by the fluctuation in scrap steel prices, either positively or negatively, in relation to its various customer agreements. As offal prices generally increase and decrease as steel prices increase and decrease, sales of offal may mitigate the impact of the volatility of steel price increases, as well as limit the benefits reaped from steel price declines. Any volatility in offal and steel prices could materially adversely affect the Company's business, financial condition, results of operations, and cash flows.
Disruptions in the automotive supply chain could materially harm the Company's business, financial condition, results of operations, and cash flows.
The automotive supply chain is subject to disruptions because the Company, along with its customers and suppliers, attempts to maintain low inventory levels. Disruptions could result from a variety of situations, such as the closure of one of its or the Company's suppliers’ plants or critical manufacturing lines due to strikes, mechanical breakdowns, electrical outages, fires, explosions or political upheaval. Disruptions could also result from logistical complications due to weather, earthquakes, or other natural or nuclear disasters, mechanical failures, technology disruptions or delayed customs processing.
If the Company is the cause for a customer being forced to halt production, the customer may seek to recoup all of its losses and expenses from the Company. Any disruptions affecting the Company or caused by the Company could have a material adverse effect on its business, financial condition, results of operations and cash flows.
Longer product lives of automotive parts may harm demand for some of the Company's products.
The average useful life of automotive parts may increase due to innovations in products and technologies. As automotive product life cycles lengthen, opportunities to supply components for new programs may occur less frequently, which may reduce demand for some of the Company's products.
Discontinuation of the vehicle models, engines or transmissions for which the Company manufactures products may harm its business, financial condition and results of operations.
The Company's typical sales contract provides for supplying a customer with its product requirements for particular programs, rather than manufacturing a specific quantity of components and systems. The initial terms of the Company's sales contracts typically range from one to six years, with automatic renewal provisions that generally result in its contracts running for the life of the program. The Company's contracts do not require its customers to purchase a minimum number of components or systems. The loss of awarded business or significant reduction in demand for vehicles for which it produces components and systems could have a material adverse effect on the Company's business, financial condition, results of operations and cash flows.
The hourly workforce in the Company's industry is highly unionized and the Company's business could be harmed by labor disruptions.
As of October 31, 2016, approximately 20% of the Company's U.S. hourly employees and 90% of the Company's non-U.S. employees were unionized. Although the Company considers its current relations with its employees to be satisfactory, if major work disruptions were to occur, the Company's business could be harmed by, for instance, a loss of revenues, increased costs or reduced profitability. The Company has not experienced a material labor disruption in its recent history, but there can be no assurance that the Company will not experience a material labor disruption at one of its facilities in the future in the course of renegotiation of its labor arrangements or otherwise.
In addition, many of the hourly employees of Fiat Chrysler Automotive and General Motors in North America and many of their other suppliers are unionized. Vehicle manufacturers, their suppliers and their respective employees in other countries are also subject to labor agreements. A work stoppage or strike at one of the Company's production facilities, at those of a customer, or impacting a supplier of the Company's or any of its customers, such as the 2008 strike at a Tier 1 supplier that resulted in 30 General Motors facilities in North America being idled for several months, could have a material adverse impact on the Company by disrupting demand for the Company's products and/or its ability to manufacture its products.
12
The Company may incur costs related to product warranties, environmental and regulatory matters, legal proceedings and other claims, which could materially harm its financial condition and results of operations.
From time to time, the Company receives product warranty claims from its customers, pursuant to which the Company may be required to bear costs of repair or replacement of certain of the Company's products. Vehicle manufacturers require their outside suppliers to guarantee or warrant their products and to be responsible for the operation of these component products in new vehicles sold to consumers. Warranty claims may range from individual customer claims to full recalls of all products in the field.
The Company also from time to time is involved in a variety of legal proceedings, claims or investigations. These matters typically are incidental to the conduct of its business. Some of these matters involve allegations of damages against the Company relating to environmental liabilities, intellectual property matters, personal injury claims, taxes, employment matters or commercial or contractual disputes or allegations relating to legal compliance by the Company or its employees.
The Company vigorously defends itself in connection with all of the matters described above. The Company cannot, however, assure you that the costs, charges and liabilities associated with these matters will not be material, or that those costs, charges and liabilities will not exceed any amounts reserved for them in the Company's consolidated financial statements. In future periods, the Company could be subject to cash costs or charges to earnings if any of these matters are resolved unfavorably to the Company in amounts exceeding any reserves for such matters.
Product recalls by vehicle manufacturers could negatively impact the Company's production levels, which could materially harm the Company's business, financial condition and results of operations.
Historically, there have been significant product recalls by some of the world's largest vehicle manufacturers. The Company's risk to recalls of the products it manufactures is generally related to its workmanship on the product as opposed to the material and design of the products, as the design generally belongs to its customers and the Company's parts are produced according to customer specifications. Recalls, whether or not related to claims against the Company, may result in decreased vehicle production as a result of a manufacturer focusing its efforts on the problems underlying the recall rather than generating new sales volume. In addition, consumers may elect not to purchase vehicles manufactured by the vehicle manufacturer initiating the recall, or by vehicle manufacturers in general, while the recalls persist. The Company does not maintain insurance in North America for product recall matters, as such insurance is not generally available on acceptable terms. Any reduction in vehicle production volumes, especially by its OEM customers, could have a material adverse effect on the Company's business, financial condition and results of operations.
The Company relies on information technology and a failure of its information technology infrastructure or a breach of its information security could adversely impact its business and operations.
The Company's operations rely on a number of information technologies to manage, store and support business activities. The Company has a number of systems, processes and practices in place that are designed to protect against the failure of its systems. The Company recognizes the increasing volume of cyber-attacks and employs commercially practical efforts to provide reasonable assurance such attacks are appropriately mitigated. Despite the Company's efforts to protect sensitive information and confidential and personal data, however, its facilities and systems and those of its third-party service providers may be vulnerable to security breaches, disclosure, modification or destruction of proprietary and other key information, production downtimes and operational disruptions, which in turn could adversely affect the Company's results of operations. The Company's systems and those of its service providers are vulnerable to circumstances beyond its reasonable control including acts of terror, acts of government, natural disasters, civil unrest and denial of service attacks which may lead to the theft of the Company's intellectual property or trade secrets, disclosure, modification or destruction of proprietary and other key information and production downtimes and operational disruptions, which in turn could adversely affect the Company's results of operations. To the extent that any disruptions or security breach results in a loss or damage to the Company’s data, or an inappropriate disclosure of confidential or protected personal information, it could cause significant damage to its reputation, affect its relationships with the Company's customers, suppliers and employees, lead to claims against it and ultimately harm the Company's business. Additionally, the Company may be required to incur significant costs to protect against damage caused by these disruptions or security breaches in the future.
Changes in privacy laws, regulations, and standards may cause the Company’s business to suffer.
Personal privacy and data security have become significant issues in the United States, Europe, and in many other jurisdictions where the Company offers its products. The regulatory framework for privacy and security issues worldwide is rapidly evolving and is likely to remain uncertain for the foreseeable future. Federal, state, or foreign government bodies or agencies have in the
13
past adopted, and may in the future adopt, laws and regulations affecting data privacy. In many jurisdictions, enforcement actions and consequences for noncompliance are rising. The Company may be required to incur significant costs to comply with privacy and data securities laws, rules and regulations. Any inability to adequately address privacy and security concerns, even if unfounded, or comply with applicable privacy and data security laws, rules and regulations could result in additional cost and liability to the Company, damage the Company’s reputation, inhibit its sales, and adversely affect its business.
If the Company is unable to protect its intellectual property or if a third party makes assertions against the Company or its customers relating to intellectual property rights, the Company's business could be harmed.
The Company owns important intellectual property, including patents, trademarks, copyrights and trade secrets, and could be involved in licensing arrangements. The Company's intellectual property plays an important role in maintaining the Company's competitive position. Notwithstanding its intellectual property portfolio, the Company's competitors may develop technologies that are similar or superior to the Company's proprietary technologies or design around the patents the Company owns or licenses. Various patent, copyright, trade secret and trademark laws provide limited protection and may not prevent the Company's competitors from duplicating its products or gaining access to its proprietary information. Further, as the Company expands its operations in jurisdictions where the protection of intellectual property rights is less robust, the risk of others duplicating its proprietary technologies increases, despite efforts the Company undertakes to protect them.
On occasion, the Company may assert claims against third parties who are taking actions that it believes is infringing on the Company's intellectual property rights. Similarly, third parties may assert claims against the Company and its customers and distributors alleging its products infringe upon third party intellectual property rights. These claims, regardless of their merit or resolution, are frequently costly to prosecute, defend or settle and divert the efforts and attention of the Company's management and employees. Claims of this sort also could harm the Company's relationships with its customers and might deter future customers from doing business with the Company. If any such claim were to result in an adverse outcome, the Company could be required to take actions which may include: expending significant resources to develop or license non-infringing products; paying substantial damages to third parties, including to customers to compensate them for their discontinued use or replacing infringing technology with non-infringing technology; or cessation of the manufacture, use or sale of the infringing products. Any of the foregoing results could have a material adverse effect on the Company's business, financial condition, results of operations, or its competitive position.
The Company is subject to risks associated with changing manufacturing technologies, which could place it at a competitive disadvantage.
The successful implementation of the Company's business strategy requires it to continuously evolve its existing products and introduce new products to meet customers’ needs. The Company's products are characterized by stringent performance and specification requirements that mandate a high degree of manufacturing and engineering expertise. If the Company fails to meet these requirements, the Company's business could be at risk.
The Company believes that its customers rigorously evaluate their suppliers on the basis of a number of factors, including:
• | product quality; |
• | technical expertise and development capability; |
• | new product innovation; |
• | reliability and timeliness of delivery; |
• | price competitiveness; |
• | product design capability; |
• | manufacturing expertise; |
• | operational flexibility; |
• | global production capabilities; |
• | customer service; and |
• | overall management. |
The Company's success will depend on its ability to continue to meet its customers’ changing specifications with respect to these criteria. The Company cannot assure you that it will be able to address technological advances or introduce new products that may be necessary to remain competitive within its businesses. Furthermore, the Company cannot assure you that it can adequately protect any of the Company's own technological developments to produce a sustainable competitive advantage.
14
The loss of executive officers or key employees of the Company may materially harm operations and the ability to manage the day-to-day aspects of the Company's business.
The Company's future performance substantially depends on its ability to retain and motivate executive officers and key employees. The Company's ability to manage the day-to-day aspects of its business may be materially harmed with the loss of any of its executive officers or key employees, which have many years of experience with the Company and within the automotive industry and other manufacturing industries, or if the Company is unable to recruit qualified personnel. The loss of the services of one or more executive officers or key employees, who also have strong personal ties with customers and suppliers, could have a material adverse effect on the Company's business, financial condition and results of operations.
The Company is involved from time to time in legal proceedings, claims or investigations, which could have an adverse impact on the Company's business, financial condition, results of operations, and cash flows.
The Company is involved from time to time in legal proceedings, claims or investigations that could be significant. These are typically claims that arise in the normal course of its business including, without limitation, commercial or contractual disputes, including disputes with suppliers, intellectual property matters, personal injury claims, environmental issues, tax matters and employment matters. No assurances can be given that such proceedings and claims will not have a material adverse impact on the Company's business, financial condition, results of operations, and cash flows.
The Company is subject to a variety of environmental, health and safety laws and regulations and the cost of complying, or its failure to comply with such requirements may materially harm the Company's business, financial condition, results of operations, and cash flows.
The Company is subject to a variety of federal, state and local environmental laws and regulations relating to the release or discharge of materials into the environment, the management, use, processing, handling, storage, transport or disposal of hazardous waste materials, or otherwise relating to the protection of public and employee health, safety and the environment. These laws and regulations expose the Company to liability for the environmental condition of its current facilities, and also may expose the Company to liability for the conduct of others or for its actions that were not in compliance with all applicable laws at the time these actions were taken. These laws and regulations also may expose the Company to liability for claims of personal injury or property damage related to alleged exposure to hazardous or toxic materials. Despite the Company's intentions to be in compliance with all such laws and regulations, the Company cannot guarantee that it will at all times be in compliance with all such requirements. The cost of complying with these requirements may also increase substantially in future years. If the Company violates or fails to comply with these requirements, it could be fined or otherwise sanctioned by regulators. These requirements are complex, change frequently and may become more stringent over time, which could have a material adverse effect on the Company's business.
The Company's failure to maintain and comply with environmental permits that it is required to maintain could result in fines or penalties or other sanctions and have a material adverse effect on the Company's operations or results. Future events, such as new environmental regulations or changes in or modified interpretations of existing laws and regulations or enforcement policies, newly discovered information or further investigation or evaluation of the potential health hazards of products or business activities, may give rise to additional compliance and other costs that could have a material adverse effect on the Company's business, financial conditions, results of operations and cash flows.
The Company cannot assure you that the costs, charges and liabilities associated with these matters will not be material, or that those costs, charges and liabilities will not exceed any amounts reserved for them in the Company's consolidated financial statements.
The Company is subject to risks associated with its use of highly specialized machinery that cannot be easily replaced.
The Company's machinery and tooling are complex, cannot be easily replicated and have a long lead-time to manufacture. If there is a breakdown in such machinery and tooling, and the Company or its service providers are unable to repair in a timely fashion, obtaining replacement machinery or rebuilding tooling could involve significant delays and costs, and may not be available to the Company on reasonable terms. Any disruption to the Company's machinery could have a material adverse effect on the Company's business, financial condition and results of operations.
Impairment charges relating to the Company’s goodwill or long lived assets could adversely affect its financial performance.
Goodwill represents the excess cost of an acquisition over the fair value of the net assets acquired. Generally accepted accounting principles require that goodwill be periodically evaluated for impairment based upon the fair value. As of October 31,
15
2016, the Company had approximately $27,490 of goodwill, or 4.4% of its total assets, that could be subject to impairment. Declines in the Company's profitability or the value of comparable companies may impact the fair value which could result in a write-down of goodwill and a reduction of net income. In addition, the Company has been required to recognize impairment charges for long lived assets. In accordance with generally accepted accounting principles, the Company periodically assesses these assets to determine if they are impaired. Significant negative industry or economic trends, disruptions to our business, inability to effectively integrate acquired businesses, unexpected significant changes or planned changes in use of these assets, changes in the structure of its business, divestitures, market capitalization declines, or increases in associated discount rates may impair its long lived assets. Any charges relating to impairments of goodwill or long lived assets may adversely affect the Company's results of operations in the periods recognized.
MTD Holdings Inc. may exercise significant influence over the Company.
MTD Holdings Inc. and its affiliates owned approximately 47.2% of the Company's common stock as of October 31, 2016. As a result, MTD Holdings Inc. and its affiliates have significant influence over the vote in any election of directors and thereby its policies and operations, including the appointment of management, future issuances of the Company's common stock or other securities, the payment of dividends, if any, on the Company's common stock, the incurrence of debt by the Company, amendments to the Company's amended and restated certificate of incorporation or bylaws and the entering into of extraordinary transactions, and its interests may not in all cases be aligned with your interests. In addition, MTD Holdings Inc. may have an interest in pursuing acquisitions, divestitures and other transactions that, in its judgment, could enhance its investment, even though such transactions might involve risks to the Company or be opposed by other stockholders.
The Company may incur additional tax expense or become subject to additional tax exposure.
The Company's provision for income taxes and the cash outlays required to satisfy its income tax obligations in the future could be harmed by changes in the level of earnings in the tax jurisdictions in which the Company operates, changes in the valuation of deferred tax assets, changes in its plans to reinvest the earnings of the Company's non-U.S. operations outside the United States and changes in tax laws and regulations. The Company's income tax returns are subject to examination by federal, state and local tax authorities in the United States and tax authorities outside the United States. The results of these examinations and the ongoing assessments of the Company's tax exposures could also have an adverse effect on its provision for income taxes and the cash outlays required to satisfy the Company's income tax obligations.
Certain of the Company's pension plans are underfunded and the Company has unfunded post-retirement benefit obligations. Additional cash contributions the Company may be required to make to its pension plans or amounts the Company may be required to pay in respect of post-retirement benefit obligations will reduce the cash available for its business.
Certain of the Company's employees in the United States are participants in defined benefit pension plans which it sponsors. As of October 31, 2016, the unfunded amount of the Company's U.S. pension plans was approximately $26,326. While future benefit accruals under its U.S. defined benefit plans were frozen, the Company may have ongoing obligations to make contributions to its U.S. pension plans as required in accordance with the Employee Retirement Income Security Act of 1974, as amended ("ERISA"), and the Internal Revenue Code. In addition, the Company sponsors unfunded post-retirement benefits for a limited number of employees. As of October 31, 2016, the unfunded amount for these post-retirement benefits was approximately $372. Cash contributions to these plans and payment of these post-retirement benefit obligations will reduce the cash available for the Company's business. Under ERISA, the Pension Benefit Guaranty Corporation ("PBGC") has the authority to petition a court to terminate an underfunded defined benefit pension plan under limited circumstances. In the event the Company's pension plans are terminated by the PBGC, the Company could be liable to the PBGC for the entire amount of the underfunding, as calculated by the PBGC based on its own assumptions (which likely would result in a larger obligation than that based on the assumptions it has used to fund such plans).
The Company may incur material costs related to plant closings, which could materially harm the Company's business, financial condition, results of operations, and cash flows.
If the Company must close manufacturing facilities because of lost business or consolidation of manufacturing facilities, the employee termination costs, asset retirements, and other exit costs associated with the closure of these facilities may be significant. In certain circumstances, the Company may close a manufacturing facility that is operated under a lease agreement and it may continue to incur material costs in accordance with the lease agreement. The Company attempts to align production capacity with demand; however, the Company cannot provide assurance that plants will not have to be closed.
16
Regulations related to "conflict minerals" may cause the Company to incur substantial expenses and otherwise adversely impact the Company's business.
Regulations related to "conflict minerals" may cause the Company to incur additional expenses and may make its supply chain more complex. In August 2012, the SEC adopted annual disclosure and reporting requirements for those companies who use certain minerals known as "conflict minerals", which may or may not be mined from the Democratic Republic of Congo and adjoining countries, in their products. These requirements required due diligence efforts beginning in 2013, with initial disclosure requirements which began in 2014. There are significant costs associated with complying with these disclosure requirements, including for diligence to determine the sources of conflict minerals used in the Company's products and other potential changes to products, processes or sources of supply as a consequence of such verification activities.
Failure to maintain an effective system of internal control over financial reporting or remediate weaknesses could materially harm the Company’s revenues and trading price of the common stock. If the Company cannot accurately report financial results, shareholder confidence may be eroded in the Company's ability to pursue business and maintain the trading price of its common stock.
Internal control systems are intended to provide reasonable assurance regarding the preparation and fair presentation of published financial statements. Based on results of testing during the fourth quarter of fiscal 2015, management identified control deficiencies with respect to the design and operational effectiveness of its internal control over financial reporting, which when aggregated, represented material weaknesses in certain monitoring controls for its Wellington manufacturing facility and for those plants utilizing the same reporting application as the Wellington facility. Company management, with detailed oversight, immediately initiated and implemented corrective actions beginning in the fourth quarter of fiscal 2015 to remediate the deficiencies described above. Management concluded as of the second quarter of fiscal 2016 the remediation plans were successfully implemented and the material weaknesses as described above related to the Wellington manufacturing facility and those manufacturing facilities utilizing the same reporting system as Wellington were remediated.
Based on results of testing during the fourth quarter of fiscal 2016, management identified control deficiencies over its Saltillo manufacturing facility, resulting in corrections of immaterial errors of previously reported financial statements and financial information. Management concluded as of the fourth quarter of fiscal 2016 that, when aggregated, those control deficiencies result in a material weakness of the financial presentation of the Saltillo manufacturing facility isolated to that location. As described in Item 9A of this Form 10-K, the Company has taken immediate measures and has taken immediate measures to remediate the material weakness, and plans to complete remediation as quickly as possible in 2017. Acknowledging the material weakness isolated to its Saltillo manufacturing facility, Company management concluded its internal controls over financial reporting was not effective as of October 31, 2016.
The Company has incurred unanticipated expenses and costs, including audit, legal, consulting and other professional fees, in connection with the correction of immaterial errors of previously issued financial statements and the ongoing remediation of material weaknesses in our internal control over financial reporting and any further revision or restatement of our financial statements would likely cause the Company to incur significant additional accounting, legal, consulting and other professional fees and expenses, which would adversely affect its results of operations and financial condition, and could expose the Company to potential claims and additional risks that could adversely affect its business, results of operations, cash flows and financial condition. If remedial measures are insufficient to address these material weaknesses, or if additional material weaknesses or significant deficiencies in our internal control over financial reporting are discovered or occur in the future, the Company's consolidated financial statements may contain material misstatements. Matters impacting the Company's internal controls may cause it to be unable to report its financial data on a timely basis, or may cause it to adjust previously issued financial data, and thereby subject the Company to adverse regulatory consequences, including sanctions or investigations by the SEC, or violations of applicable stock exchange listing rules. There could also be a negative reaction in the financial markets due to a loss of investor confidence in the Company and the reliability of its financial statements.
Item 1B. | Unresolved Staff Comments |
Not Applicable.
17
Item 2. | Properties. |
The Company owns its principal executive offices, which are located at 880 Steel Drive, Valley City, Ohio 44280.
The Company maintains 22 manufacturing facilities and six technical and administrative facilities located in Asia, Europe and North America encompassing approximately 4.2 million square feet. Of the 28 facilities, 12 are leased.
The Company believes that substantially all of its facilities are well maintained and in good operating condition. They are considered adequate for present needs and are expected to remain adequate for the near future.
Item 3. | Legal Proceedings. |
A securities class action lawsuit was filed on September 21, 2015 in the United States District Court for the Southern District of New York against the Company and certain of its officers (the President and Chief Executive Officer and Vice President of Finance and Treasurer). As amended, the lawsuit claims in part that the Company issued inaccurate information to investors about, among other things, the Company’s earnings and income and its internal controls over financial reporting for fiscal 2014 and the first and second fiscal quarters of 2015 in violation of the Securities Exchange Act of 1934. The amended complaint seeks an award of damages in an unspecified amount on behalf of a putative class consisting of persons who purchased the Company's common stock between January 12, 2015 and September 14, 2015, inclusive. The Company and such officers filed a Motion to Dismiss this lawsuit with the United States District Court for the Southern District of New York on April 18, 2016.
A shareholder derivative lawsuit was filed on April 1, 2016 in the Court of Common Pleas, Medina County, Ohio against the Company's President and Chief Executive Officer and Vice President of Finance and Treasurer and members of the Company’s Board of Directors. The lawsuit claims in part that the defendants breached their fiduciary duties owed to the Company by failing to exercise appropriate oversight over the Company's accounting controls, leading to the accounting issues and the restatement announced in September 2015. The complaint seeks a judgment against the individual defendants and in favor of the Company for money damages, plus miscellaneous non-monetary relief. On May 2, 2016, the Court entered a stipulated order staying this case pending the outcome of the Motion to Dismiss in the securities class action lawsuit described in the previous paragraph.
In addition, from time to time, the Company is involved in legal proceedings, claims or investigations that are incidental to the conduct of its business. The Company vigorously defends itself against such claims. In future periods, the Company could be subject to cash costs or non-cash charges to earnings if a matter is resolved on unfavorable terms. However, although the ultimate outcome of any legal matter cannot be predicted with certainty, based on current information, including its assessment of the merits of the particular claims, the Company does not expect that its legal proceedings or claims will have a material impact on its future consolidated financial condition, results of operations or cash flows.
Item 4. | Mine Safety Disclosures. |
Not Applicable.
Executive Officers of the Registrant
18
Set forth below is certain information concerning the executive officers of the Registrant. Executive officers are appointed annually by the Board of Directors.
Name | Age | Years as Executive Officer | Title | |||
Ramzi Y. Hermiz | 51 | 4 | President and Chief Executive Officer | |||
W. Jay Potter | 55 | 1 | Senior Vice President and Chief Financial Officer | |||
Gary DeThomas | 53 | 2 | Vice President Corporate Controller | |||
Mr. Hermiz, President and Chief Executive Officer, was appointed by the Board of Directors in September 2012. Prior to joining the Company, Mr. Hermiz served since 2009 as Senior Vice President, Vehicle Safety and Protection of Federal-Mogul Corporation, a publicly held company that designs, engineers, manufactures and distributes technologies to improve fuel economy, reduce emissions and enhance vehicle safety.
Mr. Potter, Senior Vice President and Chief Financial Officer joined the Company in December 2015. Prior to joining the Company, Mr. Potter served as Vice President and Chief Financial Officer of Sedgwick Claims Management Services, a provider of technology-enabled claims and productivity management solutions, since 2012. Immediately prior to his employment with Sedgwick Claims Management Services, Mr. Potter held various financial leadership roles with Masco Corporation, a provider of building supplies, construction materials and contractor services for new home and industrial construction, commencing in 2002. In his final role with Masco, Mr. Potter served as Chief Financial Officer and Vice President of Finance of Masco Cabinetry, beginning in 2010.
Mr. DeThomas, Vice President Corporate Controller, joined the Company in March 2015 and was appointed to principal accounting officer in September 2015. Prior to joining the Company, Mr. DeThomas worked at Techtronic Industries, a designer, manufacturer and marketer of power tools, outdoor power equipment and floor care appliances, beginning in June 2013. While at Techtronic Industries, Mr. DeThomas was Vice President and Chief Financial Officer of the Floor Care Division. Prior to that, Mr. DeThomas served as the Vice President and Chief Financial Officer for King Systems, a manufacturer and distributor of medical devices, from 2011 until June 2013. Mr. DeThomas also served as Vice President, Controller of North American Tire Division for Cooper Tire & Rubber Company, the parent company of a global family of companies that specializes in the design, manufacture, marketing and sale of passenger car and light truck tires, from 2008 until 2011.
PART II
Item 5. | Market for Registrant's Common Equity, Related Stockholder Matters and Issuer Purchases of Equity Securities. |
The Company's Common Stock is traded on the Nasdaq Global Market under the symbol "SHLO." On January 13, 2017, the closing price for the Company's Common Stock was $8.05 per share.
The Company's Common Stock commenced trading on the Nasdaq National Market on June 29, 1993. The table below sets forth the high and low bid prices for the Company's Common Stock for its four quarters in each of 2016 and 2015.
2016 | 2015 | |||||||||||||||
Quarter | High | Low | High | Low | ||||||||||||
1st | $ | 8.55 | $ | 3.70 | $ | 17.37 | $ | 10.98 | ||||||||
2nd | $ | 6.51 | $ | 3.06 | $ | 14.70 | $ | 11.58 | ||||||||
3rd | $ | 9.78 | $ | 4.95 | $ | 13.83 | $ | 9.54 | ||||||||
4th | $ | 9.69 | $ | 6.50 | $ | 12.22 | $ | 6.59 | ||||||||
As of the close of business on January 13, 2017, there were 161 stockholders of record for the Company's Common Stock. The Company believes that the number of beneficial holders of the Company's Common Stock exceeds 4,000. The Company did not repurchase any of its equity securities during fiscal 2016.
The Company did not pay any dividends in 2016 or 2015. The Company's current Credit Agreement contains covenants that could restrict, under certain circumstances, the ability to pay dividends on its common stock. Any decision to declare and pay dividends in the future will be made at the discretion of the Board of Directors and will depend on, among other things, results
19
of operations, cash requirements, financial condition, contractual restrictions and other factors that the Board of Directors may deem relevant.
The following graph compares the Company's cumulative total stockholder return compared with Standard & Poor's 500 Stock Index and the Standard & Poor's Supercomposite Auto Parts and Equipment Index. The comparison assumes $100 was invested at the closing price on October 31, 2011 and reflects the total cumulative return on that investment, including the reinvestment of dividends where applicable, through October 31, 2016.
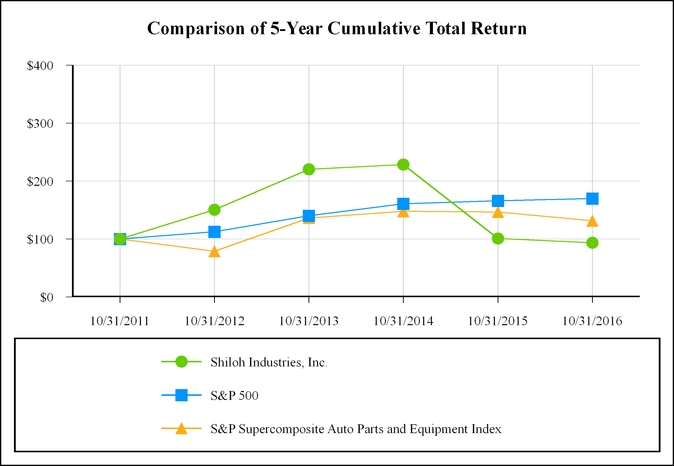
10/31/2011 | 10/31/2012 | 10/31/2013 | 10/31/2014 | 10/31/2015 | 10/31/2016 | |||||||||||||
Shiloh Industries, Inc. | $ | 100.00 | $ | 150.38 | $ | 220.28 | $ | 228.60 | $ | 101.15 | $ | 93.77 | ||||||
S&P 500 | $ | 100.00 | $ | 112.68 | $ | 140.15 | $ | 161.02 | $ | 165.91 | $ | 169.83 | ||||||
S&P Supercomposite Auto Parts and Equipment Index | $ | 100.00 | $ | 78.82 | $ | 136.46 | $ | 147.97 | $ | 146.58 | $ | 131.65 | ||||||
20
Item 6. Selected Financial Data
The following table presents information from the Company's Consolidated Financial Statements as of or for the five years ended October 31, 2016. This information should be read in conjunction with "Management's Discussion and Analysis of Financial Condition and Results of Operations" and "Financial Statements and Supplementary Data." Refer to Note 2 - Correction of Immaterial Errors for information regarding the revision of previously issued financial information.
Year Ended October 31, | ||||||||||||||
2016 | 2015* | 2014* | 2013* | 2012* | ||||||||||
(dollars in thousands, except per share amount) | ||||||||||||||
Operating Results | ||||||||||||||
Revenues (a) | $1,065,834 | $1,073,052 | $832,067 | $660,217 | $547,283 | |||||||||
Selling, general, and administrative expenses (a) | 73,417 | 63,028 | 50,236 | 31,181 | 24,155 | |||||||||
Net income | 3,669 | 5,905 | 19,915 | 20,186 | 13,345 | |||||||||
Basic earnings per common share | $0.21 | $0.34 | $1.16 | $1.19 | $0.79 | |||||||||
Diluted earnings per common share | $0.21 | $0.34 | $1.16 | $1.19 | $0.79 | |||||||||
Financial Position | ||||||||||||||
Total assets (a) | $626,429 | $660,854 | $625,678 | $390,294 | $248,921 | |||||||||
Long-term debt (a) | 256,922 | 298,873 | 268,102 | 119,384 | 21,150 | |||||||||
Total liabilities | 493,639 | 526,392 | 485,253 | 260,710 | 141,699 | |||||||||
Total stockholders' equity | 132,790 | 134,462 | 140,425 | 129,584 | 107,222 | |||||||||
Dividends declared per common share | $0.00 | $0.00 | $0.00 | $0.25 | $0.50 | |||||||||
(a) Sales from strategic acquisitions completed in fiscal years 2014 and 2013 increased revenues by approximately $122,320 and $77,000 in 2014 and 2013, respectively. As a result of the acquisitions, selling, general, and administrative expenses increased in 2014 and 2013 by approximately $4,310 and $2,860, respectively. The acquisition related costs consisted of personnel, personnel related expenses, and other administrative expenses. Total assets acquired in the acquisitions totaled $190,842 and $116,457 in 2014 and 2013, respectively. Total cash paid for the acquisitions was $124,544 in 2014 and $104,470 in 2013, which directly resulted in an increase in borrowing from the line of credit and increased long-term debt accordingly.
* As revised to reflect the correction of immaterial errors. For additional information, see Note 2 - Correction of Immaterial Errors.
21
Item 7. | Management’s Discussion and Analysis of Financial Condition and Results of Operations. |
(Dollars in thousands, except per share data)
General
The Company is a leading global supplier of lightweighting and noise, vibration solutions to the automotive, commercial vehicle and other industrial markets, capable of delivering solutions in aluminum, magnesium, steel and steel alloys to OEMs. Shiloh delivers these solutions through design, engineering and manufacturing of first operation blanks, engineered welded blanks, complex stampings, modular assemblies and highly engineered aluminum and magnesium die casting and machined components which serve the automotive, commercial vehicle and other industrial markets of OEMs and, as a Tier II supplier, to Tier I automotive part manufacturers who in turn supply OEMs. Additionally, the Company provides a variety of intermediate steel processing services, such as oiling, leveling, cutting-to-length, multi-blanking, slitting, edge trimming of hot and cold-rolled steel coils and inventory control services for automotive and steel industry customers. The Company has locations in Asia, Europe and North America.
Recent Trends and General Economic Conditions Affecting the Automotive Industry
The Company's business and operating results are directly affected by the relative strength of the North American and European automotive industries, which are driven by macro-economic factors such as gross domestic product growth, consumer income and confidence levels, fluctuating commodity, currency and gasoline prices, automobile discounts and incentive offers and perceptions about global economic stability. The automotive industry remains susceptible to these factors that impact consumer spending habits and could adversely impact consumer demand for vehicles.
The Company's products are included in many models of vehicles manufactured by nearly all OEMs that produce vehicles in Europe and North America. The Company’s revenues are dependent upon the production of automobiles and light trucks in both Europe and North America. According to industry statistics (published by IHS Automotive in November 2016), Europe and North America production volumes for the fiscal years ended October 31, 2016, 2015, and 2014 were as follows:
Production Volumes | Year Ended October 31, | |||||||
2016 | 2015 | 2014 | ||||||
Europe | 21,255 | 20,802 | 20,148 | |||||
North America | 17,806 | 17,423 | 16,850 | |||||
Total | 39,061 | 38,225 | 36,998 | |||||
Europe: | ||||||||
Increase from prior year | 453 | 654 | ||||||
% Increase from prior year | 2.2 | % | 3.2 | % | ||||
North America | ||||||||
Increase from prior year | 383 | 573 | ||||||
% Increase from prior year | 2.2 | % | 3.4 | % | ||||
Total | ||||||||
Increase from prior year | 836 | 1,227 | ||||||
% Increase from prior year | 2.2 | % | 3.3 | % | ||||
Both Europe and North America continue to see an increase in production levels, primarily due to increased consumer demand, as a result of an improvement in economic conditions and higher consumer confidence. The Company is cautiously optimistic that consumer demand levels will remain steady and continues to closely monitor customer release volumes even though the overall economic environment reflects improvement and there is evidence that the North American economy is strengthening. However, the Company will continue to monitor changes that could adversely impact consumer demand for vehicles such as government fiscal policy which could impact levels of unemployment and consumer confidence.
The Company operates in an extremely competitive industry, driven by global vehicle production volumes. Business is typically awarded to the supplier offering the most favorable combination of cost, quality, technology and service. Customers continue to demand periodic cost reductions that require the Company to assess, redefine and improve operations, products, and
22
manufacturing capabilities to maintain and improve profitability. Management continues to develop and execute initiatives designed to meet challenges of the industry and to achieve its strategy for sustainable global profitable growth.
Capacity utilization levels are very important to profitability because of the capital-intensive nature of the Company’s operations. The Company continues to adapt its capacity to meet customer demand, both expanding capabilities in growth areas as well as reallocating capacity between manufacturing facilities as needs arise. The Company employs new technologies to differentiate its products from its competitors and to achieve higher quality and productivity. The Company believes that it has sufficient capacity to meet its current and expected manufacturing needs.
Most of the steel purchased for the Company’s BlankLight®and Stamplight™ brands is purchased through the customers’ steel buying programs. Under these programs, the customer negotiates the price for steel with the steel suppliers. The Company pays for the steel based on these negotiated prices and passes on those costs to the customer. Although the Company takes ownership of the steel, the customers are responsible for all steel price fluctuations under these programs. The Company also purchases steel directly from domestic primary steel producers and steel service centers. Steel pricing declined during 2015 and 2016. Lagging demand for construction and oil country tubular goods products as well as a decrease in global demand for prime scrap grade have put significant downward price pressure on steel prices in North America. The Company refers to the “net steel impact” as the combination of the change in steel prices that are reflected in the price of our products, the change in the cost to procure steel from the source, and the change in our recovery of offal. Our strategy is to be economically neutral to steel pricing by having these factors offset each other. As the price of steel has declined, so has the scrap metal market, partially impacting our current year performance. The Company blanks and processes steel for some of its customers on a toll processing basis. Under these arrangements, the Company charges a tolling fee for the operations that it performs without acquiring ownership of the steel and being burdened with the attendant costs of ownership and risk of loss. Revenues from operations involving directly owned steel include a component of raw material cost whereas toll processing revenues do not.
For the Company's aluminum and magnesium die casting operations, CastLight™ brands, the cost of aluminum and magnesium may be handled in one of two ways. The primary method is to secure quarterly aluminum and magnesium purchase commitments based on customer releases and then pass the quarterly price changes to those customers utilizing published metal indices. The second method is to adjust prices monthly based on a referenced metal index plus additional material cost spreads agreed to by the Company and its customers.
Results of Operations
In 2016, members of finance management engaged in an initial review of certain balance sheet accounts and transactions. With the concurrence of the Audit Committee, it was determined that a more extensive assessment (the "Assessment") was needed. Under the direction of the Audit Committee, who were advised and supported by independent outside counsel, the Assessment was led by the Company's Chief Financial Officer and Principal Accounting Officer and was conducted with the assistance of internal and outside counsel and consultants. As part of the Assessment, detailed inspection of accounting records were conducted to determine if financial reporting was in accordance with GAAP and the extent of any potential misstatement. Additionally, interviews of numerous individuals were conducted to qualitatively assess what had occurred.
As a result of the Assessment, in connection with the preparation of its consolidated financial statements for the fiscal year ending October 31, 2016, the Company determined that the consolidated financial statements of fiscal years 2015, 2014, 2013, 2012 and the first three quarters of fiscal year 2016, included immaterial errors. As a result, the Company has revised its consolidated financial statements (the "Revision") as of October 31, 2015 and for fiscal years ending October 31, 2015, 2014, 2013 and 2012, each of the interim periods of 2015 and the first three quarters of fiscal year 2016. The following information set forth in this Item 7 reflects the correction of these immaterial errors. For more information on these immaterial errors, see Note 2 to the consolidated financial statements "Correction of Immaterial Errors" included elsewhere in this Annual Report on Form 10-K.
Year Ended October 31, 2016 Compared to Year Ended October 31, 2015
REVENUES. Sales for fiscal 2016 were $1,065,834, a decrease of $7,218 from fiscal 2015 sales of $1,073,052, or 0.7%. Adjusting for an unfavorable currency translation of $5,782, automotive production sales improved $28,732 and commercial vehicle and industrial market sales were down $18,909. Further, there was a change in the contractual relationship of certain customer sales from owned steel to consigned steel and surcharge recovery of $10,309 and $950 of other sales.
GROSS PROFIT. Gross profit for fiscal 2016 was $96,176 compared to gross profit of $86,187 in fiscal 2015, an increase of $9,989, or 11.6%. Gross profit as a percentage of sales was 9.0% for fiscal 2016 and 8.0% fiscal 2015. Changes in customer
23
and product mix favorably impacted direct material costs by $32,308 which was negatively offset by a decrease in scrap recoveries and positively offset by an increase in labor and benefits of $4,025, an increase in repairs and maintenance and indirect manufacturing supplies of $3,070, an increase in depreciation expense of $2,878 offset by a savings in utilities of $1,329 and other of $184.
SELLING, GENERAL AND ADMINISTRATIVE EXPENSES. Selling, general and administrative expenses support the growth in sales opportunities, new technologies, new product launches and acquisition activities. Expenses of $73,417 for fiscal 2016 were $10,389 more than selling, general and administrative expenses of $63,028 for the prior year. As a percentage of sales, these expenses were 6.9% of sales for fiscal 2016 and 5.9% for fiscal 2015. The increase of $10,389 is primarily attributable to an increase in salaries and benefits of $6,665, one-time expenses of approximately $4,063 related to the plant optimization and professional fees offset by cost savings of $339.
AMORTIZATION OF INTANGIBLE ASSETS. Amortization of intangible assets expense of $2,258 for fiscal 2016 was $37 less than amortization of intangible assets expense of $2,295 for the prior year.
ASSET IMPAIRMENT AND RECOVERY CHARGES. Asset impairments of $2,031 were recorded during fiscal 2016 of which $1,282 related to assets held for sale, $476 related to a specific piece of idled equipment and $273 related to the sale of a building. There were no asset impairments or recoveries recorded during fiscal 2015.
INTEREST EXPENSE. Interest expense for fiscal 2016 was $18,086, compared to interest expense of $9,898 during fiscal 2015. The increase in interest expense was the result of higher average rates and amortization of increased deferred financing fees associated with the Credit Agreement. Borrowed funds averaged $273,296 during fiscal 2016 and the weighted average interest rate was 4.78%. During fiscal 2015, borrowed funds averaged $278,289 and the weighted average interest rate of debt was 2.82%.
OTHER INCOME / EXPENSE. Other expense, net was $1,890 for fiscal 2016, compared to other expense of $387 for fiscal 2015 which primarily consisted of currency transaction gains and losses realized by the Company's Asian, European and Mexican subsidiaries.
PROVISION FOR INCOME TAXES. The provision for income taxes in fiscal 2016 was a tax benefit of $5,152 on a loss before taxes of $1,483. In fiscal year 2015, the provision for income taxes was $4,710 on income before taxes of $10,615 for an effective tax rate of 44.4%. The significant tax benefit in 2016 was favorably impacted due to the removal of valuation allowances related to the Swedish operations net operating loss deferred tax assets, favorable tax deductions and credits offset by certain foreign losses without a tax benefit.
NET INCOME. The net income for fiscal 2016 was $3,669, or $0.21 per share, diluted compared to net income in fiscal year 2015 of $5,905, or $0.34 per share, diluted.
24
Results of Operations
Year Ended October 31, 2015 Compared to Year Ended October 31, 2014
REVENUES. Sales for fiscal 2015 were $1,073,052, an increase of $240,985 over fiscal 2014 sales of $832,067, or 29.0%. Acceptance of leading technologies and the strategic acquisitions completed in fiscal 2014 contributed to the increase in sales revenue of $255,485 in fiscal 2015. Of the increase in sales, $95,445 is from the acquisitions and the remaining increase is from business wins that were successfully launched and organic production increases partially offset by the negative impact of foreign currency translation of $14,500.
GROSS PROFIT. Gross profit for fiscal 2015 was $86,187 compared to gross profit of $76,312 in fiscal 2014, an increase of $9,875, or 12.9%. Gross profit as a percentage of sales was 8.0% for fiscal 2015 and 9.2% fiscal 2014. The strategic acquisitions completed in fiscal 2014 contributed favorably, improving gross profit by $19,298 offset by an increase in labor and benefits of $4,387, an increase of $7,700 due to operating inefficiencies and adjustments to prepaid tooling and an increase of $1,171 in depreciation expense. In addition, gross profit was negatively impacted by scrap pricing of approximately $13,700.
SELLING, GENERAL AND ADMINISTRATIVE EXPENSES. Selling, general and administrative expenses support the growth in sales opportunities, new technologies, new product launches and acquisition activities. Expenses of $63,028 for fiscal 2015 were $12,792 more than selling, general and administrative expenses of $50,236 for the prior year. As a percentage of sales, these expenses were 5.9% of sales for fiscal 2015 and 6.0% for fiscal 2014. The strategic acquisitions completed in fiscal 2014 have incrementally added $10,292 to infrastructure costs incurred in 2015. In addition, the Company recognized additional one-time expenses of approximately $2,500 related to the Wellington facility and financing charges.
AMORTIZATION OF INTANGIBLE ASSETS. Amortization of intangible assets expense of $2,295 for fiscal 2015 was $131 more than amortization of intangible assets expense of $2,164 for the prior year. The increase is related to the final purchase price accounting adjustments affecting intangible assets acquired from the fiscal 2014 acquisitions.
ASSET IMPAIRMENT AND RECOVERY CHARGES. Asset recoveries of $4,026 were recorded during fiscal 2014 for cash received upon sales of assets from the Company's former Mansfield Blanking facility, which was impaired in fiscal 2010.
INTEREST EXPENSE. Interest expense for fiscal 2015 was $9,898, compared to interest expense of $4,415 during fiscal 2014. The increase in interest expense was the result of higher average borrowing of funds and higher average rates for funding acquisition activities. Borrowed funds averaged $278,289 during fiscal 2015 and the weighted average interest rate was 2.82%. During fiscal 2014, borrowed funds averaged $167,012 and the weighted average interest rate of debt was 2.08%.
OTHER INCOME / EXPENSE. Other expense, net was $387 for fiscal 2015 which primarily consisted of currency transaction gains and losses realized by the Company's European and Mexican subsidiaries. Other income, net was $504 for fiscal 2014 which included a $332 realized gain on the sale of marketable securities and $172 of currency transaction gains and losses realized by the Company's European and Mexican subsidiaries.
PROVISION FOR INCOME TAXES. The provision for income taxes in fiscal 2015 was an expense of $4,710 on income before taxes of $10,615 for an effective tax rate of 44.4%. In fiscal year 2014, the provision for income taxes was an expense of $4,137 on income before taxes of $24,052 for an effective tax rate of 17.2%. The effective tax rate for fiscal 2015 has increased 27.2 percentage points compared to fiscal 2014, was favorably impacted due to the removal of a valuation allowance related to the Mexico operation together with additional Research and Development credits (“R&D Credit”) involving multiple years. In addition for 2014 and 2015, foreign tax rates of countries in which the Company operates are in all cases less than the U.S. statutory federal income tax rate, having a favorable impact on the effective tax rate.
NET INCOME. The net income for fiscal 2015 was $5,905, or $0.34 per share, diluted compared to net income in fiscal year 2014 of $19,915, or $1.16 per share, diluted.
Liquidity and Capital Resources
General:
The Company’s ability to obtain cash adequate to fund its needs depends generally on the results of its operations, and the availability of financing. Management believes that cash on hand, cash flow from operations and available borrowings under its Revolving Credit Agreement (defined below) will be sufficient to fund capital expenditures and meet its operating obligations. As of October 31, 2016, the Company had available borrowings of approximately $90,106, which it believes is adequate to fund
25
working capital requirements for at least the next twelve months. In the longer term, the Company believes that its expected operations will provide adequate long-term cash flows. However, there can be no assurance that it will meet such expectations. For additional information, refer to the Company's Risk Factors described in Item 1A, included in Part 1 of this report.
Cash Flows and Working Capital:
At October 31, 2016, total debt was $258,945 and total equity was $132,790, resulting in a capitalization rate of 66.1% debt, 33.9% equity. Current assets were $293,153 and current liabilities were $203,047, resulting in positive working capital of $90,106.
The following table summarizes the Company's cash flows from operating, investing, and financing activities:
Year Ended | Year Ended | ||||||||||||||||||
Years Ended October 31, | 2016 vs. 2015 | 2015 vs. 2014 | |||||||||||||||||
2016 | 2015 | 2014 | change | change | |||||||||||||||
Net cash provided by operating activities | $ | 69,361 | $ | 3,373 | $ | 29,018 | $ | 65,988 | $ | (25,645 | ) | ||||||||
Net cash used in investing activities | $ | (28,316 | ) | $ | (27,701 | ) | $ | (159,408 | ) | $ | (615 | ) | $ | 131,707 | |||||
Net cash (used for) provided by financing activities | $ | (43,546 | ) | $ | 26,120 | $ | 142,526 | $ | (69,666 | ) | $ | (116,406 | ) | ||||||
Net Cash Provided by Operating Activities:
Years Ended October 31, | |||||||||||
2016 | 2015 | 2014 | |||||||||
Operational cash flow before changes in operating assets and liabilities | $ | 44,163 | $ | 46,726 | $ | 44,780 | |||||
Changes in operating assets and liabilities: | |||||||||||
Accounts receivable | 10,975 | (27,607 | ) | (10,273 | ) | ||||||
Inventories | (2,408 | ) | 358 | 4,734 | |||||||
Prepaids and other assets | 14,476 | (8,665 | ) | (8,270 | ) | ||||||
Payables and other liabilities | (1,843 | ) | (5,923 | ) | 3,573 | ||||||
Accrued income taxes | 3,998 | (1,516 | ) | (5,526 | ) | ||||||
Total change in operating assets and liabilities | $ | 25,198 | $ | (43,353 | ) | $ | (15,762 | ) | |||
Net cash provided by operating activities | $ | 69,361 | $ | 3,373 | $ | 29,018 | |||||
Cash flow from operations before changes in operating assets and liabilities was $2,563 lower for the year ended October 31, 2016 compared to the year ended October 31, 2015 as a result of a foreign tax benefit.
Cash flow from operations before changes in operating assets and liabilities was $1,946 higher for the year ended October 31, 2015 compared to the year ended October 31, 2014 which was driven by higher earnings in fiscal year 2015.
Cash inflow and outflow from changes in operating assets and liabilities:
• | Cash inflows from changes in operating assets and liabilities was $25,198 for the fiscal year ended October 31, 2016 and was positively impacted by working capital initiatives. Cash outflows from changes in operating assets and liabilities were $43,353 and $15,762 for the fiscal years ended October 31, 2015 and 2014, respectively. Both 2016 and 2015 were positively impacted by increased sales, acquisition integration and new product launches. |
• | Cash inflows from changes in accounts receivable for the fiscal year ended October 31, 2016 was $10,975. The improvement was primarily due to increased efforts in collecting receivables and invoicing of customer reimbursed tooling programs as the Company’s product launches have significantly increased since 2014. Cash outflows from changes in accounts receivable for the fiscal years ended October 31, 2015 and 2014 was $27,607 and $10,273, respectively, primarily driven by sales increases, acquisitions. |
• | Cash outflows from changes in inventory for the fiscal year ended October 31, 2016 was $2,408. The use of cash was primarily driven by a change in customer mix and delivery. Cash inflows for the fiscal years ended October 31, 2015 and 2014 was $358 and $4,734, respectively, were also driven by a change in customer mix and delivery, acquisition integration and improvements in inventory management. |
26
• | Cash inflows from changes in prepaids and other assets for the fiscal year ended October 31, 2016 was $14,476 and improved from the invoicing of customer reimbursed tooling. Cash outflows from changes in prepaids and other assets for the fiscal years ended October 31, 2015 and 2014 was $8,665 and $8,270, respectively. Significant new program launches in 2014 and 2015 lead to an increase in spending resulting in higher prepaid tooling. As production started on those new awards later in 2015, the Company was able to invoice the customer to recover the investments. |
• | Cash outflows from changes in payables and other for the fiscal years ended October 31, 2016 and 2015 was $1,843 and $5,923, respectively, as a result of favorable raw material pricing as well as reductions in tooling investments. Cash inflows from changes in payables and other for the fiscal year ended 2014 was $3,573 due to acquisitions. |
• | Cash inflows from changes in accrued income taxes for the fiscal years ended October 31, 2016 of $3,998 was primarily driven by federal income tax refunds and cash outflows of $1,516 and $5,526, respectively, for the fiscal year ended October 31, 2014 were primarily due to tax payments. |
Net Cash Used For Investing Activities:
Net cash used for investing activities in fiscal years 2016, 2015 and 2014 was $28,316, $27,701 and $159,408, respectively, and consisted mainly of capital expenditures and acquisitions. Cash used for capital expenditures during fiscal years 2016, 2015, and 2014 was $28,324, $39,376, and $39,593, respectively. The expenditures are attributed to projects for new awards and product launches. For fiscal years 2016, 2015 and 2014, proceeds from the sales of assets generated $1,508, $11,480 and $5,762, respectively. The total proceeds from the sale of assets during fiscal 2015 includes $9,854 from certain sale-leaseback transactions entered into. The assets under the sale-leaseback were for new machinery and equipment which are being leased over a six to seven year period. There was no gain or loss as a result of this sales-leaseback transaction. The Company had unpaid capital expenditures of $5,604, $4,225 and $5,415 at October 31, 2016, 2015 and 2014, respectively, and such amounts were included in accounts payable and excluded from capital expenditures in the accompanying consolidated statement of cash flows.
Cash used for acquisitions in fiscal 2014, net of cash acquired was $124,544. In 2015, $195 of escrow funds were returned to the Company as a reduction in the final purchase price.
Net Cash Provided By Financing Activities:
Net cash utilized in financing activities was $43,546 during 2016 and was attributable primarily to an improvement in working capital and lower capital expenditures which resulted in the Company's ability to reduce long-term borrowing. As of October 31, 2016, the Company's long-term indebtedness was $256,922.
Net cash provided by financing activities was $26,120 and $142,526 during 2015 and 2014, respectively. In fiscal 2015, higher debt levels were the result of working capital needs from the acquisitions plus the unfavorable impact of lower scrap metal market pricing. In fiscal 2014, higher debt levels were the result of the Finnveden Metal Structure and Radar Industries, Inc. acquisitions and capital expenditures.
The Company continues to closely monitor the business conditions affecting the automotive industry. In addition, the Company closely monitors its working capital position to ensure adequate funds for operations. The Company anticipates that funds from operations will be adequate to meet the obligations under the Credit Agreement through maturity of the Credit Agreement in September 2019, as well as scheduled payments for the equipment security note, capital lease and repayment of the other debt totaling $6,045 over the next five years.
Revolving Credit Facility:
The Company and its subsidiaries are party to a Credit Agreement, dated October 25, 2013, as amended (the "Credit Agreement") with Bank of America, N.A., as Administrative Agent, Swing Line Lender, Dutch Swing Line Lender and L/C Issuer, JPMorgan Chase Bank, N.A. as Syndication Agent, Merrill Lynch, Pierce, Fenner & Smith Incorporated and J.P. Morgan Securities, LLC as Joint Lead Arrangers and Joint Book Managers, The PrivateBank and Trust Company, Compass Bank and The Huntington National Bank, N.A., as Co-Documentation Agents, and the other lender parties thereto.
On October 28, 2016, the Company executed the Sixth Amendment which increases the permitted consolidated leverage ratio for periods beginning after July 31, 2016; increases the permitted consolidated fixed charge coverage ratio for periods beginning after April 30, 2017; modifies various baskets related to sale of accounts receivable, disposition of assets, sale-leaseback transactions; and makes other ministerial updates.
27
On October 30, 2015, the Company executed a Fifth Amendment (the "Fifth Amendment") to the Credit Agreement that increased the permitted leverage ratio with periodic reductions beginning after July 30, 2016. In addition, the Fifth Amendment permitted various investments as well as up to $40,000 aggregate outstanding principal amount of subordinated indebtedness, subject to certain conditions. Finally, the Fifth Amendment provided for a consolidated fixed charge coverage ratio and provided for up to $50,000 of capital expenditures by the Company and its subsidiaries throughout the year ending October 31, 2016, subject to certain quarterly baskets.
On April 29, 2015, the Company executed a Fourth Amendment (the "Fourth Amendment") to the Credit Amendment that maintained the commitment period to September 29, 2019 and allowed for an incremental increase of $25,000 (or if certain ratios are met, $100,000) in the original revolving commitments of $360,000, subject to the Company's pro forma compliance with financial covenants, the administrative agent's approval, and the Company obtaining commitments for such increase.
The Fourth Amendment included scheduled commitment reductions beginning after January 30, 2016 as well as scheduled commitment reductions totaling $30,000 allocated proportionately between the Aggregate Revolving A and B commitments. On April 30, 2016, the first committed reduction of $5,000 decreased the existing revolving commitment to $355,000, subject to the Company's pro forma compliance with financial covenants.
Borrowings under the Credit Agreement bear interest, at the Company's option, at LIBOR or the base (or "prime") rate established from time to time by the administrative agent, in each case plus an applicable margin. The current Credit Amendment provides for an interest rate margin on LIBOR loans of 1.5% to 4.0% and on base rate loans of 0.50% to 3.0%, depending on the Company's leverage ratio.
The Credit Agreement contains customary restrictive and financial covenants, including covenants regarding the Company’s outstanding indebtedness and maximum leverage and interest coverage ratios. The Credit Agreement also contains standard provisions relating to conditions of borrowing. In addition, the Credit Agreement contains customary events of default, including the non-payment of obligations by the Company and the bankruptcy of the Company. If an event of default occurs, all amounts outstanding under the Credit Agreement may be accelerated and become immediately due and payable. The Company was in compliance with the financial covenants as of October 31, 2016 and October 31, 2015.
After considering letters of credit of $5,080 that the Company has issued, unused commitments under the Credit Agreement was $97,020 at October 31, 2016.
Borrowings under the Credit Agreement are collateralized by a first priority security interest in substantially all of the tangible and intangible property of the Company and its domestic subsidiaries and 65% of the stock of foreign subsidiaries.
Other Debt:
On August 1, 2016, the Company entered into a finance agreement with an insurance broker for various insurance policies that bears interest at a fixed rate of 1.96% and requires monthly payments of $95 through May 2017. As of October 31, 2016, $661 of principal remained outstanding under this agreement and was classified as current debt in the Company’s consolidated balance sheets.
On September 2, 2013, the Company entered into an equipment security note that bears interest at a fixed rate of 2.47% and requires monthly payments of $44 through September 2018. As of October 31, 2016, $996 of principal remained outstanding under this agreement and $513 was classified as current debt and $483 was classified as long-term debt in the Company’s consolidated balance sheets.
The Company maintains capital leases for equipment used in its manufacturing facilities with lease terms expiring between 2018 and 2021. As of October 31, 2016, the present value of minimum lease payments under its capital leases amounted to $4,388.
Derivatives:
On February 25, 2014, the Company entered into an interest rate swap with an aggregate notional amount of $75,000 designated as a cash flow hedge to manage interest rate exposure on the Company’s floating rate LIBOR based debt under the Credit Agreement. The interest rate swap is an agreement to exchange payment streams based on the notional principal amount. This agreement fixes the Company’s future interest payments at 2.74% plus the applicable rate, as described above, on an amount of the Company’s debt principal equal to the then-outstanding swap notional amount. The forward interest rate swap commenced on March 1, 2015 with an initial $25,000 base notional amount. The second notional amount of $25,000 commenced on September 1, 2015 and the final notional amount of $25,000 commenced on March 1, 2016. The base notional amount plus each incremental
28
addition to the base notional amount have a five year maturity of February 29, 2020, August 31, 2020 and February 28, 2021, respectively. On the date the interest swap was entered into, the Company designated the interest rate swap as a hedge of the variability of cash flows to be paid relative to its variable rate monies borrowed. Any ineffectiveness in the hedging relationship is recognized immediately into earnings. The Company determined the mark-to-market adjustment for the interest rate swap to be a gain of $64, net of tax, for the fiscal year ended October 31, 2016 and a loss of $1,618, net of tax, for the fiscal year ended October 31, 2015, which is reflected in other comprehensive loss. The base notional amounts of $25,000 each or $75,000 total that commenced during 2015 and 2016 resulted in realized losses of $1,530 and $324 of interest expense related to the interest rate swap settlements. for the fiscal years ended October 31, 2016 and 2015, respectively. For fiscal 2017, the Company anticipates recognizing approximately $1,478 of additional interest expense related to the interest swap.
Scheduled repayments under the terms of the Credit Agreement and repayments of other debt are listed below:
Maturities of Debt Obligations: | Credit Agreement | Equipment Security Note | Capital Lease Obligations | Other Debt | Total | |||||||||||||||
Less than 1 year | $ | — | $ | 513 | $ | 849 | $ | 661 | $ | 2,023 | ||||||||||
1-3 years | 252,900 | 483 | 1,459 | — | 254,842 | |||||||||||||||
3-5 years | — | — | 2,080 | — | 2,080 | |||||||||||||||
After 5 years | — | — | — | — | — | |||||||||||||||
Total | $ | 252,900 | $ | 996 | $ | 4,388 | $ | 661 | $ | 258,945 | ||||||||||
Critical Accounting Policies
Preparation of the Company’s financial statements in conformity with accounting principles generally accepted in the United States requires management to make estimates and assumptions that affect the amounts reported in the consolidated financial statements and accompanying notes. The Company believes its estimates and assumptions are reasonable; however, actual results and the timing of the recognition of such amounts could differ from those estimates. The Company has identified the following items as critical accounting policies and estimates utilized by management in the preparation of the Company’s following financial statements. These estimates were selected because of inherent imprecision that may result from applying judgment to the estimation process. The expenses and accrued liabilities or allowances related to these policies are initially based on the Company’s best estimates at the time they are recorded. Adjustments are charged or credited to income and the related balance sheet account when actual experience differs from the expected experience underlying the estimates. The Company makes frequent comparisons of actual experience and expected experience in order to mitigate the likelihood that material adjustments will be required.
Revenue Recognition. The Company recognizes revenue from the sales of products when there is evidence of a sales agreement, the delivery of goods has occurred, the sales price is fixed or determinable and collectability of revenue is reasonably assured. The Company records revenues upon shipment of product to customers and transfer of title under standard commercial terms. Price adjustments, including those arising from resolution of quality issues, price and quantity discrepancies, surcharges for fuel and/or steel and other commercial issues, are recognized in the period when management believes that such amounts become probable, based on management’s estimates. The Company enters into tooling contracts with customers in the development of molds, dies and tools (collectively, "tooling") to be sold to such customers. The Company primarily records tooling revenues and costs net in cost of sales at the time of completion and final billing to the customer. These billings are recorded as progress billings (a reduction of the associated tooling costs) until the appropriate revenue recognition criteria have been met. The tooling contracts are separate arrangements between the Company and customer and are recorded on a gross or net basis in accordance with current applicable revenue recognition accounting literature.
Allowance for Doubtful Accounts. The Company evaluates the collectability of accounts receivable based on several factors. In circumstances where the Company is aware of a specific customer’s inability to meet its financial obligations, a specific allowance for doubtful accounts is recorded against amounts due to reduce the net recognized receivable to the amount the Company reasonably believes will be collected. Additionally, a general allowance for doubtful accounts is estimated based on historical experience of write-offs and the current financial condition of customers. The financial condition of the Company’s customers is dependent on, among other things, the general economic environment, which may substantially change, thereby affecting the recoverability of amounts due to the Company from its customers.
The Company carefully assesses its risk with each of its customers and considers compliance with terms and conditions, aging of the customer accounts, intelligence learned through contact with customer representatives and right of offset of its net account receivable / account payable position with customers, if applicable, in establishing the allowance.
29
Inventory Reserves. Inventories are valued at the lower of cost or market. Cost is determined on the first-in, first-out basis. Where appropriate, standard cost systems are used to determine cost and the standards are adjusted as necessary to ensure they approximate actual costs. Estimates of lower of cost or market value of inventory are based upon current economic conditions, historical sales quantities and patterns, and in some cases, the specific risk of loss on specifically identified inventories.
The Company values inventories on a regular basis to identify inventories on hand that may be obsolete or in excess of current future projected market demand. For inventory deemed to be obsolete, the Company provides a reserve for the full value of the inventory, net of estimated realizable value. Inventory that is in excess of current and projected use is reduced by an allowance to a level that approximates expected future demand. Additional inventory reserves may be required if actual market conditions differ from management’s expectations.
The Company monitors purchases of inventory to optimize its supply chain, thereby reducing the economic risk of holding excessive levels of inventory that could result in long holding periods or in unsalable inventory leading to losses in conversion.
Pre-production and development costs. The Company enters into contractual agreements with certain customers to develop molds, dies and tools (collectively, "tooling"). All such tooling contracts relate to parts that the Company will supply to customers under supply agreements. Tooling costs are capitalized in prepaid expenses and other assets determined by the fact that tooling contracts are separate from standard production contracts. The classification in prepaid or other assets for tooling costs is based upon the period of reimbursement from the customer as either current or non-current.
Income Taxes. The Company utilizes the asset and liability method in accounting for income taxes. Income tax expense includes U.S. and international income taxes minus tax credits and other incentives that will reduce tax expense in the year they are claimed. Deferred taxes are recognized at currently enacted tax rates for temporary differences between the financial accounting and income tax basis of assets and liabilities and operating losses and tax credit carryforwards. Valuation allowances are recorded to reduce net deferred tax assets to the amount that is more likely than not to be realized. The Company assesses both positive and negative evidence when measuring the need for a valuation allowance. Evidence typically assessed includes the operating results for the most recent three-year period and, to a lesser extent because of inherent uncertainty, the expectations of future profitability, available tax planning strategies, the time period over which the temporary differences will reverse and taxable income in prior carryback years if carryback is permitted under the tax law. The calculation of the Company’s tax liabilities also involves dealing with uncertainties in the application of complex tax laws and regulations. The Company recognizes liabilities for uncertain income tax positions based on the Company’s estimate of whether, and the extent to which, additional taxes will be required. The Company reports interest and penalties related to uncertain income tax positions as income taxes.
Business Combinations. The Company includes the results of operations of the businesses that it acquires as of the respective dates of acquisition. The Company allocates the fair value of the purchase price of its acquisitions to the tangible and intangible assets acquired, and liabilities assumed, based on their estimated fair values. The excess of the purchase price over the fair values of these identifiable assets and liabilities is recorded as goodwill.
Impairment of Long-lived Assets. In accordance with Accounting Standards Codification ("ASC") 360, the Company assesses long-lived assets held and used (such as property, plant and equipment and other assets) for impairment annually and whenever events or changes in circumstances indicate that the carrying amount of an asset or asset group may not be recoverable. Recoverability of an asset group to be held and used is measured by a comparison of the carrying amount of an asset group to the estimated undiscounted future cash flows expected to be generated by the group of assets. If the carrying amount of an asset group exceeds its estimated undiscounted future cash flows, an impairment charge is recognized for the amount by which the carrying amount of the group of assets exceeds the fair value of the group of assets. When long-lived assets are considered held for sale, they are recorded at the lower of carrying amount or fair value less costs to sell, and depreciation ceases. $2,031 of impairment charges were recognized during the fiscal year ended October 31, 2016 related to a certain asset classified as held for sale, an asset that was idled in 2016 and an impairment of a building that was sold in the second quarter of 2016. See Notes to the Consolidated Financial Statements, Note 4, for a discussion of the impairment charges recorded in fiscal 2016 and a discussion of the recoveries recorded in fiscal 2014. The Company continues to assess impairment to long-lived assets based on expected orders from the Company’s customers and current business conditions.
Intangible Assets. Intangible assets with definitive lives are amortized over their estimated useful lives. The Company amortizes its acquired intangible assets with definitive lives on a straight-line basis over periods ranging from three months to 15 years. See Note 11 to the consolidated financial statements for a description of the current intangible assets and their estimated amortization expense.
30
The Company performs analysis of indefinite-lived intangible assets which are included as a component of the annual impairment of long-lived assets. An impairment analysis of definite-lived intangible assets is performed when indicators of potential impairment exist.
Goodwill. Goodwill, which represents the excess cost over the fair value of the net assets of businesses acquired, was approximately $27,490 as of October 31, 2016, or 4.4% of its total assets, and $27,992 as of October 31, 2015, or 4.2% of its total assets.
In accordance with ASC 350, "Intangibles-Goodwill and Other," the Company assesses goodwill for impairment on an annual basis. Such assessment can be done on a qualitative or quantitative basis. To qualitatively assess the likelihood of goodwill being impaired, the Company considers the following factors at the reporting unit level: the excess of fair value over carrying value as of the last impairment test, the length of time since the last fair value measurement, the carrying value, market and industry metrics, actual performance compared to forecasted performance, and its current outlook on the business. If the qualitative assessment indicated it is more likely than not that goodwill is impaired, the Company will perform quantitative impairment testing at the reporting unit level.
If a quantitative fair value measurement is used, the fair value of goodwill is compared to its carrying value and an impairment charge is recorded if the carrying value exceeds the fair value.If the carrying value exceeds the fair value, then a possible impairment of goodwill may exist and further evaluation is required. Fair values are based on the cash flow projected in the strategic plans and long-range planning forecasts, discounted at a risk-adjusted rate of return. Revenue growth rates included in the plans are generally based on industry specific data and known awarded business. The projected profit margins assumptions included in the plans are based in the current cost structure and anticipated productivity improvements. If different assumptions were used in the plans, the related cash flows used in measuring fair value could be different and impairment of goodwill might be required to be recorded.
Group Insurance and Workers’ Compensation Accruals. The Company is primarily self-insured for group insurance and workers’ compensation claims in the United States and reviews these accruals on a monthly basis to adjust the balances as determined necessary. The Company is fully insured for workers' compensation at one of its locations. For the self insured plans, the Company reviews historical claims data and lag analysis as the primary indicators of the accruals.
Additionally, the Company reviews specific large insurance claims to determine whether there is a need for additional accrual on a case-by-case basis. Changes in the claim lag periods and the specific occurrences could materially impact the required accrual balance period-to-period. The Company carries excess insurance coverage for group insurance and workers’ compensation claims exceeding a range of $160-170 and $100-500 per plan year, respectively, dependent upon the location where the claim is incurred. At October 31, 2016, and 2015, the amount accrued for group insurance and workers’ compensation claims was $5,114 and $4,664, respectively. The self-insurance reserves established are a result of safety statistics, changes in employment levels, the number of open and active workers’ compensation cases, and group insurance plan design features.
Share-Based Payments. The Company records compensation expense for the fair value of nonvested stock option awards and restricted stock awards over the remaining vesting period. The Company has elected to use the simplified method to calculate the expected term of the stock options outstanding at five to six years and has utilized historical weighted average volatility. The Company determines the volatility and risk-free rate assumptions used in computing the fair value using the Black-Scholes option-pricing model, in consultation with an outside third party. The expected term for the restricted stock award is between three months and four years.
The Black-Scholes option valuation model requires the input of highly subjective assumptions, including the expected life of the stock-based award and stock price volatility. The assumptions used are management’s best estimates, but the estimates involve inherent uncertainties and the application of management judgment. As a result, if other assumptions had been used, the recorded stock-based compensation expense could have been materially different from that depicted in the financial statements. In addition, the Company determines a forfeiture rate at the time of grant. If actual forfeitures materially differ from the estimate, the share-based compensation expense could be materially different.
The restricted stock and restricted stock units are valued based upon a 20 day Exponential Moving Average ("EMA") as of the Friday prior to the grant of an award. In addition, the Company determines a forfeiture rate at the time of grant. Share-based compensation expense is adjusted when actual forfeitures occur.
U.S. Pension and Other Post-retirement Costs and Liabilities. The Company has recorded significant pension and other post-retirement benefit liabilities that are developed from actuarial valuations for its U.S. operations. The pension plans were frozen several years ago and therefore contributions are not allowed. The determination of the Company’s pension liabilities
31
requires key assumptions regarding discount rates used to determine the present value of future benefit payments and the expected return on plan assets. The discount rate is also significant to the development of other post-retirement liabilities. The Company determines these assumptions in consultation with, and after input from, its actuaries.
The discount rate reflects the estimated rate at which the pension and other post-retirement liabilities could be settled at the end of each fiscal year. For its U.S. operations, the Company uses the Principal Pension Discount Yield Curve ("Principal Curve") as the basis for determining the discount rate for reporting pension and retiree medical liabilities. The Principal Curve has several advantages to other methods, including: transparency of construction, lower statistical errors, and continuous forward rates for all years. At October 31, 2016, the resulting discount rate from the use of the Principal Curve was 3.70%, a decrease of 0.50% from a year earlier that contributed to an increase of the benefit obligation of approximately $51. A change of 25 basis points in the discount rate at October 31, 2016 would increase expense on an annual basis by approximately $10 or decrease expense on an annual basis by approximately $14.
The assumed long-term rate of return on pension assets is applied to the market value of plan assets to derive a reduction to pension expense that approximates the expected average rate of asset investment return over ten or more years. A decrease in the expected long-term rate of return will increase pension expense whereas an increase in the expected long-term rate will reduce pension expense. Decreases in the level of plan assets will serve to increase the amount of pension expense whereas increases in the level of actual plan assets will serve to decrease the amount of pension expense. Any shortfall in the actual return on plan assets from the expected return will increase pension expense in future years due to the amortization of the shortfall, whereas any excess in the actual return on plan assets from the expected return will reduce pension expense in future periods due to the amortization of the excess. A change of 25 basis points in the assumed rate of return on pension assets would increase or decrease pension assets by approximately $156.
The Company’s investment policy for assets of the plans is to maintain an allocation generally of 0% to 70% in equity securities, 0% to 70% in debt securities, and 0% to 10% in real estate. Equity security investments are structured to achieve an equal balance between growth and value stocks. The Company determines the annual rate of return on pension assets by first analyzing the composition of its asset portfolio. Historical rates of return are applied to the portfolio. The Company’s investment advisors and actuaries review this computed rate of return. Industry comparables and other outside guidance are also considered in the annual selection of the expected rates of return on pension assets.
For the year ended October 31, 2016, the actual return on pension plans’ assets for all of the Company’s plans approximated 3.12%, which is lower than the expected rate of return on plan assets of 7.50% used to derive pension expense. The long-term expected rate of return takes into account years with exceptional gains and years with exceptional losses.
Non-U.S. Pension. For the Company's Swedish operations, the majority of the pension obligations are covered by insurance policies with insurance companies. Pension commitments in the Company's Polish operations at October 31, 2016 were not material. The liability for these obligations comprise the present value of future obligations and is calculated on an actuarial basis.
Actual results that differ from these estimates may result in more or less future Company funding into the pension plans than is planned by management. Based on current market investment performance, historically the Company has conservatively contributed to the defined benefit plans and therefore contributions for fiscal 2017 are not required until second quarter of 2018, and that pension expense will increase in fiscal 2017.
Derivative Instruments and Hedging Activities. The Company records derivative instruments in the consolidated balance sheet as either an asset or liability and as a component of other comprehensive income and measured at fair value. Changes in derivative instruments' fair value are recognized currently in earnings, unless the derivative instrument has been designated as a cash flow hedge and specific cash flow hedge accounting criteria are met. Under the cash flow hedge accounting, unrealized gains and losses are reflected in stockholder's equity as accumulated other comprehensive income (AOCI) until the forecasted transaction occurs. If the cash flow hedge is deemed ineffective, the derivative's gains or losses are then recognized in the consolidated statement of income.
Foreign Currency Translation. Two of the Company's subsidiaries (Shiloh De Mexico S.A. DE C.V. and Shiloh International, S.A. DE C.V.), the Company's Netherlands and Swedish holding companies, and the Company's U.S. subsidiaries have the U.S. dollar as their functional currency. All of the Company's other direct and indirect subsidiaries use their respective local currency as their functional currency. The translation from the applicable foreign currencies to U.S. dollars is performed for balance sheet accounts using exchange rates in effect at the balance sheet date and for revenue and expense accounts using a weighted average exchange rate for the period. The resulting translation adjustments are recorded as a component of Other Comprehensive Income (Loss) ("OCI"). The Company engages in foreign currency denominated transactions with customers and
32
suppliers, as well as between subsidiaries with different functional currencies. Gains and losses resulting from foreign currency transactions are recognized in net income in the consolidated statements of income.
33
Off-Balance Sheet Arrangements
The Company does not have any off-balance sheet arrangements with unconsolidated entities or other persons.
Recent Accounting Pronouncements
Recently Issued Standards
In May 2014, the Financial Accounting Standards Board ("FASB") issued ASU 2014-09, "Revenue from Contracts with Customers," which clarifies existing accounting literature relating to how and when a company recognizes revenue. Under ASU 2014-09, a company will recognize revenue when it transfers promised goods or services to customers in an amount that reflects the consideration to which the company expects to be entitled in exchange for those goods and services. The FASB, through the issuance of ASU No. 2015-14, "Revenue from Contracts with Customers," approved a one year delay of the effective date and the new standard now is effective for reporting periods beginning after December 15, 2017 and permits two implementation approaches, one requiring retrospective application of the new standard with restatement of prior years and one requiring prospective application of the new standard with disclosure of results under old standards. During the second and third quarter, the FASB issued ASUs 2016-10, 2016-11 and 2016-12. ASUs 2016-10 and 2016-12 provide further clarification on the implementation guidance on principal versus agent considerations. ASU 2016-11 rescinds certain SEC guidance from the FASB ASC in response to announcements made by the SEC at the Emerging Issues Task Force's ("EITF") March 3, 2016 meeting. Finally, ASU 2016-20 makes minor corrections or minor improvements to the Codification that are not expected to have a significant effect on current accounting practice or create a significant administrative cost to most entities. The Company is planning a bottom up approach to analyze the standard's impact on its revenues by looking at historical policies and practices and identifying the differences from applying the new standard to its revenue stream. The Company has not selected a transition date or method nor has it determined the effect of the standard to its consolidated financial statements.
In August 2014, the FASB issued ASU 2014-15, "Presentation of Financial Statements—Going Concern (Subtopic 205-40): Disclosure of Uncertainties about an Entity’s Ability to Continue as a Going Concern," which the intent is to define the Company's responsibility to evaluate whether there is substantial doubt about an organization’s ability to continue as a going concern and to provide related footnote disclosures. This ASU will be effective for the Company November 1, 2017. The Company will prospectively apply the guidance to applicable transactions.
In April 2016, the FASB issued ASU No. 2016-10, "Revenue from Contracts with Customers (Topic 606): Identifying Performance Obligations and Licensing." ASU 2016-10 adds further guidance on identifying performance obligations and also to improve the operability and understandability of the licensing implementation guidance. ASU 2016-10 is effective for fiscal years beginning after December 15, 2017, including interim periods within those fiscal years, with early adoption permitted. The Company is currently evaluating the impact of the adoption of ASU 2016-15 on its consolidated financial statements.
In February 2016, the FASB issued ASU 2016-02, "Leases" which requires a lessee to recognize the assets and liabilities that arise from leases. A lessee should recognize in the statement of financial position a liability to make lease payments (the lease liability) and a right-of-use asset representing its right to use the underlying asset for the lease term. The recognition, measurement, and presentation of expenses and cash flows arising from a lease by a lessee have not significantly changed from the previous guidance within ASC Topic 840, Leases. For operating leases, a lessee is required to do the following: (1) recognize a right-of-use asset and a lease liability, initially measured at the present value of the lease payments, in the statement of financial position, (2) recognize a single lease cost, calculated so that the cost of the lease is allocated over the lease term on a generally straight-line basis and (3) classify all cash payments within operating activities in the statement of cash flows. For leases with a term of 12 months or less, a lessee is permitted to make an accounting policy election by class of underlying asset not to recognize lease assets and lease liabilities. If a lessee makes this election, it should recognize lease expense for such leases generally on a straight-line basis over the lease term. AUS 2016-02 is effective for public entities for fiscal years and interim periods within those years, beginning after December 15, 2018, with early adoption permitted. In transition, lessees and lessors are required to recognize and measure leases at the beginning of the earliest period presented using a modified retrospective approach, which includes a number of optional practical expedients that entities may elect to apply. The Company is currently evaluating the requirements of ASU 2016-02 and has not yet determined its impact on the Company's consolidated financial statements.
In January 2016, the FASB issued ASU 2016-01, "Recognition and Measurement of Financial Assets and Financial Liabilities." ASU 2016-01 to amend certain aspects of recognition, measurement, presentation, and disclosure of financial instruments. Most prominent among the amendments is the requirement for changes in the fair value of the Company's equity investments, with certain exceptions, to be recognized through net income rather than other comprehensive income ("OCI"). ASU 2016-01 is effective for financial statements issued for fiscal years beginning after December 15, 2017, and interim periods within those fiscal years. The application of the amendments will result in a cumulative-effect adjustment to our consolidated balance sheet as of the effective date. The Company is currently evaluating the impact that ASU 2016-01 will have on its statement of financial position or financial statement disclosures.
34
In July 2015, the FASB issued ASU 2015-11, "Inventory." ASU 2015-11 simplifies the measurement of inventory by requiring inventory to be measured at the lower of cost and net realizable value. ASU 2015-11 is effective for financial statements issued for fiscal years beginning after December 15, 2016, and interim periods within those fiscal years. The Company does not expect ASU 2015-11 will have a material impact on its statement of financial position or financial statement disclosures.
In April 2015, the FASB issued ASU 2015-03, "Interest - Imputation of Interest." ASU 2015-03 requires that debt issuance costs related to a recognized debt liability be presented in the balance sheet as a direct deduction from the carrying amount of that debt liability. The recognition and measurement guidance for debt issuance costs are not affected by the amendments in the ASU. ASU 2015-03 is effective for financial statements issued for fiscal years beginning after December 15, 2015, and interim periods within those fiscal years. The Company does not expect ASU 2015-03 will have a material impact on its statement of financial position or financial statement disclosures.
Recently Adopted Standards
In November 2015, the FASB issued ASU 2015-17, "Balance Sheet Classification of Deferred Taxes." ASU 2015-17 requires that deferred tax liabilities and assets be classified as noncurrent in a classified statement of financial position. ASU 2015-17 is effective for financial statements issued for fiscal years beginning after December 15, 2016, and interim periods within those fiscal years, although early adoption is permitted, including adoption in an interim period. This guidance simplified the current guidance, which required entities to separately present deferred tax assets and liabilities as current and noncurrent on the balance sheet. The Company has elected to early adopt this standard prospectively as of October 31, 2016, as is permitted under the standard. Due to the prospective treatment, prior periods presented in these financial statements have not been adjusted.
In March 2016, FASB issued ASU 2016-09, "Compensation - Stock Compensation." ASU 2016-09 simplified the accounting for share-based payment transactions. This guidance required that excess tax benefits and tax deficiencies be recognized as income tax expense or benefit in the consolidated statements of income rather than additional paid-in capital. Additionally, the excess tax benefits will be classified along with other income tax cash flows as an operating activity, rather than a financing activity, on the statement of cash flows. Further, the update allows an entity to make a policy election to recognize forfeitures as they occur or estimate the number of awards expected to be forfeited. The Company has elected to early adopt this standard prospectively, with certain cumulative effect adjustments if applicable, as of October 31, 2016, as is permitted under the standard. There were no unrecognized excess tax benefits that are required to be recorded on a modified retrospective basis through a cumulative effect adjustment to retained earnings upon adoption. The Company has also elected to continue to recognize forfeitures as they occur.
Effect of Inflation, Deflation
Inflation generally affects the Company by increasing the interest expense of floating rate indebtedness and by increasing the cost of labor, equipment and raw materials. The level of inflation has not had a material effect on the Company's consolidated financial results for the past three years.
In periods of decreasing prices, deflation occurs and may also affect the Company's results of operations. With respect to steel purchases, the Company's purchases of steel through customers' steel buying programs protects recovery of the cost of steel through the selling price of the Company's products. For non-steel buying programs, the Company aligns the cost of steel purchases with the related selling price of the product. For the Company's aluminum and magnesium die casting business, the cost of the materials is handled in one of two ways. The primary method is to secure quarterly purchase commitments based on customer releases and then pass the quarterly price changes to those customers utilizing published metal indexes. The second method is to adjust prices monthly, based on a referenced metal index plus additional material cost spreads agreed to by the Company and its customers.
FORWARD-LOOKING STATEMENTS
Certain statements made by Shiloh in this Annual Report on Form 10-K regarding the Company's operating performance, events or developments that the Company believes or expects to occur in the future, including those that discuss strategies, goals,
35
outlook or other non-historical matters, or which relate to future sales, earnings expectations, cost savings, awarded sales, volume growth, earnings or general belief in the Company's expectations of future operating results are "forward-looking" statements within the meaning of the Private Securities Litigation Reform Act of 1995.
The forward-looking statements are made on the basis of management's assumptions and expectations. As a result, there can be no guarantee or assurance that these assumptions and expectations will in fact occur. The forward-looking statements are subject to risks and uncertainties that may cause actual results to materially differ from those contained in the statements.
Listed below are some of the factors that could potentially cause actual results to differ materially from expected future results. Other factors besides those listed here could also materially affect the Company’s business.
• | The impact on historical financial statements of any known or unknown accounting errors or irregularities; and the magnitude of any adjustments in restated financial statements of the Company’s operating results: |
• | The Company's ability to accomplish its strategic objectives. |
• | The Company's ability to obtain future sales. |
• | Changes in worldwide economic and political conditions, including adverse effects from terrorism or related hostilities. |
• | Costs related to legal and administrative matters. |
• | The Company's ability to realize cost savings expected to offset price concessions. |
• | The Company's ability to successfully integrate acquired businesses, including businesses located outside of the United States. Risks associated with doing business internationally, including economic, political and social instability, foreign currency exposure and the lack of acceptance of its products. |
• | Inefficiencies related to production and product launches that are greater than anticipated; changes in technology and technological risks. |
• | Work stoppages and strikes at the Company's facilities and that of the Company's customers or suppliers. |
• | The Company's dependence on the automotive and heavy truck industries, which are highly cyclical. |
• | The dependence of the automotive industry on consumer spending, which is subject to the impact of domestic and international economic conditions affecting car and light truck production. |
• | Regulations and policies regarding international trade. |
• | Financial and business downturns of the Company's customers or vendors, including any production cutbacks or bankruptcies. Increases in the price of, or limitations on the availability of, steel, aluminum or magnesium, the Company's primary raw materials, or decreases in the price of scrap steel. |
• | The successful launch and consumer acceptance of new vehicles for which the Company supplies parts. |
• | The occurrence of any event or condition that may be deemed a material adverse effect under the Company’s outstanding indebtedness or a decrease in customer demand which could cause a covenant default under the Company’s outstanding indebtedness. |
• | Pension plan funding requirements. |
See "Item 1A. Risk Factors" in this Annual Report on Form 10-K for a more complete discussion of these risks and uncertainties. Any or all of these risks and uncertainties could cause actual results to differ materially from those reflected in the forward-looking statements. These forward-looking statements reflect management's analysis only as of the date of filing this Annual Report on Form 10-K.
The Company undertakes no obligation to publicly revise these forward-looking statements to reflect events or circumstances that arise after the date of filing this Annual Report on Form 10-K. In addition to the disclosures contained herein, readers should carefully review risks and uncertainties contained in other documents the Company files from time to time with the SEC.
36
Item 7A. Qualitative and Quantitative Market Risk Discussion (Dollar amounts in thousands)
Market risk is the potential loss arising from adverse changes in market rates and prices. The Company is exposed to market risk throughout the normal course of its business operations due to its purchases of metals, its sales of scrap steel, its ongoing investing and financing activities, and its exposure to foreign currency exchange rates. As such, the Company has established policies and procedures to govern its management of market risks.
Commodity Pricing Risk
Steel is the primary raw material used by the Company and a majority of the purchased steel is acquired through various OEM steel buying programs. Buying through the customer steel buying programs mitigates the impact of price fluctuations associated with the procurement of steel. The remainder of its steel purchasing requirements is met through contracts with various steel suppliers. At times, the Company may be unable to either avoid increases in steel prices or pass through any price increases to its customers. The Company refers to the "net steel impact" as the combination of the change in steel prices that are reflected in the price of its products, the change in the cost to procure steel from the steel sources, and the change in the Company's recovery of offal. The Company's strategy is to be economically neutral to steel pricing by having these factors offset each other. Although the Company strives to achieve a neutral net steel impact, the Company may not always be successful in achieving that goal, in part due to timing difference. The timing of a change in the price of steel may occur in different periods and if a change occurs, that change may have a disproportionate effect, within any fiscal period, on the Company's product pricing. Depending upon when a steel price change or offal price change occurs, that change may have a disproportionate effect, within any particular fiscal period, on its product pricing, its steel costs and the results of its sales of offal. Net imbalances in any one particular fiscal period may be reversed in a subsequent fiscal period, although the Company cannot provide assurances that, or when, these reversals will occur. Over the past year, the Company has been impacted by the price recovered on the sale of its offal due to the significant reduction in the North American scrap metal market pricing.
Interest Rate Risk
At October 31, 2016, the Company had total debt, excluding capital leases, of $254,557, consisting of a revolving line of credit under the Credit Agreement of floating rate debt of $252,900 (99.3%) and fixed rate debt of $1,657 (0.7%). Assuming no changes in the monthly average revolver debt levels of $273,296 for the year ended October 31, 2016, the Company estimates that a hypothetical change of 100 basis points in the LIBOR and base rate would impact on interest expense by approximately $2,529 in additional expense.
During 2014, the Company entered into an interest rate swap with an aggregate notional amount of $75,000 designated as a cash flow hedge to manage interest rate exposure on the Company’s floating rate LIBOR based debt under the Credit Agreement. The first base notional amount, $25,000, commenced on March 1, 2015, the second base notional amount, $25,000, commenced on September 1, 2015 and the final notional amount, $25,000, commenced on March 1, 2016. The Company recognized $1,530 of interest expense related to the interest rate swap for the year ended October 31, 2016.
The following table discloses the fair value and balance sheet location of the Company's derivative instrument:
Liability Derivatives | ||||
Balance Sheet | October 31, | October 31, | ||
Location | 2016 | 2015 | ||
Derivatives Designated as Cash Flow Hedging Instruments: | ||||
Interest rate swap contracts | Liabilities | $(5,036) | $(4,989) | |
The following table discloses the effect of the Company's derivative instrument on the consolidated statement of income and consolidated statement of comprehensive income (loss) for the fiscal year ended October 31, 2016:
Amount of Gain (Loss) Recognized in OCI on Derivatives (Effective Portion) | Location of Gain (Loss) Reclassified from AOCI into Income (Effective Portion) | Amount of Gain (Loss) Reclassified from AOCI into Income (Effective Portion) | |||
Derivatives Designated as Hedging Instruments: | |||||
Interest rate swap contracts | $64 | Interest expense | $1,530 | ||
37
The following table discloses the effect of the Company's derivative instrument on the consolidated statement of income and consolidated statement of comprehensive loss for the year ended October 31, 2015:
Amount of Gain (Loss) Recognized in OCI on Derivatives (Effective Portion) | Location of Gain (Loss) Reclassified from AOCI into Income (Effective Portion) | Amount of Gain (Loss) Reclassified from AOCI into Income (Effective Portion) | |||
Derivatives Designated as Hedging Instruments: | |||||
Interest rate swap contracts | $(1,618) | Interest expense | $433 | ||
Currency Exchange Rate Risk
The translated values of revenue and expense from the Company’s international operations are subject to fluctuations due to changes in currency exchange rates. Consequently, the Company's results of operations may be affected by exposure to changes in foreign currency exchange rates and economic conditions in the regions in which it sells or distributes products.
The Company derived 83.3% of its sales in the United States and 16.7% internationally. Of these international sales, no single foreign currency represented more than 10% of sales. To minimize foreign currency risk, the Company generally maintains natural hedges within its non-U.S. activities, including the efficient alignment of transaction settlements in the same currency and near term accounting cycles.
In addition, to the transaction-related gains and losses that are reflected within the results of operations, the Company is subject to foreign currency translation risk, as the financial statements for its subsidiaries are measured and recorded in the respective subsidiary's functional currency and translated into U.S. dollars for consolidated financial reporting purposes. The resulting translation adjustments are recorded net of tax impact in the consolidated statement of other comprehensive loss.
Inflation
Although the Company has not experienced a material inflationary impact, the potential for a rise in inflationary pressures could impact certain commodities, such as steel, aluminum and magnesium. Additionally, because the Company purchases various types of equipment, raw materials, and component parts from its suppliers, they may be adversely impacted by their inability to adequately mitigate inflationary, industry, or economic pressures. The overall condition of its supply base may possibly lead to delivery delays, production issues, or delivery of non-conforming products by its suppliers in the future. As such, the Company continues to monitor its vendor base for the best sources of supply and the Company continues to work with those vendors and customers to mitigate the impact of inflationary pressures.
38
Item 8. | Consolidated Financial Statements and Supplementary Data. |
INDEX TO FINANCIAL STATEMENTS | ||||
Consolidated Statements of Stockholders' Equity for the years ended October 31, 2016, 2015, and 2014 | ||||
39
REPORT OF INDEPENDENT REGISTERED PUBLIC ACCOUNTING FIRM
Board of Directors and Shareholders
Shiloh Industries, Inc.
We have audited the accompanying consolidated balance sheets of Shiloh Industries, Inc. (a Delaware corporation) and subsidiaries (the “Company”) as of October 31 2016 and 2015, and the related consolidated statements of income, comprehensive income (loss), changes in stockholders’ equity, and cash flows for each of the three years in the period ended October 31, 2016. Our audits of the basic consolidated financial statements included the financial statement schedule listed in the index appearing under Item 15(a)(2). These financial statements and financial statement schedule are the responsibility of the Company’s management. Our responsibility is to express an opinion on these financial statements and financial statement schedule based on our audits.
We conducted our audits in accordance with the standards of the Public Company Accounting Oversight Board (United States). Those standards require that we plan and perform the audit to obtain reasonable assurance about whether the financial statements are free of material misstatement. An audit includes examining, on a test basis, evidence supporting the amounts and disclosures in the financial statements. An audit also includes assessing the accounting principles used and significant estimates made by management, as well as evaluating the overall financial statement presentation. We believe that our audits provide a reasonable basis for our opinion.
In our opinion, the consolidated financial statements referred to above present fairly, in all material respects, the financial position of Shiloh Industries, Inc. and subsidiaries as of October 31, 2016 and 2015, and the results of their operations and their cash flows for each of the three years in the period ended October 31, 2016, in conformity with accounting principles generally accepted in the United States of America. Also in our opinion, the related financial statement schedule, when considered in relation to the basic consolidated financial statements taken as a whole, presents fairly, in all material respects, the information set forth therein.
We also have audited, in accordance with the standards of the Public Company Accounting Oversight Board (United States), the Company’s internal control over financial reporting as of October 31, 2016, based on criteria established in the 2013 Internal Control-Integrated Framework issued by the Committee of Sponsoring Organizations of the Treadway Commission (COSO), and our report dated January 17, 2017 expressed an adverse opinion thereon.
/s/GRANT THORNTON LLP
Cleveland, Ohio
January 17, 2017
40
SHILOH INDUSTRIES, INC.
CONSOLIDATED BALANCE SHEETS
(Dollar amounts in thousands)
October 31, | ||||||||
2016 | 2015 | |||||||
ASSETS: | ||||||||
Cash and cash equivalents | $ | 8,696 | $ | 13,100 | ||||
Investment in marketable securities | 174 | 356 | ||||||
Accounts receivable, net | 183,862 | 194,155 | ||||||
Related-party accounts receivable | 1,235 | 1,092 | ||||||
Prepaid income taxes | 1,653 | 4,515 | ||||||
Inventories, net | 60,547 | 57,868 | ||||||
Deferred income taxes | — | 2,837 | ||||||
Prepaid expenses and other assets | 36,986 | 45,706 | ||||||
Total current assets | 293,153 | 319,629 | ||||||
Property, plant and equipment, net | 265,837 | 279,223 | ||||||
Goodwill | 27,490 | 27,992 | ||||||
Intangible assets, net | 17,279 | 19,543 | ||||||
Deferred income taxes | 9,974 | 2,958 | ||||||
Other assets | 12,696 | 11,509 | ||||||
Total assets | $ | 626,429 | $ | 660,854 | ||||
LIABILITIES AND STOCKHOLDERS’ EQUITY: | ||||||||
Current debt | $ | 2,023 | $ | 2,080 | ||||
Accounts payable | 158,514 | 161,123 | ||||||
Other accrued expenses | 40,824 | 34,459 | ||||||
Accrued income taxes | 1,686 | — | ||||||
Total current liabilities | 203,047 | 197,662 | ||||||
Long-term debt | 256,922 | 298,873 | ||||||
Long-term benefit liabilities | 23,312 | 17,376 | ||||||
Deferred income taxes | 4,734 | 6,180 | ||||||
Interest rate swap agreement | 5,036 | 4,989 | ||||||
Other liabilities | 588 | 1,312 | ||||||
Total liabilities | 493,639 | 526,392 | ||||||
Commitments and contingencies | ||||||||
Stockholders’ equity: | ||||||||
Preferred stock, $.01 per share; 5,000,000 shares authorized; no shares issued and outstanding at October 31, 2016 and October 31, 2015, respectively | — | — | ||||||
Common stock, par value $.01 per share; 50,000,000 and 25,000,000 shares authorized at October 31, 2016 and October 31, 2015, respectively; 17,614,057 and 17,309,623 shares issued and outstanding at October 31, 2016 and October 31, 2015, respectively | 176 | 173 | ||||||
Paid-in capital | 70,403 | 69,334 | ||||||
Retained earnings | 118,673 | 115,004 | ||||||
Accumulated other comprehensive loss, net | (56,462 | ) | (50,049 | ) | ||||
Total stockholders’ equity | 132,790 | 134,462 | ||||||
Total liabilities and stockholders’ equity | $ | 626,429 | $ | 660,854 | ||||
The accompanying notes are an integral part of these consolidated financial statements.
41
SHILOH INDUSTRIES, INC.
CONSOLIDATED STATEMENTS OF INCOME
(Amounts in thousands, except per share data)
Years Ended October 31, | ||||||||||||
2016 | 2015 | 2014 | ||||||||||
Net revenues | $ | 1,065,834 | $ | 1,073,052 | $ | 832,067 | ||||||
Cost of sales | 969,658 | 986,865 | 755,755 | |||||||||
Gross profit | 96,176 | 86,187 | 76,312 | |||||||||
Selling, general and administrative expenses | 73,417 | 63,028 | 50,236 | |||||||||
Amortization of intangible assets | 2,258 | 2,295 | 2,164 | |||||||||
Asset impairment (recovery), net | 2,031 | — | (4,026 | ) | ||||||||
Operating income | 18,470 | 20,864 | 27,938 | |||||||||
Interest expense | 18,086 | 9,898 | 4,415 | |||||||||
Interest income | (23 | ) | (36 | ) | (25 | ) | ||||||
Other (income) expense, net | 1,890 | 387 | (504 | ) | ||||||||
Income (loss) before income taxes | (1,483 | ) | 10,615 | 24,052 | ||||||||
Provision (benefit) for income taxes | (5,152 | ) | 4,710 | 4,137 | ||||||||
Net income | $ | 3,669 | $ | 5,905 | $ | 19,915 | ||||||
Earnings per share: | ||||||||||||
Basic earnings per share | $ | 0.21 | $ | 0.34 | $ | 1.16 | ||||||
Basic weighted average number of common shares | 17,513 | 17,287 | 17,145 | |||||||||
Diluted earnings per share | $ | 0.21 | $ | 0.34 | $ | 1.16 | ||||||
Diluted weighted average number of common shares | 17,526 | 17,310 | 17,215 | |||||||||
The accompanying notes are an integral part of these consolidated financial statements.
42
SHILOH INDUSTRIES, INC.
CONSOLIDATED STATEMENTS OF COMPREHENSIVE INCOME (LOSS)
(Dollar amounts in thousands)
Years Ended October 31, | |||||||||||||||
2016 | 2015 | 2014 | |||||||||||||
Net income | $ | 3,669 | $ | 5,905 | $ | 19,915 | |||||||||
Other comprehensive income (loss): | |||||||||||||||
Defined benefit pension plans & other postretirement benefits | |||||||||||||||
Amortization of net actuarial loss | 1,251 | 1,214 | 1,115 | ||||||||||||
Actuarial net gain (loss) | (5,081 | ) | 743 | (4,113 | ) | ||||||||||
Asset net gain (loss) | (3,006 | ) | (3,008 | ) | 926 | ||||||||||
Income tax benefit (provision) | 2,986 | (387 | ) | 783 | |||||||||||
Total defined benefit pension plans & other post retirement benefits, net of tax | (3,850 | ) | (1,438 | ) | (1,289 | ) | |||||||||
Marketable securities | |||||||||||||||
Unrealized gain (loss) on marketable securities | (183 | ) | (689 | ) | 518 | ||||||||||
Income tax benefit (provision) | 58 | 248 | (53 | ) | |||||||||||
Reclassification adjustments for gain on marketable securities included in net income | — | — | (365 | ) | |||||||||||
Total marketable securities, net of tax | (125 | ) | (441 | ) | 100 | ||||||||||
Derivatives and hedging | |||||||||||||||
Unrealized loss on interest rate swap agreements | (1,577 | ) | (2,912 | ) | (2,510 | ) | |||||||||
Income tax benefit | 111 | 861 | 952 | ||||||||||||
Reclassification adjustments for settlement of derivatives included in net income | 1,530 | 433 | — | ||||||||||||
Change in fair value of derivative instruments, net of tax | 64 | (1,618 | ) | (1,558 | ) | ||||||||||
Foreign currency translation adjustments: | |||||||||||||||
Foreign currency translation loss | (3,032 | ) | (9,671 | ) | (8,052 | ) | |||||||||
Reclassification adjustments for settlement of foreign currency included in net income | 530 | — | — | ||||||||||||
Unrealized loss on foreign currency translation, net of tax | (2,502 | ) | (9,671 | ) | (8,052 | ) | |||||||||
Comprehensive income (loss), net | $ | (2,744 | ) | $ | (7,263 | ) | $ | 9,116 | |||||||
The accompanying notes are an integral part of these consolidated financial statements.
43
SHILOH INDUSTRIES, INC.
CONSOLIDATED STATEMENTS OF CASH FLOWS
(Dollar amounts in thousands)
Years Ended October 31, | |||||||||||
2016 | 2015 | 2014 | |||||||||
CASH FLOWS FROM OPERATING ACTIVITIES: | |||||||||||
Net income | $ | 3,669 | $ | 5,905 | $ | 19,915 | |||||
Adjustments to reconcile net income to net cash provided by operating activities: | |||||||||||
Depreciation and amortization | 37,645 | 34,267 | 27,839 | ||||||||
Amortization of deferred financing costs | 2,505 | 992 | 807 | ||||||||
Asset impairment (recoveries), net | 2,031 | — | (4,026 | ) | |||||||
Deferred income taxes | (2,704 | ) | 4,263 | 837 | |||||||
Stock-based compensation expense | 1,072 | 1,025 | 579 | ||||||||
(Gain) loss on sale of assets | (55 | ) | 274 | (806 | ) | ||||||
Gain on sale of marketable securities | — | — | (365 | ) | |||||||
Changes in operating assets and liabilities: | |||||||||||
Accounts receivable, net | 10,975 | (27,607 | ) | (10,273 | ) | ||||||
Inventories, net | (2,408 | ) | 358 | 4,734 | |||||||
Prepaids and other assets | 14,476 | (8,665 | ) | (8,270 | ) | ||||||
Payables and other liabilities | (1,843 | ) | (5,923 | ) | 3,573 | ||||||
Accrued income taxes | 3,998 | (1,516 | ) | (5,526 | ) | ||||||
Net cash provided by operating activities | 69,361 | 3,373 | 29,018 | ||||||||
CASH FLOWS FROM INVESTING ACTIVITIES: | |||||||||||
Capital expenditures | (28,324 | ) | (39,376 | ) | (39,593 | ) | |||||
Investment in marketable securities | — | — | (2,000 | ) | |||||||
Investment in joint venture | (1,500 | ) | — | — | |||||||
Acquisitions, net of cash acquired | — | 195 | (124,544 | ) | |||||||
Proceeds from sale of assets | 1,508 | 11,480 | 5,762 | ||||||||
Proceeds from sale of marketable securities | — | — | 967 | ||||||||
Net cash used for investing activities | (28,316 | ) | (27,701 | ) | (159,408 | ) | |||||
CASH FLOWS FROM FINANCING ACTIVITIES: | |||||||||||
Payment of capital leases | (860 | ) | (821 | ) | (382 | ) | |||||
Proceeds from long-term borrowings | 145,400 | 153,900 | 182,500 | ||||||||
Repayments of long-term borrowings | (186,301 | ) | (121,589 | ) | (39,877 | ) | |||||
Payment of deferred financing costs | (1,785 | ) | (5,529 | ) | (776 | ) | |||||
Proceeds from exercise of stock options | — | 159 | 1,061 | ||||||||
Net cash (used for) provided by financing activities | (43,546 | ) | 26,120 | 142,526 | |||||||
Effect of foreign currency exchange rate fluctuations on cash | (1,903 | ) | (706 | ) | (520 | ) | |||||
Net increase (decrease) in cash and cash equivalents | (4,404 | ) | 1,086 | 11,616 | |||||||
Cash and cash equivalents at beginning of period | 13,100 | 12,014 | 398 | ||||||||
Cash and cash equivalents at end of period | $ | 8,696 | $ | 13,100 | $ | 12,014 | |||||
Supplemental Cash Flow Information: | |||||||||||
Cash paid for interest | $ | 15,801 | $ | 9,373 | $ | 3,862 | |||||
Cash paid for (refund of) income taxes | $ | (5,855 | ) | $ | 1,770 | $ | 7,995 | ||||
Non-cash Activities: | |||||||||||
Equipment acquired under capital lease | $ | — | $ | — | $ | 7,639 | |||||
Capital equipment included in accounts payable | $ | 5,604 | $ | 4,225 | $ | 5,415 | |||||
The accompanying notes are an integral part of these consolidated financial statements.
44
SHILOH INDUSTRIES, INC.
CONSOLIDATED STATEMENTS OF STOCKHOLDERS' EQUITY
(Dollar amounts in thousands)
Common Stock ($.01 Par Value) | Paid-In Capital | Retained Earnings | Accumulated Other Comprehensive Loss | Total Stockholders' Equity | |||||||||||||||
October 31, 2013 | $ | 170 | $ | 66,312 | $ | 89,184 | $ | (26,082 | ) | $ | 129,584 | ||||||||
Net income | — | — | 19,915 | — | 19,915 | ||||||||||||||
Other comprehensive loss, net of tax | — | — | — | (10,799 | ) | (10,799 | ) | ||||||||||||
Restricted stock and exercise of stock options | 2 | 1,059 | — | — | 1,061 | ||||||||||||||
Stock-based compensation cost | — | 579 | — | — | 579 | ||||||||||||||
Income tax effect on stock compensation | — | 85 | — | — | $ | 85 | |||||||||||||
October 31, 2014 | $ | 172 | $ | 68,035 | $ | 109,099 | $ | (36,881 | ) | $ | 140,425 | ||||||||
Net income | — | — | 5,905 | — | 5,905 | ||||||||||||||
Other comprehensive loss, net of tax | — | — | — | (13,168 | ) | (13,168 | ) | ||||||||||||
Restricted stock and exercise of stock options | 1 | 158 | — | — | 159 | ||||||||||||||
Stock-based compensation cost | — | 1,025 | — | — | 1,025 | ||||||||||||||
Income tax effect on stock compensation | — | 116 | — | — | 116 | ||||||||||||||
October 31, 2015 | $ | 173 | $ | 69,334 | $ | 115,004 | $ | (50,049 | ) | $ | 134,462 | ||||||||
Net income | — | — | 3,669 | — | 3,669 | ||||||||||||||
Other comprehensive loss, net of tax | — | — | — | (6,413 | ) | (6,413 | ) | ||||||||||||
Restricted stock and exercise of stock options | 3 | (3 | ) | — | — | — | |||||||||||||
Stock-based compensation cost | — | 1,072 | — | — | 1,072 | ||||||||||||||
October 31, 2016 | $ | 176 | $ | 70,403 | $ | 118,673 | $ | (56,462 | ) | $ | 132,790 | ||||||||
The accompanying notes are an integral part of these consolidated financial statements.
45
SHILOH INDUSTRIES, INC.
NOTES TO CONSOLIDATED FINANCIAL STATEMENTS
(Dollar amounts in thousands, except number of shares and per share data)
Note 1—Summary of Significant Accounting Policies
General
The Company is a leading global supplier of lightweighting, noise and vibration solutions to the automotive, commercial vehicle and industrial markets, capable of delivering solutions in aluminum, magnesium, steel and high-strength steel alloys to automotive, commercial vehicle and industrial markets. The Company offers one of the broadest portfolio of lightweighting solutions to the automotive, commercial vehicle and industrial markets, capable of delivering solutions in aluminum, magnesium, steel and steel alloys. Shiloh delivers these solutions through the design and manufacturing of its BlankLight®, CastLight™ and StampLight™ brands. Shiloh delivers solutions in body, chassis and powertrain systems to original equipment manufacturers ("OEMs") and several "Tier 1" suppliers to the OEMs. The Company has twenty-eight wholly-owned subsidiaries at locations in Asia, Europe and North America as well as a 55% ownership of a joint venture in China with minimal operating activity for the fiscal year ended October 31, 2016.
MTD Holdings Inc. (the parent of MTD Products Inc.) and the MTD Products Inc. Master Employee Benefit Trust, a trust fund established and sponsored by MTD Products Inc. owned approximately 47.2% of the Company's outstanding shares of Common Stock as of October 31, 2016, making MTD Holdings Inc. and MTD Products Inc. related parties of the Company.
Principles of Consolidation
The consolidated financial statements include the accounts of Shiloh Industries, Inc. and all wholly-owned subsidiaries. All significant intercompany transactions have been eliminated.
Revenue Recognition
The Company recognizes revenue from the sales of products when there is evidence of a sales agreement, the delivery of goods has occurred, the sales price is fixed or determinable and collectability of revenue is reasonably assured. The Company records revenues upon shipment of product to customers and transfer of title under standard commercial terms. Price adjustments, including those arising from resolution of quality issues, price and quantity discrepancies, surcharges for fuel and/or steel and other commercial issues, are recognized in the period when management believes that such amounts become probable, based on management’s estimates. The Company enters into tooling contracts with customers in the development of tooling to be sold to such customers. The Company primarily records tooling revenues and costs net in cost of sales at the time of completion and final billing to the customer. These billings are recorded as progress billings (a reduction of the associated tooling costs) until the appropriate revenue recognition criteria have been met. The tooling contracts are separate arrangements between the Company and customer and are recorded on a gross or net basis in accordance with current applicable revenue recognition accounting literature.
Allowance for Doubtful Accounts
The Company evaluates the collectability of accounts receivable based on several factors. In circumstances where the Company is aware of a specific customer’s inability to meet its financial obligations, a specific allowance for doubtful accounts is recorded against amounts due to reduce the net recognized receivable to the amount the Company reasonably believes will be collected. Additionally, a general allowance for doubtful accounts is estimated based on historical experience of write-offs and the current financial condition of customers. The financial condition of the Company’s customers is dependent on, among other things, the general economic environment, which may substantially change, thereby affecting the recoverability of amounts due to the Company from its customers.
The Company carefully assesses its risk with each of its customers and considers compliance with terms and conditions, aging of the customer accounts, intelligence learned through contact with customer representatives and its right of offset of net account receivable / account payable position with customers, if applicable, in establishing the allowance.
Shipping and Handling Costs
The Company classifies all amounts billed to a customer in a sales transaction related to shipping and handling as revenue and the costs incurred by the Company for shipping and handling are classified as costs of sales.
Inventories
46
SHILOH INDUSTRIES, INC.
NOTES TO CONSOLIDATED FINANCIAL STATEMENTS-(Continued)
Inventories are valued at the lower of cost or market, using the first-in first-out ("FIFO") method.
Pre-production and development costs
The Company enters into contractual agreements with certain customers to develop tooling. All such tooling contracts relate to parts that the Company will supply to customers under supply agreements. Tooling costs are capitalized in prepaid expenses and other assets determined by the fact that tooling contracts are separate from standard production contracts. The classification in prepaid or other assets is based upon the period of reimbursement from customer as either current or non-current.
Property, Plant and Equipment
Property, plant and equipment are stated at cost or at fair market value for plant, property and equipment acquired through acquisitions. Expenditures for maintenance, repairs and renewals are charged to expense as incurred, while major improvements are capitalized. The cost of these improvements is depreciated over their estimated useful lives. Useful lives range from three to twelve years for furniture and fixtures and machinery and equipment, or if the assets are dedicated to a customer program, over the estimated life of that program, ten to twenty years for land improvements and twenty to forty years for buildings and their related improvements. Depreciation is computed using the straight-line method for financial reporting purposes and accelerated methods for income tax purposes. When assets are retired or otherwise disposed, the related cost and accumulated depreciation are removed from the accounts, and any gain or loss on the disposition is included in the earnings for the current period.
Employee Benefit Plans
The Company accrues the cost of U.S. defined benefit pension plans, which are frozen, in accordance with Statement of FASB ASC Topic 715 "Compensation - Retirement Benefits." The plans are funded based on the requirements and limitations of the Employee Retirement Income Security Act of 1974. As of October 31, 2016, approximately 95% of its US employees of the Company participated in discretionary profit sharing plans administered by the Company. The Company also provides postretirement benefits to 15 former employees.
For the Company's Swedish operations, the majority of the pension obligations are covered by insurance policies with insurance companies. Pension commitments in the Company's Polish operations at October 31, 2016 were not material. The liability of these comprise the present value of future obligations and is calculated on an actuarial basis.
Share-Based Compensation
The Company records compensation expense for the fair value of nonvested stock option awards, restricted stock awards and restricted stock units over the remaining vesting period. The Company has elected to use the simplified method to calculate the expected term of the stock options outstanding at five to six years and has utilized historical weighted average volatility. The Company determines the volatility and risk-free rate assumptions used in computing the fair value using the Black-Scholes option-pricing model, in consultation with an outside third party. The expected term for the restricted stock award is between three months and four years.
The Black-Scholes option valuation model requires the input of highly subjective assumptions, including the expected life of the stock-based award and stock price volatility. The assumptions used are management’s best estimates, but the estimates involve inherent uncertainties and the application of management judgment. As a result, if other assumptions had been used, the recorded stock-based compensation expense could have been materially different from that depicted in the financial statements. In addition, the Company determines a forfeiture rate at the time of grant. If actual forfeitures materially differ from the estimate, the share-based compensation expense could be materially different.
The restricted stock and restricted stock units are valued based upon a 20 day EMA as of the Friday prior to the grant of an award. In addition, the Company determines a forfeiture rate at the time of grant. Share-based compensation expense is adjusted when actual forfeitures occur.
Income Taxes
47
SHILOH INDUSTRIES, INC.
NOTES TO CONSOLIDATED FINANCIAL STATEMENTS-(Continued)
The Company utilizes the asset and liability method in accounting for income taxes. Income tax expense includes U.S. and foreign income taxes minus tax credits and other incentives that will reduce tax expense in the year they are claimed. Deferred taxes are recognized at currently enacted tax rates for temporary differences between the financial accounting and income tax basis of assets and liabilities and operating losses and tax credit carryforwards. Valuation allowances are recorded to reduce net deferred tax assets to the amount that is more likely than not to be realized. The Company assesses both positive and negative evidence when measuring the need for a valuation allowance. Evidence typically assessed includes the operating results for the most recent three-year period and expectations of future profitability, available tax planning strategies, the time period over which the temporary differences will reverse and taxable income in prior carryback years if carryback is permitted under the tax law. The calculation of the Company's tax liabilities also involves dealing with uncertainties in the application of complex tax laws and regulations in a multitude of jurisdictions across our global operations. The Company recognizes liabilities for uncertain income tax positions based on the Company's estimate of whether, and the extent to which, additional taxes will be required. The Company reports interest and penalties related to uncertain income tax positions as income taxes. U.S. income taxes and foreign withholding taxes are not provided on undistributed earnings of foreign subsidiaries because it is expected such earnings will be permanently reinvested in the operations of such subsidiaries or to pay down third party European debt.
Impairment of Long-Lived and Intangible Assets
The Company evaluates the recoverability of long-lived assets and the related estimated remaining lives whenever events or changes in circumstances indicate that the carrying value may not be recoverable. Events or changes in circumstances that could cause an impairment include significant underperformance relative to the historical or projected future operating results, significant changes in the manner of the use of the assets or the strategy for the overall business or significant negative industry or economic trends. The Company records an impairment or change in useful life whenever events or changes in circumstances indicate that the carrying amount of long-lived assets may not be recoverable or the useful life has changed.
Goodwill. Goodwill, which represents the excess cost over the fair value of the net assets of businesses acquired, was $27,490 as of October 31, 2016, or 4.4% of its total assets, and $27,992 as of October 31, 2015, or 4.2% of its total assets.
In accordance with ASC 350, "Intangibles-Goodwill and Other," the Company assesses goodwill for impairment on an annual basis and whenever events or changes in circumstances indicate that the carrying value may not be recoverable. Such assessment can be done on a qualitative or quantitative basis. To qualitatively assess the likelihood of goodwill being impaired, the Company considers the following factors at the reporting unit level: the excess of fair value over carrying value as of the last impairment test, the length of time since the last fair value measurement, the carrying value, market and industry metrics, actual performance compared to forecasted performance, and its current outlook on the business. If the qualitative assessment indicated it is more likely than not that goodwill is impaired, the Company will perform quantitative impairment testing at the reporting unit level.
If a quantitative fair value measurement is used, the fair value of goodwill is compared to its carrying value and an impairment charge is recorded if the carrying value exceeds the fair value. To quantitatively test goodwill for impairment, the Company's fair value measurement approach combines the income (discounted cash flow method) and market valuation (market comparable method) techniques for each of the Company's reporting units that carry goodwill. These valuation techniques use estimates and assumptions including, but not limited to, the determination of appropriate market comparables, projected future cash flows, including time and profitability, discount rate reflecting the risk inherent in future cash flows, perpetual growth rate, and projected future economic and market conditions.
Comprehensive Income (Loss)
Comprehensive income (loss) is defined as net income (loss) less changes in stockholders' equity from non-owner sources which, for the Company in the periods presented, consists of foreign currency translations, interest rate swaps, marketable securities and pension related liability adjustments.
Statement of Cash Flows Information
Cash and cash equivalents include checking accounts and all highly liquid investments with an original maturity of three months or less. A substantial majority of the Company’s cash and cash equivalent bank balances exceeded federally insured limits at October 31, 2016. Cash in foreign subsidiaries totaled $8,219 and $13,907 at October 31, 2016 and October 31, 2015, respectively.
48
SHILOH INDUSTRIES, INC.
NOTES TO CONSOLIDATED FINANCIAL STATEMENTS-(Continued)
Concentration of Risk
The Company sells products to customers primarily in the automotive, commercial vehicle and industrial markets. Financial instruments, which potentially subject the Company to concentration of credit risk, are primarily accounts receivable. The Company performs on-going credit evaluations of its customers' financial condition. The allowance for non-collection of accounts receivable is based on the expected collectability of all accounts receivable. Losses have historically been within management's expectations. The Company does not have financial instruments with off-balance sheet risk. Refer to Note 20-Business Segment Information for discussion of concentration of revenues.
The Company believes that the concentration of credit risk in its trade receivables is substantially mitigated by the Company's ongoing credit evaluation process and relatively short collection terms. The Company does not generally require collateral from customers. The Company establishes an allowance for doubtful accounts based upon factors surrounding the credit risk of specific customers, historical trends and other information.
Fair Value of Financial Instruments
The carrying amounts of cash and cash equivalents, trade receivables and payables approximate fair value because of the short maturity of those instruments. The carrying value of the Company's debt and derivative instruments are considered to approximate the fair value of these instruments based on the borrowing rates currently available to the Company for loans with similar terms and maturities.
Derivative Financial Instruments
The Company uses interest rate swaps to manage volatility of underlying exposures. The Company recognizes all of its derivative instruments as either assets or liabilities at fair value. The accounting for changes in the fair value (i.e., gains or losses) of a derivative instrument depends on whether it has been designated, and is effective, as a hedge and further, on the type of hedging relationship. For those derivative instruments that are designated and qualify as hedging instruments, a company must designate the instrument, based upon the exposure being hedged, as a fair value hedge, cash flow hedge or a hedge of a net investment in a foreign operation. Gains and losses related to a hedge are either recognized in income immediately to offset the gain or loss on the hedged item or are deferred and reported as a component of Comprehensive Income (Loss) and subsequently recognized in earnings when the hedged item affects earnings. The change in fair value of the ineffective portion of a hedging instrument, determined using the hypothetical derivative method, is recognized in earnings immediately. The gain or loss related to financial instruments that are not designated as hedges are recognized immediately in earnings. Cash flows related to hedging activities are included in the operating section of the consolidated statements of cash flows. The Company does not hold or issue derivative financial instruments for trading or speculative purposes. The Company’s objective for holding derivatives is to minimize risk using the most effective and cost-efficient methods available.
Foreign Currency Translation
Two of the Company's Mexican subsidiaries (Shiloh De Mexico S.A. DE C.V. and Shiloh International, S.A. DE C.V.), the Company's Netherlands and Swedish holding companies, and all the Company's U.S. subsidiaries have the U.S. dollar as their functional currency. For all other entities, the functional currency is their respective local currency. The translation from the applicable foreign currencies to U.S. dollars is performed for balance sheet accounts using exchange rates in effect at the balance sheet date and for revenue and expense accounts using a weighted average exchange rate for the period. The resulting translation adjustments are recorded as a component of Other Comprehensive Income (Loss) ("OCI"). The Company engages in foreign currency denominated transactions with customers and suppliers, as well as between subsidiaries with different functional currencies. Gains and losses resulting from foreign currency transactions are recognized in net income (loss) in the consolidated statements of income.
Guarantees
The Company has certain indemnification clauses within its Credit Agreement (as defined below) and certain lease agreements that are considered to be guarantees within the scope of FASB ASC Topic 460, "Guarantees." The Company does not consider these guarantees to be probable, and the Company cannot estimate their maximum exposure. Additionally, the Company's exposure to warranty-related obligations is not material.
49
SHILOH INDUSTRIES, INC.
NOTES TO CONSOLIDATED FINANCIAL STATEMENTS-(Continued)
Accounting Estimates
The preparation of consolidated financial statements in conformity with accounting principles generally accepted in the United States of America requires management to make estimates and assumptions that affect the reported amounts of assets and liabilities and disclosure of contingent assets and liabilities at the date of the financial statements and the reported amounts of revenues and expenses during the reporting period. On an ongoing basis, management reviews its estimates based upon current available information. Actual results could differ from those estimates.
Prior Year Reclassification
Certain prior year amounts have been reclassified to conform with current year presentation.
Effective November 1, 2015, the Company changed its classification for recoveries of scrap and tooling as an offset to cost of sales as opposed to net revenues. The Company believes that recoveries of scrap represent the reimbursement of the material it is not able to use in production and, therefore, more appropriately reflected as an offset to cost of sales to allow for better comparability.
For the years ended October 31, 2015 and 2014, $36,051 and $46,706 respectively, was reclassified from net revenues to cost of sales in the consolidated statements of income.
Recently Issued Standards
In May 2014, the Financial Accounting Standards Board ("FASB") issued ASU 2014-09, "Revenue from Contracts with Customers," which clarifies existing accounting literature relating to how and when a company recognizes revenue. Under ASU 2014-09, a company will recognize revenue when it transfers promised goods or services to customers in an amount that reflects the consideration to which the company expects to be entitled in exchange for those goods and services. The FASB, through the issuance of ASU No. 2015-14, "Revenue from Contracts with Customers," approved a one year delay of the effective date and the new standard now is effective for reporting periods beginning after December 15, 2017 and permits two implementation approaches, one requiring retrospective application of the new standard with restatement of prior years and one requiring prospective application of the new standard with disclosure of results under old standards. During the second and third quarter, the FASB issued ASUs 2016-10, 2016-11 and 2016-12. ASUs 2016-10 and 2016-12 provide further clarification on the implementation guidance on principal versus agent considerations. ASU 2016-11 rescinds certain SEC guidance from the FASB ASC in response to announcements made by the SEC at the Emerging Issues Task Force's ("EITF") March 3, 2016 meeting. Finally, ASU 2016-20 makes minor corrections or minor improvements to the Codification that are not expected to have a significant effect on current accounting practice or create a significant administrative cost to most entities. The Company is planning a bottom up approach to analyze the standard's impact on its revenues by looking at historical policies and practices and identifying the differences from applying the new standard to its revenue stream. The Company has not selected a transition date or method nor has it determined the effect of the standard to its consolidated financial statements.
In August 2014, the FASB issued ASU 2014-15, "Presentation of Financial Statements—Going Concern (Subtopic 205-40): Disclosure of Uncertainties about an Entity’s Ability to Continue as a Going Concern," which the intent is to define the Company's responsibility to evaluate whether there is substantial doubt about an organization’s ability to continue as a going concern and to provide related footnote disclosures. This ASU will be effective for the Company November 1, 2017. The Company will prospectively apply the guidance to applicable transactions.
In April 2016, the FASB issued ASU No. 2016-10, "Revenue from Contracts with Customers (Topic 606): Identifying Performance Obligations and Licensing." ASU 2016-10 adds further guidance on identifying performance obligations and also to improve the operability and understandability of the licensing implementation guidance. ASU 2016-10 is effective for fiscal years beginning after December 15, 2017, including interim periods within those fiscal years, with early adoption permitted. The Company is currently evaluating the impact of the adoption of ASU 2016-15 on its consolidated financial statements.
In February 2016, the FASB issued ASU 2016-02, "Leases" which requires a lessee to recognize the assets and liabilities that arise from leases. A lessee should recognize in the statement of financial position a liability to make lease payments (the lease liability) and a right-of-use asset representing its right to use the underlying asset for the lease term. The recognition, measurement, and presentation of expenses and cash flows arising from a lease by a lessee have not significantly changed from the previous guidance within ASC Topic 840, Leases. For operating leases, a lessee is required to do the following: (1) recognize a right-of-use asset and a lease liability, initially measured at the present value of the lease payments, in the statement of financial position,
50
SHILOH INDUSTRIES, INC.
NOTES TO CONSOLIDATED FINANCIAL STATEMENTS-(Continued)
(2) recognize a single lease cost, calculated so that the cost of the lease is allocated over the lease term on a generally straight-line basis and (3) classify all cash payments within operating activities in the statement of cash flows. For leases with a term of 12 months or less, a lessee is permitted to make an accounting policy election by class of underlying asset not to recognize lease assets and lease liabilities. If a lessee makes this election, it should recognize lease expense for such leases generally on a straight-line basis over the lease term. AUS 2016-02 is effective for public entities for fiscal years and interim periods within those years, beginning after December 15, 2018, with early adoption permitted. In transition, lessees and lessors are required to recognize and measure leases at the beginning of the earliest period presented using a modified retrospective approach, which includes a number of optional practical expedients that entities may elect to apply. The Company is currently evaluating the requirements of ASU 2016-02 and has not yet determined its impact on the Company's consolidated financial statements.
In January 2016, the FASB issued ASU 2016-01, "Recognition and Measurement of Financial Assets and Financial Liabilities." ASU 2016-01 to amend certain aspects of recognition, measurement, presentation, and disclosure of financial instruments. Most prominent among the amendments is the requirement for changes in the fair value of the Company's equity investments, with certain exceptions, to be recognized through net income rather than other comprehensive income ("OCI"). ASU 2016-01 is effective for financial statements issued for fiscal years beginning after December 15, 2017, and interim periods within those fiscal years. The application of the amendments will result in a cumulative-effect adjustment to our consolidated balance sheet as of the effective date. The Company is currently evaluating the impact that ASU 2016-01 will have on its statement of financial position or financial statement disclosures.
In July 2015, the FASB issued ASU 2015-11, "Inventory." ASU 2015-11 simplifies the measurement of inventory by requiring inventory to be measured at the lower of cost and net realizable value. ASU 2015-11 is effective for financial statements issued for fiscal years beginning after December 15, 2016, and interim periods within those fiscal years. The Company does not expect ASU 2015-11 will have a material impact on its statement of financial position or financial statement disclosures.
In April 2015, the FASB issued ASU 2015-03, "Interest - Imputation of Interest." ASU 2015-03 requires that debt issuance costs related to a recognized debt liability be presented in the balance sheet as a direct deduction from the carrying amount of that debt liability. The recognition and measurement guidance for debt issuance costs are not affected by the amendments in the ASU. ASU 2015-03 is effective for financial statements issued for fiscal years beginning after December 15, 2015, and interim periods within those fiscal years. The Company does not expect ASU 2015-03 will have a material impact on its statement of financial position or financial statement disclosures.
Recently Adopted Standards
In November 2015, the FASB issued ASU 2015-17, "Balance Sheet Classification of Deferred Taxes." ASU 2015-17 requires that deferred tax liabilities and assets be classified as noncurrent in a classified statement of financial position. ASU 2015-17 is effective for financial statements issued for fiscal years beginning after December 15, 2016, and interim periods within those fiscal years, although early adoption is permitted, including adoption in an interim period. This guidance simplified the current guidance, which required entities to separately present deferred tax assets and liabilities as current and noncurrent on the balance sheet. The Company has elected to early adopt this standard prospectively as of October 31, 2016, as is permitted under the standard. Due to the prospective treatment, prior periods presented in these financial statements have not been adjusted.
In March 2016, FASB issued ASU 2016-09, "Compensation - Stock Compensation." ASU 2016-09 simplified the accounting for share-based payment transactions. This guidance required that excess tax benefits and tax deficiencies be recognized as income tax expense or benefit in the consolidated statements of income rather than additional paid-in capital. Additionally, the excess tax benefits will be classified along with other income tax cash flows as an operating activity, rather than a financing activity, on the statement of cash flows. Further, the update allows an entity to make a policy election to recognize forfeitures as they occur or estimate the number of awards expected to be forfeited. The Company has elected to early adopt this standard prospectively, with certain cumulative effect adjustments if applicable, as of October 31, 2016, as is permitted under the standard. There were no unrecognized excess tax benefits that are required to be recorded on a modified retrospective basis through a cumulative effect adjustment to retained earnings upon adoption. The Company has also elected to continue to recognize forfeitures as they occur.
Note 2—Correction of Immaterial Errors
In the fourth quarter of fiscal 2016, the Company became aware of immaterial errors in certain balance sheet accounts of the Saltillo, Mexico manufacturing facility.
51
SHILOH INDUSTRIES, INC.
NOTES TO CONSOLIDATED FINANCIAL STATEMENTS-(Continued)
The Company assessed the cumulative impact of these errors and other immaterial errors on its previously reported annual financial statements for fiscal years 2015 and 2014 pursuant to the guidance in ASC 250 "Accounting Changes and Error Corrections" ("ASC 250") and SEC Staff Accounting Bulletin ("SAB") No. 99 Materiality. Immaterial errors were not isolated to a limited number of accounts but were primarily related to prepaid expenses and other assets, property, plant and equipment, net and deferred income taxes. The Assessment concluded that the errors were not material, individually or in the aggregate, to any prior period consolidated financial statements. As such, in accordance with ASC 250 (SAB No. 108, Considering Effects of Prior Year Misstatements when Quantifying Misstatements in Current Year Financial Statements), the prior period consolidated financial statements have been revised (the "Revision") in the applicable consolidated financial statements. The Company concluded a revision of prior period consolidated financial statements was appropriate the next time they were reported, since the correction of errors would have been material if recorded in fiscal year 2016. Immaterial errors related to periods prior to the fiscal year ended October 31, 2014 are reflected as an adjustment to beginning retained earnings for that year. Periods not presented herein will be revised, as applicable, in future filings.
The following schedules reconcile the amounts as previously reported in the applicable consolidated financial statement captions to the corresponding adjusted amounts under the Revision:
As of October 31, 2015 | |||||||||||
Balance Sheet | As Reported | Adjustment | As Adjusted | ||||||||
Accounts receivable, net | $ | 194,373 | $ | (218 | ) | $ | 194,155 | ||||
Prepaid income taxes | 3,799 | 716 | 4,515 | ||||||||
Inventories, net | 58,179 | (311 | ) | 57,868 | |||||||
Prepaid expenses and other assets | 48,267 | (2,561 | ) | 45,706 | |||||||
Total current assets | 322,003 | (2,374 | ) | 319,629 | |||||||
Property, plant and equipment, net | 280,260 | (1,037 | ) | 279,223 | |||||||
Goodwill | 28,843 | (851 | ) | 27,992 | |||||||
Deferred income taxes | 4,431 | (1,473 | ) | 2,958 | |||||||
Total assets | 666,589 | (5,735 | ) | 660,854 | |||||||
Accounts payable | 160,405 | 718 | 161,123 | ||||||||
Total current liabilities | 196,944 | 718 | 197,662 | ||||||||
Total liabilities | 525,674 | 718 | 526,392 | ||||||||
Retained earnings | 121,457 | (6,453 | ) | 115,004 | |||||||
Total stockholders’ equity | 140,915 | (6,453 | ) | 134,462 | |||||||
Total liabilities and stockholders’ equity | 666,589 | (5,735 | ) | 660,854 | |||||||
Year Ended October 31, 2015 | |||||||||||
Statement of Income | As Reported | Adjustment | As Adjusted | ||||||||
Net revenues* | $ | 1,073,143 | $ | (91 | ) | $ | 1,073,052 | ||||
Cost of sales* | 986,057 | 808 | 986,865 | ||||||||
Gross profit | 87,086 | (899 | ) | 86,187 | |||||||
Operating income | 21,763 | (899 | ) | 20,864 | |||||||
Income before income taxes | 11,514 | (899 | ) | 10,615 | |||||||
Provision for income taxes | 3,250 | 1,460 | 4,710 | ||||||||
Net income | 8,264 | (2,359 | ) | 5,905 | |||||||
Basic earnings per share | $0.48 | $0.14 | $0.34 | ||||||||
Dilute earnings per share | $0.48 | $0.14 | $0.34 | ||||||||
* See Note 1 - Summary of Significant Accounting Policies pertaining to reclassification.
52
SHILOH INDUSTRIES, INC.
NOTES TO CONSOLIDATED FINANCIAL STATEMENTS-(Continued)
Year Ended October 31, 2014 | |||||||||||
Statement of Income | As Reported | Adjustment | As Adjusted | ||||||||
Net revenues* | $ | 832,026 | $ | 41 | $ | 832,067 | |||||
Cost of sales* | 752,425 | 3,330 | 755,755 | ||||||||
Gross profit | 79,601 | (3,289 | ) | 76,312 | |||||||
Selling, general & administrative expenses | 50,207 | 29 | 50,236 | ||||||||
Amortization of intangible assets | 2,255 | (91 | ) | 2,164 | |||||||
Operating income | 31,165 | (3,227 | ) | 27,938 | |||||||
Interest expense | 4,503 | (88 | ) | 4,415 | |||||||
Income before income taxes | 27,191 | (3,139 | ) | 24,052 | |||||||
Provision for income taxes | 4,747 | (610 | ) | 4,137 | |||||||
Net income | 22,444 | (2,529 | ) | 19,915 | |||||||
Basic earnings per share | $1.31 | $(0.15) | $1.16 | ||||||||
Dilute earnings per share | $1.30 | $(0.14) | $1.16 | ||||||||
* See Note 1 - Summary of Significant Accounting Policies pertaining to reclassification.
Year Ended October 31, 2015 | |||||||||||
Statement of Comprehensive Loss | As Reported | Adjustment | As Adjusted | ||||||||
Net income | $ | 8,264 | $ | (2,359 | ) | $ | 5,905 | ||||
Comprehensive loss | (4,904 | ) | (2,359 | ) | (7,263 | ) | |||||
Year Ended October 31, 2014 | |||||||||||
Statement of Comprehensive Income | As Reported | Adjustment | As Adjusted | ||||||||
Net income | $ | 22,444 | $ | (2,529 | ) | $ | 19,915 | ||||
Comprehensive income | 11,645 | (2,529 | ) | 9,116 | |||||||
Year Ended October 31, 2015 | |||||||||||
Statement of Cash Flows | As Reported | Adjustment | As Adjusted | ||||||||
Net income | $ | 8,264 | $ | (2,359 | ) | $ | 5,905 | ||||
Depreciation and amortization | 34,213 | 54 | 34,267 | ||||||||
Deferred income taxes | 2,997 | 1,266 | 4,263 | ||||||||
Accounts receivable | (27,595 | ) | (12 | ) | (27,607 | ) | |||||
Inventories | 989 | (631 | ) | 358 | |||||||
Prepaids and other assets | (9,553 | ) | 888 | (8,665 | ) | ||||||
Payables and other | (6,394 | ) | 471 | (5,923 | ) | ||||||
Accrued income taxes | (1,711 | ) | 195 | (1,516 | ) | ||||||
Net cash provided by operating activities | 3,501 | (128 | ) | 3,373 | |||||||
Capital expenditures | (39,504 | ) | 128 | (39,376 | ) | ||||||
Net cash used in investing activities | (27,829 | ) | 128 | (27,701 | ) | ||||||
53
SHILOH INDUSTRIES, INC.
NOTES TO CONSOLIDATED FINANCIAL STATEMENTS-(Continued)
Year Ended October 31, 2014 | |||||||||||
Statement of Cash Flows | As Reported | Revision Adjustment | As Revised | ||||||||
Net income | $ | 22,444 | $ | (2,529 | ) | $ | 19,915 | ||||
Depreciation and amortization | 27,893 | (54 | ) | 27,839 | |||||||
Deferred income taxes | 843 | (6 | ) | 837 | |||||||
Accounts receivable | (10,444 | ) | 171 | (10,273 | ) | ||||||
Inventories | 3,795 | 939 | 4,734 | ||||||||
Prepaids and other assets | (9,542 | ) | 1,272 | (8,270 | ) | ||||||
Payables and other | 3,327 | 246 | 3,573 | ||||||||
Accrued income taxes | (4,922 | ) | (604 | ) | (5,526 | ) | |||||
Net cash provided by operating activities | 29,583 | (565 | ) | 29,018 | |||||||
Capital expenditures | (40,158 | ) | 565 | (39,593 | ) | ||||||
Net cash used in investing activities | (159,973 | ) | 565 | (159,408 | ) | ||||||
Statement of Stockholders' Equity | As Reported | Revision Adjustment | As Revised | ||||||||
Total stockholders' equity, Balance at October 31, 2013 | $ | 131,149 | $ | (1,565 | ) | $ | 129,584 | ||||
Retained earnings, Balance at October 31, 2013 | 90,749 | (1,565 | ) | 89,184 | |||||||
Net income fiscal year 2014 | 22,444 | (2,529 | ) | 19,915 | |||||||
Retained earnings, Balance at October 31, 2014 | 113,193 | (4,094 | ) | 109,099 | |||||||
Total stockholders' equity, Balance at October 31, 2014 | 144,519 | (4,094 | ) | 140,425 | |||||||
Net income fiscal year 2015 | 8,264 | (2,359 | ) | 5,905 | |||||||
Retained earnings, Balance at October 31, 2015 | 121,457 | (6,453 | ) | 115,004 | |||||||
Total stockholders' equity, Balance at October 31, 2015 | 140,915 | (6,453 | ) | 134,462 | |||||||
The Company has also reflected these corrections as applicable in its consolidated financial statements and the related notes thereto.
Note 3—Acquisitions
54
SHILOH INDUSTRIES, INC.
NOTES TO CONSOLIDATED FINANCIAL STATEMENTS-(Continued)
Radar Industries, Inc.
On September 30, 2014, the Company, through a wholly-owned subsidiary, consummated the transactions contemplated by the Asset Purchase Agreement, dated September 30, 2014, with Radar Industries, Inc., and Radar Mexican Investments, LLC (collectively "Radar") which produce engineered metal stampings and machined parts for the motor vehicle industry. The Company acquired Radar in order to further its investment in stamping technologies and expand the diversity of its customer base, product offering and geographic footprint. Radar's results of operations are reflected in the Company's consolidated statements of operations from the acquisition date.
During the fourth quarter of fiscal 2016, $1,093 of the remaining escrow balance was released. As of October 31, 2016, $1,157 of funds remain in escrow, subject to certain claims.
Note 4—Asset Impairment and Restructuring Charges
During fiscal 2016, the Company recorded an asset impairment charge of $273 to reduce the real property of the Company's former Valley City Steel facility, an asset impairment charge of $1,282 on an asset held for sale within the Level 2 of the fair value hierarchy and $476 related to idled equipment.
Asset recoveries of $4,026 were recorded during fiscal 2014 for cash received upon sales of assets from the Company's former Mansfield Blanking facility, which was impaired in fiscal 2010.
Note 5—Accounts Receivable
Accounts receivable are expected to be collected within one year and are net of an allowance for doubtful accounts in the amount of $761 and $821 at October 31, 2016 and 2015, respectively. The Company recognized a benefit of $39 from recoveries of receivables previously expensed and recognized bad debt of expense of $210 and $153 during fiscal 2015, and 2014, respectively, in the consolidated statements of income.
The Company continually monitors its exposure with its customers and additional consideration is given to individual accounts in light of the market conditions in the automotive, commercial vehicle and industrial markets.
Note 6—Inventories
Inventories consist of the following:
October 31, | |||||||
2016 | 2015 | ||||||
Raw materials | $ | 26,367 | $ | 31,678 | |||
Work-in-process | 16,149 | 10,944 | |||||
Finished goods | 18,031 | 15,246 | |||||
Total inventories | $ | 60,547 | $ | 57,868 | |||
Total cost of inventory is net of lower of cost of market reserves to reduce certain inventory from cost to net realizable value. Such reserves aggregated $2,946 and $2,547 at October 31, 2016 and 2015, respectively.
Note 7—Prepaid Expenses and Other Assets
Prepaid expenses and other assets consist of the following:
55
October 31, | |||||||||
2016 | 2015 | ||||||||
Tooling (1) | $ | 19,792 | $ | 38,097 | |||||
Prepaid expenses and other assets | 10,694 | 7,609 | |||||||
Assets held for sale | 6,500 | — | |||||||
Total | $ | 36,986 | $ | 45,706 | |||||
The Company invested in stamping equipment for one of its manufacturing facilities. During the fourth quarter of fiscal 2016, the Company determined that a need no longer existed for this type of equipment and is currently recorded as a current asset held for sale. Based on the fair market value of the equipment, the Company recorded an impairment charge of $1,282 to properly reflect the $6,500 fair value of the equipment - see Note 4 - Asset Impairment and Restructuring Charges for further details. The Company is actively working with the supplier to identify a buyer over the next several months.
(1) Customer reimbursements for the development of molds, dies and tools (collectively, "tooling") related to new program awards that go into production over the next twelve months.
Note 8—Other Assets
October 31, | ||||||||||
2016 | 2015 | |||||||||
Other assets consist of the following: | ||||||||||
Deferred financing costs, net | $ | 6,098 | $ | 6,818 | ||||||
Tooling | 881 | 1,499 | ||||||||
Investment in joint venture | 1,300 | — | ||||||||
Other | 4,417 | 3,192 | ||||||||
Total | $ | 12,696 | $ | 11,509 | ||||||
Deferred financing costs are amortized over the term of the debt. During fiscal 2016, 2015, and 2014, amortization of these costs amounted to $2,505, $992, and $807, respectively. Accumulated amortization was $6,771 and $4,266 as of October 31, 2016 and 2015, respectively. During fiscal years 2016 and 2015, the Company capitalized $1,785 and $5,529, respectively, of costs related to the Credit Agreement (as defined below).
Note 9—Property, Plant and Equipment
Property, plant and equipment consist of the following:
October 31, | |||||||
2016 | 2015 | ||||||
Land and improvements | $ | 11,358 | $ | 11,330 | |||
Buildings and improvements | 117,291 | 118,166 | |||||
Machinery and equipment | 505,768 | 494,567 | |||||
Furniture and fixtures | 18,200 | 13,901 | |||||
Construction in progress | 37,612 | 51,253 | |||||
Total, at cost | 690,229 | 689,217 | |||||
Less: Accumulated depreciation | 424,392 | 409,994 | |||||
Property, plant and equipment, net | $ | 265,837 | $ | 279,223 | |||
Depreciation expense was $35,387, $31,956, and $25,675 in fiscal 2016, 2015, and 2014, respectively.
During the years ended October 31, 2016 and 2015, interest capitalized as part of property, plant and equipment was $370 and $526, respectively. The Company had unpaid capital expenditures included in accounts payable of approximately $5,604, $4,225 and $5,415 at October 31, 2016, 2015 and 2014, respectively, and consequently such amounts are excluded from capital expenditures in the accompanying consolidated statements of cash flows for the fiscal years 2016 and 2015. The Company has commitments for capital expenditures of $45,537 at October 31, 2016 that are expected to be incurred in 2017.
56
SHILOH INDUSTRIES, INC.
NOTES TO CONSOLIDATED FINANCIAL STATEMENTS-(Continued)
Capital Leases:
October 31, | |||||||
2016 | 2015 | ||||||
Leased Property: | |||||||
Machinery and equipment | $ | 7,295 | $ | 7,019 | |||
Less: Accumulated depreciation | $ | 1,781 | $ | 1,142 | |||
Leased property, net | $ | 5,514 | $ | 5,877 | |||
Future minimum rental payments to be made under capital leases at October 31, 2016 are as follows:
Twelve Months Ending October 31, | |||
2017 | $ | 849 | |
2018 | 865 | ||
2019 | 594 | ||
2020 | 372 | ||
2021 | 1,708 | ||
4,388 | |||
Plus amount representing interest ranging from 3.05% to 3.77% | 489 | ||
Total obligations under capital leases | $ | 4,877 | |
Note 10—Financing Arrangements
Debt consists of the following:
October 31, | |||||||
2016 | 2015 | ||||||
Credit Agreement —interest at 5.14% and 4.44% at October 31, 2016 and October 31, 2015, respectively | $ | 252,900 | $ | 293,300 | |||
Equipment security note | 996 | 1,496 | |||||
Capital lease obligations | 4,388 | 5,434 | |||||
Insurance broker financing agreement | 661 | 723 | |||||
Total debt | 258,945 | 300,953 | |||||
Less: Current debt | 2,023 | 2,080 | |||||
Total long-term debt | $ | 256,922 | $ | 298,873 | |||
At October 31, 2016, the Company had total debt, excluding capital leases, of $254,557, consisting of a revolving line of credit under the Credit Agreement of floating rate debt of $252,900 and fixed rate debt of $1,657. The weighted average interest rate of all debt was 4.78% and 2.82% for fiscal years 2016 and 2015, respectively.
Revolving Credit Facility:
The Company and its subsidiaries are party to a Credit Agreement, dated October 25, 2013, as amended (the "Credit Agreement") with Bank of America, N.A., as Administrative Agent, Swing Line Lender, Dutch Swing Line Lender and L/C Issuer, JPMorgan Chase Bank, N.A. as Syndication Agent, Merrill Lynch, Pierce, Fenner & Smith Incorporated and J.P. Morgan Securities,
57
SHILOH INDUSTRIES, INC.
NOTES TO CONSOLIDATED FINANCIAL STATEMENTS-(Continued)
LLC as Joint Lead Arrangers and Joint Book Managers, The PrivateBank and Trust Company, Compass Bank and The Huntington National Bank, N.A., as Co-Documentation Agents, and the other lender parties thereto.
On October 28, 2016, the Company executed the Sixth Amendment which increases the permitted consolidated leverage ratio for periods beginning after July 31, 2016; increases the permitted consolidated fixed charge coverage ratio for periods beginning after April 30, 2017; modifies various baskets related to sale of accounts receivable, disposition of assets, sale-leaseback transactions and makes other ministerial updates.
On October 30, 2015, the Company executed the Fifth Amendment which increased the permitted leverage ratio with periodic reductions beginning after July 30, 2016. In addition, the Fifth Amendment permitted various investments as well as up to $40,000 aggregate outstanding principal amount of subordinated indebtedness, subject to certain conditions. Finally, the Fifth Amendment provided for a consolidated fixed charge coverage ratio, and provided for up to $50,000 of capital expenditures by the Company and its subsidiaries throughout the year ending October 31, 2016, subject to certain quarterly baskets.
On April 29, 2015, the Company executed the Fourth Amendment to the Credit Agreement that maintained the commitment period to September 29, 2019 and allowed for an incremental increase of $25,000 (or if certain ratios are met, $100,000) in the original revolving commitments of $360,000, subject to the Company's pro forma compliance with financial covenants, the administrative agent's approval, and the Company obtaining commitments for such increase.
The Fourth Amendment included scheduled commitment reductions beginning after January 30, 2016 totaling $30,000, allocated proportionately between the Aggregate Revolving A and B commitments. On April 30, 2016, the first committed reduction of $5,000 decreased the existing revolving commitment to $355,000, subject to the Company's pro forma compliance with financial covenants.
Borrowings under the Credit Agreement bear interest, at the Company's option, at LIBOR or the base (or "prime") rate established from time to time by the administrative agent, in each case plus an applicable margin. The Fifth Amendment provides for an interest rate margin on LIBOR loans of 1.5% to 4.0% and of 0.50% to 3.0% on base rate loans depending on the Company's leverage ratio.
The Credit Agreement contains customary restrictive and financial covenants, including covenants regarding the Company’s outstanding indebtedness and maximum leverage and interest coverage ratios. The Credit Agreement also contains standard provisions relating to conditions of borrowing. In addition, the Credit Agreement contains customary events of default, including the non-payment of obligations by the Company and the bankruptcy of the Company. If an event of default occurs, all amounts outstanding under the Credit Agreement may be accelerated and become immediately due and payable. The Company was in compliance with the financial covenants as of October 31, 2016 and October 31, 2015.
After considering letters of credit of $5,080 that the Company has issued, unused commitments under the Credit Agreement were $97,020 at October 31, 2016.
Borrowings under the Credit Agreement are collateralized by a first priority security interest in substantially all of the tangible and intangible property of the Company and its domestic subsidiaries and 65% of the stock of foreign subsidiaries.
Other Debt:
On August 1, 2016, the Company entered into a finance agreement with an insurance broker for various insurance policies that bears interest at a fixed rate of 1.96% and requires monthly payments of $95 through May 2017. As of October 31, 2016, $661 of principal remained outstanding under this agreement and was classified as current debt in the Company’s consolidated balance sheets.
On September 2, 2013, the Company entered into an equipment security note that bears interest at a fixed rate of 2.47% and requires monthly payments of $44 through September 2018. As of October 31, 2016, $996 of principal remained outstanding under this agreement and $513 was classified as current debt and $483 was classified as long term debt in the Company’s consolidated balance sheets.
The Company maintains capital leases for equipment used in its manufacturing facilities with lease terms expiring between 2018 and 2021. As of October 31, 2016, the present value of minimum lease payments under its capital leases amounted to $4,388.
58
SHILOH INDUSTRIES, INC.
NOTES TO CONSOLIDATED FINANCIAL STATEMENTS-(Continued)
Derivatives:
On February 25, 2014, the Company entered into an interest rate swap with an aggregate notional amount of $75,000 designated as a cash flow hedge to manage interest rate exposure on the Company’s floating rate LIBOR based debt under the Credit Agreement. The interest rate swap is an agreement to exchange payment streams based on the notional principal amount. This agreement fixes the Company’s future interest payments at 2.74% plus the applicable rate (as described above), on an amount of the Company’s debt principal equal to the then-outstanding swap notional amount. The forward interest rate swap commenced on March 1, 2015 with an initial $25,000 base notional amount. The second notional amount of $25,000 commenced on September 1, 2015 and the final notional amount of $25,000 commenced on March 1, 2016. The base notional amount plus each incremental addition to the base notional amount have a five year maturity of February 29, 2020, August 31, 2020 and February 28, 2021, respectively. On the date the interest swap was entered into, the Company designated the interest rate swap as a hedge of the variability of cash flows to be paid relative to its variable rate monies borrowed. Any ineffectiveness in the hedging relationship is recognized immediately into earnings. The Company determined the mark-to-market adjustment for the interest rate swap to be a gain of $64, net of tax, for the fiscal year ended October 31, 2016, a loss of $1,618, net of tax, for the fiscal year ended October 31, 2015, and a loss of $1,558, net of tax, for the fiscal year ended October 31, 2014, which is reflected in other comprehensive loss. The base notional amounts of $25,000 each or $75,000 total that commenced during 2015 and 2016 resulted in realized losses of $1,530 and $433 of interest expense related to the interest rate swap settlements. for the fiscal years ended October 31, 2016 and 2015, respectively. For fiscal 2017, the Company anticipates recognizing approximately $1,478 of additional interest expense related to the interest swap.
Scheduled repayments under the terms of the Credit Agreement and repayments of other debt are listed below:
Twelve Months Ending October 31, | Credit Agreement | Equipment Security Note | Capital Lease Obligations | Other Debt | Total | |||||||||||||||
2017 | $ | — | $ | 513 | $ | 849 | $ | 661 | $ | 2,023 | ||||||||||
2018 | — | 483 | 865 | — | 1,348 | |||||||||||||||
2019 | 252,900 | — | 594 | — | 253,494 | |||||||||||||||
2020 | — | — | 372 | — | 372 | |||||||||||||||
2021 | — | — | 1,708 | — | 1,708 | |||||||||||||||
Total | $ | 252,900 | $ | 996 | $ | 4,388 | $ | 661 | $ | 258,945 | ||||||||||
59
SHILOH INDUSTRIES, INC.
NOTES TO CONSOLIDATED FINANCIAL STATEMENTS-(Continued)
Note 11—Goodwill and Intangible Assets
Goodwill:
In accordance with FASB ASC Topic 350, "Intangibles – Goodwill and Other," goodwill, and any other intangible asset having an indefinite useful life, must be reviewed for impairment annually, or more frequently if events and circumstances arise that suggest the asset may be impaired. The Company conducts its review for goodwill impairments on September 30 of each year. Goodwill impairment testing is performed at the reporting unit. The fair value is determined and compared to the carrying value. If the carrying value exceeds the fair value, then possible goodwill impairment may exist and further evaluation is required. At the time of goodwill impairment testing, values are estimated for goodwill, incorporating discount rates commensurate with the risks involved. An optional qualitative assessment may alleviate the need to perform the quantitative goodwill impairment test when impairment is unlikely. The Company performed a quantitative assessment at the reporting unit level in 2016 and 2015 and concluded that there was no impairment of goodwill in either year.
The changes in the carrying amount of goodwill are as follows:
Balance October 31, 2014 | $ | 30,036 | |||
Acquisitions, including adjustments on prior year acquisitions | (488 | ) | |||
Foreign currency translation and other | (1,556 | ) | |||
Balance October 31, 2015 | 27,992 | ||||
Foreign currency translation and other | (502 | ) | |||
Balance October 31, 2016 | $ | 27,490 | |||
Intangibles:
The changes in the carrying amount of finite intangible assets for the years ended October 31, 2016 and 2015 are as follows:
Customer Relationships | Developed Technology | Non-Compete | Trade Name | Trademark | Total | ||||||||||||||
Balance October 31, 2014 | $ | 15,856 | $ | 4,311 | $ | 62 | $ | 1,624 | $ | 145 | $ | 21,998 | |||||||
Acquisitions and purchase accounting adjustments | (320 | ) | — | 80 | — | — | (240 | ) | |||||||||||
Amortization expense | (1,305 | ) | (771 | ) | (79 | ) | (124 | ) | (16 | ) | (2,295 | ) | |||||||
Foreign currency translation and other | 80 | — | — | — | — | 80 | |||||||||||||
Balance October 31, 2015 | 14,311 | 3,540 | 63 | 1,500 | 129 | 19,543 | |||||||||||||
Amortization expense | (1,330 | ) | (772 | ) | (16 | ) | (123 | ) | (17 | ) | (2,258 | ) | |||||||
Foreign currency translation and other | (6 | ) | — | — | — | — | (6 | ) | |||||||||||
Balance October 31, 2016 | $ | 12,975 | $ | 2,768 | $ | 47 | $ | 1,377 | $ | 112 | $ | 17,279 | |||||||
60
SHILOH INDUSTRIES, INC.
NOTES TO CONSOLIDATED FINANCIAL STATEMENTS-(Continued)
Intangible assets are amortized on the straight-line method over their legal or estimated useful lives. The following summarizes the gross carrying value and accumulated amortization for each major class of intangible assets:
October 31, 2016 | ||||||||||||||||||
Weighted Average Useful Life (years) | Gross Carrying Value | Accumulated Amortization | Foreign Currency Adjustment | Net | ||||||||||||||
Customer relationships | 13.2 | $ | 17,598 | $ | (4,589 | ) | $ | (34 | ) | $ | 12,975 | |||||||
Developed technology | 7.3 | 5,007 | (2,239 | ) | — | 2,768 | ||||||||||||
Non-compete | 2.3 | 824 | (777 | ) | — | 47 | ||||||||||||
Trade name | 14.8 | 1,875 | (498 | ) | — | 1,377 | ||||||||||||
Trademark | 10.0 | 166 | (54 | ) | — | 112 | ||||||||||||
Total intangible assets | $ | 25,470 | $ | (8,157 | ) | $ | (34 | ) | $ | 17,279 | ||||||||
October 31, 2015 | |||||||||||||||||
Gross Carrying Value | Accumulated Amortization | Foreign Currency Adjustment | Net | ||||||||||||||
Customer relationships | $ | 17,598 | $ | (3,259 | ) | $ | (28 | ) | $ | 14,311 | |||||||
Developed technology | 5,007 | (1,467 | ) | — | 3,540 | ||||||||||||
Non-compete | 824 | (761 | ) | — | 63 | ||||||||||||
Trade name | 1,875 | (375 | ) | — | 1,500 | ||||||||||||
Trademark | 166 | (37 | ) | — | 129 | ||||||||||||
Total intangible assets | $ | 25,470 | $ | (5,899 | ) | $ | (28 | ) | $ | 19,543 | |||||||
Total amortization expense for the years ended October 31, 2016, 2015, and 2014 was $2,258, $2,295, and $2,164, respectively. Amortization expense related to intangible assets for the following fiscal years ending is estimated to be as follows:
2017 | 2,259 | |||
2018 | 2,123 | |||
2019 | 1,716 | |||
2020 | 1,701 | |||
2021 | 1,701 | |||
Thereafter | 7,779 | |||
$ | 17,279 | |||
61
SHILOH INDUSTRIES, INC.
NOTES TO CONSOLIDATED FINANCIAL STATEMENTS-(Continued)
Note 12—Operating Leases
The Company leases buildings, material handling, manufacturing and office equipment under operating leases with terms that range from one to fifteen years at inception. The leases do not include step rent provisions, escalation clauses, capital improvement funding or other lease concessions that qualify the leases as a contingent rental. Also, the leases do not include a variable related to a published index. The Company's operating leases are charged to expense over the lease term, on a straight-line basis.
The longest lease term of the Company's current leases extends to May 2029. Rent expense under operating leases for fiscal years 2016, 2015, and 2014 was $9,544, $8,449 and $4,613, respectively. Beginning in fiscal 2016, lease expense reflects certain sale-leaseback transactions entered into during the third quarter of fiscal 2015. The assets under the sale-leaseback were for new machinery and equipment which are being leased over a six to seven year period.
Future minimum lease payments under operating leases are as follows at October 31, 2016:
2017 | $ | 9,682 | |
2018 | 8,677 | ||
2019 | 7,781 | ||
2020 | 6,501 | ||
2021 | 4,975 | ||
Thereafter | 2,585 | ||
Total commitments under non-cancelable operating leases | $ | 40,201 | |
Note 13—Employee Benefit Plans
The Company maintains pension plans, which are frozen, covering its eligible employees. The Company also provides an unfunded postretirement health care benefit plan for 15 retirees and their dependents. The measurement date for the Company's employee benefit plans coincides with its fiscal year end, October 31.
Obligations and Funded Status U.S. Plans At October 31
Pension Benefits | Other Post Retirement Benefits | ||||||||||||||
2016 | 2015 | 2016 | 2015 | ||||||||||||
Change in benefit obligation: | |||||||||||||||
Benefit obligation at beginning of year | $ | (86,827 | ) | $ | (88,590 | ) | $ | (423 | ) | $ | (639 | ) | |||
Interest cost | (3,566 | ) | (3,466 | ) | (16 | ) | (24 | ) | |||||||
Actuarial gain (loss) | (5,100 | ) | 563 | 20 | 180 | ||||||||||
Benefits paid | 4,709 | 4,666 | 47 | 60 | |||||||||||
Benefit obligation at end of year | (90,784 | ) | (86,827 | ) | (372 | ) | (423 | ) | |||||||
Change in plan assets: | |||||||||||||||
Fair value of plan assets at beginning of year | 66,655 | 65,861 | — | — | |||||||||||
Actual return on plan assets | 1,562 | 1,690 | — | — | |||||||||||
Employer contributions | 950 | 3,770 | 47 | 60 | |||||||||||
Benefits paid | (4,709 | ) | (4,666 | ) | (47 | ) | (60 | ) | |||||||
Fair value of plan assets at end of year | 64,458 | 66,655 | — | — | |||||||||||
Funded status, benefit obligations in excess of plan assets | $ | (26,326 | ) | $ | (20,172 | ) | $ | (372 | ) | $ | (423 | ) | |||
The above amounts are recorded in the liabilities section of the consolidated balance sheets as follows:
Pension Benefits | Other Post Retirement Benefits | ||||||||||||||
2016 | 2015 | 2016 | 2015 | ||||||||||||
Other accrued expenses | $ | (4,120 | ) | $ | (3,840 | ) | $ | (42 | ) | $ | (63 | ) | |||
Long-term benefit liabilities | (22,206 | ) | (16,332 | ) | (330 | ) | (360 | ) | |||||||
Total | $ | (26,326 | ) | $ | (20,172 | ) | $ | (372 | ) | $ | (423 | ) | |||
Components of Net Periodic Benefit Cost U.S. Plans | |||||||||||||||||||||||
Pension Benefits | Other Post Retirement Benefits | ||||||||||||||||||||||
2016 | 2015 | 2014 | 2016 | 2015 | 2014 | ||||||||||||||||||
Interest cost | $ | 3,566 | $ | 3,466 | $ | 3,749 | $ | 16 | $ | 24 | $ | 38 | |||||||||||
Expected return on plan assets | (4,568 | ) | (4,698 | ) | (4,281 | ) | — | — | — | ||||||||||||||
Amortization of net actuarial loss | 1,239 | 1,186 | 1,074 | 12 | 28 | 41 | |||||||||||||||||
Net periodic benefit cost | $ | 237 | $ | (46 | ) | $ | 542 | $ | 28 | $ | 52 | $ | 79 | ||||||||||
The Company expects to recognize in the consolidated statements of income the following amounts that will be amortized from accumulated other comprehensive loss in fiscal 2017.
Pension Benefits | Other Post Retirement Benefits | ||||||
Amortization of net actuarial loss | $ | 1,508 | $ | 10 | |||
62
SHILOH INDUSTRIES, INC.
NOTES TO CONSOLIDATED FINANCIAL STATEMENTS-(Continued)
The Company has recognized the following cumulative pre-tax actuarial losses, prior service costs and transition obligations in accumulated other comprehensive loss:
Pension Benefits | Other Post Retirement Benefits | ||||||||||||||
2016 | 2015 | 2016 | 2015 | ||||||||||||
Net actuarial loss | $ | 51,795 | $ | 44,928 | $ | 122 | $ | 153 | |||||||
Recognized in accumulated other comprehensive loss | $ | 51,795 | $ | 44,928 | $ | 122 | $ | 153 | |||||||
Additional Information on U.S. Plans
Pension Benefits | Other Post Retirement Benefits | ||||||||||||||
2016 | 2015 | 2016 | 2015 | ||||||||||||
Increase (decrease) in minimum liability included in other comprehensive income (loss) | $ | 6,867 | $ | (1,259 | ) | $ | 31 | $ | 208 | ||||||
Assumptions for U.S. Plans:
Weighted-average assumptions used to determine benefit obligations at October 31 | Pension Benefits | Other Post Retirement Benefits | ||||||||||||||||
2016 | 2015 | 2014 | 2016 | 2015 | 2014 | |||||||||||||
Discount rate | 3.70 | % | 4.20 | % | 4.00 | % | 3.70 | % | 4.20 | % | 4.00 | % | ||||||
Pension Benefits | Other Post Retirement Benefits | |||||||||||||||||
Weighted-average assumptions used to determine net periodic benefit costs for years ended October 31 | 2016 | 2015 | 2014 | 2016 | 2015 | 2014 | ||||||||||||
Discount rate | 4.20 | % | 4.00 | % | 4.50 | % | 4.20 | % | 4.00 | % | 4.50 | % | ||||||
Expected long-term return on plan assets | 7.50 | % | 7.50 | % | 7.50 | % | — | — | — | |||||||||
These assumptions are used to develop the projected obligation at fiscal year end and to develop net periodic benefit cost for the subsequent fiscal year. Therefore, for fiscal 2016, the assumptions used to determine net periodic benefit costs were established at October 31, 2015, while the assumptions used to determine the benefit obligations were established at October 31, 2016
The Company uses the Principal Pension Discount Yield Curve ("Principal Curve") for the U.S. Plans as the basis for determining the discount rate for reporting pension and retiree medical liabilities. The Principal Curve has several advantages to other methods, including: transparency of construction, lower statistical errors, and continuous forward rates for all years.
The Company determines the annual rate of return on the U.S. Plan pension assets by first analyzing the composition of its asset portfolio. Historical rates of return are applied to the portfolio. The Company's outside investment advisors and actuaries review the computed rate of return. Industry comparables and other outside guidance are also considered in the annual selection of the expected rates of return on pension assets. The long-term expected rate of return on plan assets takes into account years with exceptional gains and years with exceptional losses.
63
SHILOH INDUSTRIES, INC.
NOTES TO CONSOLIDATED FINANCIAL STATEMENTS-(Continued)
October 31, | |||
Assumed health care trend rates | 2016 | 2015 | |
Health care cost trend rate assumed for next year | 7.0% | 7.0% | |
Rate to which the cost trend rate is assumed to decline (the ultimate trend rate) | 6.8% | 6.8% | |
Year that the rate reaches the ultimate trend rate | 2018 | 2018 | |
Assumed healthcare cost trend rates have a significant effect on the amounts reported for the healthcare plan. The Company's trend rate was based on reduced health care claims experienced by a small and declining retiree population. A one-percentage point change in assumed healthcare cost trend rates would have the following effects at October 31, 2016:
One-Percentage Point Increase | One-Percentage Point Decrease | ||||||
Effect on total of service and interest cost components | $ | 3 | $ | (3 | ) | ||
Effect on post retirement obligation | $ | 28 | $ | (24 | ) | ||
Plan Assets - U.S. Plan Assets
The Company has established a targeted asset allocation percentage by asset category and rebalances the assets of each U.S. plan when pension contributions are funded. The Company's pension plan weighted-average asset allocations at October 31, 2016 and 2015, by asset category and comparison to the target allocation percentage are as follows:
Target Allocation Percentage | Plan Assets at October 31, | |||
2016 | 2015 | |||
Asset Category | ||||
Equity securities | 0-70% | 59% | 60% | |
Debt securities | 0-70% | 35% | 34% | |
Real estate | 0-10% | 6% | 6% | |
Total | 100% | 100% | ||
The Company's investment policy for assets of the U.S. plans is to obtain a reasonable long-term return consistent with the level of risk assumed. The Company also seeks to control the cost of funding the plans within prudent levels of risk through the investment of plan assets and the Company seeks to provide diversification of assets in an effort to avoid the risk of large losses and to maximize the return to the plans consistent with market and economic risk.
Fair Value
The plans' investments are reported at fair value. Purchases and sale of securities are recorded on a trade-date basis. Dividends are recorded on the ex-dividend date.
FASB ASC Topic 820, Fair Value Measurements and Disclosures ("FASB ASC 820"), clarifies that fair value is an exit price, representing the amount that would be received to sell an asset or paid to transfer a liability in an orderly transaction between market participants. As such, fair value is a market-based measurement that should be determined based upon assumptions that market participants would use in pricing an asset or liability. As a basis for considering such assumptions, FASB ASC 820 establishes a three-tier fair value hierarchy, which prioritizes the inputs used in measuring fair value as follows:
Level 1: Quoted prices (unadjusted) for identical assets or liabilities in active markets that the plans have the ability to access as of the measurement date.
Level 2: Significant other observable inputs other than level 1 prices such as quoted prices for similar assets or liabilities; quoted prices in markets that are not active; or other inputs that are observable or can be corroborated by observable market data.
64
SHILOH INDUSTRIES, INC.
NOTES TO CONSOLIDATED FINANCIAL STATEMENTS-(Continued)
Level 3: Significant unobservable inputs that reflect the plans' own assumptions about the assumptions that market participants would use in pricing an asset or liability.
An asset’s or liability’s fair value measurement level within the fair value hierarchy is based on the lowest level of any input that is significant to the fair value measurement. Valuation techniques used need to maximize the use of observable inputs and minimize the use of unobservable inputs.
Assets and liabilities measured at fair value are based on one or more of the following three valuation techniques noted in FASB ASC 820:
• | Market approach: Prices and other relevant information generated by market transactions involving identical or comparable assets or liabilities. |
• | Cost approach: Amount that would be required to replace the service capacity of an asset (replacement cost). |
• | Income approach: Techniques to convert future amounts to a single present amount based upon market expectations (including present value techniques, option-pricing and excess earnings models). |
The following descriptions of the valuation methods and assumptions used by the plans to estimate the fair values of investments apply to investments held directly by the plans.
Mutual funds: The fair values of mutual fund investments are determined by obtaining quoted prices on nationally recognized securities exchanges (level 1 inputs).
Pooled separate accounts: The fair values of participation units held in pooled separate accounts are based on their net asset values, as reported by the managers of the pooled separate accounts as supported by the unit prices of actual purchase and sale transactions occurring as of or close to the financial statement date (level 2 inputs). A fund sponsored by Principal Financial Group, investment and actuarial advisors of the Company, each of the pooled separate accounts invests in multiple securities. Each pooled separate account provides for daily redemptions by the plans with no advance notice requirements, and has redemption prices that are determined by the fund's net asset value per unit.
The methods described above may produce a fair value calculation that may not be indicative of net realizable value or reflective of future fair values. Furthermore, while the Company believes its valuation methods are appropriate and consistent with other market participants, the use of different methodologies or assumptions to determine the fair value of certain financial instruments could result in a different fair value measurement at the reporting date.
65
SHILOH INDUSTRIES, INC.
NOTES TO CONSOLIDATED FINANCIAL STATEMENTS-(Continued)
Investments totaling $64,458 at October 31, 2016 and $66,655 at October 31, 2015 measured at fair value on a recurring basis are summarized below:
Fair Value Measurements | Fair Value Measurements | |||||||||||||||||||
at October 31, 2016 Using | at October 31, 2015 Using | |||||||||||||||||||
Quoted Prices in Active Markets for Identical Assets (Level 1) | Significant Other Observable Inputs (Level 2) | Quoted Prices in Active Markets for Identical Assets (Level 1) | Significant Other Observable Inputs (Level 2) | |||||||||||||||||
U.S. Plans | Valuation Technique | |||||||||||||||||||
Investments | ||||||||||||||||||||
Equity | ||||||||||||||||||||
Large U.S. Equity | $ | 12,904 | $ | 10,294 | $ | 9,515 | $ | 12,302 | Market | |||||||||||
Small/Mid U.S. Equity | 7,654 | 622 | 6,108 | 2,688 | Market | |||||||||||||||
International Equity | 6,420 | — | 9,478 | — | Market | |||||||||||||||
Fixed Income | ||||||||||||||||||||
Government | — | 309 | — | 298 | Market | |||||||||||||||
Corporate | 17,738 | 4,571 | 17,832 | 4,547 | Market | |||||||||||||||
Real Estate (Primarily Commercial) | — | 3,946 | — | 3,887 | Market | |||||||||||||||
Total Investments | $ | 44,716 | $ | 19,742 | $ | 42,933 | $ | 23,722 | ||||||||||||
Cash Flows
Contributions
The Company does not expect to contribute to its U.S. pension plans in fiscal 2017, compared to $950 funded in fiscal 2016.
Estimated Future Benefit Payments
The following benefit payments, which reflect expected future service, as appropriate, are expected to be paid by the plans:
Pension Benefits | Other Benefits | ||||||||||
2017 | $ | 4,120 | $ | 42 | |||||||
2018 | 4,000 | 41 | |||||||||
2019 | 4,410 | 40 | |||||||||
2020 | 4,630 | 40 | |||||||||
2021 | 4,340 | 29 | |||||||||
2022-2025 | 24,690 | 120 | |||||||||
66
SHILOH INDUSTRIES, INC.
NOTES TO CONSOLIDATED FINANCIAL STATEMENTS-(Continued)
Non-U.S. Plans
For the Company's Swedish operations, the majority of the pension obligations are covered by insurance policies with insurance companies. Pension commitments in the Company's Polish operations are $826 at the end of fiscal 2016 and $696 at the end of fiscal 2015. The liability represents the present value of future obligations and is calculated on actuarial basis. The Polish operations recognized expense of $162 and $115 for the fiscal years ended October 31, 2016 and 2015, respectively Expense for fiscal 2014 was immaterial.
The insurance contracts guarantee a minimum rate of return. The Company has no input into the investment strategy of the assets underlying the contracts, but they are typically heavily invested in active bond markets and are highly regulated by local law.
Defined Contribution Plans
In addition to the defined benefit plans described above, the Company maintains a number of defined contribution plans for its United States locations. Under the terms of the plans, eligible employees may contribute a selected percentage of their base pay. The Company matches a percentage of the employees' contributions up to a stated percentage, subject to statutory limitations. The Company recorded an expense related to the matching program for the fiscal years ended 2016, 2015 and 2014 of $3,959, $3,845 and 3,230, respectively.
Labor Agreements
As of October 31, 2016, the Company had approximately 3,100 employees. Organized labor unions represent approximately 20% of the Company's U.S. hourly employees and approximately 90% of the Company's non-U.S. employees.
Each of the Company's unionized manufacturing facilities has its own labor agreement with its own expiration date. As a result, no contract expiration date affects more than one facility.
Note 14—Other Fair Value Financial Instruments
The methods used by the Company may produce a fair value calculation that may not be indicative of net realizable value or reflective of future fair values. Furthermore, while the Company believes its valuation methods are appropriate and consistent with other market participants, the use of different methodologies or assumptions to determine the fair value of certain financial instruments could result in a different fair value measurement at the reporting date.
Assets and liabilities remeasured and disclosed at fair value on a recurring basis at October 31, 2016 and 2015 are set forth in the table below:
Asset (Liability) | Level 2 | Valuation Technique | ||||||||
October 31, 2015: | ||||||||||
Interest Rate Swap Contracts | $ | (4,989 | ) | $ | (4,989 | ) | Income Approach | |||
Marketable Securities | 356 | 356 | Income Approach | |||||||
October 31, 2016: | ||||||||||
Interest Rate Swap Contracts | (5,036 | ) | (5,036 | ) | Income Approach | |||||
Marketable Securities | $ | 174 | $ | 174 | Income Approach | |||||
The Company calculates the fair value of its interest rate swap contracts, using quoted interest rate curves, to calculate forward values, and then discounts the forward values.
The discount rates for all derivative contracts are based on quoted swap interest rates or bank deposit rates. For contracts which, when aggregated by counterparty, are in a liability position, the rates are adjusted by the credit spread that market participants would apply if buying these contracts from the Company’s counterparties.
67
SHILOH INDUSTRIES, INC.
NOTES TO CONSOLIDATED FINANCIAL STATEMENTS-(Continued)
Assets and liabilities measured at fair value on a nonrecurring basis at October 31, 2016 and 2015 are set forth in the table below:
Asset | Level 3 | Valuation Technique | ||||||||
October 31, 2015: | ||||||||||
Goodwill | $ | (488 | ) | $ | (488 | ) | Income Approach | |||
Intangible Assets | (240 | ) | (240 | ) | Income Approach | |||||
October 31, 2016: | ||||||||||
Goodwill | — | — | Income Approach | |||||||
Intangible Assets | $ | — | $ | — | Income Approach | |||||
During 2016 the Company recorded an asset impairment charge or $1,758. Refer to Note 4, Asset Impairment and Restructuring Charges, for further information regarding these charges and the associated level of input.
Note 15—Earnings Per Share (amounts and number of shares in thousands except per share data)
Basic earnings per share is computed by dividing net income available to common stockholders by the weighted average number of shares of Common Stock outstanding during the period. In addition, the shares of Common Stock issuable pursuant to restricted stock units and stock options outstanding under the 2016 Plan are included in the diluted earnings per share calculation to the extent they are dilutive. For the years ended October 31, 2016, 2015, and 2014, approximately 53, 143, and 225 stock awards, respectively, were excluded from the computation of diluted earnings per share because they were anti-dilutive. The following is a reconciliation of the numerator and denominator of the basic and diluted earnings per share computation for net income per share:
Years Ended October 31, | |||||||||||
2016 | 2015 | 2014 | |||||||||
Net income available to common stockholders | $ | 3,669 | $ | 5,905 | $ | 19,915 | |||||
Basic weighted average shares | 17,513 | 17,287 | 17,145 | ||||||||
Effect of dilutive securities: | |||||||||||
Restricted stock units and stock options | 13 | 23 | 70 | ||||||||
Diluted weighted average shares | 17,526 | 17,310 | 17,215 | ||||||||
Basic earnings per share | $0.21 | $0.34 | $1.16 | ||||||||
Diluted earnings per share | $0.21 | $0.34 | $1.16 | ||||||||
Note 16—Stock Incentive Compensation (amounts in thousands except number of shares and per share data)
Stock Incentive Compensation falls under the scope of FASB ASC Topic 718 "Compensation – Stock Compensation" and affects the stock awards that have been granted and requires the Company to expense share-based payment ("SBP") awards with compensation cost for SBP transactions measured at fair value. For stock options, the Company has elected to use the simplified method of calculating the expected term and historical volatility to compute fair value under the Black-Scholes option-pricing model. The risk-free rate for periods within the contractual life of the option is based on the U.S. zero coupon Treasury yield in effect at the time of grant. Forfeitures have been estimated based upon the Company’s historical experience. For restricted stock and restricted stock units, the Company is computing fair value based on a twenty day EMA as of the close of business the Friday preceding the award date.
2016 Equity and Incentive Compensation Plan
On March 9, 2016, stockholders approved and adopted the 2016 Equity and Incentive Compensation Plan ("2016 Plan") which replaced the Amended and Restated 1993 Key Employee Stock Incentive Program. The 2016 Plan authorizes the Compensation Committee of the Board of Directors of the Company to grant to officers and other key employees, including directors, of the Company and its subsidiaries (i) option rights, (ii) appreciation rights, (iii) restricted shares, (iv) restricted stock units, (v) cash incentive awards, performance shares and performance units and (vi) other awards. An aggregate of 1,500,000 shares of Common Stock, subject to adjustment upon occurrence of certain events to prevent dilution or expansion of the rights of participants that might otherwise result from the occurrence of such events, was reserved for issuance pursuant to the Incentive Plan. An individual’s award of options and / or appreciation rights is limited to 500,000 shares during any calendar year. Also, an individual's award of restricted shares, restricted share units and performance based awards is limited to 350,000 shares during any calendar year.
The Compensation Committee of our Board of Directors approved the grant of restricted stock and restricted stock units under both the Amended and Restated 1993 Key Employee Stock Incentive Program and the 2016 Plan shown in the table below for the fiscal year ended October 31, 2016:
Granted | 20-Day EMA | |||
Restricted Stock (1) | 312,251 | $4.30 | ||
Restricted Stock Units (2) | 21,539 | $4.17 | ||
(1) 32,394 shares issued under the Amended and Restated 1993 Key Employee Stock Incentive Program and 279,857 shares issued under the 2016 Plan.
(2) 21,539 units issued under the 2016 Plan.
68
SHILOH INDUSTRIES, INC.
NOTES TO CONSOLIDATED FINANCIAL STATEMENTS-(Continued)
The following table summarizes the Company's Incentive Plan activity during the years ended October 31, 2016, 2015, and 2014:
Stock Options | Restricted Stock | Restricted Stock Units | |||||||||||||||||||||
Outstanding at: | Options | Weighted Average Exercise Price | Weighted Average Remaining Contractual Life | Restricted Shares | 20 Day EMA (1) | Weighted Average Remaining Contractual Life | Restricted Share Units | 20 Day EMA (1) | |||||||||||||||
November 1, 2013 | 236,134 | $9.93 | 5.59 | 51,571 | $10.18 | 2.84 | — | — | |||||||||||||||
Granted | — | — | 89,500 | 19.65 | — | — | |||||||||||||||||
Options exercised or restricted stock vested | (100,468 | ) | $10.55 | (17,190 | ) | $10.18 | — | — | |||||||||||||||
Forfeited or expired | (12,333 | ) | $7.19 | (7,000 | ) | 20.64 | — | — | |||||||||||||||
October 31, 2014 | 123,333 | $9.69 | 5.15 | 116,881 | $16.81 | 2.58 | — | — | |||||||||||||||
Granted | — | — | 84,272 | $11.22 | — | — | |||||||||||||||||
Options exercised or restricted stock vested | (19,317 | ) | $8.19 | (68,648 | ) | $14.99 | — | — | |||||||||||||||
Forfeited or expired | (13,350 | ) | $11.80 | (8,250 | ) | $20.64 | — | — | |||||||||||||||
October 31, 2015 | 90,666 | $9.70 | 4.10 | 124,255 | $13.77 | 2.28 | — | — | |||||||||||||||
Granted | — | — | 312,251 | $4.30 | 21,539 | $4.17 | |||||||||||||||||
Options exercised or restricted stock vested | — | — | (54,349 | ) | $16.53 | — | — | ||||||||||||||||
Forfeited or expired | (1,000 | ) | $12.04 | (5,817 | ) | $5.71 | — | — | |||||||||||||||
October 31, 2016 | 89,666 | $9.67 | 3.09 | 376,340 | $6.40 | 1.83 | 21,539 | $4.17 | |||||||||||||||
(1) 20-day EMA effective with commencement of the 2016 Plan on March 9, 2016.
The Company recorded stock compensation expense related to stock options, restricted stock and restricted stock units during the fiscal years ended October 31, 2016, 2015 and 2014 as follows:
2016 | 2015 | 2014 | ||||||||||
Stock options | $ | — | $ | 15 | $ | 150 | ||||||
Restricted stock | 1,035 | 1,010 | 429 | |||||||||
Restricted stock units | 37 | — | — | |||||||||
Total | $ | 1,072 | $ | 1,025 | $ | 579 | ||||||
Stock Options
The exercise price of each stock option equals the market price of the Company's common stock on its grant date. Compensation expense is recorded at the grant date fair value, less an estimated forfeiture amount, and is recognized on a straight-line basis over the applicable vesting period. The Company's stock options generally vest over three years, with a maximum term of ten years. Incentive stock options were not granted during fiscal years 2016, 2015, and 2014.
Stock options were not exercised during fiscal year ended October 31, 2016. Cash received from the exercise of options for the fiscal years ended October 31, 2015 and 2014 was $159, and $1,061, respectively. At October 31, 2016, the options outstanding had an intrinsic value of $72 and the options exercisable had an intrinsic value of $72. Options that have an exercise price greater than the market price on October 31, 2016 were excluded from the intrinsic value computation. The intrinsic value of options exercised during fiscal 2015 and 2014 was $18 and $652, respectively.
69
SHILOH INDUSTRIES, INC.
NOTES TO CONSOLIDATED FINANCIAL STATEMENTS-(Continued)
The following table provides additional information regarding options outstanding as of October 31, 2016:
Exercise Prices | Options Outstanding | Exercise Price of Options Outstanding and Options Exercisable | Options Exercisable | Weighted Average Remaining Contractual Life | |||||||
$14.74 | 16,000 | $14.74 | 16,000 | .29 | |||||||
$2.11 | 8,000 | $2.11 | 8,000 | 2.12 | |||||||
$5.30 | 19,666 | $5.30 | 19,666 | 2.78 | |||||||
$12.04 | 35,000 | $12.04 | 35,000 | 4.11 | |||||||
$8.10 | 11,000 | $8.10 | 11,000 | 5.14 | |||||||
Totals | 89,666 | 89,666 | |||||||||
Restricted Stock Awards
The grant date fair value of each restricted stock award equals the fair value of the Company's common stock based on a 20 day exponential moving average as of the close of business on the Friday preceding the award date. Compensation expense is recorded at the grant date fair value, less an estimated forfeiture amount, and is recognized over the applicable vesting periods. The vesting periods range between one to four years. As of October 31, 2016, there was approximately $1,553 of total unrecognized compensation costs related to these restricted stock awards to be recognized over the next three fiscal years.
Restricted Stock Units
The grant date fair value of each restricted stock unit equals the fair value of the Company's common stock based on a 20 day exponential moving average as of the close of business on the Friday preceding the award date. Compensation expense is recorded at the grant date fair value, less an estimated forfeiture amount, and is recognized over the applicable vesting periods. The vesting periods range between one to three years. As of October 31, 2016, there was approximately $48 of total unrecognized compensation expense related to these restricted stock units that is expected to be recognized over the next three fiscal years.
Incentive Bonus Plans
The Company maintains a Management Incentive Plan ("MIP") to provide the Chief Executive Officer and certain eligible employees ("participants") incentives for superior performance. The MIP is administered by the Compensation Committee of the Board of Directors and entitles the participants to be paid a cash bonus based upon varying percentages of their respective salaries, the level of achievement of the corporate goals established by the Compensation Committee and specific individual goals as established by the Chief Executive Officer (for employees other than the CEO). For fiscal year 2016, the Compensation Committee established goals for participants based on the Company's earnings before interest, taxes, depreciation and amortization. For fiscal years 2015 and 2014, the Compensation Committee established goals for participants based on the Company's earnings before interest, taxes, depreciation and amortization and return on invested capital. The incentive depends upon meeting the operating targets and, for participants at an operating unit, 50% is based upon attaining the corporate goals for the Company's performance. For both fiscal 2016 and 2015, the Company did not meet the established targets and therefore participants were not eligible for a bonus payout under the MIP. For fiscal 2014, participants in the MIP received an aggregate bonus of $3,360 under the MIP, which was paid in the first quarter of fiscal 2015.
70
SHILOH INDUSTRIES, INC.
NOTES TO CONSOLIDATED FINANCIAL STATEMENTS-(Continued)
Note 17—Income Taxes
Income (loss) before income taxes consists of the following:
Years Ended October 31, | ||||||||||||
2016 | 2015 | 2014 | ||||||||||
Domestic | $ | 3,917 | $ | 17,063 | $ | 26,417 | ||||||
Foreign | (5,400 | ) | (6,448 | ) | (2,365 | ) | ||||||
Total | $ | (1,483 | ) | $ | 10,615 | $ | 24,052 | |||||
The components of the provision (benefit) for income taxes from continuing operations were as follows:
Years Ended October 31, | |||||||||||||
2016 | 2015 | 2014 | |||||||||||
Current: | |||||||||||||
Federal | $ | (3,900 | ) | $ | (545 | ) | $ | 3,067 | |||||
State and local | 329 | 384 | 159 | ||||||||||
Foreign | 1,123 | 608 | 74 | ||||||||||
Total current | (2,448 | ) | 447 | 3,300 | |||||||||
Deferred: | |||||||||||||
Federal | 3,289 | 4,501 | 3,094 | ||||||||||
State and local | 156 | 208 | 59 | ||||||||||
Foreign | (6,149 | ) | (446 | ) | (2,316 | ) | |||||||
Total deferred | (2,704) | 4,263 | 837 | ||||||||||
Provision (benefit) | $ | (5,152 | ) | $ | 4,710 | $ | 4,137 | ||||||
71
SHILOH INDUSTRIES, INC.
NOTES TO CONSOLIDATED FINANCIAL STATEMENTS-(Continued)
Temporary differences and carryforwards which give rise to deferred tax assets and liabilities were comprised of the following:
Years Ended October 31, | ||||||||
2016 | 2015 | |||||||
Deferred tax assets: | ||||||||
Accrued compensation and benefits | $ | 2,091 | $ | 1,794 | ||||
Inventory | 646 | 738 | ||||||
State depreciation adjustments and loss carryforwards | 2,664 | 1,803 | ||||||
Pension obligations and post retirement benefits | 10,229 | 6,020 | ||||||
Foreign net operating loss | 7,466 | 4,567 | ||||||
Other accruals, reserves and tax credits | 3,668 | 2,356 | ||||||
Goodwill and intangible amortization | 7,234 | 8,280 | ||||||
Foreign currency translation | 75 | 107 | ||||||
Interest rate swap | 1,922 | 1,811 | ||||||
Total deferred tax assets | 35,995 | 27,476 | ||||||
Less: Valuation allowance | (2,782) | (4,986) | ||||||
Net deferred tax assets | $ | 33,213 | $ | 22,490 | ||||
Deferred tax liabilities: | ||||||||
Fixed assets | $ | (26,800 | ) | $ | (21,984 | ) | ||
Prepaid expenses and other | (1,173) | (891) | ||||||
Net deferred tax asset | $ | 5,240 | $ | (385 | ) | |||
Change in net deferred tax asset: | ||||||||
Benefit (provision) for deferred taxes | $ | 2,704 | $ | (4,263 | ) | |||
Purchase accounting adjustments | — | 51 | ||||||
Unrecognized tax benefit adjustments | (207 | ) | (202 | ) | ||||
Components of other comprehensive income: | ||||||||
Pension and post retirement benefits | 2,986 | (387 | ) | |||||
Velocys investment | 58 | 248 | ||||||
Interest rate swap | 111 | 861 | ||||||
Other adjustments | (27 | ) | 3 | |||||
Total change in net deferred tax asset | $ | 5,625 | $ | (3,689 | ) | |||
During the fourth quarter of 2016, the Company early adopted ASU 2015-17, "Balance Sheet Classification of Deferred Taxes." ASU 2015-17 requires that all deferred tax assets and liabilities, along with any related valuation allowance, be classified as noncurrent on the Company’s consolidated balance sheet starting in 2017 for each jurisdiction. The Company elected to apply this standard prospectively for 2016 financial statements. As a result, prior periods were not retrospectively adjusted.
As required by FASB ASC Topic 740, the Company recognizes the financial statement benefit of a tax position only after determining that the relevant tax authority would more likely than not sustain the position. For tax positions meeting the more-likely-than-not threshold, the amount recognized in the financial statements is the largest benefit that has a greater than 50 percent likelihood of being realized upon ultimate settlement with the relevant tax authority.
72
SHILOH INDUSTRIES, INC.
NOTES TO CONSOLIDATED FINANCIAL STATEMENTS-(Continued)
Activities and balances of unrecognized tax benefits for 2016, 2015, and 2014 are summarized below:
Years Ended October 31, | |||||||||||
2016 | 2015 | 2014 | |||||||||
Balance at beginning of year | $ | 731 | $ | 1,068 | $ | 1,183 | |||||
Additions based on tax positions related to the current year | 48 | 125 | 35 | ||||||||
Additions for tax positions of prior years | — | 27 | — | ||||||||
Reductions based on tax positions related to the current year | — | (39 | ) | (5 | ) | ||||||
Reductions for tax positions of prior years | (53 | ) | — | (3 | ) | ||||||
Reductions as result of lapse of applicable statute of limitations | (165 | ) | (450 | ) | (142 | ) | |||||
Balance at end of year | $ | 561 | $ | 731 | $ | 1,068 | |||||
The total amount of unrecognized tax benefits that, if recognized, would affect the effective rate was $368 at October 31, 2016 and $480 at October 31, 2015. The Company recognizes interest accrued and penalties related to unrecognized tax benefits as part of income tax expense. The Company recognized $218 of benefit in 2016 and $163 of benefit in 2015 and an expense of $136 in 2014 for interest and penalties. The Company had accrued $513 at October 31, 2016 and $730 at October 31, 2015 for the payment of interest and penalties.
The Company is subject to income taxes in the U.S. federal jurisdiction, and various state, local and foreign jurisdictions. Tax regulations within each jurisdiction are subject to the interpretation of the related tax laws and regulations and require significant judgment to apply. With few exceptions, the Company is no longer subject to U.S. federal, state and local income tax examinations by tax authorities for the years ending prior to October 31, 2012 and no longer subject to non-U.S. income tax examinations for calendar years ending prior to December 31, 2009. The Company does not anticipate that within the next 12 months the total unrecognized tax benefits will significantly change due to the settlement of examinations and the expiration of statute of limitations.
A valuation allowance of $2,782 remains as of October 31, 2016 for deferred tax assets whose realization remains uncertain. The comparable amount of the valuation allowance at October 31, 2015 was $4,986. The net decrease in the valuation allowance of $2,204 relates to an increase of $622 related to state operating loss carry forwards, a decrease of $3,106 related to Swedish operating loss carry forwards during the current period, an decrease of $25 related to Netherlands operating loss carry forwards, an increase of $254 related to China operating loss carry forwards and an increase of $51 related to Hong Kong operating loss carry forwards.
The Company assesses both negative and positive evidence when measuring the need for a valuation allowance. A valuation allowance has been established by the Company due to the uncertainty of realizing certain loss carry forwards, other deferred tax assets and foreign tax credits in the United States and various foreign jurisdictions. The Company believes the remaining deferred tax assets will be realizable based on projected book income, the reversals of existing taxable temporary differences and available tax planning strategies that would be implemented and generate ordinary income in the United States or foreign jurisdictions to recognize the deferred tax assets. The Company intends to maintain the valuation allowance against certain deferred tax assets until such time that sufficient positive evidence exists to support realization of the deferred tax assets. In the event the Company were to determine that it would be able to realize its deferred tax assets in the future in excess of their net recorded amount, an adjustment to the deferred tax assets would increase income in the period such determination was made. Likewise, should the Company determine that it would not be able to realize all or part of its net deferred tax assets in the future, an adjustment to the deferred tax assets would be charged to income in the period such determination was made.
73
SHILOH INDUSTRIES, INC.
NOTES TO CONSOLIDATED FINANCIAL STATEMENTS-(Continued)
A reconciliation of the statutory federal income tax rate to the effective tax rate is as follows:
Years Ended October 31, | ||||||||
2016 | 2015 | 2014 | ||||||
Federal income tax at statutory rate | 35.0 | % | 35.0 | % | 35.0 | % | ||
State and local income taxes, net of federal benefit | (4.4 | ) | 4.7 | 0.6 | ||||
Valuation allowance change | 367.7 | 12.6 | (7.4 | ) | ||||
Domestic tax credits | 62.7 | (2.1 | ) | (1.1 | ) | |||
Domestic production activities deduction | 26.4 | (3.2 | ) | (2.9 | ) | |||
Foreign operations | (151.1 | ) | 13.2 | 0.7 | ||||
Revisions to prior period research and research and development tax credit calculations | — | — | (10.2 | ) | ||||
Adjustment of uncertain tax positions | 11.7 | (3.2 | ) | (1.0 | ) | |||
Provision to return adjustment for tax law extensions subsequent to year-end | (13.6 | ) | (13.0 | ) | (1.0 | ) | ||
Change in legislation - Mexico | — | — | 2.4 | |||||
Other | 13.1 | 0.4 | 2.1 | |||||
Effective income tax rate | 347.5 | % | 44.4 | % | 17.2 | % | ||
At October 31, 2016, the Company had operating loss carryforwards of $71,834 in Sweden, Netherlands, China, Hong Kong, Mexico and certain U.S. states. The Swedish foreign operating loss carry forward benefit is approximately $6,000 which can be carried forward indefinitely. The valuation allowance against the Swedish operating loss was released during the year. The foreign operating loss carry forward benefit for the Netherlands is $35 and has a full valuation allowance against it. This benefit can be carried forward for nine years. The Chinese operating loss carry forward benefit is $373 and has a full valuation allowance against it. This benefit can be carried forward for five years. The Hong Kong operating loss carry forward benefit is $51 and has a full valuation allowance against it. This benefit can be carried forward indefinitely.
In addition, the Company had Mexican foreign operating loss carry forwards of approximately $1,007 as of October 31, 2016, which will expire between 2019 - 2025. There is no valuation allowance against the Mexican operating loss as the Company expects to fully utilize the benefit within the carry forward period.
Domestically, the Company has various state net operating loss carryforward benefits. As of October 31, 2016 and 2015, the Company had state net operating loss carry forward benefits of $2,138 and $1,475 with a valuation allowance of $2,075 and$1,452, respectively that will expire between 2017 and 2036. The following table summarizes the various country operating losses, credit carryforwards and associated valuation allowances as of October 31, 2016 and 2015:
October 31, 2016 | October 31, 2015 | |||||||||||||||||||||||
Jurisdiction | NOL Carryforward | NOL Tax Benefit | Valuation Allowance | NOL Carryforward | NOL Tax Benefit | Valuation Allowance | ||||||||||||||||||
Netherlands | $ | 174 | $ | 35 | $ | 35 | 329 | 60 | 60 | |||||||||||||||
Sweden | 27,271 | 6,000 | — | 14,172 | 3,118 | 3,106 | ||||||||||||||||||
China | 1,494 | 373 | 373 | 478 | 120 | 120 | ||||||||||||||||||
Hong Kong | 206 | 51 | 51 | — | — | — | ||||||||||||||||||
Mexico | 3,358 | 1,007 | — | 4,234 | 1,270 | — | ||||||||||||||||||
U.S. (State) | 39,331 | 2,138 | 2,075 | 33,368 | 1,475 | 1,452 | ||||||||||||||||||
Total before Foreign Tax Credit | $ | 71,834 | $ | 9,604 | $ | 2,534 | $ | 52,581 | $ | 6,043 | $ | 4,738 | ||||||||||||
U.S. Federal (Foreign Tax Credit) | — | — | 248 | — | — | 248 | ||||||||||||||||||
Total | $ | 71,834 | $ | 9,604 | $ | 2,782 | $ | 52,581 | $ | 6,043 | $ | 4,986 | ||||||||||||
The Company had a net income tax refund of $5,855 in 2016 and paid income taxes, net of refunds, of $1,770 in 2015. U.S. income taxes and foreign withholding taxes are not provided on undistributed earnings of foreign subsidiaries because such
74
SHILOH INDUSTRIES, INC.
NOTES TO CONSOLIDATED FINANCIAL STATEMENTS-(Continued)
earnings are permanently reinvested in the operations. As of October 31, 2016, there was approximately $7,581 of undistributed foreign subsidiary earnings. The income tax liability that would result had such earnings been repatriated is estimated at $2,653.
Note 18—Accumulated Other Comprehensive Loss
The following table provides additional details of the amounts recognized into net earnings from accumulated other comprehensive loss, net of tax:
Pension and Post Retirement Plan Liability (1) | Marketable Securities Adjustment | Interest Rate Swap Adjustment (2) | Foreign Currency Translation Adjustment (3) | Accumulated Other Comprehensive Loss | |||||||||||||||||
Balance at October 31, 2014 | $ | (27,371 | ) | $ | 100 | $ | (1,558 | ) | $ | (8,052 | ) | $ | (36,881 | ) | |||||||
Other comprehensive loss | (2,265 | ) | (441 | ) | (2,051 | ) | (9,671 | ) | (14,428 | ) | |||||||||||
Amounts reclassified from accumulated other comprehensive loss, net of tax | 827 | — | 433 | — | 1,260 | ||||||||||||||||
Net current-period other comprehensive loss | (1,438 | ) | (441 | ) | (1,618 | ) | (9,671 | ) | (13,168 | ) | |||||||||||
Balance at October 31, 2015 | $ | (28,809 | ) | $ | (341 | ) | $ | (3,176 | ) | $ | (17,723 | ) | $ | (50,049 | ) | ||||||
Other comprehensive loss | (8,087 | ) | (125 | ) | (1,466 | ) | (3,031 | ) | (12,709 | ) | |||||||||||
Amounts reclassified from accumulated other comprehensive loss, net of tax | 4,237 | — | 1,530 | 529 | 6,296 | ||||||||||||||||
Net current-period other comprehensive loss | (3,850 | ) | (125 | ) | 64 | (2,502 | ) | (6,413 | ) | ||||||||||||
Balance at October 31, 2016 | $ | (32,659 | ) | $ | (466 | ) | $ | (3,112 | ) | $ | (20,225 | ) | $ | (56,462 | ) | ||||||
(1) Amounts reclassified from accumulated other comprehensive loss, net of tax are classified with manufacturing expenses included in cost of goods sold on the statements of income.
(2) Amounts reclassified from accumulated other comprehensive income loss, net of tax are classified with interest expense included on the statements of income.
(3) Amounts reclassified from accumulated other comprehensive income loss, net of tax are classified with other (income) expense, net included on the statements of income.
Note 19—Related Party Transactions
The Company had sales to MTD Products Inc. and its affiliates of $5,730, $6,411, and $6,756 for fiscal years 2016, 2015, and 2014, respectively. At October 31, 2016 and 2015, the Company had receivable balances of $1,235 and $1,092, respectively, due from MTD Products Inc. and its affiliates.
As of October 31, 2016, the Company had one joint venture in China. Operating activities have been insignificant and are not yet consolidated in the Company's statement of operations.
On March 11, 2014, the Company entered into a manufacturing agreement with Velocys. As part of the agreement, the Company invested $2,000, which is comprised of Velocys stock with a market value of $1,527 on the date of acquisition and a premium paid of $473, which is being amortized over the remaining life of the related supplier agreement. During fiscal 2014, the Company sold a portion of the Velocys stock and realized a gain of $365. The Company re-measures available-for-sale securities at fair value and records the unrealized gain or loss in other comprehensive income until realized. A cumulative mark-to-market favorable adjustment of $125, net of tax, was recorded as a gain to other comprehensive loss for the fiscal year ended October 31, 2016. A cumulative mark-to-market unfavorable adjustment of $441 net of tax, was recorded as a loss to other comprehensive income (loss) for the fiscal year ended October 31, 2015.
The Company had sales to Velocys of $12 and $1,372 for fiscal years 2016 and 2015, respectively. There were no sales for fiscal year 2014. At October 31, 2016, there was no balance due from Velocys.
Note 20—Business Segment Information
The Company conducts its business and reports its information as one operating segment - Automotive and Commercial Vehicles. The Chief Operating Decision Maker has been identified as the SLT, which includes all Vice Presidents plus the Chief Executive Officer of the Company as this team has the final authority over performance assessment and resource allocation
75
SHILOH INDUSTRIES, INC.
NOTES TO CONSOLIDATED FINANCIAL STATEMENTS-(Continued)
decisions. In determining that one operating segment is appropriate, the Company considered the nature of the business activities, the existence of managers responsible for the operating activities and information presented to the Board of Directors for its consideration and advice. Customers and suppliers are substantially the same in the automotive and commercial vehicle industry.
Revenues of foreign geographic regions are attributed to external customers based upon the location of the entity recording the sale. These foreign revenues represent 16.7%, 15.9%, and 10.8% of total revenues for fiscal years 2016, 2015 and 2014, respectively. Long-lived assets consist primarily of net property, plant and equipment, goodwill and intangibles.
Revenues | Long-Lived Assets | ||||||||||||||||||
2016 | 2015 | 2014 | 2016 | 2015 | 2014 | ||||||||||||||
United States | $ | 888,164 | $ | 901,182 | $ | 740,836 | $ | 253,160 | $ | 275,556 | $ | 265,975 | |||||||
Europe | 143,281 | 132,094 | 48,414 | 48,716 | 43,166 | 43,875 | |||||||||||||
Rest of World | 34,389 | 39,776 | 42,817 | 20,631 | 19,545 | 21,602 | |||||||||||||
Total Company | $ | 1,065,834 | $ | 1,073,052 | $ | 832,067 | $ | 322,507 | $ | 338,267 | $ | 331,452 | |||||||
The foreign currency gain or loss is included as a component of other income (expense) in the consolidated statements of income.
Foreign Currency Gain (Loss) | |||||||||
2016 | 2015 | 2014 | |||||||
Europe | $ | (802 | ) | $ | (23 | ) | $ | 109 | |
Rest of World | $ | (772 | ) | $ | (483 | ) | $ | (111 | ) |
The following details customers that accounted for more than 10% of the Company's revenues in fiscal 2016, 2015 and 2014:
Revenues | ||||||
Customer | 2016 | 2015 | 2014 | |||
FCA | 17.1 | % | 17.4 | % | 13.9 | % |
General Motors | 18.2 | % | 15.5 | % | 16.4 | % |
76
SHILOH INDUSTRIES, INC.
NOTES TO CONSOLIDATED FINANCIAL STATEMENTS-(Continued)
Note 21—Quarterly Results of Operations (Unaudited)
(amounts in thousands except per share data)
The following is a summary of the Company's consolidated quarterly results for each of the fiscal years ended October 31, 2016 and 2015:
For the Year Ended October 31, 2016 | First Quarter* | Second Quarter* | Third Quarter* | Fourth Quarter | ||||||||
Net revenues (1) | $251,055 | $284,264 | $248,832 | $281,683 | ||||||||
Gross profit | 15,889 | 26,281 | 23,910 | 30,096 | ||||||||
Operating income (loss) | (2,292 | ) | 8,724 | 5,798 | 6,240 | |||||||
Provision (benefit) for income taxes | (1,911 | ) | 364 | 1,344 | (4,949 | ) | ||||||
Net income (loss) | $(5,127) | $4,209 | $(678) | $5,265 | ||||||||
Net income (loss) per share basic | $(0.30) | $0.24 | $(0.04) | $0.31 | ||||||||
Net income (loss) per share diluted | $(0.30) | $0.24 | $(0.04) | $0.31 | ||||||||
Weighted average number of shares: | ||||||||||||
Basic | 17,342 | 17,615 | 17,614 | 17,614 | ||||||||
Diluted | 17,342 | 17,620 | 17,614 | 17,629 | ||||||||
For the Year Ended October 31, 2015 | First Quarter* | Second Quarter* | Third Quarter* | Fourth Quarter* | ||||||||
Net revenues (1) | $245,809 | $272,257 | $266,079 | $288,907 | ||||||||
Gross profit | 19,374 | 27,462 | 20,067 | 19,284 | ||||||||
Operating income (loss) | 5,127 | 9,916 | 7,335 | (1,514) | ||||||||
Provision for income taxes | 844 | 2,488 | 2,417 | (1,039 | ) | |||||||
Net income (loss) | $2,923 | $6,037 | $1,862 | $(4,917) | ||||||||
Net income (loss) per share basic | $0.17 | $0.35 | $0.11 | $(0.29) | ||||||||
Net income (loss) per share diluted | $0.17 | $0.35 | $0.11 | $(0.29) | ||||||||
Weighted average number of shares: | ||||||||||||
Basic | 17,215 | 17,211 | 17,227 | 17,292 | ||||||||
Diluted | 17,255 | 17,236 | 17,246 | 17,292 | ||||||||
* As revised to reflect the correction of immaterial errors - see Note 2 - Correction of Immaterial Errors
(1) See Note 1 - Summary of Significant Accounting Policies pertaining to reclassifications
Note 22—Commitments and Contingencies
Litigation
A securities class action lawsuit was filed on September 21, 2015 in the United States District Court for the Southern District of New York against the Company and certain of its officers (the President and Chief Executive Officer and Vice President of Finance and Treasurer). As amended, the lawsuit claims in part that the Company issued inaccurate information to investors about, among other things, the Company’s earnings and income and its internal controls over financial reporting for fiscal 2014 and the first and second fiscal quarters of 2015 in violation of the Securities Exchange Act of 1934. The amended complaint seeks an award of damages in an unspecified amount on behalf of a putative class consisting of persons who purchased the Company's common stock between January 12, 2015 and September 14, 2015, inclusive. The Company and such officers filed a Motion to Dismiss this lawsuit with the United States District Court for the Southern District of New York on April 18, 2016.
A shareholder derivative lawsuit was filed on April 1, 2016 in the Court of Common Pleas, Medina County, Ohio against the Company's President and Chief Executive Officer and Vice President of Finance and Treasurer and members of the Company’s Board of Directors. The lawsuit claims in part that the defendants breached their fiduciary duties owed to the Company by failing to exercise appropriate oversight over the Company's accounting controls, leading to the accounting issues and the restatement announced in September 2015. The complaint seeks a judgment against the individual defendants and in favor of the Company
77
for money damages, plus miscellaneous non-monetary relief. On May 2, 2016, the Court entered a stipulated order staying this case pending the outcome of the Motion to Dismiss in the securities class action lawsuit described in the previous paragraph.
In addition, from time to time, the Company is involved in legal proceedings, claims or investigations that are incidental to the conduct of its business. The Company vigorously defends itself against such claims. In future periods, the Company could be subject to cash costs or non-cash charges to earnings if a matter is resolved on unfavorable terms. However, although the ultimate outcome of any legal matter cannot be predicted with certainty, based on current information, including its assessment of the merits of the particular claims, the Company does not expect that its legal proceedings or claims will have a material impact on its future consolidated financial condition, results of operations or cash flows.
78
Item 9. | Changes in and Disagreements with Accountants on Accounting and Financial Disclosure. |
None.
Item 9A. Controls and Procedures.
Evaluation of Disclosure Controls and Procedures
The Company maintains a set of disclosure controls and procedures designed to ensure that information required to be disclosed by the Company in reports that it files or submits under the Securities Exchange Act of 1934 (Exchange Act), as amended, is recorded, processed, summarized and reported within the time periods specified in SEC rules and forms and that such information is accumulated and communicated to Management, including the Principal Executive Officer (“PEO”), Principal Financial Officer (“PFO”) and Principal Accounting Officer (“PAO”), as appropriate to allow for timely decisions regarding required disclosure. An evaluation was performed under the supervision and with the participation of the Company’s Management, including the PEO, PFO and PAO, of the effectiveness of the design and operation of the Company’s disclosure controls and procedures, as defined in Exchange Act Rule 13a-15(e) or Rule 15d-15(e) , as amended. The Company’s PEO, PFO and PAO concluded that the Company’s disclosure controls and procedures were not effective as of October 31, 2016 due to the material weakness described below.
Management's Report on Internal Control over Financial Reporting
Management of Shiloh is responsible for establishing and maintaining adequate internal control over financial reporting, as such term is defined in Exchange Act Rule 13a-15(f), and based upon criteria set forth by the Committee of Sponsoring Organizations of the Treadway Commission in the 2013 Internal Control - Integrated Framework (COSO framework). The Company’s internal control over financial reporting is a process designed to provide reasonable assurance regarding the reliability of its financial reporting and the preparation of the financial statements for external purposes in accordance with GAAP.
An effective internal control system, no matter how well designed, has inherent limitations, including the possibility of human error and circumvention or overriding of controls and therefore can provide only reasonable assurance with respect to reliable financial reporting. Because of its inherent internal control limitations, the Company’s internal control over financial reporting may not prevent or detect misstatements because of inherent limitations, including the possibility of human error, the circumvention or overriding of controls, or fraud. Effective internal controls can provide only reasonable assurance with respect to the preparation and fair presentation of financial statements.
A material weakness is a deficiency, or a combination of deficiencies, in internal control over financial reporting, such that there is a reasonable possibility that a material misstatement of the Company's annual or interim financial statements would not be prevented or detected on a timely basis.
In the fourth quarter of fiscal 2016, Management reviewed select balance sheet accounts of the Saltillo Mexico manufacturing facility. Based on those results, Management initiated an independent, detailed review of the financial controls and presentation. The independent review concluded the key financial controls were ineffective and the financial presentation lacked integrity based on a lack of timely and precise reconciliations of account balances and unsupported journal entries. The findings impacted the financial presentation resulting in a correction of previously issued financial results of the Company. Further, Management concluded that, based on Company-wide detailed testing of identified key controls, a material weakness in financial reporting existed at Saltillo, and was isolated to that manufacturing facility.
Company Management initiated a plan to remediate the deficiency described above to enhance its internal control over financial reporting. However, with close proximity to the fiscal year-end close, Management implemented several immediate enhancements in the Saltillo control environment and plant oversight, while defining a long-term remediation plan. Immediate changes included:
• | Management replaced one key operational leader, removed one key financial leader, and continues to evaluate additional changes, as needed. |
• | Increased Management oversight, including additional detailed balance sheet review and journal entry approval, through remediation and thereafter. |
• | Reinforcement of key internal controls continues through the Company’s oversight and review activities, as well as cross-facility utilization of personnel. |
79
Management will continue to evaluate the Company’s system of internal controls to determine if additional controls should be designed and implemented to address the material weakness identified above.
Under the supervision and with the participation of Management, including the Company’s PEO, PFO and PAO, the Company conducted an evaluation of the effectiveness of internal control over financial reporting as of October 31, 2016. With limited, initial remediation efforts completed, the proximity of the Company’s fiscal year-end precluded complete execution and final testing of the remediation.
Acknowledging the material weakness described above, Management concluded that the Company did not maintain effective internal control over financial reporting as of October 31, 2016, based on criteria described in Internal Control - Integrated Framework (2013) issued by COSO.
The Company is committed to maintaining a strong internal control environment and believes its remediation efforts represent immediate improvement in Saltillo’s controls. The control environment and identified key controls in effect will be reevaluated by Management as remediation steps are expected to be completed in the first half of fiscal 2017.
Item 9A includes herein below the adverse attestation report of Grant Thornton LLP on Shiloh Industries, Inc.’s internal control over financial reporting as of October 31, 2016.
Changes in Internal Control Over Financial Reporting
Except as described above in this section and in connection with the Company’s remediation plan, there were no other changes in the Company’s internal control over financial reporting during the three months ended October 31, 2016 that have materially affected, or are reasonably likely to materially affect, the Company’s internal control over financial reporting.
80
REPORT OF INDEPENDENT REGISTERED PUBLIC ACCOUNTING FIRM
Board of Directors and Shareholders
Shiloh Industries, Inc.
We have audited the internal control over financial reporting of Shiloh Industries, Inc. (a Delaware corporation) and subsidiaries (the “Company”) as of October 31, 2016, based on criteria established in the 2013 Internal Control-Integrated Framework issued by the Committee of Sponsoring Organizations of the Treadway Commission (COSO). The Company’s management is responsible for maintaining effective internal control over financial reporting and for its assessment of the effectiveness of internal control over financial reporting, included in the accompanying Management’s Report on Internal Control over Financial Reporting (“Management’s Report”). Our responsibility is to express an opinion on the Company’s internal control over financial reporting based on our audit.
We conducted our audit in accordance with the standards of the Public Company Accounting Oversight Board (United States). Those standards require that we plan and perform the audit to obtain reasonable assurance about whether effective internal control over financial reporting was maintained in all material respects. Our audit included obtaining an understanding of internal control over financial reporting, assessing the risk that a material weakness exists, testing and evaluating the design and operating effectiveness of internal control based on the assessed risk, and performing such other procedures as we considered necessary in the circumstances. We believe that our audit provides a reasonable basis for our opinion.
A company’s internal control over financial reporting is a process designed to provide reasonable assurance regarding the reliability of financial reporting and the preparation of financial statements for external purposes in accordance with generally accepted accounting principles. A company’s internal control over financial reporting includes those policies and procedures that (1) pertain to the maintenance of records that, in reasonable detail, accurately and fairly reflect the transactions and dispositions of the assets of the company; (2) provide reasonable assurance that transactions are recorded as necessary to permit preparation of financial statements in accordance with generally accepted accounting principles, and that receipts and expenditures of the company are being made only in accordance with authorizations of management and directors of the company; and (3) provide reasonable assurance regarding prevention or timely detection of unauthorized acquisition, use, or disposition of the company’s assets that could have a material effect on the financial statements.
Because of its inherent limitations, internal control over financial reporting may not prevent or detect misstatements. Also, projections of any evaluation of effectiveness to future periods are subject to the risk that controls may become inadequate because of changes in conditions, or that the degree of compliance with the policies or procedures may deteriorate.
A material weakness is a deficiency, or combination of control deficiencies, in internal control over financial reporting, such that there is a reasonable possibility that a material misstatement of the company’s annual or interim financial statements will not be prevented or detected on a timely basis. The following material weakness has been identified and included in management’s assessment.
In the fourth quarter of fiscal 2016, Management reviewed select balance sheet accounts of the Saltillo Mexico manufacturing facility. Based on those results, Management initiated an independent, detailed review of the financial controls and presentation. The independent review concluded the key financial controls were ineffective and the financial presentation lacked integrity based on a lack of timely and precise reconciliations of account balances and unsupported journal entries. Management concluded, based on Company-wide detailed testing of identified key controls, that a material weakness in financial reporting exists at Saltillo, and is isolated to that manufacturing facility
In our opinion, because of the effect of the material weakness described above on the achievement of the objectives of the control criteria, the Company has not maintained effective internal control over financial reporting as of October 31, 2016, based on criteria established in the 2013 Internal Control-Integrated Framework issued by COSO.
81
We also have audited, in accordance with the standards of the Public Company Accounting Oversight Board (United States), the consolidated financial statements of the Company as of and for the year ended October 31, 2016. The material weakness identified above was considered in determining the nature, timing, and extent of audit tests applied in our audit of the 2016 consolidated financial statements, and this report does not affect our report dated January 17, 2017, which expressed an unqualified opinion on those financial statements.
We do not express an opinion or any other form of assurance on the management’s statements referring to their remediation plans.
/s/ GRANT THORNTON LLP
Cleveland, Ohio
January 17, 2017
82
Item 9B. | Other Information. |
None.
The information regarding the Audit Committee of our Board of Directors and the information regarding audit committee financial experts are set forth under the caption “Board Meetings and Committees” in our Proxy Statement, which is incorporated herein by reference.
PART III
Item 10. Directors, Executive Officers and Corporate Governance.
Information with respect to Directors of the Company, as well as information regarding Section 16(a) Beneficial Ownership Compliance, is set forth in the Proxy Statement, which information is incorporated herein by reference. Information regarding the executive officers of the Company is included in Part I hereof under "Executive Officers of the Registrant". The information regarding the Audit Committee of the Company's Board of Directors and the information regarding audit committee financial experts are set forth under the caption "Committees of the Board" in its Proxy Statement, which is incorporated herein by reference.
The Company has adopted a code of ethics that applies to its PEO, PFO and Principal Accounting Officer as well as the other officers, directors and managers of the Company in accordance with the Marketplace Rules of the Nasdaq Stock Market. The code of ethics is available at the Company's website: www.shiloh.com.
Set forth below are the names and principal occupations of our non-employee directors.
Name | Principal Occupation | |
Curtis E. Moll | Former Chairman of the Board and Chief Executive Officer of MTD Products Inc., an outdoor power equipment manufacturer. | |
Cloyd J. Abruzzo | Former Director, President and Chief Executive Officer of Stoneridge, a global designer and manufacturer of electronic components, modules and systems for the commercial vehicle, automotive, off-highway and agricultural vehicle markets. | |
Jean A. Brunol | Director of Ashok Leyland Limited and Houghton International. Former Senior Vice President and Strategy Board Member of Federal-Mogul Corporation, a global supplier of products and services to manufacturers and servicers of vehicles and equipment to the automotive, marine, rail, aerospace, power generation and industrial markets. | |
George G. Goodrich | Executive in Residence at the Boler School of Business at John Carroll University since January 2003. Former partner and Director of Global Tax and Assistant Treasurer of Andersen Worldwide, an accounting firm. | |
Michael S. Hanley | Director of Borg Warner. Former Partner and Global Automotive Leader of Ernst & Young LLP, a professional services organization. | |
David J. Hessler | Senior Partner of Wegman, Hessler & Vanderburg, a law firm, since 1968. | |
Dieter Kaesgen | Director and President of MTD Holdings since March 2009. Former Special Assistant to the Chairman of the Board of MTD Products Inc., an outdoor power equipment manufacturer. | |
Robert J. King, Jr. | Former President and Chief Executive Officer of Park View Capital Corp. and Park View Federal Savings Bank, a national savings and loan bank. | |
Item 11. | Executive Compensation. |
Information with respect to executive compensation and the Report of the Company's Compensation Committee are set forth in the Proxy Statement, which information and report are incorporated herein by reference.
83
Item 12. | Security Ownership of Certain Beneficial Owners and Management and Related Stockholder Matters. |
Information with respect to security ownership of certain owners and management is set forth in the Proxy Statement, which information is incorporated herein by reference.
Summary of Equity Compensation Plans
(Amounts in number of shares and per share data)
Shown below is information concerning all equity compensation plans and individual compensation arrangements in effect as of October 31, 2016.
Equity Compensation Plan Information | |||||||||
Plan Category | Number of Securities To Be Issued Upon Exercise of Outstanding Options, Warrants and Rights (1) | Weighted Average Exercise Price of Number of Securities to be Issued Upon Exercise of Outstanding Options, Warrants and Rights (2) | Number of Securities Remaining Available For Future Issuance Under Equity Compensation Plans | ||||||
Equity compensation plans approved by security holders | 111,205 | $9.67 | 1,173,028 | ||||||
Equity compensation plans not approved by security holders | — | — | — | ||||||
Total | 111,205 | $9.67 | 1,173,028 | ||||||
(1) In addition to stock options, restricted stock units have been awarded under Shiloh's equity compensation plans and were outstanding at October 31, 2016
(2) Calculated without taking into account the 21,539 shares of common stock subject to outstanding restricted stock that become issuable as those units vest since they have no exercise price and no cash consideration or other payment is required for such shares.
For additional information regarding the Company's equity compensation plans, refer to the discussion in Note 16 to consolidated financial statements.
Item 13. | Certain Relationships and Related Transactions, and Director Independence. |
Information with respect to certain relationships and related transactions and director independence is set forth in the Proxy Statement, which information is incorporated herein by reference.
Item 14. | Principal Accountant Fees and Services. |
Information with respect to principal accountant fees and services is set forth in the Proxy Statement, which information is incorporated herein by reference.
84
PART IV
Item 15. | Exhibits and Financial Statement Schedules |
(a) The following documents are filed as a part of this Annual Report on Form 10-K under Item 8.
1. | Financial Statements. |
Reports of Independent Registered Public Accounting Firm | |
Consolidated Balance Sheets at October 31, 2016 and 2015. | |
Consolidated Statements of Income for the years ended October 31, 2016, 2015, and 2014. | |
Consolidated Statements of Other Comprehensive Income (Loss) for the years ended October 31, 2016, 2015, and 2014. | |
Consolidated Statements of Cash Flows for the years ended October 31, 2016, 2015, and 2014. | |
Consolidated Statements of Stockholders' Equity for the years ended October 31, 2016, 2015, and 2014. | |
Notes to Consolidated Financial Statements. | |
2. | Financial Statement Schedule. The following consolidated financial statement schedule of the Company and its subsidiaries and the report of the independent accountant thereon are filed as part of this Annual Report on Form 10-K and should be read in conjunction with the consolidated financial statements of the Company and its subsidiaries included in the Annual Report on Form 10-K. |
SCHEDULE II
VALUATION AND QUALIFYING ACCOUNTS AND RESERVES
Description | Balance at Beginning of Year | Additions (Reductions) Charged to Costs and Expenses | Deductions | Foreign Currency Adjustment | Purchase Accounting Adjustments | Balance at End of Year | ||||||||||||||||||||
Valuation allowance for accounts receivable | ||||||||||||||||||||||||||
Year ended | October 31, 2016 | $ | 821 | $ | (39 | ) | $ | 57 | $ | 36 | $ | — | $ | 761 | ||||||||||||
Year ended | October 31, 2015 | $ | 601 | $ | 210 | $ | 1 | $ | 11 | $ | — | $ | 821 | |||||||||||||
Year ended | October 31, 2014 | $ | 341 | $ | 153 | $ | 81 | $ | — | $ | 188 | $ | 601 | |||||||||||||
Valuation allowance for inventory reserves | ||||||||||||||||||||||||||
Year ended | October 31, 2016 | $ | 2,547 | $ | 1,210 | $ | 802 | $ | (9 | ) | $ | — | $ | 2,946 | ||||||||||||
Year ended | October 31, 2015 | $ | 2,051 | $ | 1,626 | $ | 1,120 | $ | (10 | ) | $ | — | $ | 2,547 | ||||||||||||
Year ended | October 31, 2014 | $ | 1,623 | $ | 488 | $ | 60 | $ | — | $ | — | $ | 2,051 | |||||||||||||
Valuation allowance for deferred tax assets | ||||||||||||||||||||||||||
Year ended | October 31, 2016 | $ | 4,986 | $ | (2,204 | ) | $ | — | $ | — | $ | — | $ | 2,782 | ||||||||||||
Year ended | October 31, 2015 | $ | 3,638 | $ | 1,348 | $ | — | $ | — | $ | — | $ | 4,986 | |||||||||||||
Year ended | October 31, 2014 | $ | 4,014 | $ | 980 | $ | 2,933 | $ | — | $ | 1,577 | $ | 3,638 | |||||||||||||
Schedules not listed above have been omitted because they are not applicable or are not required or the information required to be set forth therein is included in the consolidated financial statements or notes thereto.
3. Exhibits. The exhibits listed in the accompanying Exhibit Index and required by Item 601 of Regulation S-K (numbered in accordance with Item 601 of Regulation S-K) are filed as part of this Annual Report on Form 10-K.
85
SIGNATURES
Pursuant to the requirements of the Securities Exchange Act of 1934, the registrant has duly caused this report to be signed on its behalf by the undersigned, thereunto duly authorized.
Date: January 17, 2017
SHILOH INDUSTRIES, INC. | ||
By: | /s/ Ramzi Hermiz | |
Ramzi Hermiz | ||
President and Chief Executive Officer | ||
By: | /s/ W. Jay Potter | |
W. Jay Potter | ||
Senior Vice President and Chief Financial Officer | ||
Pursuant to the requirements of the Securities Exchange Act of 1934, this report has been signed below by the following persons on behalf of the registrant and the capabilities and on the dates indicated.
Signature | Title | Date | ||
/s/ RAMZI HERMIZ | President and Chief Executive Officer and Director (Principal Executive Officer) | |||
Ramzi Hermiz | January 17, 2017 | |||
/s/ W. JAY POTTER | Senior Vice President and Chief Financial Officer (Principal Financial Officer) | January 17, 2017 | ||
W. Jay Potter | ||||
/s/ GARY DETHOMAS | Vice President Corporate Controller (Principal Accounting Officer) | January 17, 2017 | ||
Gary DeThomas | ||||
* | Chairman and Director | January 17, 2017 | ||
Curtis E. Moll | ||||
* | Director | January 17, 2017 | ||
Cloyd Abruzzo | ||||
* | Director | January 17, 2017 | ||
Jean Brunol | ||||
* | Director | January 17, 2017 | ||
George G. Goodrich | ||||
* | Director | January 17, 2017 | ||
Michael S. Hanley | ||||
* | Director | January 17, 2017 | ||
David J. Hessler | ||||
* | Director | January 17, 2017 | ||
Dieter Kaesgen | ||||
* | Director | January 17, 2017 | ||
Robert J. King, Jr. | ||||
*The undersigned, by signing his name hereto, does sign and execute this Annual Report on Form 10-K pursuant to the Powers of Attorney executed by the above-named officers and Directors of the Company and filed with the Securities and Exchange Commission on behalf of such officers and Directors.
By: | /s/ Ramzi Y. Hermiz |
Ramzi Y. Hermiz, Attorney-In-Fact | |
January 17, 2017 | |
86
EXHIBIT INDEX
Exhibit No. | |||
3.1 | Restated Certificate of Incorporation of the Company is incorporated herein by reference to Exhibit 3.1(i) of the Company's Annual Report on Form 10-K for the fiscal year ended October 31, 1995 (Commission File No. 0-21964). | ||
3.2 | Certificate of Designation, dated December 31, 2001, authorizing the issuance of 100,000 shares of Series A Preferred Stock, par value $.01, is incorporated herein by reference to Exhibit 3.1(ii) of the Company's Annual Report on Form 10-K for the fiscal year ended October 31, 2001 (Commission File No. 0-21964). | ||
3.3 | Amended and Restated By-Laws of the Company, dated December 13, 2007 is incorporated herein by reference to Exhibit 3.1(iii) of the Company's Annual Report on Form 10-K for the fiscal year ended October 31, 2007 (Commission File No. 0-21964). | ||
3.4 | Amended and Restated Certificate of Incorporation of the Company, as amended, dated March 10, 2016, is incorporated herein by reference to Appendix B of the Company's Proxy Statement on Schedule 14A filed with the Commission on January 29, 2016 (Commission File No. 0-21964). | ||
4.1 | Specimen certificate for the Common Stock, par value $.01 per share, of the Company is incorporated herein by reference to Exhibit 4.1 of the Company's Annual Report on Form 10-K for the fiscal year ended October 31, 1995 (Commission File No. 0-21964). | ||
4.2 | Registration Rights Agreement, dated June 22, 1993, by and among the Company, MTD Products Inc and the stockholders named therein is incorporated herein by reference to Exhibit 4.3 of the Company's Annual Report on Form 10-K for the fiscal year ended October 31, 1995 (Commission File No. 0-21964). | ||
10.1* | Form of Incentive Stock Option Agreement is incorporated herein by reference to Exhibit 10.2 of the Company's Annual Report on Form 10-K for the fiscal year ended October 31, 2004 (Commission File No. 0-21964). | ||
10.2* | Form of Nonqualified Stock Option Agreement is incorporated herein by reference to Exhibit 10.3 of the Company's Annual Report on Form 10-K for the fiscal year ended October 31, 2004 (Commission File No. 0-21964). | ||
10.3* | Shiloh Industries, Inc. Senior Management Bonus Plan is incorporated herein by reference to Exhibit B of the Company's Proxy Statement on Schedule 14A for the fiscal year ended October 31, 2004 (Commission File No. 0-21964). | ||
10.4* | Amended and Restated 1993 Key Employee Stock Incentive Plan (as Amended and Restated as of December 10, 2009) is incorporated herein by reference to Exhibit A of the Company's Proxy Statement on Schedule 14A for the fiscal year ended October 31, 2009 (Commission File No. 0-21964). | ||
10.5* | Senior Management Bonus Plan is incorporated herein by reference to Exhibit B of the Company's Proxy Statement on Schedule 14A for the fiscal year ended October 31, 2009 (Commission File No. 0-21964). | ||
10.6* | First Amendment to the Shiloh Industries, Inc. Senior Management Incentive Plan is incorporated herein by reference to Exhibit A of the Company's Proxy Statement on Schedule 14A for the fiscal year ended October 31, 2013 (Commission File No. 0-21964). | ||
10.7 | Indemnification Agreement between Directors and Officers and Shiloh Industries, Inc., dated February 5, 2007, is incorporated herein by reference to Exhibit 10.21 of the Company's Quarterly Report on Form 10-Q for the quarter ended April 30, 2007 (Commission File No. 0-21964). | ||
10.8 | Change in Control Severance Agreement between Thomas M. Dugan and Shiloh Industries, Inc., dated August 25, 2011, is incorporated herein by reference to Exhibit 10.1 of the Company's Current Report on Form 8-K filed with the Commission on August 26, 2011 (Commission File No. 0-21964). | ||
10.9 | Appointment of Ramzi Hermiz as President and Chief Executive Officer of Shiloh Industries, Inc., dated August 23, 2012 is incorporated herein by reference to Exhibit 10.1 of the Company's Current Report on Form 8-K filed with the Commission on August 29, 2012 (Commission File No. 0-21964). | ||
10.10 | Change in Control Severance Agreement between Ramzi Y. Hermiz and Shiloh Industries, Inc., dated August 23, 2012, is incorporated herein by reference to Exhibit 10.20 of the Company's Current Report on Form 8-K filed with the Commission on August 29, 2012 (Commission File No. 0-21964). | ||
10.11 | First Amendment to Change in Control Agreement between Thomas M. Dugan and Shiloh Industries, Inc., dated December 19, 2012, is incorporated herein by reference to Exhibit 10.21 of the Company's Current Report on Form 10-K filed with the Commission on December 21, 2012 (Commission File No. 0-21964). | ||
87
Exhibit No. | |||
10.12 | Credit Agreement dated as of October 25, 2013 with Bank of America, N.A., as Administrative Agent, Swing Line Lender and L/C Issuer, Merrill Lynch, Pierce, Fenner & Smith Incorporated and J.P. Morgan Securities, LLC as Joint Lead Arrangers and Joint Book Managers, The PrivateBank and Trust Company, Compass Bank and RBS Citizens, N.A., as Co-Documentation Agents, and the other lender parties thereto, is incorporated herein by reference to Exhibit 10.24 of the Company's Current Report on Form 8-K filed with the Commission on October 25, 2013 (Commission File No. 0-21964). | ||
10.13 | First Amendment Agreement dated as of December 30, 2013 with Bank of America, N.A., as Administrative Agent, Swing Line Lender and L/C Issuer, Merrill Lynch, Pierce, Fenner & Smith Incorporated and J.P. Morgan Securities, LLC as Joint Lead Arrangers and Joint Book Managers, The PrivateBank and Trust Company, Compass Bank and RBS Citizens, N.A., as Co-Documentation Agents, and the other lender parties thereto, is incorporated herein by reference to Exhibit 10.1 of the Company's Current Report on Form 8-K filed with the Commission on December 30, 2013 (Commission File No. 0-21964). | ||
10.14 | Share Sale and Purchase Agreement, dated May 21, 2014, among the subsidiary and Finnveden AB, a company limited by shares incorporated in Sweden, Shiloh Holdings Sweden AB, company limited by shares incorporated in Sweden, and FinnvedenBulten AB, a company limited by shares incorporated in Sweden, is incorporated herein by reference to Exhibit 10.1 of the Company's Current Report on Form 10-Q filed with the Commission on December 30, 2013 (Commission File No. 0-21964). | ||
10.15 | Second Amendment Agreement, dated as of June 26, 2014 with Bank of America, N.A., as Administrative Agent, Swing Line Lender and L/C Issuer, Merrill Lynch, Pierce, Fenner & Smith Incorporated and J.P. Morgan Securities, LLC as Joint Lead Arrangers and Joint Book Managers, The PrivateBank and Trust Company, Compass Bank and RBS Citizens, N.A., as Co-Documentation Agents, and the other lender parties thereto, is incorporated herein by reference to Exhibit 10.1 of the Company's Current Report on Form 8-K filed with the Commission on July 2, 2014 (Commission File No. 0-21964). | ||
10.16 | Third Amendment Agreement, dated September 29, 2014, among Shiloh Industries, Inc. and Shiloh Holdings Netherlands B.V., a besloten vennootschap met beperkte aansprakelijkheid organized under the laws of the Netherlands with Bank of America, N.A., as Administrative Agent, Swing Line Lender, Dutch Swing Line Lender and an L/C Issuer, JPMorgan Chase Bank, N.A. as Syndication Agent, Merrill Lynch, Pierce, Fenner & Smith Incorporated and J.P. Morgan Securities, LLC as Joint Lead Arrangers and Joint Book Managers, The PrivateBank and Trust Company, Compass Bank and Citizens Bank, N.A., as Co-Documentation Agents, and the other lender parties thereto, is incorporated herein by reference to Exhibit 10.1 of the Company's Current Report on Form 8-K filed with the Commission on October 1, 2014 (Commission File No. 0-21964). | ||
10.17 | Asset Purchase Agreement, dated September 30, 2014, among the Company, Radar Industries, Inc., and Radar Mexican Investments, LLC, is incorporated herein by reference to Exhibit 10.1 of the Company's Current Report on Form 8-K filed with the Commission on October 1, 2014 (Commission File No. 0-21964). | ||
10.18 | Fourth Amendment Agreement, dated April 29, 2015, among Shiloh Industries, Inc. and Shiloh Holdings Netherlands B.V., a besloten vennootschap met beperkte aansprakelijkheid organized under the laws of the Netherlands, with Bank of America, N.A., as Administrative Agent, Swing Line Lender, Dutch Swing Line Lender and an L/C Issuer, JPMorgan Chase Bank, N.A. as Syndication Agent, Merrill Lynch, Pierce, Fenner & Smith Incorporated and J.P. Morgan Securities, LLC as Joint Lead Arrangers and Joint Book Managers, The PrivateBank and Trust Company, Compass Bank and Citizens Bank, N.A., as Co-Documentation Agents, and the other lender parties thereto, is incorporated herein by reference to Exhibit 10.1 of the Company's Current Report on Form 10-Q filed with the Commission on June 5, 2015 (Commission File No. 0-21964). | ||
10.19 | Fifth Amendment Agreement dated October 30, 2015, among Shiloh Industries, Inc. and Shiloh Holdings Netherlands B.V., a besloten vennootschap met beperkte aansprakelijkheid organized under the laws of the Netherlands, with Bank of America, N.A., as Administrative Agent, Swing Line Lender, Dutch Swing Line Lender and an L/C Issuer, JPMorgan Chase Bank, N.A., as Syndication Agent, Merrill Lynch, Pierce, Fenner & Smith Incorporated and J.P. Morgan Securities, LLC, as Joint Lead Arrangers and Joint Book Managers, The PrivateBank and Trust Company, Compass Bank and Citizens Bank, N.A., as Co-Documentation Agents, and the other lender parties thereto, is incorporate herein by reference to Exhibit 1.1 of the Company's Current Report on Form 8-K/A filed with the Commission on November 6, 2015 (Commission File No. 0-21964). | ||
10.20* | Employment Agreement by and between the Company and W. Jay Potter dated as of December 16, 2015 is incorporated herein by reference to Exhibit 10.1 of the Company's Current Report on Form 10-Q filed with the Commission on March 3, 2016 (Commission File No. 0-21964). | ||
10.21* | Shiloh Industries, Inc. 2016 Equity and Incentive Compensation Plan is incorporated herein by reference to Appendix A of the Company's Definitive Proxy Statement on Schedule 14A filed with the Commission on January 29, 2016 (Commission File No. 0-21964). | ||
88
Exhibit No. | |||
10.22 | Sixth Amendment Agreement dated October 28, 2016, among Shiloh Industries, Inc. and Shiloh Holdings Netherlands B.V., a besloten vennootschap met beperkte aansprakelijkheid organized under the laws of the Netherlands, with Bank of America, N.A., as Administrative Agent, Swing Line Lender, Dutch Swing Line Lender and an L/C Issuer, JPMorgan Chase Bank, N.A., as Syndication Agent, Merrill Lynch, Pierce, Fenner & Smith Incorporated and J.P. Morgan Securities, LLC, as Joint Lead Arrangers and Joint Book Managers, The PrivateBank and Trust Company, Compass Bank and The Huntington National Bank, N.A., as Co-Documentation Agents, and the other lender parties thereto.** | ||
10.23* | Letter Agreement dated as of November 1, 2016 between Shiloh Industries, Inc. and Jean Brunol. ** | ||
21.1 | Subsidiaries of the Company. ** | ||
23.1 | Consent of Grant Thornton LLP. ** | ||
24.1 | Power of Attorney. ** | ||
31.1 | Principal Executive Officer's Certification pursuant to Section 302 of the Sarbanes-Oxley Act of 2002. ** | ||
31.2 | Principal Financial Officer's Certification pursuant to Section 302 of the Sarbanes-Oxley Act of 2002. ** | ||
32.1 | Certification pursuant to 18 U.S.C. Section 1350, as adopted pursuant to Section 906 of the Sarbanes-Oxley Act of 2002. ** | ||
100.1 | The following materials from Shiloh Industries, Inc's Annual Report on 10-K for the year ended October 31, 2016, formatted in XBRL (Extensible Business Reporting Language): (i) the Consolidated Balance Sheets, (ii) the Consolidated Statements of Income, (iii) the Consolidated Statement of Comprehensive Income (Loss), (iv) the Consolidated Statement of Cash Flows, (v) the Consolidated Statement of Stockholders' Equity and (vi) Notes to the Consolidated Financial Statements. ** | ||
* Reflects management contract or other compensatory arrangement required to be filed as an exhibit pursuant to Item 15(b) of this Report.
** Filed herewith.
89