Attached files
| file | filename |
|---|---|
| EX-99.2 - EX-99.2 - REX ENERGY CORP | d236527dex992.htm |
| EX-99.1 - EX-99.1 - REX ENERGY CORP | d236527dex991.htm |
| 8-K - FORM 8-K - REX ENERGY CORP | d236527d8k.htm |
2017 - 2018 Two-Year Outlook Exhibit 99.3
Cautionary Statements Forward Looking Statements Statements in this presentation that are not historical facts are “forward-looking statements” within the meaning of Section 27A of the Securities Act of 1933, as amended, and Section 21E of the Securities Exchange Act of 1934, as amended. We believe these statements and the assumptions and estimates contained in this presentation are reasonable based on information that is currently available to us. However, management’s assumptions and the company’s future performance are subject to a wide range of business risks and uncertainties, both known and unknown, and we cannot assure that the company can or will meet the goals, expectations and projections included in this presentation. Specifically, readers are cautioned that the projections, estimates, and assumptions contained in our 2017-2018 operational and financial plan are, in each case, forward-looking statements, and that future developments could significantly change the plan. Any number of factors could cause our actual results to be materially different from those expressed or implied in our forward-looking statements, including (without limitation): economic conditions in the United States and globally; domestic and global demand for oil and natural gas; volatility in oil, gas and natural gas liquids pricing; new or changing government regulations; uncertainties inherent in the estimates of our oil and natural gas reserves; our ability to increase natural gas production and income through exploration and development; drilling and operating risks; the success of our drilling techniques in unconventional reservoirs; the number of potential well locations to be drilled, the cost to drill them, and the time frame within which they will be drilled; the ability of contractors to timely and adequately perform their drilling, construction, well stimulation, completion and production services; the availability of equipment, such as drilling rigs, and infrastructure, such as transportation pipelines; the effects of adverse weather or other natural disasters on our operations; competition in the oil and gas industry in general, and specifically in our areas of operation; changes in the company’s drilling plans and related budgets; the success of prospect development and property acquisition; the success of our business and financial strategies, and hedging strategies; conditions in the domestic and global capital and credit markets and their effects on us; the adequacy and availability of capital resources, credit and liquidity including (without limitation) access to additional borrowing capacity; and uncertainties related to the legal and regulatory environment for our industry, and our own legal proceeding and their outcome. Further information on the risks and uncertainties that may effect our business and our plans are available in the company’s filings with the SEC; we strongly encourage readers to review and understand those risks. Rex Energy does not assume or undertake any obligation to publicly update or revise and forward-looking statements, whether as a result of new information, future events, or otherwise. 2
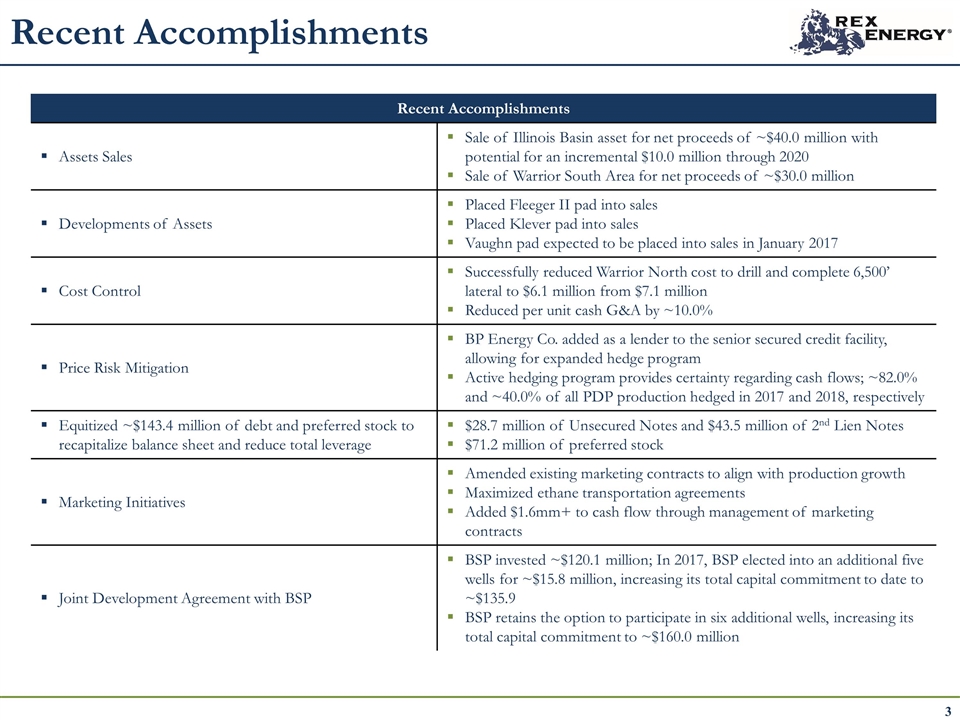
Recent Accomplishments Recent Accomplishments Assets Sales Sale of Illinois Basin asset for net proceeds of ~$40.0 million with potential for an incremental $10.0 million through 2020 Sale of Warrior South Area for net proceeds of ~$30.0 million Developments of Assets Placed Fleeger II pad into sales Placed Klever pad into sales Vaughn pad expected to be placed into sales in January 2017 Cost Control Successfully reduced Warrior North cost to drill and complete 6,500’ lateral to $6.1 million from $7.1 million Reduced per unit cash G&A by ~10.0% Price Risk Mitigation BP Energy Co. added as a lender to the senior secured credit facility, allowing for expanded hedge program Active hedging program provides certainty regarding cash flows; ~82.0% and ~40.0% of all PDP production hedged in 2017 and 2018, respectively Equitized ~$143.4 million of debt and preferred stock to recapitalize balance sheet and reduce total leverage $28.7 million of Unsecured Notes and $43.5 million of 2nd Lien Notes $71.2 million of preferred stock Marketing Initiatives Amended existing marketing contracts to align with production growth Maximized ethane transportation agreements Added $1.6mm+ to cash flow through management of marketing contracts Joint Development Agreement with BSP BSP invested ~$120.1 million; In 2017, BSP elected into an additional five wells for ~$15.8 million, increasing its total capital commitment to date to ~$135.9 BSP retains the option to participate in six additional wells, increasing its total capital commitment to ~$160.0 million
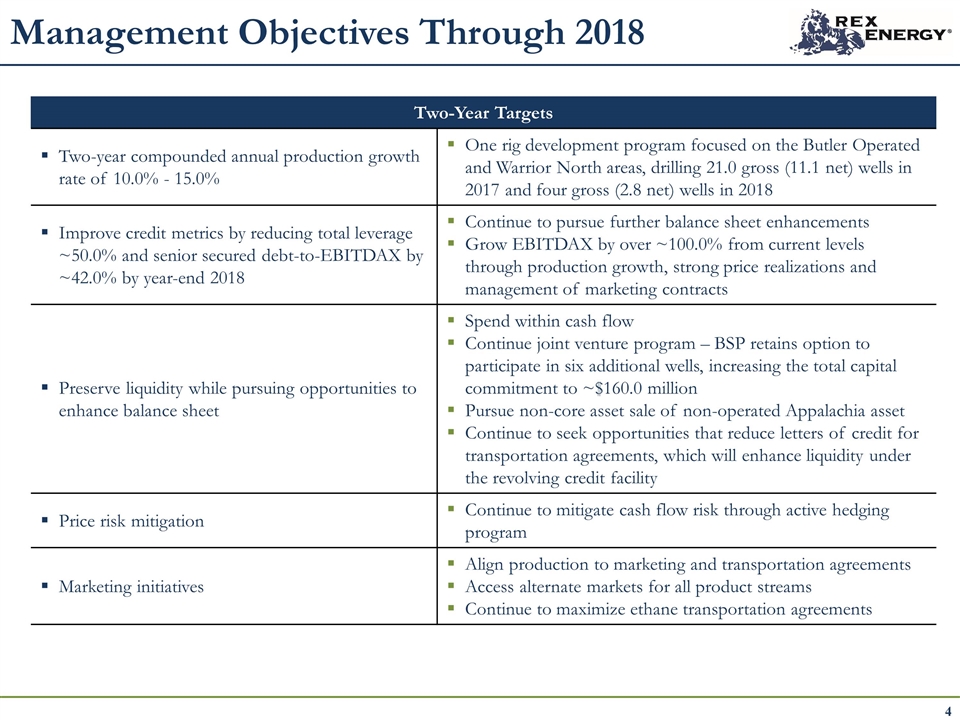
Management Objectives Through 2018 Two-Year Targets Two-year compounded annual production growth rate of 10.0% - 15.0% One rig development program focused on the Butler Operated and Warrior North areas, drilling 21.0 gross (11.1 net) wells in 2017 and four gross (2.8 net) wells in 2018 Improve credit metrics by reducing total leverage ~50.0% and senior secured debt-to-EBITDAX by ~42.0% by year-end 2018 Continue to pursue further balance sheet enhancements Grow EBITDAX by over ~100.0% from current levels through production growth, strong price realizations and management of marketing contracts Preserve liquidity while pursuing opportunities to enhance balance sheet Spend within cash flow Continue joint venture program – BSP retains option to participate in six additional wells, increasing the total capital commitment to ~$160.0 million Pursue non-core asset sale of non-operated Appalachia asset Continue to seek opportunities that reduce letters of credit for transportation agreements, which will enhance liquidity under the revolving credit facility Price risk mitigation Continue to mitigate cash flow risk through active hedging program Marketing initiatives Align production to marketing and transportation agreements Access alternate markets for all product streams Continue to maximize ethane transportation agreements
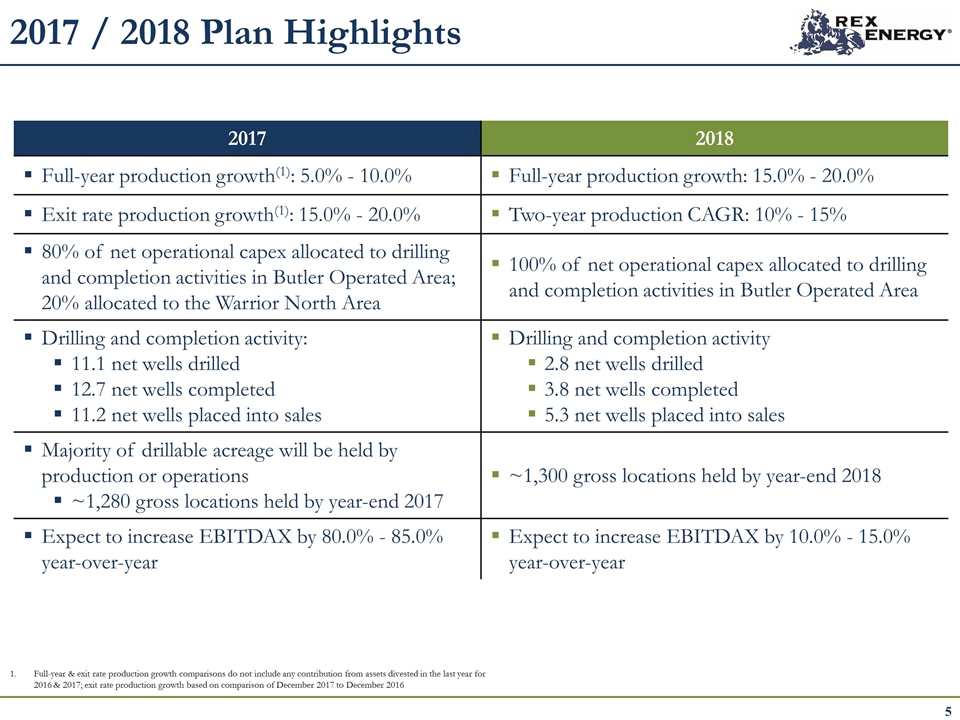
2017 / 2018 Plan Highlights Full-year & exit rate production growth comparisons do not include any contribution from assets divested in the last year for 2016 & 2017; exit rate production growth based on comparison of December 2017 to December 2016 2017 2018 Full-year production growth(1): 5.0% - 10.0% Full-year production growth: 15.0% - 20.0% Exit rate production growth(1): 15.0% - 20.0% Two-year production CAGR: 10% - 15% 80% of net operational capex allocated to drilling and completion activities in Butler Operated Area; 20% allocated to the Warrior North Area 100% of net operational capex allocated to drilling and completion activities in Butler Operated Area Drilling and completion activity: 11.1 net wells drilled 12.7 net wells completed 11.2 net wells placed into sales Drilling and completion activity 2.8 net wells drilled 3.8 net wells completed 5.3 net wells placed into sales Majority of drillable acreage will be held by production or operations ~1,280 gross locations held by year-end 2017 ~1,300 gross locations held by year-end 2018 Expect to increase EBITDAX by 80.0% - 85.0% year-over-year Expect to increase EBITDAX by 10.0% - 15.0% year-over-year
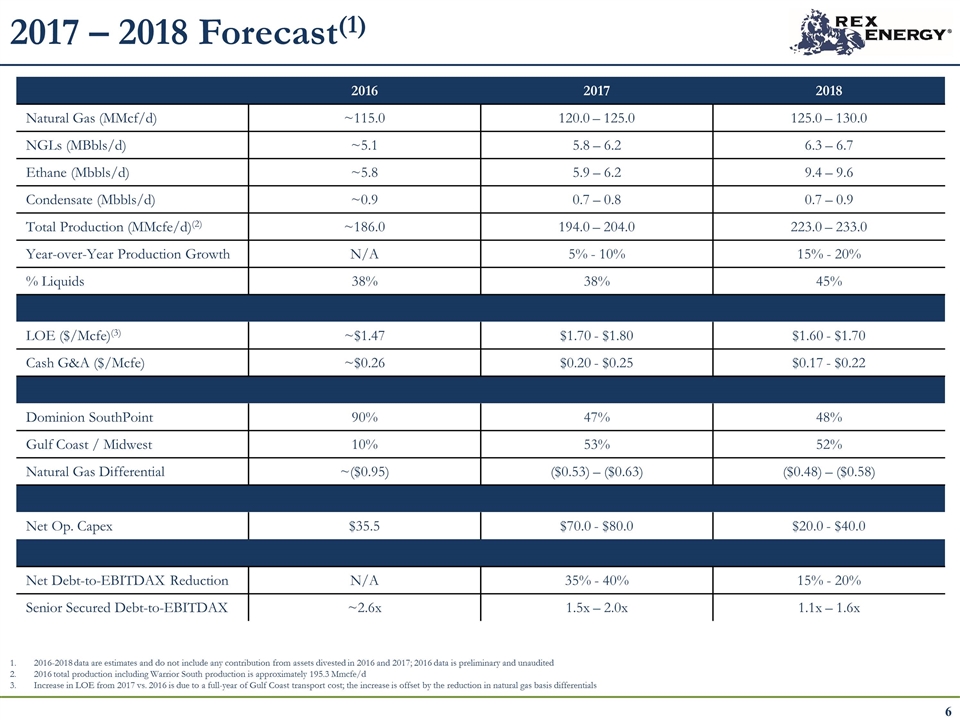
2017 – 2018 Forecast(1) 2016 2017 2018 Natural Gas (MMcf/d) ~115.0 120.0 – 125.0 125.0 – 130.0 NGLs (MBbls/d) ~5.1 5.8 – 6.2 6.3 – 6.7 Ethane (Mbbls/d) ~5.8 5.9 – 6.2 9.4 – 9.6 Condensate (Mbbls/d) ~0.9 0.7 – 0.8 0.7 – 0.9 Total Production (MMcfe/d)(2) ~186.0 194.0 – 204.0 223.0 – 233.0 Year-over-Year Production Growth N/A 5% - 10% 15% - 20% % Liquids 38% 38% 45% LOE ($/Mcfe)(3) ~$1.47 $1.70 - $1.80 $1.60 - $1.70 Cash G&A ($/Mcfe) ~$0.26 $0.20 - $0.25 $0.17 - $0.22 Dominion SouthPoint 90% 47% 48% Gulf Coast / Midwest 10% 53% 52% Natural Gas Differential ~($0.95) ($0.53) – ($0.63) ($0.48) – ($0.58) Net Op. Capex $35.5 $70.0 - $80.0 $20.0 - $40.0 Net Debt-to-EBITDAX Reduction N/A 35% - 40% 15% - 20% Senior Secured Debt-to-EBITDAX ~2.6x 1.5x – 2.0x 1.1x – 1.6x 2016-2018 data are estimates and do not include any contribution from assets divested in 2016 and 2017; 2016 data is preliminary and unaudited 2016 total production including Warrior South production is approximately 195.3 Mmcfe/d Increase in LOE from 2017 vs. 2016 is due to a full-year of Gulf Coast transport cost; the increase is offset by the reduction in natural gas basis differentials
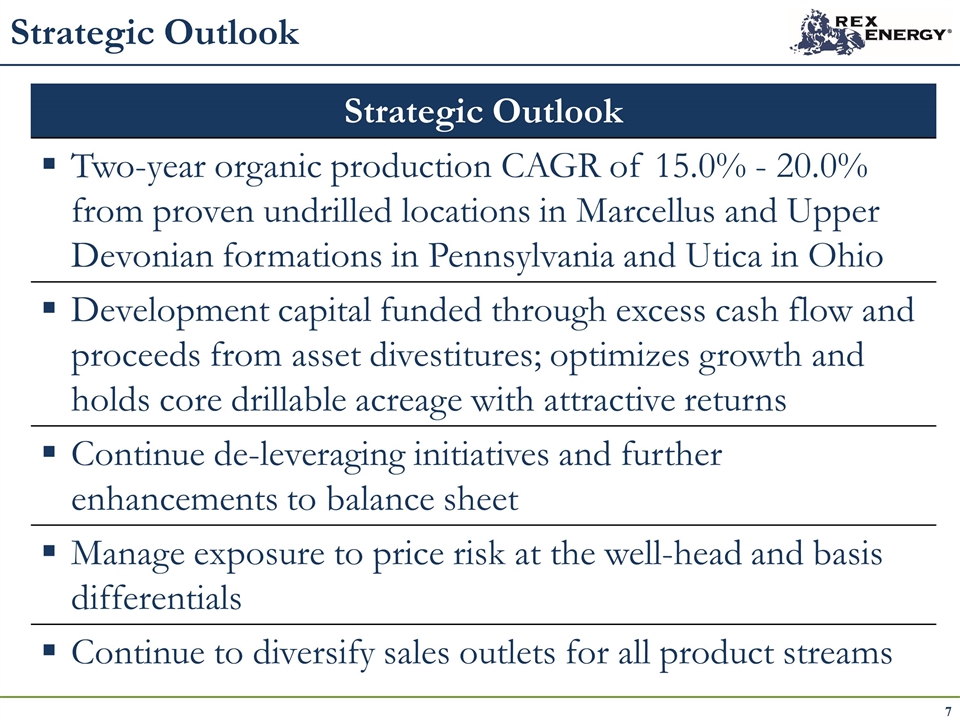
Strategic Outlook Strategic Outlook Two-year organic production CAGR of 15.0% - 20.0% from proven undrilled locations in Marcellus and Upper Devonian formations in Pennsylvania and Utica in Ohio Development capital funded through excess cash flow and proceeds from asset divestitures; optimizes growth and holds core drillable acreage with attractive returns Continue de-leveraging initiatives and further enhancements to balance sheet Manage exposure to price risk at the well-head and basis differentials Continue to diversify sales outlets for all product streams
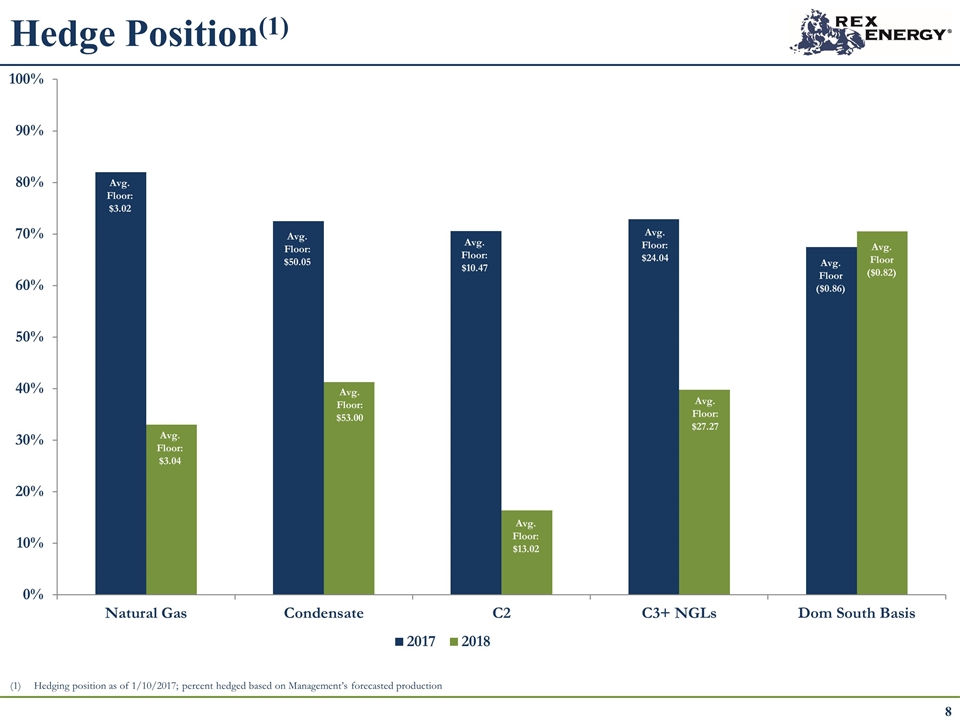
Hedge Position(1) Hedging position as of 1/10/2017; percent hedged based on Management’s forecasted production 8
