Attached files
| file | filename |
|---|---|
| EX-99.1 - EXHIBIT 99.1 - WEST MARINE INC | v456645_ex99-1.htm |
| 8-K - FORM 8-K - WEST MARINE INC | v456645_8k.htm |
Exhibit 99.2

Matt Hyde - CEO | Jeff Lasher - CFO 2017 ICR Conference
You should be aware that certain written and oral statements made in, or pursuant to, this presentation may constitute “forward - looking statements” within the meaning of the safe harbor provisions of the United States Private Securities Litigation Reform Act of 1995 . Forward - looking statements are neither historical facts nor assurances of future performance . Instead, they are based only on management's beliefs and future plans, events, expectations, objectives, performance and other future conditions, as well as assumptions made by, and information currently available to, management . Because forward - looking statements are based on expectations as to future financial and operating results and are not statements of fact, they are subject to inherent uncertainties, risks, and changes in circumstances that are difficult to predict and many of which are outside of the West Marine’s control, including those risks and uncertainties described in West Marine’s latest Annual Report on Form 10 - K and other reports filed with the SEC which should be reviewed carefully . Our actual results and financial conditions may differ materially from those indicated in the forward - looking statements and therefore you should not place undue reliance upon any of these forward - looking statements . The information provided in this presentation is based upon the facts and circumstances known at this time, and any forward - looking statements made in, or pursuant to, this presentation speak only as of the date of this presentation . West Marine assumes no responsibility to update any forward - looking statements as a result of new information, future events or otherwise . Safe Harbor Statement
3 Recognized as a Leading Waterlife Outfitter Omni - Channel: Professional, Retail and e - Commerce Highly Recognized Brands Growing and More Youthful Customer Base

4 A Leading Waterlife Outfitter R ecognized as a leading Waterlife Outfitter for cruisers, sailors, anglers and paddlesports enthusiasts Specialty retailer with more than 250 stores and an e - Commerce website Three major distribution methods: Retail store, professional delivery and e - Commerce direct to consumer Strong brand recognition, which can be expanded into merchandise outside of traditional core boat parts and accessories Investment Highlights

5 Recognized Waterlife Outfitter

6 Passionate & Loyal Customers We are Evolving to Better S erve the Waterlife /Non - Boating Customer ▪ Affluent average household income ▪ West Advantage Gold Customer AOV of $115 ▪ Best customers shop on average 7.5 times per year
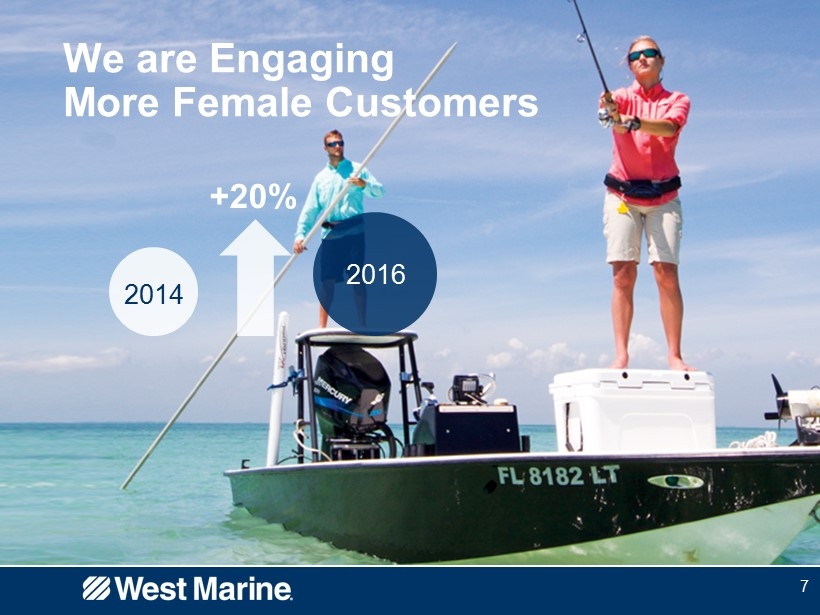
We are Engaging More Female Customers 2016 +20% 7 2014
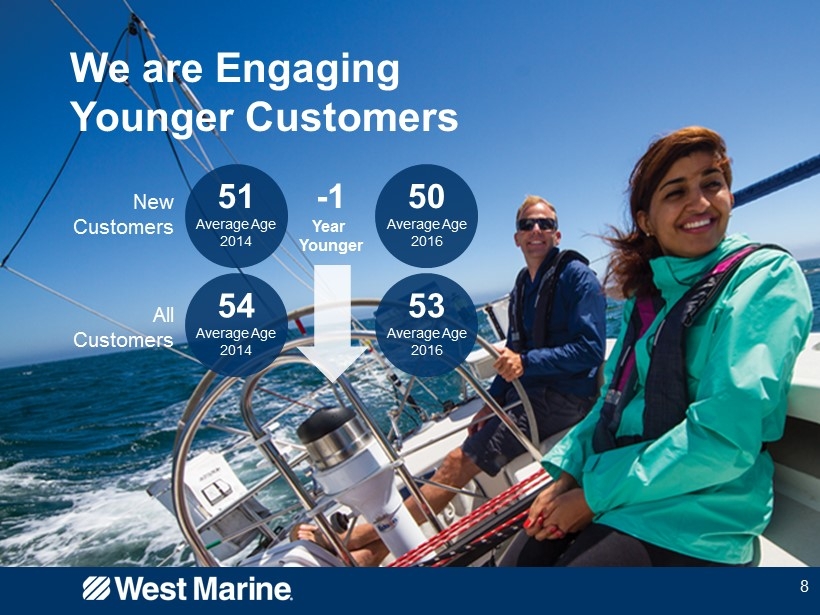
8 We are Engaging Younger Customers New Customers All Customers 51 Average Age 2014 54 Average Age 2014 50 Average Age 2016 53 Average Age 2016 - 1 Year Younger

9 Customer Count Active Customers defined as customers who purchased within the last 12 months

10 Merchandise Expansion Real Estate Optimization e - Commerce Professional Business Established Clear Strategic Actions ▪ Broadened merchandise mix and assortment ▪ Attract new types of customers ▪ Introduce new brands and activities ▪ New Waterlife store concept and experience ▪ Market consolidation ▪ Existing store revitalizations ▪ Increased product breadth and a ssortment ▪ Improved homepage design and website content ▪ Improved website functionality ▪ Focused on margin improvement ▪ Improved pricing matrix ▪ Optimized distribution ▪ Rebranded from Port Supply to West Marine Pro Strategic Objectives

11 I. Merchandise Expansion
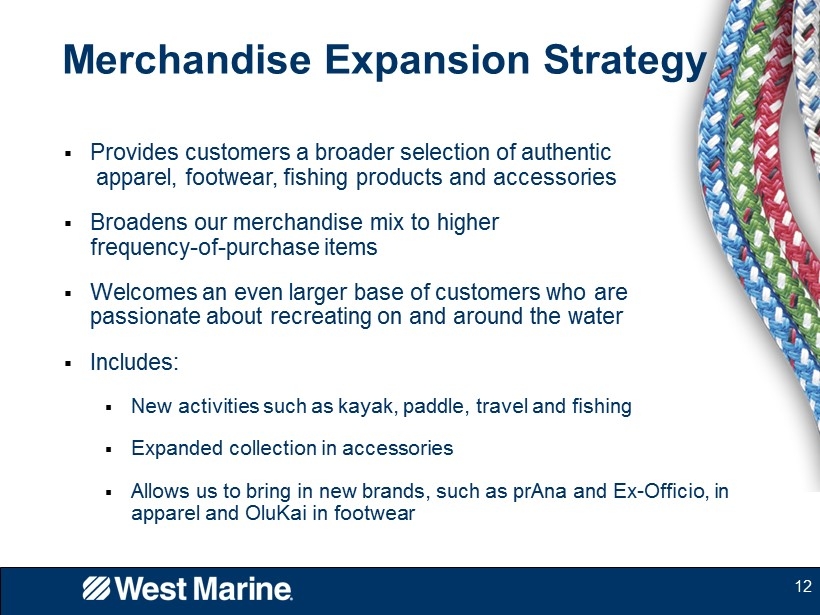
12 ▪ Provides customers a broader selection of authentic apparel, footwear, fishing products and accessories ▪ Broadens our merchandise mix to higher frequency - of - purchase items ▪ Welcomes an even larger base of customers who are passionate about recreating on and around the water ▪ Includes: ▪ New activities such as kayak, paddle, travel and fishing ▪ Expanded collection in accessories ▪ Allows us to bring in new brands, such as prAna and Ex - Officio, in apparel and OluKai in footwear Merchandise Expansion Strategy
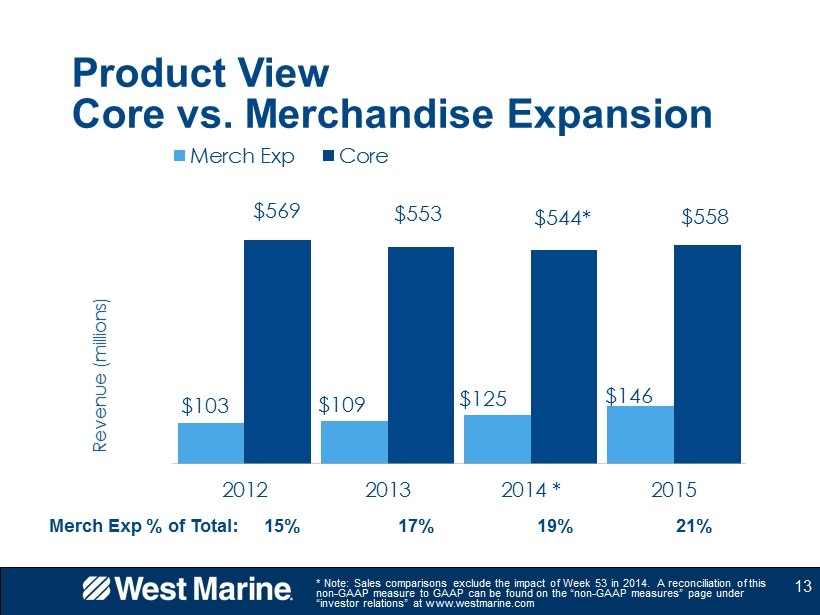
13 * Note: Sales comparisons exclude the impact of Week 53 in 2014. A reconciliation of this non - GAAP measure to GAAP can be found on the “non - GAAP measures” page under “investor relations” at www.westmarine.com Product View Core vs. Merchandise Expansion Merch Exp % of Total: 15% 17% 19% 21% $103 $109 $125 $146 $569 $553 $544* $558 2012 2013 2014 * 2015 Revenue (millions) Merch Exp Core

14 Access to Specialty Brands Creates Competitive Advantage

15 II. Real Estate Optimization

New Store C oncept Specifically Designed for the Waterlife C ustomer 16 Highly Trained Staff Waterlife Store Benefits Increased Brand Selection Improved Store Layout Increased Product Assortment

17 Improved experience for our core customers and designed to attract new customers

18 Waterlife Store Count

Healthy Real Estate 19 98% of our store fleet is cash flow positive on a cash basis 256 Total Stores 1 4 Stores <$0 1 Only includes stores that have been open for at least one year and have not had construction activity for at least one year 2%

20 Market Consolidation • Focus on fewer, larger, more dominant stores in major markets • Emphasizes product assortment and customer experience vs. number of locations • Largely completed; a few markets remain • Examples: • San Juan • Jacksonville • Miami Revitalization • Light remodeling, space optimization, product assortment changes and Associate training • Applies to existing stores of proper size and in good locations • Core product presentation maintained through more efficient store layout • Examples: • San Diego • St. Petersburg Real Estate Optimization

21 Note : 2016 is guidance Capital Investment $11.8 $14.7 $14.5 $9.7 $12.0 $4.7 $12.1 $9.6 $11.0 $11.0 $1.4 $1.7 $0.5 $1.9 $2.0 2012 2013 2014 2015 2016 Store Development IT / e-Commerce Other $18.0 $28.6 $24.6 $ 22.6 $25.0
22 III. e - Commerce

▪ Synergy between store inventory and DC inventory ▪ e - Commerce is growing and continues to be a major opportunity to serve a broader customer base ▪ Increased product breadth and assortment ▪ A broad assortment of 150,000+ SKUs available to customers ▪ Detailed technical product information ▪ Store pickup of hazardous and oversized items ▪ 15 % of our sales via e - Commerce by 2019 23 e - Commerce Strategy 23

24 Homepage content that leads to exploration and discovery e - Commerce Strategy 24
25 IV. Professional Business

▪ Only National Omni - Channel B2B Supplier in the Industry ▪ 27 Hub locations with daily van d elivery s ervice ▪ Sales team cover all key U.S. markets, plus Puerto Rico and international ▪ Government team supports federal and local agencies, plus Coast Guard and Navy ▪ Largest Customer Segments ▪ Professional services , b oat y ards, charter c ompanies, boat d ealers and b oatbuilders ▪ DIY to DIFM Market Trends Drive Growth ▪ Represents an incremental revenue opportunity as demand shifts from consumer to professional 26 Overview 26

▪ Improve Professional Store Experience ▪ Growth through training, service levels and localized assortments supporting the Pro customer ▪ Transition the West Marine Pro Brand ▪ Transitioned Port Supply to West Marine Pro in October to leverage one outstanding brand ▪ Opportunity to “Connect” Pro customers with retail c ustomers ▪ Execution of Profitability Initiatives ▪ Higher profitability through process efficiencies, expense reductions and targeted customer segment growth 27 2017 Key Strategies to Improve Profitability 27

• Improved professional e - Commerce experience • 40% g rowth plan through technology enhancements • Improved functionality on West Marine Pro “B2B” website • Wholesale customers seamlessly can shop across channels • Launched mobile site e - Commerce Strategy 28

29 V . Financial Overview
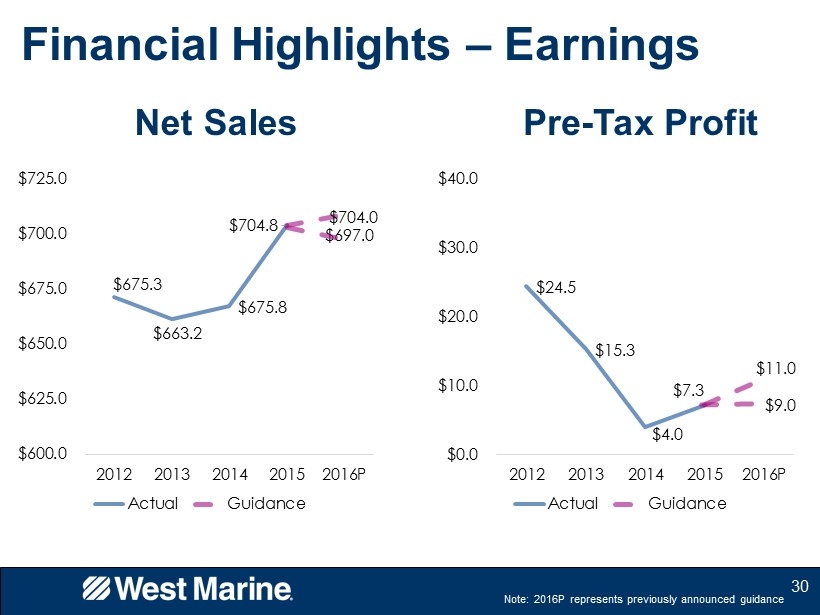
$24.5 $15.3 $4.0 $7.3 $9.0 $11.0 $0.0 $10.0 $20.0 $30.0 $40.0 2012 2013 2014 2015 2016P Actual Guidance 30 Financial Highlights – Earnings Net Sales Pre - Tax Profit $675.3 $663.2 $675.8 $704.8 $704.0 $697.0 $600.0 $625.0 $650.0 $675.0 $700.0 $725.0 2012 2013 2014 2015 2016P Actual Guidance Note: 2016P represents previously announced guidance

31 Financial Highlights – e - Commerce
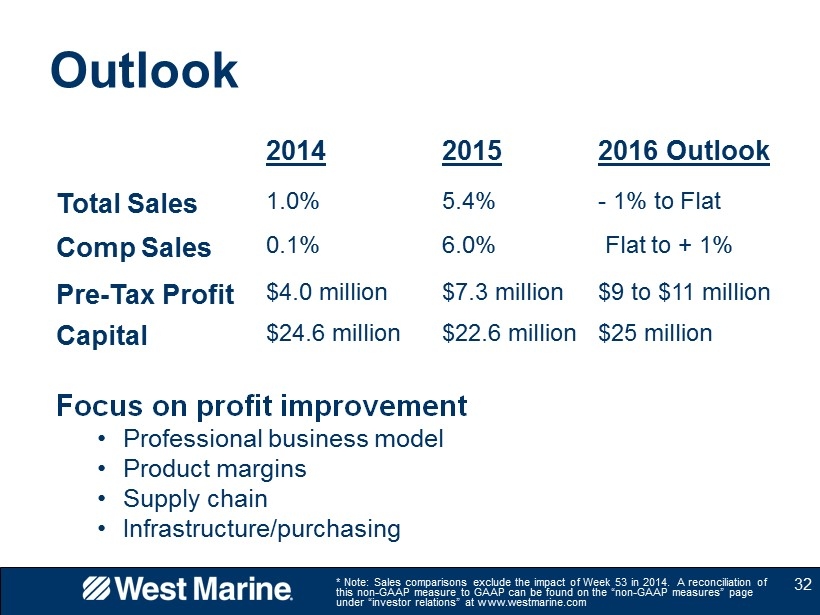
32 2014 2015 2016 Outlook Total Sales 1.0% 5.4% - 1% to Flat Comp Sales 0.1% 6.0% Flat to + 1% Pre - Tax Profit $4.0 million $7.3 million $9 to $11 million Capital $24.6 million $ 22.6 million $25 million Focus on profit improvement • Professional business model • Product margins • Supply chain • Infrastructure/purchasing * Note: Sales comparisons exclude the impact of Week 53 in 2014. A reconciliation of this non - GAAP measure to GAAP can be found on the “non - GAAP measures” page under “investor relations” at www.westmarine.com Outlook

33 Thank You Note: Some non - GAAP measures are used in this presentation for comparison purposes. These measures are found on slides 13 and 32. Reconciliation of non - GAAP measures to GAAP can be found on the “non - GAAP measures” page under “investor relations” at www.westmarine.com