Attached files
Table of Contents
UNITED STATES
SECURITIES AND EXCHANGE COMMISSION
WASHINGTON, D.C. 20549
FORM 10-K
(Mark One)
| x | ANNUAL REPORT PURSUANT TO SECTION 13 OR 15(d) OF THE SECURITIES EXCHANGE ACT OF 1934 |
For the fiscal year ended January 2, 2010
OR
| ¨ | TRANSITION REPORT PURSUANT TO SECTION 13 OR 15(d) OF THE SECURITIES EXCHANGE ACT OF 1934 |
Commission File Number 0-22512
WEST MARINE, INC.
(Exact Name of Registrant as Specified in Its Charter)
| Delaware | 77-0355502 | |
| (State or Other Jurisdiction of Incorporation or Organization) | (I.R.S. Employer Identification No.) | |
| 500 Westridge Drive, Watsonville, CA | 95076-4100 | |
| (Address of Principal Executive Offices) | (Zip Code) | |
Registrant’s Telephone Number, Including Area Code: (831) 728-2700
Securities registered pursuant to Section 12(b) of the Act:
| Title of Each Class |
Name of Each Exchange on Which Registered | |
| Common Stock, $0.001 par value | NASDAQ Global Market |
Securities registered pursuant to Section 12(g) of the Act: None
Indicate by check mark if the registrant is a well-known seasoned issuer, as defined in Rule 405 of the Securities Act of 1933, as amended. Yes ¨ No x
Indicate by check mark if the registrant is not required to file reports pursuant to Section 13 or Section 15(d) of the Exchange Act of 1934, as amended (Exchange Act). Yes ¨ No x
Indicate by check mark whether the registrant (1) has filed all reports required to be filed by Section 13 or 15(d) of the Exchange Act during the preceding 12 months (or for such shorter period that the registrant was required to file such reports), and (2) has been subject to such filing requirements for the past 90 days. Yes x No ¨
Indicate by check mark whether the registrant has submitted electronically and posted on its corporate Web site, if any, every Interactive Data File required to be submitted and posted pursuant to Rule 405 of Regulation S-T (§232.405 of this chapter) during the preceding 12 months (or for such shorter period that the registrant was required to submit and post such files). Yes ¨ No ¨
Indicate by check mark if disclosure of delinquent filers pursuant to Item 405 of Regulation S-K is not contained herein, and will not be contained, to the best of registrant’s knowledge, in definitive proxy or information statements incorporated by reference in Part III of this Form 10-K or any amendment to this Form 10-K. x
Indicate by check mark whether the registrant is a large accelerated filer, an accelerated filer, a non-accelerated filer, or a smaller reporting company. See definitions of “large accelerated filer,” “accelerated filer” and “smaller reporting company” in Rule 12b-2 of the Exchange Act.
| Large accelerated filer ¨ | Accelerated filer x | |
| Non-accelerated filer ¨ (Do not check if a smaller reporting company) | Smaller reporting company ¨ |
Indicate by check mark whether the registrant is a shell company (as defined in Rule 12b-2 of the Exchange Act). Yes ¨ No x
As of July 2, 2009, the last business day of the registrant’s most recently completed second fiscal quarter, the aggregate market value of the registrant’s common stock held by non-affiliates of the registrant was approximately $123.3 million based on the closing sale price of $5.55, as reported on the NASDAQ Global Market on such date.
Indicate the number of shares outstanding of each of the issuer’s classes of common stock, as of the latest practicable date.
| Class |
Outstanding at March 9, 2010 | |
| Common stock, $.001 par value per share | 22,350,829 shares |
DOCUMENTS INCORPORATED BY REFERENCE
| Document |
Parts Into Which Incorporated | |
| Proxy Statement for the Annual Meeting of Stockholders to be held on May 20, 2010. | Part II, Item 5 and Part III |
Table of Contents
WEST MARINE, INC.
2009 FORM 10-K ANNUAL REPORT
| Page | ||||
| PART I |
||||
| Item 1. |
Business | 1 | ||
| Item 1A. |
Risk Factors | 4 | ||
| Item 1B. |
Unresolved Staff Comments | 13 | ||
| Item 2. |
Properties | 13 | ||
| Item 3. |
Legal Proceedings | 13 | ||
| Item 4. |
[Reserved] | 14 | ||
| PART II |
||||
| Item 5. |
15 | |||
| Item 6. |
17 | |||
| Item 7. |
Management’s Discussion and Analysis of Financial Condition and Results of Operations |
18 | ||
| Item 7A. |
32 | |||
| Item 8. |
33 | |||
| Item 9. |
Changes in and Disagreements With Accountants on Accounting and Financial Disclosure |
60 | ||
| Item 9A. |
60 | |||
| Item 9B. |
60 | |||
| PART III |
||||
| Item 10. |
61 | |||
| Item 11. |
61 | |||
| Item 12. |
Security Ownership of Certain Beneficial Owners and Management and Related Stockholder Matters |
61 | ||
| Item 13. |
Certain Relationships and Related Transactions, and Director Independence |
61 | ||
| Item 14. |
61 | |||
| PART IV |
||||
| Item 15. |
Exhibits and Financial Statement Schedules | 62 | ||
i
Table of Contents
PRELIMINARY NOTE
This report is for the year ended January 2, 2010. This report modifies and supersedes documents filed prior to this report. The Securities and Exchange Commission (the “SEC”) allows us to “incorporate by reference” information that we file with them, which means that we can disclose important information to you by referring you directly to those documents. Information incorporated by reference is considered to be part of this report. In addition, information that we file with the SEC in the future automatically will update and supersede information contained in this report.
We undertake no obligation (other than that required by law) to publicly update or revise any disclosures contained in this report, whether as a result of new information, future events or otherwise. Website references throughout this report are for information only, and the content of these websites is not incorporated by reference and should not otherwise be considered a part of this report.
ii
Table of Contents
PART I
General
West Marine is the largest boating supply retailer in the world with 2009 net revenues of $588.4 million. Our business strategy is to offer an assortment of competitively-priced merchandise for the boat and for the boater that meets the needs of individual boaters and boating businesses, provide great customer experiences, and offer the convenience of multi-channel shopping.
We have three reportable segments: Stores; Port Supply, our wholesale segment; and Direct Sales, which includes Internet and call center transactions. Our Stores segment generated approximately 89% of our 2009 net revenues. Our 335 Company-operated stores open at the end of 2009 are located in 38 states, Puerto Rico and Canada. In addition, we have two franchised stores in Turkey. Our Port Supply segment is one of the largest wholesale distributors of marine supply and equipment in the United States. Products shipped to Port Supply customers directly from our warehouses represented approximately 5% of our 2009 net revenues. Our Direct Sales segment offers customers around the world more than 50,000 products and accounted for the remaining 6% of our 2009 net revenues. Financial information about our segments appears in Note 10 to our consolidated financial statements, in Item 8 of this report.
West Marine, Inc. was incorporated in Delaware in September 1993 as the holding company for West Marine Products, Inc., which was incorporated in California in 1976. Unless the context otherwise requires, “West Marine,” “we,” “us,” “Company” and “our” refer to West Marine, Inc. and its subsidiaries. Our principal executive offices are located at 500 Westridge Drive, Watsonville, California 95076-4100, and our telephone number is (831) 728-2700. Our two distribution centers are located in Rock Hill, South Carolina and Hollister, California.
All references to 2009, 2008 and 2007 in this report refer to our fiscal years ended on January 2, 2010, January 3, 2009 and December 29, 2007, respectively. Fiscal year 2008 was a 53-week year, while both fiscal years 2009 and 2007 were 52-week years.
Stores Segment
Since opening our first store in Palo Alto, California in 1975, we have grown through internal expansion and through strategic acquisitions to 335 locations open at the end of 2009. During 2009, we opened nine new stores.
In addition to our standard-sized stores—which typically range from 6,000 to 12,000 square feet and carry over 6,000 items—we operate flagship stores, large format stores and smaller “express” stores. The large format stores range from 13,000 to 19,000 square feet and carry about 11,000 items. Express stores typically range from 2,500 to 3,000 square feet and carry over 4,000 items, mainly hardware and other supplies needed for day-to-day boat maintenance and repairs.
At the end of 2009, we had flagship stores in Ft. Lauderdale, Florida, San Diego, California, Brick, New Jersey and Jacksonville, Florida. Our flagship stores, at 20,000 square feet or larger, offer an expansive array of merchandise—about 16,000 items—as well as interactive displays designed to help customers make informed product selections. These stores offer not only an extensive assortment of core boating hardware and supplies, but also present a broader selection of boating-related lifestyle products, such as apparel. The flagship stores feature unique visual design elements and fixtures with a nautical theme, designed to create an exciting atmosphere that we believe appeal to our customers.
We regularly monitor and take steps to improve individual store performance, including remodeling or expanding stores, relocating stores to more profitable locations and closing lower-performing stores which, along with our flagship store concept, form a part of our “market optimization” strategy. In 2009, we closed 18 stores
1
Table of Contents
and remodeled two stores. In 2010, we expect to open three standard-sized stores, five large format stores and three flagship stores. We also will close underperforming stores as and when appropriate, although no specific locations have been identified. In addition, we continue to pursue opportunities to consolidate multi-store markets with larger stores.
Port Supply Segment
Port Supply, our wholesale segment, was created to expand our market share across a broader customer base and to leverage our purchasing and distribution efficiencies. Our extensive store network gives Port Supply an advantage in serving wholesale customers seeking convenience and a larger assortment of products than those carried by typical distributors. We serve the wholesale market through commissioned sales representatives, our stores, our call center and the Internet at www.portsupply.com.
In 2009, we distributed marine supplies to domestic and international wholesale customers. Our largest wholesale customer accounted for less than 2% of total Port Supply segment revenues. Port Supply customers include businesses involved in boat sales, boat building, boat commissioning and repair, yacht chartering, marina operations and other boating-related activities. In addition, Port Supply sells to government and industrial customers who use our products for boating and non-boating purposes. We believe that with continued customer focus and breadth of product selection and availability, we will continue to be recognized as the preferred wholesale distributor in the industry.
Direct Sales Segment
Our e-commerce website and virtual call center comprise the Direct Sales, or direct-to-customer, segment. This direct-to-customer channel complements the Stores segment by building brand awareness, acting as an additional marketing vehicle, and providing our customers with the option of shopping from across the globe.
Our e-commerce website provides our customers with access to a broad selection of over 50,000 products, unique product advisor tips and technical information, over 250 product videos and customer-submitted product reviews. We believe our website is a cost-effective means of testing market acceptance of new products and concepts.
This segment also provides customers with access to knowledgeable technical advisors who can assist our customers in understanding the various uses and applications of the products we sell. We operate a virtual call center from which our associates assist our customers by taking calls at home or from our support center in Watsonville, California. Our virtual call center supports sales generated through the e-commerce website, catalogs and stores and provides customer service offerings. Fulfillment of customer orders placed on the website or via our virtual call center is completed through our distribution centers, or in certain cases directly from the vendor to the customer.
We mail our catalogs to addresses from our proprietary customer list. In addition, we acquire potential customer names from a variety of sources, including lists purchased from or exchanged with other mail order merchandisers. All mail list exchanges are consistent with our published privacy policies. Our customer list is continually updated to include customer address changes and new customer prospects, and to eliminate non-responders and information of customers requesting to opt out of our marketing programs.
Foreign Sales
We promote and sell our marine products internationally through our Port Supply and Direct Sales segments. Through our Stores segment, we operate 10 stores located in Canada and we franchise two stores in Turkey. For each of 2009, 2008 and 2007, revenues outside of the United States represented 5% or less of our total net revenues.
2
Table of Contents
Customer Service
Offering exceptional customer service has been the cornerstone of West Marine since our beginning. We remain focused on the customer and providing great customer experiences—a commitment to excellence that is embraced by all West Marine associates. Many of our selling associates receive advanced product and technical training, empowering them to take great care of our customers. We will continue to listen to our customers and refine our business to meet their needs.
Merchandising
West Marine is committed to a broad assortment of merchandise that provides what our customers want, when they want it. Our merchandising department is responsible for vendor and product selections; and our planning and replenishment department is responsible for purchasing and managing inventory levels in our distribution centers and our stores. We also offer our customers the ability to special order products that we do not keep in inventory in our stores or at our distribution centers.
We purchased merchandise from more than 800 vendors during 2009 and realized savings through quantity purchases and direct shipments. In 2009, no single vendor accounted for more than 11% of our merchandise purchases, and our 20 largest vendors accounted for approximately 43% of our merchandise purchases. Generally, we purchase merchandise from our vendors on an order-by-order basis.
During 2009, we continued to offer private label merchandise, which typically feature higher gross margins than comparable branded products. Private label products, which we sell under the “West Marine” and “Seafit” brand names, usually are manufactured in Asia, the United States and Europe. We have a limited number of long-term contracts with our manufacturing sources and we compete with other companies for production facilities and import quota capacity.
Logistics
We operate two distribution centers: a 472,000 square foot facility in Rock Hill, South Carolina and a 240,000 square foot facility in Hollister, California. Generally vendors ship products to our distribution centers, where merchandise is inspected and prepared for shipment to stores or drop-shipped directly to customers in order to fulfill inventory or outstanding customer orders for all of our business segments (Stores, Port Supply, and Direct Sales). Some vendors ship products directly to our stores. We use various third-party domestic and international transportation methods, such as ocean, air and ground, including Company-owned vehicles. Our distribution centers utilize advanced material handling equipment and voice-picking technologies, as well as radio frequency identification tagging, to enable real-time management of inventory.
Marketing
Our overall marketing objectives are to provide compelling product offerings to our customers that are aligned with our mission statement and financial goals, drive customer traffic, acquire new customers, and increase sales and profit. West Marine is committed to being a leader in sustainability within the industry by promoting “Green Boating” messages to our customers and the media. We position our West Marine brand to stand for better selection, trust, friendly and knowledgeable service, competitive prices and shopping convenience. We market our products and services through direct mail catalogs and flyers, email and advertisements in boating specialty publications, newspapers and on the Internet.
We participate in a number of boat shows and sponsor a number of boating-related events each year, ranging from sailing regattas and fishing derbies to waterway clean-up and environmental quality campaigns. These events are designed to encourage participation in boating, increase the number of people enjoying the boating lifestyle, promote environmental responsibility and improve West Marine’s brand recognition.
3
Table of Contents
Our free and paid-subscription loyalty programs rank among the largest recreational boating membership programs in the United States.
Competition
The retail market for marine supplies is highly competitive and our stores compete with other specialty boating supply stores, and a variety of local and regional specialty stores, sporting good stores and mass merchants. Many of these competitors have stores in markets where we now operate. Also, we have a number of competitors engaged in the catalog, Internet and wholesale distribution of marine products. The principal factors of competition in our marketplace are selection, quality, availability, price, customer service, convenience and access to a wide variety of merchandise.
Trademarks and Service Marks
We own the trademarks and service marks “West Marine” and “Port Supply,” among others. These marks and a number of others are registered with the U.S. Patent and Trademark Office and in certain foreign countries. Each federal registration is renewable indefinitely if the mark is still in use at the time of renewal. We have a license to use the “BoatU.S.” tradename under a marketing agreement with the Boat Owners Association of the United States, although we have discontinued the use of the BoatU.S. tradename except in certain limited situations.
Associates
As of February 27, 2010, we had 3,963 associates, of whom 1,810 were full-time and 2,153 were part-time or temporary. A significant number of temporary associates are hired during our peak selling season, which is summer. For example, West Marine employed 4,559 associates on July 4, 2009.
Available Information
West Marine’s Internet address is www.westmarine.com. We make available, free of charge through the “Investor Relations” portion of our website, our annual reports on Form 10-K, quarterly reports on Form 10-Q, current reports on Forms 8-K and amendments to those reports filed or furnished pursuant to Section 13(a) or 15(d) of the Exchange Act including the exhibits thereto, as soon as reasonably practicable after such documents are electronically filed with, or furnished to, the SEC. Interested persons may also access copies of these reports through the SEC’s website, www.sec.gov. We will furnish to our stockholders any exhibit to this annual report upon the written request of such stockholder and the payment of a specified fee, which is limited to our reasonable expenses.
We have adopted a code of ethics for our associates and Board of Directors, as well as an additional code of ethics for our senior financial officers (including our principal executive officer, principal financial officer and principal accounting officer). Copies of these codes of ethics are available on our website at www.westmarine.com, or printed copies can be obtained by writing to the Secretary, West Marine, Inc., 500 Westridge Drive, Watsonville, California 95076. Any amendments to these codes of ethics, as well as any waivers that are required to be disclosed under the rules of the SEC or the NASDAQ Stock Market, are posted on our website.
Our business faces many risks. The risks described below may not be the only risks we face. Additional risks of which we are not yet aware, or that we currently think are immaterial, may also impair our business operations or financial results. If any of the events or circumstances described in the following risks actually occurs, our business, financial condition or results of operations could suffer and the trading price of our common stock could decline.
4
Table of Contents
Our ability to generate revenue could be significantly affected by prolonged economic uncertainty.
The global economic crisis caused a general tightening in credit markets, lower levels of liquidity, increases in the rates of default and bankruptcy, and extreme volatility in credit, equity and fixed-income markets. A continued slowdown in the U.S. or global economy, or an uncertain economic outlook, could adversely affect consumer spending habits and our operating results in the future. Because consumers often consider boats to be luxury items, our success depends upon a number of factors relating to consumer spending, including current and future economic conditions affecting disposable consumer income such as consumer confidence, employment, business conditions, fuel prices, interest rates, tax rates and rising consumer debt levels. In addition, our business opportunities are directly dependent upon the level of consumer spending on recreational boating supplies, a discretionary spending item. There can be no assurance that the current trends of reduced spending in the boating industry in general and the recreational boating after-market in particular will not continue or that reduced consumer spending in general will not continue, thereby adversely affecting our net revenues and profitability.
An inability to find suitable new and expanded store sites or delays in new store openings could materially affect our financial performance.
In order to meet our growth objectives, we will need to secure an adequate number of suitable new or expanded store sites, typically near marinas or other locations readily accessible by boaters. We require that all proposed store sites satisfy our criteria regarding cost and location. In addition, we may experience increased competition for store sites and, at some point, exhaust available coastal locations for new stores. We cannot assure that we will be able to find a sufficient number of suitable new sites for any planned expansion in any future period.
Our expected financial performance is based on our new or expanded stores opening on expected dates. It is possible that events such as construction delays caused by permitting or licensing issues, material shortages, labor issues, weather delays or other acts of God, discovery of contaminants or accidents could delay planned new store openings beyond their expected dates or force us to abandon planned openings altogether. Any failure on our part to recognize or respond to these issues may adversely affect our revenue growth, which in turn may adversely affect our future operating results.
If we cannot successfully implement our expansion strategy, our growth and profitability could be adversely impacted.
Our continued growth depends to a significant degree on our ability to continue to expand our operations through the opening of new stores or the expanding or remodeling of existing stores, and our ability to operate these stores on a profitable basis. There can be no assurance that new, expanded and remodeled stores will achieve our expected level of profitability.
Our expansion is dependent upon a number of factors, including the adequacy of our capital resources and our ability to locate suitable store sites and negotiate acceptable lease terms, to hire, train and integrate associates and to adapt our distribution and other operational systems. There can be no assurance that we will be able to achieve our planned expansion or that such expansion will be accomplished on a profitable basis. Failure to achieve our planned expansion could have a material adverse effect on us.
Our expansion into new, unfamiliar markets presents increased risks that may prevent us from being profitable in these new markets.
Pursuant to our growth strategy, sometimes we open stores in new geographic markets. Typically, the first stores opened in a new market initially will not achieve operating results comparable to our existing stores due in large part to factors that generally affect store performance in new markets. These factors include less familiarity with local demographics, customer preferences, discretionary spending patterns, difficulties in attracting customers due to a reduced level of customer familiarity with our brand, difficulties in hiring a sufficient number
5
Table of Contents
of qualified store associates and other factors. In addition, entry into new markets may bring us into competition with new, unfamiliar competitors. We cannot assure you that we will be successful in operating our stores in new markets on a profitable basis.
We experience fluctuations in our comparable store sales.
Our comparable store sales have fluctuated significantly in the past on an annual, quarterly and monthly basis, and we expect that they will continue to fluctuate in the future. A variety of factors affect comparable store sales, including boat usage, boating participation, current economic conditions, competition, the timing and release of new merchandise and promotional events, changes in our merchandise mix, the success of marketing programs and weather conditions. These factors and others may cause our comparable store sales to differ significantly from prior periods and from expectations. Failure to meet the expectations of investors in one or more future periods could reduce the market price of our common stock.
We have undertaken a number of initiatives designed to build our long-term strength. If one or more of these initiatives is unsuccessful, our profitability could be adversely affected.
Over the past couple of years, we launched a number of initiatives designed to increase sales and lower costs. These initiatives include optimizing our supply chain and inventory levels, closing under-performing stores with corresponding workforce adjustments, tailoring store merchandise assortments for local markets, expanding our wholesale business, investing in Internet business growth and investing in flagship stores. Each of these initiatives carries a certain level of risk, primarily related to increased expenses or reduced sales, which, when combined, could be substantial. If we fail to successfully execute one or more of these strategies, our profitability could be adversely affected.
Our results of operations could be adversely affected if unseasonably cold weather, prolonged winter conditions, natural disasters such as hurricanes or extraordinary amounts of rainfall occur, especially during the peak boating season in the second and third fiscal quarters.
Our business is highly seasonal. The majority of our revenues occur between the months of April and August, which represent the peak boating months in most of our markets. Our annual results would be materially and adversely affected if our net revenues were to fall below expected seasonal levels during this period. Our business also is significantly affected by weather patterns. Unseasonably cool weather, prolonged winter conditions, extraordinary amounts of rainfall or natural disasters may decrease boating use in the peak season, resulting in lower maintenance needs and, therefore, decreased revenues.
Intense competition in the boating supply and outdoor recreation markets could reduce our revenue and profitability.
The retail market for recreational boating supplies and apparel is highly competitive. Our stores compete with other specialty marine supply stores. Many of these competitors have stores in the markets in which we now operate and in which we plan to expand. We also compete, to a lesser extent, with sporting goods stores and mass merchants. Our Internet and call center operations compete with other Internet and catalog retailers. We also have a number of competitors in the wholesale distribution of marine products. In addition, a key competitive factor in the marine supplies market is price. The bankruptcy or liquidation of one or more of our competitors in any one of our market segments could result in such competitors offering close-out prices that we cannot viably match. Competitive pressures resulting from competitors’ pricing policies have adversely affected our gross margins, and such pressures are expected to continue. There can be no assurance that we will not face greater competition from other retailers or that we will be able to compete successfully with existing and new competitors.
6
Table of Contents
If any of our key vendors or manufacturers fail to supply us with merchandise, we may not be able to meet the demands of our customers and our sales could decline.
We depend on merchandise purchased from our vendors and sourced from third-party manufacturers to obtain products for our sales channels. Generally, we deal with our suppliers on an order-by-order basis and have limited long-term purchase contracts or other contractual assurances of continued supply or pricing. Accordingly, our vendors and manufacturers could discontinue selling products to us at any time. The loss of any key vendor or manufacturer for any reason could limit our ability to offer products that our customers want to purchase. In addition, we believe many of our vendors obtain their products from China, Taiwan, Korea, Mexico and other countries, and we source products from third-party manufacturers in these countries. A vendor could discontinue selling to us products manufactured in foreign countries at any time for reasons that may or may not be within our control or the vendor’s control, including foreign government regulations, political unrest, war, disruption or delays in shipments, changes in local economic conditions, quotas, quality control and trade issues. Also, during weak economic times, such as those we are currently facing, there is an increased risk that certain of our vendors may experience financial difficulty resulting in inability to service, manufacture or deliver products to us in a timely manner. Additionally, changes in commercial practices of our key vendors or manufacturers, such as changes in vendor support and incentives or changes in credit or payment terms, could negatively impact our operating results. Our operating results also could suffer if we are unable to promptly replace a vendor or manufacturer who is unwilling or unable to satisfy our requirements with a vendor or manufacturer providing equally appealing products.
If we lose key management or are unable to attract and retain the talent required for our business, our operating results and financial condition could suffer.
Our future performance is substantially dependent upon the continued services of certain members of our senior management. We do not maintain any key-man life insurance for our senior management, including Randolph K. Repass, Chairman of our Board of Directors, nor Geoff Eisenberg, our President and Chief Executive Officer. The loss of the services of any key members of senior management could have a material adverse effect upon us. In addition, our continued growth depends on our ability to attract and retain skilled executives. There can be no assurance that we will be able to retain our existing personnel or attract additional qualified executives in the future or that our current management team can achieve our planned expansion or continue to operate West Marine in a profitable manner.
Our business depends on our ability to meet our labor needs.
Our success depends in part upon our ability to attract, motivate and retain a sufficient number of qualified associates, including general managers, assistant managers, call center associates and store associates, who understand and appreciate boating and the boating lifestyle and are able to communicate knowledgeably with our customers. Qualified individuals of the requisite caliber and in the numbers needed to fill these positions may be in short supply in some areas, and the turnover rate in the retail industry is high.
If we are unable to hire and retain sales associates capable of consistently providing a high level of customer service, as demonstrated by their enthusiasm for our culture and knowledge of our merchandise, our business could be materially adversely affected. Although none of our associates currently are covered by collective bargaining agreements, we cannot guarantee that our associates will not elect to be represented by labor unions in the future, which could increase our labor costs. Additionally, competition for qualified associates could require us to pay higher wages to attract a sufficient number of associates. An inability to recruit and retain a sufficient number of qualified individuals in the future may delay the planned openings of new stores. Any such delays, any material increases in associate turnover rates at existing stores or any increases in labor costs could have a material adverse effect on our business, financial condition or operating results.
7
Table of Contents
We must successfully order and manage our inventory to reflect customer demand in a volatile market and anticipate changing consumer preferences and buying trends or our revenues and profitability will be adversely affected.
Our success depends upon our ability to successfully manage our inventory and to anticipate and respond to merchandise trends and customer demands in a timely manner. The retail consumer industry, by its nature, is volatile and sensitive to numerous economic factors, including consumer preferences, competition, market conditions and general economic conditions. None of these factors are within our control. We cannot predict consumer preferences with certainty, and consumer preferences often change over time. We usually must order merchandise well in advance of the following selling season. The extended lead times for many of our purchases may make it difficult for us to respond rapidly to new or changing product trends, increases in customer demand or changes in prices. If we misjudge either the market for our merchandise or our customers’ purchasing habits, our revenues may decline significantly and we may not have sufficient quantities of merchandise to satisfy customer demand or we may be required to mark down excess inventory, either of which would result in lower profit margins.
A natural disaster or other disruption at our support center or either of our distribution centers could cause us to lose merchandise or inhibit our ability to process orders and, therefore, make us unable to effectively deliver to our direct customers and retail stores.
We rely on the continuous operation of our support center in Watsonville, California, and our distribution centers in Hollister, California, and Rock Hill, South Carolina. Any natural disaster or other serious disruption to these operations due to fire, flood, earthquake, hurricane, terrorism or any other unforeseen circumstance could materially impair our ability to do business and adversely affect our financial position and future operating results.
Reliance on our information technology systems exposes us to potential risks.
Reliance on our information technology systems exposes us to potential risks of interruptions due to natural disasters, cyber-attacks, unplanned outages, fraud perpetrated by malicious individuals or other causes. Our information technology systems and processes are based in our support center in Watsonville, California and a co-location managed by a third-party provider. We intend to increase our reliance on information technology systems in order to improve our business processes and supply chain efficiencies. Any unmitigated interruption of our information technology systems may have a negative impact on future financial results.
Our founder and Chairman, Randolph K. Repass, beneficially owns approximately 33% of our common stock. As a result, his interests may differ from that of our other stockholders.
Randolph K. Repass, the Chairman of our Board of Directors, beneficially owns approximately 33% of our common stock. As a result, Mr. Repass has substantial influence in the election of directors of West Marine and, in general, the outcome of any matter submitted to a vote of our stockholders, including mergers, consolidations or the sale of all or substantially all of our assets. Due to his significant ownership position, Mr. Repass may be able, in concert with others, to prevent or to cause a change in control of West Marine.
We face periodic reviews, audits and investigations by government agencies, and these audits could have adverse findings, which may negatively impact our business.
We are subject to various routine and non-routine reviews, audits and investigations by various federal and state governmental regulators, including environmental, tax and customs agencies. Violation of the laws and regulations governing our operations, or changes in interpretations of those laws, could result in the imposition of civil or criminal penalties, the suspension or revocation of our licenses, or the revision and recoupment of past payments made based on audit findings. If we become subject to material fines or if other sanctions or other corrective actions were imposed upon us, our results of operations may be negatively impacted.
8
Table of Contents
Our business and financial results may be adversely affected by global climate change or by legal, regulatory or market responses to such change.
The growing political and scientific sentiment is that increased concentrations of carbon dioxide and other greenhouse gases in the atmosphere are influencing global weather patterns. Changing weather patterns, along with the increased frequency or duration of extreme weather conditions, especially during our peak boating season, could reduce the sale of our products or materially affect our store locations, which are primarily located in coastal areas, through storm damage, reduced traffic, or increased insurance rates. Additionally, concern over climate change, including global warming, has led to legislative and regulatory initiatives directed at limiting greenhouse gas emissions. For example, proposals that would impose mandatory requirements on greenhouse gas emissions continue to be considered by policy makers which, if adopted, may adversely affect the boating industry and the suppliers of our retail products. Laws enacted may increase production costs for many of our retail products and, therefore, the prices we pay to stock such products may increase. We may not be able to pass along these increased prices to our customers, which could adversely impact our business and financial results.
Our failure to comply with certain environmental regulations could adversely affect our business.
We sell paints, varnishes and other products. The storage, distribution, transportation and disposal of some of these products are subject to a variety of federal and state environmental regulations. Our failure to comply with these regulations could have an adverse impact on our business. In addition, we have indemnified certain of our landlords for any hazardous waste which may be found on or about the particular property or operation. If any such hazardous waste were to be found on property that we occupy, a significant claim giving rise to our indemnity obligation could adversely impact our operating results.
Because we self-insure against certain risks and maintain high deductibles on certain of our insurance policies, our operating results may be adversely affected if we suffer a substantial casualty.
We believe that insurance coverage is prudent for risk management, and we expect that our insurance costs will continue to increase. For certain types or levels of risk, including medical care, we have decided to limit our purchase of relevant insurance, choosing instead to self-insure. With medical insurance, we have individual and aggregate stop loss insurance to protect us from large claims. In other cases, we have elected to retain a higher portion of the risk in the form of higher deductibles. If we suffer a substantial loss that is not covered by commercial insurance, the loss and attendant expenses could have a material adverse effect on our business and operating results.
In 1999, we began insuring our workers’ compensation losses through a high deductible program. This high per-claim deductible permits us to maintain low premium rates but may result in unexpectedly high costs if actual losses greatly exceed the expected losses in a year, with a corresponding negative effect on our operating results.
Our workers’ compensation expense is tied directly to the frequency and severity of workplace injuries to our associates. The costs associated with our workers’ compensation program include case reserves for reported claims up to the per claim deductible, an additional expense provision for unanticipated increases in the cost of open injury claims and for claims incurred in prior periods but not reported, as well as fees payable for claims administration. We recognize our liability for the ultimate payment of incurred claims and claims adjustment expenses by accruing liabilities on an actuarial basis which represent estimates of future amounts necessary to pay claims and related expenses with respect to covered events that have occurred. It is possible that our actual future workers’ compensation obligations may exceed the amount of its accrued liabilities, with a corresponding negative effect on future earnings, due to such factors as unanticipated adverse loss development of known claims, and the effect, if any, of claims incurred but not reported.
9
Table of Contents
A material weakness in our internal control over financial reporting could lead to errors in our financial statements and a lack of investor confidence in us and a resulting decline in our stock price.
Management has concluded that, as of January 2, 2010, we had not maintained effective internal control over financial reporting. As a result of the identified material weakness, an adjustment was necessary to accrued liabilities and costs of goods sold with respect to accrued freight charges during the fourth quarter ended January 2, 2010. However, the adjustment related to the material weakness and other fourth quarter adjustments, viewed individually or in the aggregate, did not result in any material misstatement of any financial statements we previously issued.
Although, as disclosed in Item 9A in this annual report on Form 10-K, we are in the process of implementing measures to remediate the material weakness by reviewing and improving our process for reconciling significant management estimates related to accrued freight charges, there can be no assurance that our remedial efforts will be effective, nor can there be any assurances that additional material weaknesses will not be identified in the future. Until our remediation efforts are completed, we will continue to be at an increased risk that our financial statements could contain errors that will be undetected, and we will continue to incur the expense and management burdens associated with the remediation efforts and the additional procedures required to prepare our consolidated financial statements. Any failure to remedy our material weakness could have a material adverse effect on our business and results of operations and could have a substantial adverse impact on the trading price of our common stock.
Further, the existence of our material weakness in our internal control over financial reporting could lead investors to question the reliability and accuracy of our reported financial information. Any such lack of confidence in the financial information that we produce could result in a decline in our stock price.
Failure to comply with the SEC’s permanent injunction entered on consent against us could subject us to further SEC enforcement actions, which could adversely affect our business.
As previously disclosed, we were the subject of a formal investigation by the SEC’s Division of Enforcement. We reached a consensual resolution of the SEC’s civil complaint resulting in a permanent injunction (the “SEC Injunction”) entered on August 31, 2009 in the U.S. District Court for the Northern District of California, San Jose Division. In agreeing to the entry of the SEC Injunction, we neither admitted nor denied the allegations in the SEC’s complaint. The SEC Injunction, by its terms, permanently restrains and enjoins us from, among other things, (1) filing with the SEC any report under the Securities Exchange Act of 1934, as amended (the “Exchange Act”), and rules and regulations adopted under the Exchange Act, that contains any untrue statement of a material fact, which omits to state any material fact necessary in order to make the statements made, in the light of the circumstances under which they were made, not misleading, or that omits to disclose any information required to be disclosed, (2) failing to make and keep accurate books, records and accounts, and (3) failing to devise and maintain an adequate system of internal accounting controls and procedures. Our failure to comply with any of the provisions of the SEC Injunction could adversely affect our business as a result of further SEC investigations, enforcement action, criminal prosecution and penalties, which could be significant.
The price of our common stock may be subject to volatile fluctuations based on fluctuations in our quarterly results, general economic and market conditions and by our ability to meet market expectations.
The market price of our common stock may be subject to significant fluctuations in response to operating results, comparable store sales announcements, announcements by competitors, our ability to meet market expectations and other factors. Variations in the market price of our common stock may also be the result of changes in the trading characteristics that prevail in the market for our common stock, including low trading volumes, trading volume fluctuations and other similar factors. These market fluctuations, as well as general economic conditions, may adversely affect the market price of our common stock. We cannot assure that the market price of our common stock will not fluctuate or decline significantly in the future.
10
Table of Contents
Our efforts to expand internationally, whether through acquisitions, franchising, licensing or similar arrangements, may not be successful and could impair the value of our brands.
The effect of international expansion, either by the acquisition of existing marine businesses or through franchising, licensing, joint venture or other similar arrangements, on our business and results of operations is uncertain and will depend upon various factors, including the demand for our products in new markets internationally, our ability to identify appropriate acquisition candidates or third parties to act as franchisees, licensees, distributors or in a similar capacity, the ability of third parties to meet their projections regarding store openings and sales, and our ability to employ personnel or consultants experienced in international operations. Failure to expand internationally successfully or a failure to protect the value of our brands could have an adverse effect on our results of operations.
General economic and business conditions as well as those specific to the retail industry may adversely affect our business and results of operations.
Worsening economic and business conditions may adversely impact consumer spending, particularly in discretionary areas, such as boating. Discretionary consumer spending, which is critical to our success, is influenced by general economic conditions and the availability of discretionary income. Accordingly, we may experience declines in sales during economic downturns or during periods of uncertainty. In addition, volatility in fuel and other energy prices as well as consumer uncertainty that has accompanied the ongoing home mortgage and credit “crisis” and general weakness in housing markets and the economy in general has resulted in decreased discretionary consumer spending. A continuing decline in consumer confidence or the amount of discretionary spending could have a material adverse effect on our sales, results of operations, business and financial condition.
Our profitability may be adversely affected if we do not continue to improve our business processes in response to worsening economic conditions.
From time to time we may have to restructure our business to react to worsening economic conditions, a decline in the boating industry (or the softening of our industry) and/or to changing technology, products and markets. If we are not able to continue to improve our business processes, our financial and our information technology systems, or if we are not able to restructure our business in response to the deteriorating economic conditions, we may not be able to achieve our financial objectives.
Fluctuations in currency exchange rates may adversely impact our cash flows and earnings.
We have retail stores located in Canada, and therefore our cash flows and earnings are exposed to currency exchange rate fluctuations between the U.S. dollar and the Canadian dollar. While we may attempt to limit our exposure to exchange rate changes by entering into short-term currency exchange contracts, there is no assurance that we will hedge or will be able to hedge such foreign currency exchange risk or that our hedges will be successful. Our currency exchange gains or losses may adversely impact our cash flows and earnings. Additionally, adverse movements in currency exchange rates could result in a reduction in growth of international direct sales, impacting our cash flows and earnings.
Economic and other factors affecting financial institutions and the value of our collateral could affect our access to capital.
Borrowings against our credit facility represent our primary source of capital. U.S. and global credit markets have recently undergone significant disruption, making it difficult for many businesses to obtain financing on acceptable terms. In addition, an increasing number of financial institutions have reported significant deterioration in their financial condition. If our lender is unable to perform its obligations under our existing credit facility, and we are unable to find suitable replacements on acceptable terms, our results of operations, liquidity and cash flows could be adversely affected. Further, our existing credit facility expires in December 2010. Given the current credit environment, we do not expect to renew the facility with terms and conditions similar to our existing facility and our cost of borrowing will likely be higher than our existing facility.
11
Table of Contents
Our credit facility is secured by a security interest in our assets, primarily inventory and accounts receivable. Under the terms of our credit facility, the availability of borrowings under the facility is directly related to the assessed values of these assets. If the value of these assets were to decline due to market conditions or any other reason, this would, in turn, reduce the amount of capital available to West Marine. The resulting lack of liquidity could adversely affect our ability to operate and appropriately invest in the business.
Our reputation and business could be materially harmed as a result of data breaches, data theft, unauthorized access or hacking.
The protection of our customer, associate and Company data is critical to West Marine. The regulatory environment surrounding information security and privacy is increasingly demanding, with the frequent imposition of new and constantly changing requirements. Additionally, our Internet operations are subject to a number of risks, including reliance on third-party providers, online security breaches and/or credit card fraud. Credit card issuers have promulgated credit card security guidelines as part of their ongoing effort to battle identity theft and credit card fraud. We continue to work with our third-party providers and credit card issuers to assure that our products and services comply with the credit card association’s security regulations. There can be no assurances, however, that our processes and systems, or those of our third-party providers, are invulnerable to unauthorized access or hacking. Unauthorized intrusion into portions of our computer systems, or those of our third-party providers that process and store information related to our customer transactions, may result in a data breach and theft of customer data.
We rely on proprietary and commercially available systems, software, tools and monitoring to provide security for processing, transmitting and storing confidential customer information, such as customer’s payment cards and personal information. Furthermore, the systems currently used for transmission and approval of payment card transactions, and the technology utilized in payment cards themselves, all of which can put payment card data at risk, are determined and legally mandated by payment card industry standards, not by us. Compliance with these requirements may result in cost increases due to necessary system and administrative process changes. Improper activities by third parties, advances in computer and software capabilities and encryption technologies, new tools and discoveries, and other events or developments, may facilitate or result in a compromise or breach of our computer systems. Any such compromises or breaches could cause interruptions in our operations, damage our reputation, subject us to costs, fines or liabilities, and potentially hurt sales, revenues and profits.
We face the risk of exposure to product liability claims, product recalls and adverse publicity.
We market and distribute products purchased from third-party suppliers, including products which are marketed and resold under our private label brand. We may inadvertently resell product(s) that contain a defect which may cause property damage or personal injury to our end-user customers, which therefore exposes us to the risk of adverse publicity, product liability claims, and product recalls or other regulatory or enforcement actions, including those initiated by the U.S. Consumer Product Safety Commission, by state regulatory authorities or through private causes of action. We generally seek contractual indemnification and insurance coverage from our suppliers and we carry our own insurance. However, if the insurance coverage is not adequate and/or the contractual indemnification is not provided by or enforceable against the supplier, product liability claims relating to defective and/or recalled products could have a material adverse effect on our ability to successfully market our products and on our business, financial condition and results of operations. In addition, even if a product liability claim is not successful or is not fully pursued, the negative publicity surrounding a product recall or any assertion that our products caused property damage or personal injury could damage our brand identity and our reputation with existing and potential customers and have a material adverse effect on our business, financial condition and results of operations.
Changes in laws and regulations could increase our cost of doing business.
We are subject to a wide variety of laws and regulations in the United States and the other countries and jurisdictions in which we operate, and changes in the level of government regulation of our business have the
12
Table of Contents
potential to materially alter our business practices and/or our profitability. Changes in U.S. or foreign law that change our operating requirements with respect to sourcing or reselling products could increase our costs of compliance or make it too expensive for us to offer such products, which could lead to a reduction in revenue. Also, changing regulations and laws governing the Internet and e-commerce transactions (including taxation, user privacy, data protection, pricing and electronic communications) could impede the growth of our Internet business and increase our cost of doing business. Furthermore, changes in federal or state wage requirements (including changes in entitlement programs such as health insurance, paid leave programs, or other changes in workplace regulation) could adversely impact our ability to achieve our financial targets. Additionally, because a portion of our merchandise is imported from overseas, changes in trade restrictions, new tariffs and quotas, and higher shipping costs for goods could adversely impact our merchandise costs and our ability to achieve anticipated operating results.
Changes in accounting standards, interpretations or applications of accounting principles, and subjective assumptions, estimates and judgments by management related to complex accounting matters, could significantly affect our financial results.
Generally accepted accounting principles and related accounting pronouncements, implementation guidelines and interpretations with regard to a wide range of matters that are relevant to our business including, but not limited to, inventory valuation adjustments, capitalized indirect costs, costs associated with exit activities, impairment of long-lived assets, workers’ compensation reserves, and valuation allowances against our deferred tax assets, are highly complex and involve many subjective assumptions, estimates and judgments by our management. Changes in underlying assumptions, estimates or judgments by our management could significantly change our reported or expected financial performance. Additionally, changes in accounting principles and related accounting pronouncements, their interpretation and/or their application to our financial statements could result in material charges to our financial statements.
ITEM 1B—UNRESOLVED STAFF COMMENTS
None.
Our executive offices and support center are located in a 106,000 square foot facility in Watsonville, California, which we occupy under a lease that expires in 2016. We operate a 240,000 square foot distribution center located in Hollister, California, under a lease that expires in 2011, and a 472,000 square foot distribution center located in Rock Hill, South Carolina, under a lease that expires in 2017.
At January 2, 2010, our 335 stores comprised an aggregate of approximately 2.7 million square feet of space. Nearly all of our stores are leased, typically for a five-year or 10-year initial term, with options to renew for at least one five-year period. In some leases, we pay a fixed rent, in others we have a period of fixed rent and then a rent change that is either fixed or determined by a consumer price index calculation. Substantially all of our leases require us to pay insurance, utilities, real estate taxes, repair and maintenance expenses and common area maintenance.
We are involved in various legal and administrative proceedings, claims and litigation arising in the ordinary course of business. Based on the facts currently available, we do not believe that the disposition of matters that are pending or asserted, individually and in the aggregate, will have a material adverse effect on our financial position. However, an adverse judgment by a court, administrative or regulatory agency, arbitrator or a settlement could adversely impact our results of operations in any given period.
13
Table of Contents
Additionally, U.S. Customs and Border Protection has advised us that it will be performing a “focused assessment” of our import practices for fiscal 2008. We intend to cooperate with the agency in its assessment. At this time, this matter is in a preliminary stage and the outcome cannot be predicted.
14
Table of Contents
PART II
ITEM 5—MARKET FOR REGISTRANT’S COMMON EQUITY, RELATED STOCKHOLDER MATTERS AND ISSUER PURCHASES OF EQUITY SECURITIES
Our common stock trades on the NASDAQ Global Market tier of the NASDAQ Stock Market under the symbol “WMAR”. The following table sets forth, for the periods indicated, the high and low closing sales prices for our common stock, as reported by the NASDAQ Stock Market.
| First Quarter |
Second Quarter |
Third Quarter |
Fourth Quarter | |||||||||
| 2009 |
||||||||||||
| High |
$ | 5.75 | $ | 6.25 | $ | 9.50 | $ | 8.20 | ||||
| Low |
$ | 3.80 | $ | 4.95 | $ | 5.48 | $ | 6.88 | ||||
| 2008 |
||||||||||||
| High |
$ | 9.44 | $ | 7.05 | $ | 6.21 | $ | 6.47 | ||||
| Low |
$ | 6.40 | $ | 4.10 | $ | 3.45 | $ | 3.91 | ||||
As of March 9, 2010, there were approximately 7,000 holders of record of our common stock, and the last sale price reported on the NASDAQ Global Market was $10.78 per share.
We have not paid any cash dividends on our common stock, and we do not anticipate doing so in the foreseeable future.
The information required by this item with respect to securities authorized for issuance under equity compensation plans is incorporated by reference from our definitive proxy statement for the 2010 annual meeting of stockholders.
15
Table of Contents
The following graph compares the five-year cumulative total stockholder return on West Marine common stock with the five-year cumulative total return of (i) the NASDAQ Market Index and (ii) peer companies in the Hemscott Industry Group 745—Specialty Retail, Other index. The graph showing the Hemscott Industry Group 745—Specialty Retail, Other was compiled and prepared for West Marine by Morningstar, Inc. The index presented below consists of 62 specialty retailers. †
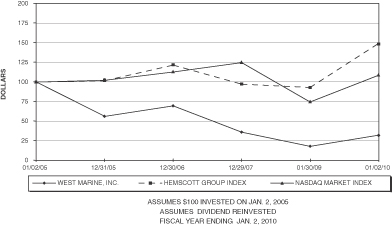
| 01/02/2005 | 12/31/2005 | 12/30/2006 | 12/29/2007 | 01/03/2009 | 01/02/2010 | |||||||||||||
| West Marine, Inc. |
$ | 100.00 | $ | 56.48 | $ | 69.78 | $ | 36.44 | $ | 18.42 | $ | 32.57 | ||||||
| Specialty Retail, Other |
100.00 | 101.71 | 121.44 | 97.29 | 93.10 | 148.88 | ||||||||||||
| NASDAQ Market Index |
100.00 | 102.20 | 112.68 | 124.57 | 74.71 | 108.56 | ||||||||||||
The performance graph set forth above will not be deemed to be incorporated by reference into any filing under the Securities Act of 1933 or under the Securities Exchange Act of 1934, except to the extent that we specifically incorporate it by reference, and will not otherwise be deemed to be soliciting material or to be filed under such Acts.
| † | The specialty retailers in the Hemscott Industry Group 745—Specialty Retail, Other index that are included in West Marine’s performance graph are as follows: A.C. Moore Arts & Crafts, Inc., Able Energy, Inc., ACTIS Global Ventures, Inc., Assured Pharmacy, Inc., Barnes & Noble, Inc., Bio-Clean, Inc., Blink Couture, Inc., Books-A-Million, Inc., Borders Group, Inc., Carbon Credits International, Inc., China Daquing M&H Petroleum, Inc., Clickable Enterprises, Inc., Clyvia, Inc., Coldwater Creek, Inc., Emerging Vision, Inc., Ferrellgas Partners, L.P., Gallery of History, Inc., Gander Mountain Company, Genex Pharmaceutical, Inc., Glacier Water Services, Hancock Fabrics, Inc., Hennes & Mauritz AB, Indigo Books & Music, Inc., Inergy Holdings, L.P., Inergy, L.P., IParty Corp., Jo-Ann Stores, Inc., LI3 Energy, Inc., Luxottica Group S.P.A. (ADR), MarineMax, Inc., Medifast, Inc., Midas, Inc., Office Depot, Inc., OfficeMax, Inc., Omphalos Corp., Ovale Group, Inc., Paper Warehouse, Inc., Perfumania Holdings, Inc., Petal Decorative Accents, Inc., PetSmart, Inc., Regal Life Concepts, Inc., Sally Beauty Holdings, Inc., Sharper Image, Sherwin-Williams Company, Silver Pearl Enterprises, Inc., Sotheby’s, Staples, Inc., Star Gas Partners, L.P., Suburban Propane Partners, L.P., SureQuest Systems, Inc., Tasty Fries, Inc., TechniScan, Inc., Titan Machinery, Inc., Tractor Supply Company, TravelCenters of America LLC, Vertical Branding, Inc., Vibe Records, Inc., Vitamin Shoppe, Inc., WaterPure International, Inc., Wireless Age Communications, Inc., Zagg, Inc., and West Marine, Inc. |
16
Table of Contents
ITEM 6—SELECTED CONSOLIDATED FINANCIAL DATA
The following consolidated balance sheet data for 2009 and 2008 and consolidated statement of operations data for 2009, 2008 and 2007 have been derived from our consolidated financial statements for the fiscal years appearing elsewhere in this report and should be read in conjunction with Management’s Discussion and Analysis of Financial Condition and Results of Operations in Item 7 and our consolidated financial statements and notes thereto in Item 8.
| (in thousands, except per share and operating |
2009 | 2008 | 2007 | 2006 | 2005 | |||||||||||||||
| Consolidated Statement of Operations Information: |
||||||||||||||||||||
| Net revenues |
$ | 588,416 | $ | 631,258 | $ | 679,561 | $ | 716,644 | $ | 692,137 | ||||||||||
| Income (loss) from operations |
10,345 | (22,932 | )(1) | (51,107 | )(3) | (4,356 | )(4) | (666 | )(5) | |||||||||||
| Income (loss) before income taxes |
9,539 | (25,270 | )(1) | (55,069 | )(3) | (10,762 | )(4) | (7,741 | )(5)(6) | |||||||||||
| Net income (loss) |
12,376 | (38,800 | )(1)(2) | (49,976 | )(3) | (7,624 | )(4) | (3,022 | )(5)(6) | |||||||||||
| Net income (loss) per share: |
||||||||||||||||||||
| Basic |
$ | 0.56 | $ | (1.76 | )(1)(2) | $ | (2.30 | )(3) | $ | (0.36 | )(4) | $ | (0.14 | )(5)(6) | ||||||
| Diluted |
0.55 | (1.76 | )(1)(2) | (2.30 | )(3) | (0.36 | )(4) | (0.14 | )(5)(6) | |||||||||||
| Consolidated Balance Sheet Information: |
||||||||||||||||||||
| Working capital |
$ | 157,620 | $ | 183,223 | $ | 207,722 | $ | 213,674 | $ | 256,171 | ||||||||||
| Total assets |
292,237 | 314,592 | 368,318 | 430,129 | 475,997 | |||||||||||||||
| Long-term debt, net of current portion |
— | 47,000 | 52,338 | 69,027 | 117,000 | |||||||||||||||
| Operating Data: |
||||||||||||||||||||
| Stores open at year-end |
335 | 344 | 372 | 377 | 404 | |||||||||||||||
| Comparable stores net sales (decrease) increase |
(3.6 | %) | (6.8 | %) | (1.9 | %) | 2.4 | % | (2.2 | %) | ||||||||||
| (1) | Includes the following items on a pre-tax basis: a $10.7 million pre-tax charge for store closures and other restructuring costs (see Note 3 to our consolidated financial statements for further discussion); a $2.9 million pre-tax charge for impairment of long-lived assets; and $2.2 million of costs related to the now-settled SEC investigation. |
| (2) | Includes the impact of a $23.2 million non-cash charge, to provide a full valuation allowance against all net deferred tax assets, including 2008 additions to deferred tax assets. |
| (3) | Includes the following items on a pre-tax basis: a $56.9 million non-cash charge for impairment of goodwill (see Note 1 to our consolidated financial statements for further discussion); $2.7 million of costs related to the now-settled SEC investigation; $1.3 million of termination severance payments to our former chief executive officer; a $1.3 million non-cash charge for impairment of long-lived assets; and a $0.6 million pre-tax charge for store closure and other restructuring costs. |
| (4) | Includes a $10.9 million pre-tax charge for store closures and other restructuring costs (see Note 3 to our consolidated financial statements for further discussion), and a $4.6 million pre-tax charge for impairment of long-lived assets. |
| (5) | Includes a $4.0 million pre-tax charge for reducing inventory value, an $8.8 million pre-tax charge for cancelled software development projects and a $2.0 million pre-tax charge for discontinuing use of an acquired tradename. |
| (6) | Includes a $0.8 million pre-tax charge for the unamortized portion of loan costs related to the repayment of then-existing debt, in connection with obtaining our current credit facility. |
17
Table of Contents
ITEM 7—MANAGEMENT’S DISCUSSION AND ANALYSIS OF FINANCIAL CONDITION AND RESULTS OF OPERATIONS
The following discussion and analysis is based upon our financial statements as of the dates and for the periods presented in this section. You should read this discussion and analysis in conjunction with the financial statements and supplementary data in Item 8.
Forward-Looking Statements
The statements in this Form 10-K that relate to future plans, events, expectations, objectives or performance (or assumptions underlying such matters) are forward-looking statements that involve a number of risks and uncertainties. These forward-looking statements include, among other things, statements that relate to our future plans, expectations, objectives, performance and similar projections, as well as facts and assumptions underlying these statements or projections. These forward-looking statements may involve known and unknown risks, uncertainties and other factors that may cause our actual results and performance in future periods to be materially different from any future results or performance suggested by the forward-looking statements in this report. Although we believe the expectations reflected in such forward-looking statements are based upon reasonable assumptions, we can give no assurance that actual results will not differ materially from these expectations. These risks, uncertainties and other factors are discussed under risk factors in Item 1A of this report.
Readers are cautioned not to place undue reliance on forward-looking statements, which are based only upon information available as of the date of this report. We do not undertake, and specifically disclaim any obligation, to publicly release the result of any revisions that may be made to any forward-looking statements to reflect the occurrence of anticipated or unanticipated events or circumstances after the date of such statements even if experience or future changes make it clear that any projected results expressed or implied therein will not be realized.
Overview
We are the largest boating supply retailer in the world with 2009 net revenues of $588.4 million and net income of $12.4 million. Our business strategy is to offer an assortment of competitively-priced merchandise for the boat and for the boater that meets the needs of individual boaters and boating businesses, provides great customer experiences and offers the convenience of multi-channel shopping.
We believe that revenues were adversely affected during fiscal year 2009 by less-than-desired in-stock levels. We attribute this to a combination of factors. The two most significant of these were higher demand than forecasted and poor fulfillment from a number of our key suppliers. While we cannot quantify missed sales due to in-stock issues, we do believe merchandise availability had a negative impact on us in 2009, and we have taken, and will continue to take, a host of targeted steps to address this issue during 2010. We have increased our focus and investment in the total supply chain, and we believe we will be in a better position to react to changes in customer demand.
A few of the new or continuing key strategies we are implementing or building upon during 2010 include:
| • | Expanding our merchandise selection, including adding product assortment throughout all of our wide range of merchandise categories and accelerating development of West Marine private-label brands across a number of categories. |
| • | Improving the on-line experience for our customers with more and better content, improved search capabilities, faster speed and other new features. |
| • | Providing outstanding product information and search capabilities by taking steps to better provide information that customers want and need through technology solutions and educational programs that help our customers and associates better access products and information. |
| • | Continuing associate development, which will prioritize both product knowledge and management development with a focus on better planning, execution and supervisory skills. |
18
Table of Contents
We have three reportable segments: Stores; Port Supply; and Direct Sales. Our Stores segment generated approximately 89% of our 2009 net revenues. Our 335 Company-operated stores open at the end of 2009 are located in 38 states, Puerto Rico and Canada. In addition, we have two franchised stores in Turkey. Our Port Supply segment is one of the largest wholesale distributors of marine equipment in the United States. Products shipped to Port Supply customers directly from our warehouses represented approximately 5% of our 2009 net revenues. Our Direct Sales segment, which includes our Internet and call center operations, offers customers around the world more than 50,000 products and it accounted for the remaining 6% of our 2009 net revenues.
Results of Operations
The following table sets forth certain income statement components expressed as a percent of net revenues:
| 2009 | 2008 | 2007 | |||||||
| Net revenues |
100.0 | % | 100.0 | % | 100.0 | % | |||
| Cost of goods sold |
72.7 | % | 73.5 | % | 71.3 | % | |||
| Gross profit |
27.3 | % | 26.5 | % | 28.7 | % | |||
| Selling, general and administrative expense |
25.8 | % | 28.0 | % | 27.6 | % | |||
| Goodwill impairment |
0.0 | % | 0.0 | % | 8.4 | % | |||
| Store closures and other restructuring costs |
(0.3 | %) | 1.6 | % | 0.1 | % | |||
| Impairment of long-lived assets |
0.0 | % | 0.5 | % | 0.1 | % | |||
| Income(loss) from operations |
1.8 | % | (3.6 | %) | (7.5 | %) | |||
| Interest expense |
0.2 | % | 0.4 | % | 0.6 | % | |||
| Income (loss) before income taxes |
1.6 | % | (4.0 | %) | (8.1 | %) | |||
| Provision (benefit) for income taxes |
(0.5 | %) | 2.1 | % | (0.7 | %) | |||
| Net income (loss) |
2.1 | % | (6.1 | %) | (7.4 | %) |
Fiscal 2009 Compared with Fiscal 2008
Net revenues for 2009 were $588.4 million, a decrease of 6.8%, compared to net revenues of $631.3 million for 2008. Net revenues were unfavorably impacted by $6.1 million due to an extra week in fiscal year 2008, when compared to fiscal year 2009. Net income for 2009 was $12.4 million. This compares to a net loss for 2008 of $38.8 million, which included a $10.7 million pre-tax charge for store closures and other restructuring costs, a $2.9 million non-cash, pre-tax charge for impairment of long-lived assets and the impact of a $23.2 million charge to provide a valuation allowance against our deferred tax assets.
Segment revenues
Net revenues for the Stores segment decreased $26.4 million, or 4.8%, to $525.4 million in 2009, primarily due to an $18.7 million, or 3.6%, decrease in comparable store sales and a $27.1 million decrease attributable to store closures in 2008 and 2009. Partially offsetting these decreases was $18.4 million of revenue from new stores opened in 2008 and 2009. The Stores segment generated $5.5 million of revenues in the first and extra week of fiscal 2008, which negatively impacted comparisons year-over-year. During fiscal 2009, we experienced some favorable impacts on our business including continued improvement in boat usage, continued movement towards do-it-yourself projects, and favorable results from our product expansions and larger store formats. We believe we have also benefited from changes in the competitive landscape, including the liquidation of one of our primary national competitors, and lower gas prices during peak boating season.
While recently we have seen increased boat usage in some markets, we expect consumers to continue to carefully evaluate their needs-based boating purchases and continue to be very conservative with their spending on discretionary items. During 2010, we expect to open and close a small number of stores in connection with
19
Table of Contents
our real estate optimization strategy of evolving to having fewer, larger stores in many of our key markets. As a result of these actions, we expect that our overall store counts will decline slightly, while our total selling square footage will remain stable or increase slightly. In addition, we will continue with our practice of monitoring the operating performance and economics of all store locations and evaluating for closure any underperforming stores when the economics favor doing so.
Port Supply net revenues through our distribution centers decreased $10.5 million, or 26.7%, to $28.9 million in 2009, primarily due to lower sales year-over-year to two customer types, boat dealers and boat builders. We believe these customers were negatively impacted by the challenging economic environment and tight credit markets and we expect sales to these customers to stabilize during fiscal 2010.
Net revenues from our Direct Sales segment decreased $5.9 million, or 14.7%, to $34.1 million, due to a decline in the international market year-over-year, at a much greater pace than domestic activity. During fiscal 2010, we do not expect total revenues from this segment to exceed revenues levels experienced last year.
We believe that ongoing weakness in the economy will continue to put downward pressure on our revenues, with corresponding risks to our earnings and cash flow as our customer traffic and sales are most closely tied to boat usage, which is a discretionary spending item. However, we also believe that we may continue to benefit from changes in the competitive landscape. Additionally, we expect some favorable impact on our business from continued movement to do-it-yourself projects and from our product expansions and larger store formats. We have set conservative budgets for 2010 and will continue to focus on managing expenses and maximizing cash flow.
Comparable store sales
Comparable store sales for the 52-week period ended January 2, 2010 decreased by 3.6%, or $18.7 million, compared to the 53-week period ended January 3, 2009. Comparable store sales changes during the first, second, third and fourth quarters of 2009 were (6.8%), (1.0%), (4.3%) and (4.8%), respectively. The overall comparable store trends were consistent across the geographic regions. The decline in comparable store sales reflects lower sales of discretionary items, partially offset by increased sales of core boating parts and accessories. While we have seen increased boat usage in some markets, we expect consumers to carefully evaluate their needs-based boating purchases and to continue to be conservative with their spending on discretionary items. We currently anticipate that our 2010 comparable store sales will stabilize and be relatively flat when compared to 2009.
Gross profit
Gross profit decreased by $6.5 million, or 3.9%, to $160.9 million in 2009, compared to $167.4 million for 2008, primarily due to lower sales. However, gross profit increased as a percentage of net revenues by 0.8% to 27.3% in 2009, compared to 26.5% in 2008, primarily due to a 0.9% increase in product margin driven by more effective promotions, less clearance activity and a shift in revenues to higher-margin core boating categories, such as maintenance. Additionally, inventory shrinkage improved by 0.2% and buying and distribution costs leveraged by 0.1%. Improvements were partially offset by the deleveraging of 0.4% in occupancy expense. Occupancy is our largest fixed expense, and its impact on gross margin rate is largely driven by sales results and the fixed nature of the expense.
Selling, general and administrative expense
Selling, general and administrative (“SG&A”) expense decreased by $24.5 million, or 13.9%, to $152.3 million in 2009, compared to $176.8 million for 2008 and decreased as a percentage of revenues by 2.2% to 25.8% in 2009, compared to 28.0% in 2008. The decrease in SG&A expense primarily was due to $9.9 million in lower support and selling overhead expense, including a $3.2 million reduction in costs related to the now-settled
20
Table of Contents
SEC investigation. SG&A was also lower by $8.4 million for lower payroll, marketing and other variable expenses reflecting lower revenues. Decreased expenses associated with stores closed in 2009 resulted in a further reduction of $5.5 million. Expenses also were lower by $4.8 million due to favorable foreign currency translation gains compared to the 2008 fiscal year. Lower expenses were partially offset by $7.6 million in higher accrued bonus expense reflecting performance above budgeted expectations and $1.8 million in higher expense related to the additional week in fiscal 2008.
Store closure and other restructuring costs
Store closure and other restructuring costs for 2009 decreased by $12.4 million compared to 2008. During 2008, we recognized restructuring expenses of $10.7 million consisting of $6.9 million for store closures, $0.1 million for Port Supply, $2.9 million for closing a distribution center, $0.5 million for repositioning the call center and $0.3 million of severance costs for reductions in force at our Watsonville, California support center. Also in 2008, due to unfavorable macroeconomic conditions, we increased reserves for lease contract termination obligations by $2.0 million for stores closed as part of our 2006 restructuring plan. During the fourth quarter of 2009, we reached an agreement to sublease a location which had the largest associated termination obligation. The terms of this particular agreement were more favorable than what we originally estimated and resulted in a $1.7 million reversal in 2009 of the previously accrued estimated costs. For additional information, see Note 3 to our consolidated financial statements.
Impairment of long-lived assets
Expenses related to the impairment of long-lived assets were less than $0.1 million in fiscal 2009, compared to $2.9 million in 2008. The 2008 non-cash charge primarily was attributable to the 45 underperforming stores, of which 19 have been closed.
Interest expense
Interest expense decreased $1.5 million, or 65.5%, to $0.8 million in 2009, compared to $2.3 million in 2008. The decrease in interest expense was due to both lower interest rates and lower average outstanding bank borrowings in fiscal 2009, compared to fiscal 2008.
Income taxes
Our effective income tax rate for 2009 was a benefit of 29.7%, compared to a provision of 53.5% in 2008. The change in our effective tax rate was primarily due to the use of net operating losses under recently enacted federal legislation which allows companies to extend the carry back period from two to five years for periods beginning or ending in 2008 or 2009, as well as our ability to use timing differences not previously benefited due to the valuation allowance. The year-over-year difference also was due to management’s decision in 2008 to increase the valuation allowance by $23.2 million to bring it to a valuation allowance of $33.9 million against the deferred tax assets. For more information, see Note 8 to our consolidated financial statements.
Fiscal 2008 Compared with Fiscal 2007
Net revenues for 2008 were $631.3 million, a decrease of 7.1%, compared to net revenues of $679.6 million for 2007. Net loss for 2008 was $38.8 million, which included a $10.7 million pre-tax charge for store closures and other restructuring costs, a $2.9 million non-cash, pre-tax charge for impairment of long-lived assets and the impact of a $23.2 million charge to provide a valuation allowance against our deferred tax assets. This compares to a net loss for 2007 of $50.0 million, which included a $56.9 million non-cash, pre-tax charge for impairment of goodwill, $1.3 million non-cash, pre-tax charge for impairment of long-lived assets and $0.6 million non-cash, pre-tax charge for store closures and other restructuring costs. Fiscal 2008 was a 53-week fiscal period, and fiscal 2007 was a 52-week period.
21
Table of Contents
Segment revenues
Net revenues for the Stores segment decreased $42.3 million, or 7.1%, to $551.8 million in 2008, primarily due to a $38.2 million, or 6.8%, decrease in comparable store sales and an $18.5 million decrease attributable to store closures in 2007 and 2008. Partially offsetting the sales decreases was $11.5 million of revenues from new stores opened in 2007 and 2008.
Port Supply net revenues through our distribution centers decreased $2.2 million, or 5.2%, to $39.5 million in 2008, primarily due to increased revenues to Port Supply customers through our store locations which are included in Stores revenues. Across the Port Supply business (stores and warehouse), we observed lower sales year-over-year to two customer types, boat dealers and boat builders. We believe these customers were negatively impacted by the challenging economic environment and credit crisis.
Net revenues from our Direct Sales segment decreased $3.9 million, or 8.9%, to $40.0 million, due to decreased revenues from our call center channel. The decrease from the call center channel was offset partially by increased Internet revenues. The decline in this segment was driven by lower domestic sales, partially offset by higher sales in some international markets.
Comparable store sales
Comparable store sales for the 53-week period ending January 3, 2009 decreased in 2008 by 6.8%, or $38.2 million, compared to the 52-week period ending December 29, 2007. Comparable store sales changes during the first, second, third and fourth quarters of 2008 were (9.4%), (7.8%), (4.7%) and (5.1%), respectively. The decline in comparable store sales reflected lower sales of higher-priced discretionary items and lower in-store traffic levels throughout the year. Sales of usage-based products, such as fishing and watersports equipment, declined at a rate greater than the overall comparable store trend, which we believe was indicative of reduced boating activity. The overall comparable store trends were consistent across the country.
Gross profit
Gross profit decreased by $27.4 million, or 14.1%, to $167.4 million in 2008, compared to $194.9 million for 2007. Gross profit decreased primarily due to lower sales. Gross profit as a percentage of net revenues decreased to 26.5% in 2008, a decrease of 2.2% compared to 28.7% in 2007. Gross profit was lower as a percentage of revenues by 0.8% due to occupancy expense. Vendor allowances deleveraged, down 0.7%, because of the reduced purchases for 2008 in line with lower sales and reduced inventory. Buying and distribution also contributed to the decline as a percentage of revenues, down 0.4%.
Selling, general and administrative expense
SG&A expense decreased by $10.4 million, or 5.6%, to $176.8 million in 2008, compared to $187.2 million for 2007 and increased as a percentage of revenues to 28.0% in 2008, a 0.4% increase, compared to 27.6% in 2007. The impact of expense controls implemented in 2008, combined with lower variable expenses driven by lower revenues, resulted in a $7.8 million decrease. Decreased expenses associated with stores closed in 2008 drove a further reduction of $3.4 million. Expenses were also lower due to lower management bonuses with a year-over-year reduction of $1.9 million in 2008 and $1.3 million paid in fiscal 2007 to our former chief executive officer as severance compensation. Lower expenses were offset partially by $2.8 million in unfavorable foreign currency translation adjustments.
Store closure and other restructuring costs
In 2008, we anticipated closing a small number of stores, which we originally estimated to be in the range of 10 to 15 locations. These closures primarily were due to relocation, or consolidation of smaller stores into fewer, larger stores to better serve our markets. During the second quarter of fiscal 2008, we conducted a more detailed
22
Table of Contents
analysis of store operations, particularly in light of deteriorating boating market conditions, and concluded that additional underperforming stores should be closed. During the year, we closed 32 stores spread across several major boating markets. During the third quarter of 2008, as part of our business restructuring effort, we decided to close our distribution center located in Hagerstown, Maryland, and our call center located in Largo, Florida. We recognized restructuring expenses of $10.7 million consisting of $6.9 million for store closures, $0.1 million for Port Supply, $2.9 million for the distribution center, $0.5 million for the call center and $0.3 million of severance costs for reductions in force at our Watsonville, California support center. For additional information, see Note 3 to our consolidated financial statements.
Impairment of long-lived assets
Impairment of long-lived assets was $2.9 million in fiscal 2008, compared to $1.3 million in 2007. The 2008 charge primarily was attributable to the impairment of 45 stores. The 2007 charge was attributable to the impairment of store and information technology assets.
Interest expense
Interest expense decreased by $1.6 million, or 41.0%, to $2.3 million in 2008, compared to $4.0 million in 2007, due to both lower interest rates and lower average outstanding bank borrowings in fiscal 2008, compared to fiscal 2007.
Income taxes
Our effective income tax rate for 2008 was a provision of 53.5%, compared to a benefit of 9.2% in 2007. The change in our effective tax rate was due to management’s decision to establish a valuation allowance of $23.2 million against the net deferred tax assets. For more information, see Note 8 to our consolidated financial statements.
Liquidity and Capital Resources
We ended 2009 with cash of $10.3 million, an increase from $7.5 million at the end of 2008. Working capital, the excess of current assets over current liabilities, decreased to $157.6 million at the end of 2009, compared with $183.2 million at the end of 2008. The decrease in working capital primarily was attributable to a $26.0 million reduction in inventory at the end of 2009 as compared to year-end 2008. Neither our access to, nor the value of, our cash equivalents was materially affected by the liquidity problems experienced by certain financial institutions over the past couple of years.
Our cash needs for working capital are supported by a secured credit facility. There is risk to this capital resource stemming from current market conditions in that the amount we have available to borrow under our loan agreement primarily is driven by the estimated liquidation value of our inventory. External factors, such as increased liquidations and bankruptcies in the marketplace, could put downward pressure on this liquidation value and thus our associated borrowing availability. However, we continue to take steps to mitigate this risk. First, we are focusing on maximizing cash flow and minimizing borrowing needs. We expect to accomplish this by: (i) increasing inventory turnover, which will require lower working capital to maintain fresh and adequate inventory at our stores; (ii) continuing to focus on expense control, including continual re-engineering efforts to simplify and streamline administrative, inventory and other business processes, and to shrink or eliminate overhead costs as and when necessary or appropriate; and (iii) being conservative in capital spending and concentrating on investments with a demonstrable financial return. Second, we are improving the quality of our inventory by controlling the proportion of overstocked or discontinued goods. Third, we are maintaining communications with our lenders to keep them apprised of our business plans and to monitor their ability to fund their loan commitment.
23
Table of Contents
Economic conditions remain unfavorable and credit markets remain tight. As a result, the pricing of debt under our existing credit facility may be favorable compared to the current market. If renegotiated today, we believe our pricing would be worse and would likely result in an incremental increase in interest charges. We do not believe such an incremental cost would have a material impact on our consolidated financial statements.
Operating activities
During 2009, our primary source of liquidity was cash flow from operations. Net cash provided by operating activities was $62.6 million for 2009, compared to $20.6 million last year. Net cash provided by operating activities improved year-over-year by $42.0 million reflecting lower SG&A expense and no restructuring charges that drove our net income and $26.0 million of lower merchandise inventories due to lower purchases. The lower inventory purchases resulted not only from lower sales expectations, but also from our focus on better overall inventory management and correct product assortment in each store based on customer demographics. The change in cash provided by operating activities year-over-year was also driven by higher accounts payable as inventory purchases were higher in the last several weeks of the year versus the prior year as we ramped up our purchases of core goods earlier in the 2010 season to enable us to maintain in-stock levels to react to fluctuating customer supply and demand.
Moreover, for the first time in many years, we were debt-free during the entire fourth quarter of 2009 due to our continuing focus on working capital management. As a result, in accordance with applicable accounting guidance, checks outstanding at period end were recorded as a reduction to cash and corresponding reduction to accounts payable. Historically, we funded outstanding checks with draws under our credit facility. When we expect and intend to fund outstanding checks through borrowings under our credit agreement, we do not record a reduction to accounts payable until the checks are cashed and a corresponding increase in borrowings is recorded. As of January 2, 2010, the impact was a $3.8 million reduction of both cash (current assets) and accounts payable (current liabilities).
Capital growth
In 2009, our capital expenditures were $13.7 million, mainly for new stores, store remodels, information technology and investment in supply chain efficiencies. We opened nine new stores and remodeled two stores in 2009. During 2010, we expect a moderate increase in capital expenditures from the 2009 levels, mainly for store development activities, including new stores, store remodels and expansions, and information technology enhancements. We intend to fund our expansion through cash generated from operations and, if necessary, credit facility borrowings.
Financing arrangements
Net cash used in financing activities was $46.0 million in 2009, primarily consisting of $47.0 million in net credit facility repayments, partially offset by $1.0 million in cash provided by financing activities related to associate share-based compensation plans.
We have a credit facility that allows for borrowings of up to $225.0 million and that expires in December 2010. Borrowing availability is based on a percentage of our inventory (excluding capitalized indirect costs) and certain accounts receivable. At our option, subject to certain conditions and restrictions, our loan agreement provides up to $25.0 million in additional financing during the term. The credit facility is guaranteed by our subsidiaries and is secured by a security interest in all of our accounts receivable and inventory and that of our subsidiaries, certain other assets related thereto, and all proceeds thereof. The credit facility includes a $50.0 million sub-facility available for the issuance of commercial and stand-by letters of credit. The credit facility also includes a sub-limit of up to $20.0 million for same day advances.
At our election, borrowings under the credit facility bear interest based upon one of the following rates: (1) the prime rate announced by Wells Fargo Bank, National Association at its principal office in San Francisco, California or (2) the interest rate per annum at which deposits in U.S. dollars are offered by reference lenders to
24
Table of Contents
prime banks in designated markets located outside the United States. In each case, the applicable interest rate is increased by a margin imposed by the loan agreement.
The applicable margin for any date will depend upon the amount of available credit under the revolving facility. The loan agreement also imposes a commitment fee on the unused portion of the revolving loan facility. For 2009, 2008 and 2007, the weighted average interest rate on all of our outstanding borrowings was 1.8%, 4.2% and 6.6%, respectively.
Although our loan agreement contains customary covenants, including but not limited to, restrictions on our ability and that of our subsidiaries to incur debt, grant liens, make acquisitions and investments, pay dividends and sell or transfer assets, it does not contain debt or other similar financial covenants, such as maintaining certain specific leverage, debt service or interest coverage ratios. Instead, our loan is asset-based (which means our lenders maintain a security interest in our inventory and accounts receivable which serve as collateral for the loan), and the amount we may borrow under our loan agreement at any given time is determined by the estimated liquidation value of these assets as determined by the lenders’ appraisers. Additional loan covenants include a requirement that we maintain minimum revolving credit availability equal to the lesser of $15.0 million or 7.5% of the borrowing base. In addition, there are customary events of default under our loan agreement, including failure to comply with our covenants. If we fail to comply with any of the covenants contained in the loan agreement, an event of default occurs which, if not waived by our lenders or cured within the applicable time periods, results in the lenders having the right to accelerate repayment of all outstanding indebtedness under the loan agreement before the stated maturity date. A default under our loan agreement also could significantly and adversely affect our ability to obtain additional or alternative financing. For example, the lenders’ obligation to extend credit is dependent upon our compliance with these covenants. As of January 2, 2010, we were in compliance with our bank covenants.
At the end of fiscal year 2009, there were no amounts outstanding under this credit facility, and $88.7 million was available for future borrowings. At the end of fiscal year 2008, borrowings under this credit facility were $47.0 million, bearing interest at rates ranging from 1.7% to 3.3%, and $73.6 million was available to be borrowed. At the end of fiscal year 2009 and 2008, we had $7.4 million and $5.8 million, respectively, of outstanding commercial and stand-by letters of credit.
Our aggregate borrowing base cannot exceed $225.0 million and was $103.8 million and $136.7 million as of fiscal year 2009 and 2008, respectively. Our borrowing base at each of our last two fiscal year-ends consisted of the following (in millions):
| 2009 | 2008 | |||||||
| Accounts receivable availability |
$ | 3.9 | $ | 5.2 | ||||
| Inventory availability |
105.5 | 136.2 | ||||||
| Less: reserves |
(5.6 | ) | (4.7 | ) | ||||
| Total borrowing base |
$ | 103.8 | $ | 136.7 | ||||
Our aggregate borrowing base was reduced by the following obligations (in millions):
| Ending loan balance |
$ | — | $ | 47.0 | ||
| Outstanding letters of credit |
7.4 | 5.8 | ||||
| Total obligations |
$ | 7.4 | $ | 52.8 | ||
Accordingly, our availability as of fiscal year 2009 and 2008, respectively, was (in millions):
| Total borrowing base |
$ | 103.8 | $ | 136.7 | ||||
| Less: obligations |
(7.4 | ) | (52.8 | ) | ||||
| Less: minimum availability |
(7.7 | ) | (10.3 | ) | ||||
| Total availability |
$ | 88.7 | $ | 73.6 | ||||
25
Table of Contents
As mentioned above, our credit facility expires in December 2010. Therefore, we are currently exploring financing alternatives and are in discussions with various parties. We expect to secure a new credit facility before the expiration of our current facility.
Contractual obligations
Aggregate information about our unconditional contractual obligations as of January 2, 2010 is presented in the following table (in thousands).
| Total | 2010 | 2011 | 2012 | 2013 | 2014 | After 5 years | |||||||||||||||
| Contractual cash obligations: |
|||||||||||||||||||||
| Operating leases (1) |
$ | 196,255 | $ | 42,401 | $ | 35,644 | $ | 28,622 | $ | 20,974 | $ | 15,933 | $ | 52,681 | |||||||
| Purchase commitments (2) |
27,316 | 27,316 | 0 | 0 | 0 | 0 | 0 | ||||||||||||||
| Bank letters of credit |
7,302 | 7,302 | 0 | 0 | 0 | 0 | 0 | ||||||||||||||
| Other long-term liabilities (3) |
3,196 | 1,321 | 1,213 | 632 | 30 | 0 | 0 | ||||||||||||||
| $ | 234,069 | $ | 78,340 | $ | 36,857 | $ | 29,254 | $ | 21,004 | $ | 15,933 | $ | 52,681 | ||||||||
| (1) | Operating lease amounts in this table represent minimum amounts due under existing agreements and exclude costs of insurance, taxes, repairs and maintenance. |
| (2) | All but a limited number of our purchase commitments are cancelable by us without penalty; however, we do intend to honor these commitments. |
| (3) | The timing of the remaining cash obligations including $1.7 million for uncertain tax positions cannot be predicted. See “Critical Accounting Policies and Estimates” for more information. |
We are party to various arrangements that are conditional in nature and obligate us to make payments only upon the occurrence of certain events, such as delivery of functioning software products. Because it is not possible to predict the timing or amounts that may be due under these conditional arrangements, no such amounts have been included in the table above.
Off-balance sheet arrangements
Operating leases are the only financing arrangements not reported on our consolidated balance sheets. We do not participate in transactions that generate relationships with unconsolidated entities or financial partnerships, such as special purpose entities or variable interest entities, which would have been established for the purpose of facilitating off-balance sheet arrangements or other limited purposes. As of January 2, 2010, we are not involved in any unconsolidated special purpose entities or variable interest entities.
Seasonality
Historically, our business has been highly seasonal. In 2009, approximately 65% of our net sales and all of our net income occurred during the second and third quarters, principally during the period from April through August, which represents the peak months for boat buying, usage and maintenance in most of our markets.
Business Trends
Our research indicates that the U.S. boating industry continues to experience a down cycle, as evidenced by lower sales trends in each of our business segments compared to last year, lower new and used boat sales, and declining boat registrations in key states. There are a number of steps we are continuing to implement in response to
26
Table of Contents
this challenging industry climate to ensure orderly management of the business and preserve our financial strength and maximize our opportunity when the marketplace recovers. Our focus has been to reduce expenses and maximize cash flow by:
| • | controlling our operating expenses through variable expense management, as well as reengineering and streamlining business processes; |
| • | continuing to improve the quality of our inventory by tightly controlling overstocked or discontinued goods; |
| • | opening nine stores, closing 18 stores and remodeling or expanding a small number of stores during 2009; |
| • | establishing a conservative budget for 2010, which focuses on expense control and emphasizes working capital management; and |
| • | further exploring methods and strategies to drive sales and market presence. |
We believe weak economic conditions and uncertainty in the financial markets have adversely impacted discretionary consumer spending in an already challenging climate for the boating industry, and we believe that this economic weakness will continue to have an impact on our sales revenue, with corresponding risks to our earnings and cash flow in 2010 (see the “Fiscal 2009 Compared with Fiscal 2008—Segment Revenues” discussion included above).
Critical Accounting Policies and Estimates
Management’s discussion and analysis of West Marine’s financial condition and results of operations are based upon our consolidated financial statements, which have been prepared in conformity with accounting principles generally accepted in the United States of America. The preparation of these financial statements requires the appropriate application of certain accounting policies, many of which require us to make estimates and assumptions about future events and their impact on amounts reported in our financial statements and related notes. Since future events and their impact cannot be determined with certainty, actual results could differ from our assumptions and estimates, and such differences could be material.
We believe our application of accounting policies, and the estimates inherently required therein, are reasonable. These accounting policies and estimates are periodically reevaluated and adjustments are made when facts and circumstances dictate a change. Our accounting policies are more fully described in Note 1 to our consolidated financial statements, in Item 8 of this report.
27
Table of Contents
Management believes that the following accounting estimates are the most critical to aid in fully understanding and evaluating our reported financial results, and they require management’s most difficult, subjective or complex judgments, resulting from the need to make estimates about the effect of matters that are inherently uncertain. Management has reviewed these critical accounting estimates and related disclosures with the audit committee of our board of directors.
| Description |
Judgments and Uncertainties |
Effect if Actual Results Differ From Assumptions | ||
| Inventory—Valuation Adjustments |
||||
| We value our merchandise inventories at the lower of the cost or market value on an average cost basis. Inventory cost is written down to market value when cost exceeds market value, which we estimate using current levels of aged and discontinued product and historical analysis of items sold below cost. Lower of cost or market adjustments included in ending inventory at January 2, 2010 and January 3, 2009 were $5.7 million and $6.0 million, respectively. | Our lower of cost or market adjustments contain uncertainties because the calculations require management to make assumptions and to apply judgment regarding forecasted consumer demand, the promotional environment, technological obsolescence and consumer preferences. | We have not made any material changes in our inventory valuation methodology during the past three fiscal years. We do not believe there is a reasonable likelihood that there will be a material change in the future estimates or assumptions we use to calculate our lower of cost or market adjustments. However, if estimates regarding consumer demand are inaccurate or changes in technology affect demand for certain products in an unforeseen manner, we may be exposed to losses that could be material. If we had to take additional markdowns of 10% on all items included in merchandise inventory write-downs at January 2, 2010, net income would be affected by approximately $0.3 million in the fiscal year then ended. | ||
| Inventory—Capitalized Indirect Costs |
||||
| Inventory cost includes certain indirect costs related to the purchasing, transportation and warehousing of merchandise. Capitalized indirect costs include freight charges for moving merchandise to warehouses or store locations and operating costs of our merchandising, replenishment and distribution activities. We recognize indirect costs included in inventory value as an increase in cost of goods sold as the related products are sold. Indirect costs included in inventory value at January 2, 2010 and January 3, 2009 was $19.2 million and $21.5 million, respectively. | Our capitalized indirect costs contain uncertainties because the calculations require management to make assumptions and to apply judgment regarding factors of our cost accounting system, the soundness of the underlying principles and their consistent application. In interim periods, the calculation of capitalized indirect costs requires management to estimate capitalized indirect costs, merchandise purchases and inventory levels for the full fiscal year. | We do not believe there is a reasonable likelihood that there will be a material change in the future assumptions or estimates we use to calculate our capitalized indirect costs. However, if our assumptions or estimates are inaccurate, we may be exposed to losses or gains that could be material. A 10% difference in our expenses included in capitalized indirect costs at January 2, 2010 would have affected net income by approximately $1.2 million in the fiscal year then ended. | ||
28
Table of Contents
| Description |
Judgments and Uncertainties |
Effect if Actual Results Differ From Assumptions | ||
| Vendor Allowances Receivable |
||||
| We establish a receivable and reduce inventory cost for income generated from vendor-sponsored programs, or vendor allowances, that is earned but not yet received from our vendors, which we calculate based on provisions of the programs in place. Due to the complexity of the individual agreements with vendors, we perform detailed analyses and review historical trends to determine an appropriate level for the vendor allowances receivable. Our receivable for vendor allowances at both January 2, 2010 and January 3, 2009 was $3.4 million, and is included in other current assets. | Our vendor allowances receivable contains uncertainties because the calculation requires management to make assumptions and to apply judgment regarding a number of factors, including our ability to collect amounts due from vendors and in interim periods requires management to estimate future inventory purchases. | We have not made any material changes in the accounting methodology used to establish our vendor allowances receivable during the past three fiscal years. We do not believe there is a reasonable likelihood that there will be a material change in the future estimates or assumptions we use to calculate our vendor allowances receivable. However, if our assumptions or estimates are inaccurate, we may be exposed to losses or gains that could be material. A 10% difference in our estimate of our ability to collect vendor allowances at January 2, 2010 would have affected net income by approximately $0.1 million in the fiscal year then ended. | ||
| Costs Associated With Exit Activities |
||||
| We occasionally vacate stores prior to the expiration of the related lease. For vacated locations that are under long-term leases, we record an expense for the net present value of the difference between our future lease payments and related costs (e.g., real estate taxes and common area maintenance) from the date of closure through the end of the remaining lease term, net of expected future sublease rental income.
Our estimate of future cash flows is based on our analysis of the specific real estate market, including input from real estate firms; and economic conditions that can be difficult to predict. Costs associated with exit activities included in accrued expenses at January 2, 2010 and January 3, 2009 were $4.5 million and $9.1 million, respectively. |
Our location closing liability contains uncertainties because management is required to make assumptions and to apply judgment to estimate the duration of future vacancy periods, the amount and timing of future settlement payments, and the amount and timing of potential sublease rental income. When making these assumptions, management considers a number of factors, including historical settlement experience, the owner of the property, the location and condition of the property, the terms of the underlying lease, the specific marketplace demand and general economic conditions. | We have not made any material changes in the accounting methodology used to establish our location closing liability during the past three fiscal years. We do not believe there is a reasonable likelihood that there will be a material change in the estimates or assumptions we use to calculate our location closing liability. However, if actual results are not consistent with our estimates or assumptions, we may be exposed to losses or gains that could be material. A 10% change in our location closing liability at January 2, 2010 would have affected net earnings by approximately $0.3 million in fiscal 2009. | ||
29
Table of Contents
| Description |
Judgments and Uncertainties |
Effect if Actual Results Differ From Assumptions | ||
| Impairment of long-lived assets |
||||
| Long-lived assets other than goodwill and indefinite-lived intangible assets, which are separately tested for impairment, are reviewed and evaluated quarterly.
When evaluating long-lived assets for potential impairment, we first compare the carrying value of the asset to the asset’s estimated future cash flows (undiscounted and without interest charges). If the estimated future cash flows are less than the carrying value of the asset, we calculate an impairment loss. The impairment loss calculation compares the carrying value of the asset to the asset’s estimated fair value, which may be based on estimated future undiscounted cash flows. We recognize an impairment loss if the amount of the asset’s carrying value exceeds the asset’s estimated fair value. If we recognize an impairment loss, the adjusted carrying amount of the asset becomes its new cost basis. We may also accelerate depreciation over the asset’s revised useful life if it is identified for replacement or abandonment at a specific future date.
In fiscal years 2009 and 2008, we incurred less than $0.1 million and $2.9 million charges, respectively, for impairment of long-lived assets. |
Our impairment loss calculations contain uncertainties because they require management to make assumptions and to apply judgment in order to estimate future cash flows and asset fair values, including forecasting useful lives of the assets and selecting the discount rate that reflects the risk inherent in future cash flows. | We have not made any material changes in our impairment loss assessment methodology during the past three fiscal years. We do not believe there is a reasonable likelihood that there will be a material change in the estimates or assumptions we use to calculate long-lived asset impairment losses. However, if actual results are not consistent with our estimates and assumptions used in estimating future cash flows and asset fair values, we may be exposed to losses that could be material. | ||
| Deferred Tax Assets—Valuation Allowance |
||||
| We recorded a valuation allowance to reduce our deferred tax assets to the amount we believe is more likely than not to be realized. As we determined that it is more likely than not that the benefit from our deferred tax assets will not be realized, we have a valuation allowance against net deferred tax assets of $23.2 million. If our assumptions change | Our valuation allowance contains uncertainties because management is required to make assumptions and to apply judgment to estimate the future realization of net deferred tax assets. | We apply consistent methodologies to assess the need for a valuation allowance each quarter. Although management believes that its judgments and estimates are reasonable, realization of net deferred tax assets ultimately depends on future taxable income. Actual results could differ. | ||
30
Table of Contents
| Description |
Judgments and Uncertainties |
Effect if Actual Results Differ From Assumptions | ||
| and we determine we will be able to realize these deferred tax assets the tax benefits related to any reversal of the valuation allowance will be accounted for in the period in which we make such determination. Likewise, should we determine that we would be able to realize our deferred tax assets in the future in excess of our recorded amount, an adjustment to the deferred tax assets would increase income in the period such determination was made. | ||||
| Liabilities for Self Insurance or High Deductible Losses |
||||
| We are self-insured for certain losses, including those related to employee healthcare. However, we obtain third-party insurance coverage to limit our exposure to these claims. In other cases, we purchase commercial insurance, such as for workers’ compensation and general liability claims. We insure workers’ compensation losses through a high-deductible program, and we recognize our liability for the ultimate payment of incurred claims and claims adjustment expenses by accruing liabilities on an actuarial basis which represent estimates of future amounts necessary to pay claims and related expenses with respect to covered events that have occurred.
When estimating our liabilities relating to self-insurance or high-deductible insurance programs, we consider a number of factors, including historical claims experience, severity factors and actuarial analysis.
Periodically, management reviews its assumptions and the valuations provided by actuarial analysis to determine the adequacy of our self-insured liabilities. |
Liabilities for our self-insured losses or high-deductible insurance programs contain uncertainties because management is required to make assumptions and to apply judgment to estimate the ultimate cost to settle reported claims and claims incurred but not reported as of the balance sheet date. | We do not believe there is a reasonable likelihood that there will be a material change in the estimates or assumptions we use to calculate these liabilities. However, if actual results are not consistent with our estimates or assumptions, we may be exposed to losses or gains that could be material.
A 10% change in our self-insured liabilities and loss reserves relating to high-deductible insurance programs at January 2, 2010, would have affected net income by approximately $0.3 million in the fiscal year then ended. | ||
31
Table of Contents
| Description |
Judgments and Uncertainties |
Effect if Actual Results Differ From Assumptions | ||
| Share-Based Compensation |
||||
| We have a share-based compensation plan under which we award non-qualified stock options and restricted stock. We also have an associate stock buying plan. For more information, see Note 2 to our consolidated financial statements, in Item 8 of this report.
We determine the fair value of our non-qualified stock option awards at the date of grant using the Black-Scholes Merton option-pricing model.
We determine the fair value of our restricted stock awards and associate stock buying plan purchases using similar valuation techniques and the closing market price of our common stock. |
Option-pricing models and generally accepted valuation techniques require management to make assumptions and to apply judgment to determine the fair value of our awards. These assumptions and judgments include estimating the future volatility of our stock price, expected dividend yield, future employee turnover rates and future employee stock option exercise behaviors. Changes in these assumptions can materially affect the fair value estimate. | We do not believe there is a reasonable likelihood that there will be a material change in the future estimates or assumptions we use to determine share-based compensation expense. However, if actual results are not consistent with our estimates or assumptions, we may be exposed to changes in share-based compensation expense that could be material.
If actual results are not consistent with the assumptions used, the share-based compensation expense reported in our financial statements may not be representative of the actual economic cost of the share-based compensation.
A 10% change in our assumptions for share-based compensation expense for the fiscal year ended January 2, 2010, would have affected net income by approximately $0.2 million in the fiscal year then ended. |
ITEM 7A—QUANTITATIVE AND QUALITATIVE DISCLOSURES ABOUT MARKET RISK
We do not undertake any specific actions to diminish our exposure to interest rate or currency rate risk, and we are not a party to any interest rate or currency rate risk management transactions. We do not purchase or hold any derivative financial instruments.
At the end of the 2009, we had no outstanding long-term debt and as such would not be impacted by a change in interest rates. We expect our interest rate exposure will increase when we enter into a new credit facility after the expiration of the current credit facility at the end of 2010. For more information, see Note 5 to our consolidated financial statements in Item 8.
A 10% increase in the exchange rate of the U.S. dollar versus the Canadian dollar would have an effect of reducing our pre-tax income and cash flows by approximately $1.1 million over the next year.
32
Table of Contents
ITEM 8—FINANCIAL STATEMENTS AND SUPPLEMENTARY DATA
Management’s Report on Internal Control Over Financial Reporting
Management is responsible for establishing and maintaining adequate internal control over financial reporting as defined in Rules 13a-15(f) and 15d-15(f) under the Exchange Act. Our internal control over financial reporting is a process designed to provide reasonable assurance regarding the reliability of financial reporting and the preparation of financial statements for external purposes in accordance with generally accepted accounting principles. Because of its inherent limitations, internal control over financial reporting may not prevent or detect material misstatements due to error or fraud on a timely basis. Also, projections of any evaluation of effectiveness of internal control over financial reporting to future periods are subject to the risk that controls may become inadequate because of changes in conditions, or that the degree of compliance with the policies or procedures may deteriorate.
A material weakness is a deficiency, or a combination of deficiencies, in internal control over financial reporting, such that there is a reasonable possibility that a material misstatement of the company’s annual or interim financial statements will not be prevented or detected on a timely basis. We identified a deficiency in our process accruing for estimated freight charges. In particular, the reconciliation performed by our finance department with respect to this account as of January 2, 2010, did not identify an error in the period-end accrual for this account. We have concluded that this deficiency constituted a material weakness in our internal control over financial reporting as of January 2, 2010. We made this determination because of the possibly material aggregate impact that this error may have had on the carrying value of our accrued liabilities had it remained undetected.
Because of the material weakness described above, management has concluded that our internal control over financial reporting was not effective as of January 2, 2010. In making its assessment of the effectiveness of our internal control over financial reporting, management used the criteria set forth in Internal Control—Integrated Framework, issued by the Committee of Sponsoring Organizations of the Treadway Commission.
As a result of this material weakness, an adjustment of approximately $1.5 million was necessary to decrease accrued liabilities and to decrease costs of good sold with respect to accrued freight charges during the fourth quarter ended January 2, 2010. However, this adjustment and other fourth quarter adjustments, viewed individually or in the aggregate, did not result in any material misstatement of any financial statements we previously issued.
Our internal control over financial reporting as of January 2, 2010 has been audited by Grant Thornton LLP, an independent registered public accounting firm, as stated in their report which appears on the following page.
| /S/ GEOFFREY A. EISENBERG | /S/ THOMAS R. MORAN | |||
| Geoffrey A. Eisenberg | Thomas R. Moran | |||
| President and Chief Executive Officer (principal executive officer) |
Senior Vice President and Chief Financial Officer (principal financial officer) | |||
| March 17, 2010 | March 17, 2010 | |||
33
Table of Contents
REPORT OF INDEPENDENT REGISTERED PUBLIC ACCOUNTING FIRM
Board of Directors and Shareholders
West Marine, Inc.
We have audited West Marine, Inc. (a Delaware Corporation) and subsidiaries’ internal control over financial reporting as of January 2, 2010, based on criteria established in Internal Control—Integrated Framework issued by the Committee of Sponsoring Organizations of the Treadway Commission (COSO). West Marine, Inc. and subsidiaries’ (the “Company”) management is responsible for maintaining effective internal control over financial reporting and for its assessment of the effectiveness of internal control over financial reporting, included in the accompanying Management’s Report on Internal Control Over Financial Reporting. Our responsibility is to express an opinion on the Company’s internal control over financial reporting based on our audit.
We conducted our audit in accordance with the standards of the Public Company Accounting Oversight Board (United States). Those standards require that we plan and perform the audit to obtain reasonable assurance about whether effective internal control over financial reporting was maintained in all material respects. Our audit included obtaining an understanding of internal control over financial reporting, assessing the risk that a material weakness exists, testing and evaluating the design and operating effectiveness of internal control based on the assessed risk, and performing such other procedures as we considered necessary in the circumstances. We believe that our audit provides a reasonable basis for our opinion.
A company’s internal control over financial reporting is a process designed to provide reasonable assurance regarding the reliability of financial reporting and the preparation of financial statements for external purposes in accordance with generally accepted accounting principles. A company’s internal control over financial reporting includes those policies and procedures that (1) pertain to the maintenance of records that, in reasonable detail, accurately and fairly reflect the transactions and dispositions of the assets of the company; (2) provide reasonable assurance that transactions are recorded as necessary to permit preparation of financial statements in accordance with generally accepted accounting principles, and that receipts and expenditures of the company are being made only in accordance with authorizations of management and directors of the company; and (3) provide reasonable assurance regarding prevention or timely detection of unauthorized acquisition, use, or disposition of the company’s assets that could have a material effect on the financial statements.
Because of its inherent limitations, internal control over financial reporting may not prevent or detect misstatements. Also, projections of any evaluation of effectiveness to future periods are subject to the risk that controls may become inadequate because of changes in conditions, or that the degree of compliance with the policies or procedures may deteriorate.
A material weakness is a deficiency, or combination of control deficiencies, in internal control over financial reporting, such that there is a reasonable possibility that a material misstatement of the company’s annual or interim financial statements will not be prevented or detected on a timely basis. The following material weakness has been identified and included in management’s assessment.
Exceptions were identified in the operation of the Company’s internal controls over accounting for accrued freight costs. Those exceptions related to inadequate communication and review procedures that aggregated to form a material weakness.
In our opinion, because of the effect of the material weakness described above on the achievement of the objectives of the control criteria, West Marine, Inc. and subsidiaries have not maintained effective internal control over financial reporting as of January 2, 2010, based on criteria established in Internal Control—Integrated Framework issued by COSO.
34
Table of Contents
We also have audited, in accordance with the standards of the Public Company Accounting Oversight Board (United States), the consolidated balance sheet of West Marine, Inc. and subsidiaries as of January 2, 2010, and the related consolidated statement of operations, stockholders’ equity, and cash flows for the year ended January 2, 2010. The material weakness identified above was considered in determining the nature, timing, and extent of audit tests applied in our audit of the 2009 financial statements, and this report does not affect our report dated March 17, 2010, which expressed an unqualified opinion on those financial statements.
We do not express an opinion or any other form of assurance on the corrective actions and other changes in internal controls reported in Management’s Report on Internal Control Over Financial Reporting.
/s/ GRANT THORNTON LLP
San Francisco, CA
March 17, 2010
35
Table of Contents
REPORT OF INDEPENDENT REGISTERED PUBLIC ACCOUNTING FIRM
Board of Directors and Shareholders
West Marine, Inc.
We have audited the accompanying consolidated balance sheet of West Marine, Inc. (a Delaware corporation) and subsidiaries (the “Company”) as of January 2, 2010, and the related consolidated statements of operations, stockholders’ equity, and cash flows for the year in the period ended January 2, 2010. These financial statements are the responsibility of the Company’s management. Our responsibility is to express an opinion on these financial statements based on our audit.
We conducted our audit in accordance with the standards of the Public Company Accounting Oversight Board (United States). Those standards require that we plan and perform the audit to obtain reasonable assurance about whether the financial statements are free of material misstatement. An audit includes examining, on a test basis, evidence supporting the amounts and disclosures in the financial statements. An audit also includes assessing the accounting principles used and significant estimates made by management, as well as evaluating the overall financial statement presentation. We believe that our audit provides a reasonable basis for our opinion.
In our opinion, the financial statements referred to above present fairly, in all material respects, the financial position of West Marine, Inc. and subsidiaries as of January 2, 2010, and the results of their operations and their cash flows for the year in the period ended January 2, 2010 in conformity with accounting principles generally accepted in the United States of America.
We also have audited, in accordance with the standards of the Public Company Accounting Oversight Board (United States), West Marine, Inc. and subsidiaries’ internal control over financial reporting as of January 2, 2010, based on criteria established in Internal Control—Integrated Framework issued by the Committee of Sponsoring Organizations of the Treadway Commission (COSO) and our report dated March 17, 2010 expressed an adverse opinion on the effectiveness of the Company’s internal control over financial reporting.
/s/ GRANT THORNTON LLP
San Francisco, CA
March 17, 2010
36
Table of Contents
REPORT OF INDEPENDENT REGISTERED PUBLIC ACCOUNTING FIRM
To the Board of Directors and Stockholders of
West Marine, Inc.
Watsonville, California
We have audited the accompanying consolidated balance sheet of West Marine, Inc. and subsidiaries (the “Company”) as of January 3, 2009, and the related consolidated statements of operations, stockholders’ equity and cash flows for the years ended January 3, 2009 and December 29, 2007. These financial statements are the responsibility of the Company’s management. Our responsibility is to express an opinion on these financial statements based on our audits.
We conducted our audits in accordance with the standards of the Public Company Accounting Oversight Board (United States). Those standards require that we plan and perform the audit to obtain reasonable assurance about whether the financial statements are free of material misstatement. Our audits of the financial statements included examining, on a test basis, evidence supporting the amounts and disclosures in the financial statements, assessing the accounting principles used and significant estimates made by management, and evaluating the overall financial statement presentation. Our audits also included performing such other procedures as we considered necessary in the circumstances. We believe that our audits provide a reasonable basis for our opinion.
In our opinion, the consolidated financial statements referred to above present fairly, in all material respects, the financial position of West Marine, Inc. and subsidiaries as of January 3, 2009, and the results of their operations and their cash flows for the years ended January 3, 2009 and December 29, 2007, in conformity with accounting principles generally accepted in the United States of America.
/s/ DELOITTE & TOUCHE LLP
San Francisco, California
March 16, 2009
37
Table of Contents
WEST MARINE, INC.
CONSOLIDATED BALANCE SHEETS
JANUARY 2, 2010 AND JANUARY 3, 2009
(in thousands, except share data)
| Year-End | ||||||||
| 2009 | 2008 | |||||||
| ASSETS |
||||||||
| Current assets: |
||||||||
| Cash and cash equivalents |
$ | 10,279 | $ | 7,473 | ||||
| Trade receivables, net of allowances of $580 in 2009 and $625 in 2008 |
5,566 | 5,824 | ||||||
| Merchandise inventories |
196,631 | 222,601 | ||||||
| Deferred income taxes |
1,299 | — | ||||||
| Other current assets |
19,805 | 16,369 | ||||||
| Total current assets |
233,580 | 252,267 | ||||||
| Property and equipment, net |
56,278 | 59,615 | ||||||
| Intangibles, net |
116 | 154 | ||||||
| Other assets |
2,263 | 2,556 | ||||||
| TOTAL ASSETS |
$ | 292,237 | $ | 314,592 | ||||
| LIABILITIES AND STOCKHOLDERS’ EQUITY |
||||||||
| Current liabilities: |
||||||||
| Accounts payable |
$ | 32,591 | $ | 26,788 | ||||
| Accrued expenses, and other |
43,369 | 42,256 | ||||||
| Total current liabilities |
75,960 | 69,044 | ||||||
| Long-term debt |
— | 47,000 | ||||||
| Deferred rent, and other |
11,933 | 8,928 | ||||||
| Total liabilities |
87,893 | 124,972 | ||||||
| Stockholders’ equity: |
||||||||
| Preferred stock, $.001 par value: 1,000,000 shares authorized; no shares outstanding |
— | — | ||||||
| Common stock, $.001 par value: 50,000,000 shares authorized; 22,376,873 shares issued and 22,345,983 shares outstanding at January 2, 2010 and 22,142,949 shares issued and 22,115,377 shares outstanding at January 3, 2009 |
22 | 22 | ||||||
| Treasury stock |
(385 | ) | (366 | ) | ||||
| Additional paid-in capital |
177,459 | 173,997 | ||||||
| Accumulated other comprehensive (loss) income |
(506 | ) | 590 | |||||
| Retained earnings |
27,754 | 15,377 | ||||||
| Total stockholders’ equity |
204,344 | 189,620 | ||||||
| TOTAL LIABILITIES AND STOCKHOLDERS’ EQUITY |
$ | 292,237 | $ | 314,592 | ||||
See notes to consolidated financial statements.
38
Table of Contents
WEST MARINE, INC.
CONSOLIDATED STATEMENTS OF OPERATIONS
FOR THE FISCAL YEARS ENDED JANUARY 2, 2010, JANUARY 3, 2009, AND DECEMBER 29, 2007
(in thousands, except per share data)
| 2009 | 2008 | 2007 | ||||||||||
| Net revenues |
$ | 588,416 | $ | 631,258 | $ | 679,561 | ||||||
| Cost of goods sold |
427,501 | 463,812 | 484,676 | |||||||||
| Gross profit |
160,915 | 167,446 | 194,885 | |||||||||
| Selling, general and administrative expense |
152,303 | 176,830 | 187,221 | |||||||||
| Goodwill impairment (Note 1) |
— | — | 56,905 | |||||||||
| Store closures and other (recoveries) restructuring costs (Note 3) |
(1,746 | ) | 10,687 | 558 | ||||||||
| Impairment of long-lived assets (Note 1) |
13 | 2,861 | 1,308 | |||||||||
| Income (loss) from operations |
10,345 | (22,932 | ) | (51,107 | ) | |||||||
| Interest expense |
806 | 2,338 | 3,962 | |||||||||
| Income (loss) before taxes |
9,539 | (25,270 | ) | (55,069 | ) | |||||||
| (Benefit) provision for income taxes |
(2,837 | ) | 13,530 | (5,093 | ) | |||||||
| Net income (loss) |
$ | 12,376 | $ | (38,800 | ) | $ | (49,976 | ) | ||||
| Net income (loss) per common and common equivalent share— |
||||||||||||
| Basic |
$ | 0.56 | $ | (1.76 | ) | $ | (2.30 | ) | ||||
| Diluted |
$ | 0.55 | $ | (1.76 | ) | $ | (2.30 | ) | ||||
| Weighted average common and common equivalent shares outstanding— |
||||||||||||
| Basic |
22,215 | 21,993 | 21,764 | |||||||||
| Diluted |
22,347 | 21,993 | 21,764 | |||||||||
See notes to consolidated financial statements.
39
Table of Contents
WEST MARINE, INC.
CONSOLIDATED STATEMENTS OF STOCKHOLDERS’ EQUITY AND COMPREHENSIVE LOSS
FOR THE FISCAL YEARS ENDED JANUARY 2, 2010, JANUARY 3, 2009, AND DECEMBER 29, 2007
(in thousands, except share data)
| Common Shares Outstanding |
Common Stock |
Treasury Stock |
Additional Paid-in Capital |
Retained Earnings |
Accumulated Other Comprehensive Income (Loss) |
Total Stockholders’ Equity |
Total Comprehensive (Loss) Income |
|||||||||||||||||||||||
| Balance at December 30, 2006 |
21,553,365 | 22 | (282 | ) | 164,632 | 104,393 | (132 | ) | 268,633 | |||||||||||||||||||||
| Net loss |
(49,976 | ) | (49,976 | ) | $ | (49,976 | ) | |||||||||||||||||||||||
| Foreign currency translation adjustment, net of tax of $115 |
(195 | ) | (195 | ) | (195 | ) | ||||||||||||||||||||||||
| Common stock issued under equity compensation plan |
245,104 | 4,895 | 4,895 | |||||||||||||||||||||||||||
| Tax benefit from equity issuance, including excess tax benefit of $390 |
398 | 398 | ||||||||||||||||||||||||||||
| Cumulative effect of change in accounting principle due to adoption of FIN 48 (see Note 8) |
(240 | ) | (240 | ) | ||||||||||||||||||||||||||
| Treasury shares acquired |
(4,447 | ) | (66 | ) | (66 | ) | ||||||||||||||||||||||||
| Sale of common stock pursuant to associates stock buying plan |
99,452 | 1,063 | 1,063 | |||||||||||||||||||||||||||
| Balance at December 29, 2007 |
21,893,474 | 22 | (348 | ) | 170,988 | 54,177 | (327 | ) | 224,512 | $ | (50,171 | ) | ||||||||||||||||||
| Net loss |
(38,800 | ) | (38,800 | ) | $ | (38,800 | ) | |||||||||||||||||||||||
| Foreign currency translation adjustment, net of tax of ($595) |
917 | 917 | 917 | |||||||||||||||||||||||||||
| Common stock issued under equity compensation plan |
28,313 | 2,261 | 2,261 | |||||||||||||||||||||||||||
| Tax benefit from equity issuance |
(89 | ) | (89 | ) | ||||||||||||||||||||||||||
| Treasury shares acquired |
(3,969 | ) | (18 | ) | (18 | ) | ||||||||||||||||||||||||
| Sale of common stock pursuant to associates stock buying plan |
197,559 | 837 | 837 | |||||||||||||||||||||||||||
| Balance at January 3, 2009 |
22,115,377 | $ | 22 | $ | (366 | ) | $ | 173,997 | $ | 15,377 | $ | 590 | $ | 189,620 | $ | (37,883 | ) | |||||||||||||
| Net income |
12,376 | 12,376 | $ | 12,376 | ||||||||||||||||||||||||||
| Foreign currency translation adjustment, net of tax of ($34) |
(1,096 | ) | (1,096 | ) | (1,096 | ) | ||||||||||||||||||||||||
| Common stock issued under equity compensation plan |
88,393 | 2,704 | 2,704 | |||||||||||||||||||||||||||
| Tax benefit from equity issuance, including excess tax benefit of $52 |
46 | 46 | ||||||||||||||||||||||||||||
| Treasury shares acquired |
(3,318 | ) | (19 | ) | (19 | ) | ||||||||||||||||||||||||
| Sale of common stock pursuant to associates stock buying plan |
145,531 | 712 | 712 | |||||||||||||||||||||||||||
| Balance at January 2, 2010 |
22,345,983 | $ | 22 | $ | (385 | ) | $ | 177,459 | $ | 27,754 | $ | (506 | ) | $ | 204,344 | $ | 11,280 | |||||||||||||
See notes to consolidated financial statements.
40
Table of Contents
WEST MARINE, INC.
CONSOLIDATED STATEMENTS OF CASH FLOWS
FOR THE FISCAL YEARS ENDED JANUARY 2, 2010, JANUARY 3, 2009, AND DECEMBER 29, 2007
(in thousands)
| 2009 | 2008 | 2007 | ||||||||||
| OPERATING ACTIVITIES: |
||||||||||||
| Net income (loss) |
$ | 12,376 | $ | (38,800 | ) | $ | (49,976 | ) | ||||
| Adjustments to reconcile net income (loss) to net cash provided by operating activities: |
||||||||||||
| Depreciation and amortization |
17,030 | 18,780 | 19,736 | |||||||||
| Impairment of long-lived assets |
13 | 2,861 | 1,308 | |||||||||
| Impairment of goodwill |
— | — | 56,905 | |||||||||
| Share-based compensation |
2,410 | 2,255 | 1,951 | |||||||||
| Tax benefit (deficiency) from equity issuance |
46 | (89 | ) | 398 | ||||||||
| Excess tax benefit from share-based compensation |
(52 | ) | — | (390 | ) | |||||||
| Deferred income taxes |
(580 | ) | 14,568 | (4,576 | ) | |||||||
| Provision for doubtful accounts |
375 | 639 | 185 | |||||||||
| Lower of cost or market inventory adjustments |
2,580 | 3,296 | 2,530 | |||||||||
| Loss on asset disposals |
160 | 925 | 274 | |||||||||
| Changes in assets and liabilities: |
||||||||||||
| Trade receivables |
(117 | ) | 241 | (1,176 | ) | |||||||
| Merchandise inventories |
23,389 | 22,410 | 2,225 | |||||||||
| Other current assets |
(3,436 | ) | 5,116 | 2,240 | ||||||||
| Other assets |
(1,037 | ) | 1,806 | (361 | ) | |||||||
| Accounts payable |
6,077 | (8,317 | ) | (3,589 | ) | |||||||
| Accrued expenses and other |
1,113 | (5,520 | ) | 2,046 | ||||||||
| Deferred items and other non-current liabilities |
2,286 | 469 | 243 | |||||||||
| Net cash provided by operating activities |
62,633 | 20,640 | 29,973 | |||||||||
| INVESTING ACTIVITIES: |
||||||||||||
| Proceeds from sale of property and equipment |
32 | 125 | 207 | |||||||||
| Purchases of property and equipment |
(13,755 | ) | (15,064 | ) | (17,837 | ) | ||||||
| Net cash used in investing activities |
(13,723 | ) | (14,939 | ) | (17,630 | ) | ||||||
| FINANCING ACTIVITIES: |
||||||||||||
| Borrowings on line of credit |
36,537 | 88,107 | 95,687 | |||||||||
| Repayments on line of credit |
(83,537 | ) | (93,407 | ) | (112,376 | ) | ||||||
| Proceeds from exercise of stock options |
294 | 6 | 2,944 | |||||||||
| Proceeds from sale of common stock pursuant to Associates Stock Buying Plan |
712 | 837 | 1,063 | |||||||||
| Excess tax benefit from share-based compensation |
52 | — | 390 | |||||||||
| Treasury shares acquired |
(19 | ) | (18 | ) | (66 | ) | ||||||
| Net cash used in financing activities |
(45,961 | ) | (4,475 | ) | (12,358 | ) | ||||||
| Effect of exchange rate changes on cash |
(143 | ) | 121 | (82 | ) | |||||||
| NET INCREASE (DECREASE) IN CASH |
2,806 | 1,347 | (97 | ) | ||||||||
| CASH AT BEGINNING OF PERIOD |
7,473 | 6,126 | 6,223 | |||||||||
| CASH AT END OF PERIOD |
$ | 10,279 | $ | 7,473 | $ | 6,126 | ||||||
| Other cash flow information: |
||||||||||||
| Cash paid for interest |
$ | 810 | $ | 2,361 | $ | 4,997 | ||||||
| Cash paid (refunded) for income taxes |
1,929 | (3,070 | ) | 1,497 | ||||||||
| Non-cash investing activities |
||||||||||||
| Property and equipment additions in accounts payable |
295 | 343 | 360 | |||||||||
See notes to consolidated financial statements.
41
Table of Contents
WEST MARINE, INC.
NOTES TO CONSOLIDATED FINANCIAL STATEMENTS
NOTE 1: SUMMARY OF SIGNIFICANT ACCOUNTING POLICIES
BUSINESS—West Marine Inc. and its consolidated subsidiaries (“West Marine” or the “Company”, unless the context requires otherwise) is a specialty retailer of boating supplies and has three reportable segments—Stores, Port Supply (wholesale) and Direct Sales (Internet and call center)—which all sell aftermarket recreational boating supplies directly to customers. At January 2, 2010, West Marine offered its products through 335 Company-operated stores in 38 states, Puerto Rico, Canada and two franchised stores in Turkey, through its call center channel and on the Internet. The Company is also engaged, through its Port Supply division and its stores, in the wholesale distribution of products to commercial customers and other retailers.
West Marine was incorporated in Delaware in September 1993 as the holding company for West Marine Products, Inc., which was incorporated in California in 1976. The Company’s principal executive offices are located in Watsonville, California.
PRINCIPLES OF CONSOLIDATION—The consolidated financial statements include the accounts of West Marine, Inc. and its subsidiaries, all of which are wholly-owned, directly or indirectly. Intercompany balances and transactions are eliminated in consolidation.
YEAR-END—The Company’s fiscal year consists of 52 or 53 weeks, ending on the Saturday closest to December 31. Fiscal years 2009 and 2007 consisted of the 52 weeks ended January 2, 2010 and December 29, 2007, respectively and the 2008 fiscal year consisted of the 53 weeks ended January 3, 2009. The impact on the Company’s consolidated financial statements of the additional week was immaterial. References to 2009, 2008 and 2007 are to the fiscal years ended January 2, 2010, January 3, 2009, and December 29, 2007, respectively.
ACCOUNTING ESTIMATES—The preparation of consolidated financial statements in conformity with accounting principles generally accepted in the United States of America requires management to make estimates and assumptions that affect the reported amounts of assets and liabilities and disclosure of contingent assets and liabilities at the date of the consolidated financial statements and the reported amounts of revenues and expenses during the reporting period. Such estimates include, but are not limited to, the following: useful lives and recoverability of fixed assets; inventory obsolescence and shrinkage reserves; capitalized indirect inventory costs; allowance for doubtful accounts receivable; calculation of accrued liabilities, including workers’ compensation and other self-insured liabilities; sabbatical liability, sales returns reserves, unredeemed gift cards and loyalty program awards; vendor consideration earned; fair value of share-based compensation instruments, income tax valuation allowances and uncertain tax positions; goodwill impairment; legal liabilities; and asset retirement obligations. Actual results could differ from those estimates.
INVENTORIES—Merchandise inventories are carried at the lower of cost or market on an average cost basis. Capitalized indirect costs include freight charges for transporting merchandise to warehouses or store locations and operating costs incurred for merchandising, replenishment and distribution activities. Indirect costs included in inventory value at the end of fiscal years 2009 and 2008 were $19.2 million and $21.5 million, respectively. Indirect costs included in inventory value are recognized as an increase in cost of goods sold as the related products are sold.
Inventories are written down to market value when cost exceeds market value, based on historical experience and current information. Reserves for estimated inventory shrinkage based on historical shrinkage rates determined by the Company’s physical merchandise inventory counts and cycle counts was $2.9 million and $3.3 million at the end of fiscal years 2009 and 2008, respectively. Reserves for estimated inventory market value below cost, based upon current levels of aged and discontinued product and historical analysis of inventory sold below cost, was $5.7 million and $6.0 million at the end of fiscal years 2009 and 2008, respectively.
42
Table of Contents
WEST MARINE, INC.
NOTES TO CONSOLIDATED FINANCIAL STATEMENTS—(Continued)
DEFERRED CATALOG AND ADVERTISING COSTS—The Company capitalizes the direct cost of producing and distributing its catalogs. Capitalized catalog costs are amortized, once a catalog is mailed, over the expected net sales period, which is generally from one month to 11 months. Advertising costs, which are included in selling, general and administrative (“SG&A”) expense, are expensed as incurred and were $5.8 million, $11.1 million and $14.1 million in 2009, 2008 and 2007, respectively.
PROPERTY AND EQUIPMENT—Property and equipment is stated at cost and depreciated using the straight-line method over the estimated useful lives of the various assets, as follows:
| Estimated Useful Lives | ||
| Furniture and equipment |
3–7 years | |
| Computer software and hardware |
3–5 years | |
| Buildings |
25 years |
Leasehold improvements are amortized over the lesser of the expected lease term or the estimated useful life of the improvement which is usually about 10 years.
CAPITALIZED INTEREST—The Company capitalizes interest on major capital projects. The Company capitalized less than $0.1 million in 2009, $0.1 million in 2008 and $0.3 million in 2007.
CAPITALIZED SOFTWARE COSTS—Capitalized computer software, included in property and equipment, reflects costs related to internally-developed or purchased software that are capitalized and amortized on a straight-line basis, generally over a period ranging from three to five years.
GOODWILL AND OTHER INTANGIBLE ASSETS—The Company completes an impairment test annually or more frequently if evidence of possible impairment arises. The Company tested goodwill for possible impairment as of December 29, 2007 and concluded that its goodwill was impaired, which resulted in a non-cash impairment charge of $56.9 million recorded in the fourth quarter of fiscal 2007. No impairment was recognized in 2008 or 2009.
Amortization expense for other intangible assets was less than $0.1 million in each of the years 2009, 2008 and 2007. Amortization expense in each of the next three years is not deemed significant.
ASSET RETIREMENT OBLIGATIONS—The Company estimates the fair value of obligations to clean up and restore leased properties under agreements with landlords and records the amount as a liability when incurred. Liabilities for asset retirement obligations were $0.4 million at year-end 2009 and year-end 2008.
IMPAIRMENT OF LONG-LIVED ASSETS—The Company reviews long-lived assets, including intangible assets and property and equipment, for impairment whenever events or changes in circumstances indicate that the carrying value of an asset may not be recoverable. If the undiscounted future cash flows from the long-lived asset are less than the carrying value, a loss equal to the difference between carrying value and the fair market value of the asset is recorded.
The Company recorded asset impairment charges of less than $0.1 million in 2009, $2.9 million in 2008 and $1.3 million in 2007, in each case primarily due to store closures.
FACILITY CLOSING COSTS—The Company records an obligation for the present value of estimated costs that will not be recovered in the period a store, distribution center or other facility is closed. These costs include employment termination benefits, lease contract termination costs and the book value of abandoned property. For more information, see Note 3.
43
Table of Contents
WEST MARINE, INC.
NOTES TO CONSOLIDATED FINANCIAL STATEMENTS—(Continued)
SELF-INSURANCE OR HIGH DEDUCTIBLE LOSSES—The Company uses a combination of insurance and self-insurance for a number of risk management activities including workers’ compensation, general liability and employee-related health care benefits, a portion of which is paid by its associates. Liabilities associated with these risks are estimated primarily based on amounts determined by actuarial analysis, and accrued in part by considering historical claims experience, demographic factors, severity factors and other actuarial assumptions. Any actuarial projection of losses is subject to a high degree of variability. Among the causes of this variability are unpredictable external factors affecting future inflation rates, litigation trends, legal interpretations, benefit level changes and claim settlement patterns.
DEFERRED RENT—Certain of the Company’s operating leases contain periods of free or reduced rent or contain predetermined fixed increases in the minimum rent amount during the lease term. For these leases, the Company recognizes rent expense on a straight-line basis over the expected life of the lease, generally about 10 years, including periods of free rent, and records the difference between the amount charged to rent expense and the rent paid as deferred rent. Tenant improvement allowances received from landlords are deferred and amortized to reduce rent expense over the expected life of the lease.
INCOME TAXES—Income taxes are accounted for using the asset and liability method. Deferred income taxes arise from temporary differences between the tax basis of assets and liabilities and their reported amounts in the consolidated financial statements. A valuation allowance is recorded to reduce deferred tax assets to the amount estimated as more likely than not to be realized. The Company also accounts for uncertainties in income taxes recognized in its financial statements. For more information, see Note 8.
FAIR VALUE OF FINANCIAL INSTRUMENTS—In the first quarter of 2008, the Company adopted an accounting standard update related to fair value measurements and disclosures. This update defines fair value as the price that would be received to sell an asset or paid to transfer a liability (an exit price) in the principal or most advantageous market for the asset or liability in an orderly transaction between market participants on the measurement date. As such, fair value is a market-based measurement that should be determined based on assumptions that market participants would use in pricing an asset or liability.
The fair value hierarchy prescribed under accounting principles generally accepted in the United States, or GAAP, contains three levels, which prioritizes the inputs used in the valuation methodologies in measuring fair value:
Level 1—Observable inputs that reflect quoted prices (unadjusted) for identical assets or liabilities in active markets.
Level 2—Include other inputs that are directly or indirectly observable in the marketplace.
Level 3—Unobservable inputs which are supported by little or no market activity.
The fair value hierarchy also requires an entity to maximize the use of observable inputs and minimize the use of unobservable inputs when measuring fair value. As of January 2, 2010, $8.0 million of the Company’s cash equivalents consisted of a money market deposit account and certificates of deposits and are classified within Level 1 because they are valued using quoted market prices.
44
Table of Contents
WEST MARINE, INC.
NOTES TO CONSOLIDATED FINANCIAL STATEMENTS—(Continued)
REVENUE RECOGNITION—Sales, net of estimated returns, are recorded when merchandise is purchased by customers at retail locations. Revenue is recognized when merchandise shipped from a warehouse is received by the customer, based upon the estimated date of receipt by the customer. Reserves for sales returns were as follows:
| 2009 | 2008 | 2007 | ||||||||||
| (in thousands) | ||||||||||||
| Reserve for product sales returns—beginning balance |
$ | (809 | ) | $ | (450 | ) | $ | (485 | ) | |||
| Additions |
(1,326 | ) | (2,794 | ) | (606 | ) | ||||||
| Deductions |
1,211 | 2,435 | 641 | |||||||||
| Reserve for product sales returns—ending balance |
(924 | ) | (809 | ) | (450 | ) | ||||||
UNREDEEMED GIFT CARDS—Aggregate sales of gift cards for fiscal years 2009, 2008 and 2007 were $13.1 million, $13.7 million and $15.5 million, respectively. Sales of gift cards are deferred and treated as a liability on our balance sheet either until redeemed by customers in exchange for products or until we determine that future redemption of the card by the customer is remote, also called “breakage.” Breakage for unused gift cards is recognized using the “redemption recognition method.” Under this method, we estimate breakage based on Company-specific data by analyzing historical experience and deriving a rate that represents the amount of gift cards that are expected to be unused and not subject to escheatment. This rate is then applied, and breakage is recognized in income, over the period of redemption. Gift card breakage income for 2009, 2008 and 2007 was $0.2 million, $0.5 million and $0.1 million, respectively, and is included as net revenues in our operating results.
WEST ADVANTAGE CUSTOMER LOYALTY PROGRAMS—The Company has a customer loyalty program which allow members to earn points on qualifying purchases. Points earned entitle members to receive certificates that may be redeemed on future purchases through any retail sales channel A liability is recognized and included in accrued liabilities and recorded as a reduction of revenue at the time the points are earned and/or certificates are issued, based on the retail value of certificates projected to be redeemed, less an estimate of breakage based upon historical redemption patterns.
COST OF GOODS SOLD—Cost of goods sold includes costs related to the purchase, transportation and storage of merchandise, shipping expense and store occupancy costs. Consideration in the form of cash or credits received from vendors is recorded as a reduction to cost of goods sold as the related products are sold.
COMPREHENSIVE INCOME (LOSS)—Comprehensive income (loss) consists of net income and other comprehensive income (loss). Other comprehensive income (loss) includes income, expenses, gains and losses that bypass the income statement and are reported directly as a separate component of equity. The Company’s comprehensive income (loss) in the Consolidated Statements of Stockholders’ Equity consists of net loss and foreign currency translation adjustments for all periods presented.
FOREIGN CURRENCY—Translation adjustments result from translating foreign subsidiaries’ financial statements into U.S. dollars. West Marine Canada’s functional currency is the Canadian dollar. Balance sheet accounts are translated at exchange rates in effect at the balance sheet date. Income statement accounts are translated at average exchange rates during the year. Resulting translation adjustments are included as a component of Other Comprehensive Income in the Consolidated Statements of Stockholders’ Equity. Gains (losses) from foreign currency transactions included in SG&A expense for 2009, 2008 and 2007 were $1.9 million, $(2.8) million and $1.6 million, respectively.
45
Table of Contents
WEST MARINE, INC.
NOTES TO CONSOLIDATED FINANCIAL STATEMENTS—(Continued)
ACCRUED EXPENSES—Accrued expenses consist of the following (in thousands):
| 2009 | 2008 | |||||
| Accrued compensation and benefits |
$ | 10,451 | $ | 10,023 | ||
| Accrued bonus |
8,325 | 65 | ||||
| Costs associated with exit activities |
4,525 | 9,069 | ||||
| Unredeemed gift cards |
5,892 | 5,768 | ||||
| Other accrued expense |
14,176 | 17,331 | ||||
| Accrued expenses |
$ | 43,369 | $ | 42,256 | ||
NET INCOME (LOSS) PER SHARE—Basic net income (loss) per share is computed by dividing net income (loss) available to common stockholders by the weighted average number of common shares outstanding during the period. Diluted net income (loss) per share reflects the potential dilution that could occur if unvested restricted shares and outstanding options to purchase common stock were exercised. Options to purchase approximately 1.7 million shares, 3.6 million shares, and 2.6 million shares of common stock that were outstanding in 2009, 2008 and 2007, respectively, have been excluded from the calculation of diluted income (loss) per share because inclusion of such shares would be anti-dilutive.
The following is a reconciliation of the Company’s basic and diluted net income (loss) per share computations (shares in thousands):
| 2009 | 2008 | 2007 | ||||||||||||||||
| Shares | Net Income Per Share |
Shares | Net Loss Per Share |
Shares | Net Loss Per Share |
|||||||||||||
| Basic |
22,215 | $ | 0.56 | 21,993 | $ | (1.76 | ) | 21,764 | $ | (2.30 | ) | |||||||
| Effect of dilutive stock options |
132 | (0.01 | ) | — | — | — | — | |||||||||||
| Diluted |
22,347 | $ | 0.55 | 21,993 | $ | (1.76 | ) | 21,764 | $ | (2.30 | ) | |||||||
DERIVATIVE INSTRUMENTS—The Company did not purchase or hold any derivative financial instruments during the three years ended January 2, 2010.
SUBSEQUENT EVENTS—Subsequent events were evaluated through the date these consolidated financial statements were issued.
CASH AND CASH EQUIVALENTS—Cash primarily consists of cash on hand and bank deposits. As of January 2, 2010, $8.0 million of the Company’s cash equivalents consisted of a money market deposit account and certificates of deposit.
Outstanding checks in excess of funds on deposit (book overdrafts) totaled $3.2 million at January 2, 2010, and are reflected as accounts payable in the consolidated balance sheet.
SABBATICAL LEAVE—Certain full-time associates are eligible to receive sabbatical leave after each 10 years of continuous employment. The estimated sabbatical liability is based on a number of factors, including actuarial assumptions and historical trends. In fiscal year 2009, the Company recorded $0.8 million as an estimate of accumulated sabbatical leave as of the balance sheet date.
46
Table of Contents
WEST MARINE, INC.
NOTES TO CONSOLIDATED FINANCIAL STATEMENTS—(Continued)
NEW ACCOUNTING PRONOUNCEMENTS—In June 2009, the Financial Accounting Standards Board (“FASB”) issued ASU 2009-01, “The FASB Accounting Standards Codification and the Hierarchy of Generally Accepted Accounting Principles” (“ASU 2009-01”), which amends Statement of Financial Accounting Standards (“SFAS”) No. 168, “The FASB Accounting Standards Codification and the Hierarchy of Generally Accepted Accounting Principles” (“SFAS No. 168”). FAS No. 168 identified the sources of accounting principles and the framework for selecting the principles used in preparing the financial statements that are presented in conformity with GAAP. It arranged these sources of GAAP in a hierarchy for users to apply accordingly. With ASU 2009-01 in effect, all of its content carry the same level of authority, effectively superseding SFAS No. 168. Thus, the GAAP hierarchy has been modified to include only two levels of GAAP: authoritative and non-authoritative. ASU 2009-01 is effective for financial statements issued for interim and annual periods ending after September 15, 2009. The provisions of ASU 2009-01 did not have a material impact on the Company’s consolidated financial statements.
NOTE 2: SHARE-BASED COMPENSATION
West Marine’s amended and restated Omnibus Equity Incentive Plan (the “Plan”) is intended to provide flexibility to the Company in its ability to motivate, attract and retain the services of associates, non-employee directors and consultants upon whose judgment, interest and special effort the successful conduct of its operation is largely dependent. The Plan permits a variety of compensation methods, including non-qualified stock options, incentive stock options, restricted stock and other share-based awards. All associates, non-employee directors and consultants are eligible to participate under the Plan, with the exception of Randolph K. Repass, Chairman of the Company’s Board of Directors and a significant, but not controlling, stockholder. At year-end 2009, 8,400,000 shares of common stock had been reserved under the Plan and 626,697 shares were available for future issuance.
The Company recognizes compensation expense for share-based payments based on the fair value of the awards under the modified prospective application method. Share-based payments consist of stock option grants, restricted share awards and stock purchase plan issuances, each as described further below.
On December 22, 2005, the Board of Directors of the Company, upon the recommendation of the Board’s Governance and Compensation Committee, approved the acceleration of vesting of all stock options then held by current associates, making all of the outstanding stock options at December 31, 2005 vested and exercisable, primarily to avoid recognition of compensation expense in future periods. The additional pre-tax expense that, absent the accelerated vesting, would have been reflected in the Company’s consolidated statements of income for 2009, 2008 and 2007 was approximately $1.4 million, $3.7 million and $4.9 million, respectively.
Share-based compensation expense for 2009, 2008 and 2007 was approximately $2.4 million, $2.3 million and $2.0 million, respectively, of which expense for stock options was $2.0 million, $1.7 million and $1.3 million in 2009, 2008 and 2007, respectively. In 2009, the Company recognized $0.1 million in tax benefits from stocks options exercised, restricted stock vested and disqualifying stock purchase plan transactions, of which $0.1 million was recognized as excess tax benefits in additional paid-in capital and $0.1 million was recognized as cash flow from financing activities. In 2008, the Company did not recognize any tax benefits from settlement of equity compensation, because its overall tax position was a net operating loss. In 2007, the Company recognized $0.5 million in tax benefits from stock options exercised, restricted stock vested and disqualifying stock purchase plan transactions, of which $0.4 million was recognized as excess tax benefits in additional paid-in capital and $0.4 million was recognized as cash flow from financing activities. The tax benefit was included in the Company’s consolidated statement of operations for the same period. Share-based compensation of $0.4 million was included in capitalized indirect inventory costs in 2009, 2008 and 2007.
47
Table of Contents
WEST MARINE, INC.
NOTES TO CONSOLIDATED FINANCIAL STATEMENTS—(Continued)
Included in cost of goods sold and SG&A expense is share-based compensation expense, net of estimated forfeitures, that have been included in the statements of operations for all share-based compensation arrangements as follows:
| (in thousands) |
2009 | 2008 | 2007 | ||||||
| Cost of goods sold |
$ | 409 | $ | 422 | $ | 406 | |||
| Selling, general and administrative expense |
2,001 | 1,833 | 1,545 | ||||||
| Share-based compensation expense |
$ | 2,410 | $ | 2,255 | $ | 1,951 | |||
Stock Options
West Marine awards options to purchase shares of common stock to its non-employee directors and to certain eligible associates employed at the time of the grant. Options granted to associates under the Plan after year-end 2006 vest over three years and expire five years following the grant date. Grants in 2006 vest over four years and generally expire five years from the grant date. Options granted to non-employee directors vest after six months and expire five years from grant date. The Company has determined the fair value of options awarded by applying the Black-Scholes Merton option pricing valuation model and using following assumptions:
| 2009 | 2008 | 2007 | |||||||
| Expected price volatility |
44 | % | 44 | % | 38 | % | |||
| Risk-free interest rate |
1.2%-1.9 | % | 2.1%-2.9 | % | 4.5%-4.9 | % | |||
| Weighted-average expected term (years) |
3.3 | 3.5 | 3.5 | ||||||
| Dividend yield |
— | — | — |
Expected price volatility: This is the percentage amount by which the price of West Marine common stock is expected to fluctuate annually during the estimated expected life for stock options. Expected price volatility is calculated using historical daily closing prices over a period matching the weighted-average expected term, as management believes such changes are the best indicator of future volatility. An increase in expected price volatility would increase compensation expense.
Share issuance: The Company’s policy is to issue new shares of common stock for purchase under the Plan. Shares of common stock are authorized by the Company’s Board of Directors, subject to stockholder approval, for issuance under the Plan. Subject to adjustment, the maximum number of shares currently available for grant under the Plan may not exceed 8,400,000 shares.
Risk-free interest rate: This is the U.S. Treasury zero-coupon rate, as of the grant date, for issues having a term equal to the expected life of the stock option. An increase in the risk-free interest rate would increase compensation expense.
Expected term: This is the period of time over which stock options are expected to remain outstanding. The Company calculates expected term based on the average of the vesting period and the full contractual term. The expected term decreased in 2009 in comparison to 2008 and 2007. An increase in the expected term would increase compensation expense.
Dividend yield: The Company historically has not made any dividend payments nor does it expect to pay dividends in the foreseeable future. An increase in the dividend yield would decrease compensation expense.
48
Table of Contents
WEST MARINE, INC.
NOTES TO CONSOLIDATED FINANCIAL STATEMENTS—(Continued)
A summary of the Company’s stock option activity in 2009, 2008 and 2007 is as follows:
| Number of Shares |
Weighted Average Exercise Price |
Weighted Average Option Grant Date Fair Value | |||||||
| Outstanding at year-end 2006 (2,729,858 shares exercisable at a weighted-average price of $19.25) |
3,138,203 | $ | 18.62 | $ | 12.26 | ||||
| Granted |
591,639 | 15.02 | 5.13 | ||||||
| Exercised |
(236,635 | ) | 12.38 | 8.53 | |||||
| Forfeited |
(139,952 | ) | 14.28 | 4.72 | |||||
| Expired |
(438,381 | ) | 22.63 | 14.56 | |||||
| Outstanding at year-end 2007 (2,176,825 shares exercisable at a weighted-average price of $19.10) |
2,914,874 | 17.96 | 10.24 | ||||||
| Granted |
1,214,610 | 5.15 | 1.81 | ||||||
| Exercised |
(1,429 | ) | 4.51 | 3.18 | |||||
| Forfeited |
(90,526 | ) | 11.63 | 4.16 | |||||
| Expired |
(305,946 | ) | 18.56 | 12.03 | |||||
| Outstanding at year-end 2008 (2,100,069 shares exercisable at a weighted-average price of $18.57) |
3,731,583 | 13.89 | 7.52 | ||||||
| Granted |
724,375 | 5.82 | 1.89 | ||||||
| Exercised |
(60,969 | ) | 4.82 | 2.31 | |||||
| Forfeited |
(100,970 | ) | 7.49 | 2.63 | |||||
| Expired |
(657,447 | ) | 20.49 | 11.98 | |||||
| Outstanding at year-end 2009 (1,969,741 shares exercisable at a weighted-average price of $15.32) |
3,636,572 | 11.37 | 5.80 | ||||||
The weighted-average grant date fair value of options granted in 2009, 2008 and 2007 was $1.89, $1.81 and $5.13 per share, respectively. The aggregate fair value of options vested during 2009, 2008 and 2007 was $3.5 million, $2.0 million and $0.8 million, respectively.
As of market close January 2, 2010, the aggregate intrinsic value for stock options outstanding was $5.0 million in the aggregate, and $1.3 million for options exercisable. The total intrinsic value of options actually exercised in 2009 was $0.2 million, de minimis in 2008 and $1.1 million in 2007. In 2009, the weighted-average grant date fair value of options for options granted was $1.89 per share. There were 901,587 options that vested in 2009 with an aggregate grant date fair value of $3.5 million. At January 2, 2010, unrecognized compensation expense for stock options, net of expected forfeitures, was $2.5 million, with a weighted-average expense recognition period of 1.6 years.
Additional information for options outstanding at year-end 2009 is as follows:
| Outstanding Options | Exercisable Options | |||||||||||||
| Range of Exercise Prices |
Shares Outstanding |
Weighted Average Remaining Contractual Term (Years) |
Weighted Average Exercise Price |
Exercisable Shares |
Weighted Average Remaining Contractual Term (Years) |
Weighted Average Exercise Price | ||||||||
| $ 0 – $ 7.00 |
1,889,950 | 3.6 | $ | 5.40 | 441,106 | 2.9 | $ | 5.15 | ||||||
| 7.01 – 10.75 |
84,159 | 0.5 | 8.47 | 80,159 | 0.2 | 8.43 | ||||||||
| 10.76 – 15.54 |
644,745 | 2.1 | 14.70 | 455,758 | 2.1 | 14.68 | ||||||||
| 15.55 – 22.00 |
713,028 | 2.6 | 16.76 | 688,028 | 2.6 | 16.76 | ||||||||
| 22.01 – 29.70 |
304,690 | 4.2 | 29.58 | 304,690 | 4.2 | 29.58 | ||||||||
| $ 0 – 29.70 |
3,636,572 | 3.1 | $ | 11.37 | 1,969,741 | 2.7 | $ | 15.32 | ||||||
49
Table of Contents
WEST MARINE, INC.
NOTES TO CONSOLIDATED FINANCIAL STATEMENTS—(Continued)
At January 2, 2010, there were 2,315,802 stock option shares expected to vest in the future, with an intrinsic value of $3.1 million, a weighted-average exercise price of $8.16 per share and a weighted-average remaining contractual term of 1.3 years.
Restricted Share Awards
The Plan also provides for awards of shares to eligible associates and non-employee directors that are subject to restrictions on transfer for a period of time (commonly referred to as “restricted shares”). Compensation expense for restricted share awards was $0.1 million. As of January 2, 2010, unrecognized compensation expense for unvested restricted share awards, net of expected forfeitures, was less than $0.1 million. A summary of restricted share activity in 2009, 2008 and 2007 is as follows:
| Number of Shares |
Weighted Average Grant Date Fair Value | |||||
| Unvested at year-end 2006 (weighted-average remaining vesting period of 2.2 years) |
48,301 | $ | 16.33 | |||
| Granted |
6,646 | 13.59 | ||||
| Vested |
(17,349 | ) | 15.96 | |||
| Forfeited |
(9,158 | ) | 16.58 | |||
| Unvested at year-end 2007 (weighted-average remaining vesting period of 1.2 years) |
28,440 | 15.88 | ||||
| Granted |
10,529 | 4.73 | ||||
| Vested |
(16,819 | ) | 15.40 | |||
| Forfeited |
(2,321 | ) | 16.58 | |||
| Unvested at year-end 2008 (weighted-average remaining vesting period of 0.4 years) |
19,829 | 10.28 | ||||
| Granted |
8,030 | 5.97 | ||||
| Vested |
(20,420 | ) | 9.95 | |||
| Forfeited |
(414 | ) | 16.58 | |||
| Unvested at year-end 2009 (weighted-average remaining vesting period of 0.4 years) |
7,025 | 5.97 | ||||
The weighted-average grant date fair value of restricted shares granted in 2009, 2008 and 2007 was $5.97, $4.73 and $13.59 per share, respectively. The total fair value of restricted shares vested in 2009, 2008 and 2007 was $0.2 million, $0.3 million and $0.3 million, respectively.
Associates Stock Buying Plan
The Company has an Associates Stock Buying Plan (the “Buying Plan”) under which all eligible associates may elect to participate on semiannual grant dates. Participating associates purchase West Marine shares at 85% of the lower of the closing price on (a) the grant date or (b) the purchase date. The number of shares purchased under the Buying Plan in 2009, 2008 and 2007 were 145,531, 197,559 and 99,452, respectively. Expense recognized in 2009, 2008 and 2007 was $0.3 million, $0.3 million and $0.4 million, respectively. Shares available for future issuance under the Buying Plan at the end of 2009, 2008 and 2007 were 759,046, 154,579 and 352,138, respectively. Assumptions used in determining the fair value of grants under the Buying Plan during 2009, 2008 and 2007 were as follows:
| 2009 | 2008 | 2007 | |||||||
| Expected price volatility |
55%-70 | % | 66%-67 | % | 31%-47 | % | |||
| Risk-free interest rate |
0.2%-0.3 | % | 0.2%-0.9 | % | 3.8%-5.0 | % | |||
| Weighted-average expected term (years) |
0.5 | 0.5 | 0.5 | ||||||
| Dividend yield |
— | — | — |
50
Table of Contents
WEST MARINE, INC.
NOTES TO CONSOLIDATED FINANCIAL STATEMENTS—(Continued)
NOTE 3: STORE CLOSURES AND OTHER RESTRUCTURING COSTS
Restructuring charges include severance costs, lease termination fees, legal and professional fees paid for lease termination negotiations, and other costs associated with the closure of facilities. Severance benefits are detailed in approved severance plans, which are specific as to number, position, location and timing. In addition, severance benefits are communicated in specific detail to affected employees and are unlikely to change when costs are recorded. Costs are recognized over the period services are rendered, otherwise they are recognized when they are communicated to the employees. Other associated costs, such as legal and professional fees, are expensed as incurred.
During fiscal 2009, the Company reached an agreement to sublease a location which had a large lease termination obligation. The terms of this particular agreement were favorable as compared to those originally estimated. This resulted in a $1.7 million reversal in 2009 of previously accrued estimated costs.
During fiscal 2008, management completed restructuring activities which included the closure of 24 stores, a distribution center located in Hagerstown, Maryland and a call center located in Largo, Florida. The closures did not collectively represent a segment, reporting unit, subsidiary or asset group of the Company and, therefore were not considered discontinued operations. The Company store closure and other restructuring costs totaling $10.7 million consisted of $6.9 million for stores, $0.1 million for Port Supply, $2.9 million for the distribution center, $0.5 million for the call center and $0.3 million for reductions in force at the Watsonville Support Center. During 2008, the Company also recognized incremental expense for stores which were closed during the year ended December 30, 2006.
In 2007, West Marine increased reserves pertaining to 2006 store closure activity by $0.6 million. In 2008, due to unfavorable macro-economic conditions, West Marine increased reserves for lease contract termination obligations by an additional $2.0 million.
In fiscal 2007, impairment expenses of $1.3 million, previously presented in “Selling, general and administrative expense,” was reclassified as “Impairment of long-lived assets.”
Costs and obligations (included in “Accrued liabilities” in the Company’s Consolidated Balance Sheets) recorded by the Company in 2009, 2008 and 2007 in conjunction with the store closures and other restructuring costs are as follows (in thousands):
| Termination Benefits and Other Costs |
Store Lease Termination Costs |
Total | ||||||||||
| Beginning balance, December 30, 2006 |
$ | 569 | $ | 2,437 | $ | 3,006 | ||||||
| Charges |
— | 558 | 558 | |||||||||
| Payments |
(569 | ) | (1,007 | ) | (1,576 | ) | ||||||
| Ending balance, December 29, 2007 |
$ | — | $ | 1,988 | $ | 1,988 | ||||||
| Charges |
3,023 | 7,664 | 10,687 | |||||||||
| Payments |
(1,954 | ) | (1,652 | ) | (3,606 | ) | ||||||
| Ending balance, January 3, 2009 |
$ | 1,069 | $ | 8,000 | $ | 9,069 | ||||||
| Reduction in charges |
(158 | ) | (1,588 | ) | (1,746 | ) | ||||||
| Payments |
(321 | ) | (2,476 | ) | (2,797 | ) | ||||||
| Ending balance, January 2, 2010 |
$ | 590 | $ | 3,936 | $ | 4,526 | ||||||
51
Table of Contents
WEST MARINE, INC.
NOTES TO CONSOLIDATED FINANCIAL STATEMENTS—(Continued)
NOTE 4: PROPERTY AND EQUIPMENT
Property and equipment consisted of the following at fiscal year-end 2009 and 2008 (in thousands):
| At Year-End | ||||||||
| 2009 | 2008 | |||||||
| Furniture and equipment |
$ | 59,369 | $ | 57,429 | ||||
| Computer software and hardware |
92,511 | 91,264 | ||||||
| Leasehold improvements |
60,587 | 59,883 | ||||||
| Land and building |
7,439 | 7,406 | ||||||
| Property and equipment, at cost |
219,906 | 215,982 | ||||||
| Accumulated depreciation and amortization |
(163,628 | ) | (156,367 | ) | ||||
| Property and equipment, net |
$ | 56,278 | $ | 59,615 | ||||
Depreciation and amortization expense for property and equipment was $16.7 million, $18.6 million and $19.5 million in 2009, 2008 and 2007, respectively.
NOTE 5: LINES OF CREDIT AND LONG–TERM DEBT
The Company has a five-year, $225.0 million loan agreement with a group of lenders. The agreement expires in December 2010. The amount available to be borrowed is based on a percentage of the Company inventory (but does not include capitalized indirect costs) and accounts receivable. The loan agreement contains certain covenants, including but not limited to, restrictions on the ability of the Company to incur debt, grant liens, make acquisitions and investments, pay dividends and sell or transfer assets. Additionally, a minimum revolving credit availability equal to the lesser of $15.0 million or 7.5% of the borrowing base must be maintained. At the Company’s option, subject to certain conditions and restrictions, the loan agreement provides up to $25.0 million in additional financing during the term. The credit facility is guaranteed by the Company and is secured by a security interest in all of the accounts receivable and inventory of the Company, certain other assets related thereto and all proceeds thereof. The credit facility includes a $50.0 million sub-facility available for the issuance of commercial and standby letters of credit. The credit facility also includes a sub-limit of up to $20.0 million for same day advances.
At West Marine’s election, borrowings under the credit facility bear interest at one of the following rates: (1) the prime rate announced by Wells Fargo Bank, National Association at its principal office in San Francisco, California or (2) the interest rate per annum at which deposits in U.S. dollars are offered by reference lenders to prime banks in designated markets located outside the United States. In each case, the applicable interest rate is increased by a margin imposed by the loan agreement. The applicable margin for any date will depend upon the amount of available credit under the revolving credit facility. The loan agreement also imposes a commitment fee on the unused portion of the revolving credit facility. For 2009, 2008 and 2007, the weighted average interest rate on all of the Company’s outstanding borrowings was 1.8%, 4.2% and 6.6%, respectively. As of January 2, 2010, the Company was in compliance with our bank covenants.
At the end of fiscal year 2009, there were no amounts outstanding under this credit facility, and $88.7 million was available for future borrowings. At the end of fiscal year 2009, the Company had $7.4 million of outstanding commercial and stand-by letters of credit.
52
Table of Contents
WEST MARINE, INC.
NOTES TO CONSOLIDATED FINANCIAL STATEMENTS—(Continued)
NOTE 6: RELATED PARTY TRANSACTIONS
Prior to July 1, 2007, the Company purchased merchandise from a supplier in which the Chairman of the Company’s Board of Directors, Randolph K. Repass, was an investor and a member of the board of directors. The supplier was acquired by an unrelated party and is no longer a related party from that date forward. The Company’s cost of sales during 2007 included $6.8 million, for goods purchased from the related supplier.
Since February 2002, West Marine has leased its store in Palo Alto, California from a trust, for which Randolph K. Repass is the trustee. Prior to that, the Company leased its Palo Alto store directly from Randolph K. Repass. The Company also leases its store in New Bedford, Massachusetts from a corporation of which Mr. Repass’ brother is the President and his father is a member of the board of directors and a major stockholder. In addition, the Company leases its Watsonville, California support center and its stores in Santa Cruz, California and Braintree, Massachusetts from three partnerships. Mr. Repass is a general partner of each partnership and, together with certain members of his family, he owns substantially all of the partnership interests in such partnerships. Geoffrey A. Eisenberg, our Chief Executive Officer, is a 7.5% limited partner in the two partnerships from which the Company leases its Watsonville, California support center and its store in Santa Cruz, California. Pursuant to these leases, West Marine paid rent to the above-related parties during fiscal years 2009, 2008 and 2007 in the aggregate amount of approximately $1.6 million, $1.9 million and $1.9 million, respectively. As of January 2, 2010, there were no amounts due to or due from related parties.
NOTE 7: COMMITMENTS AND CONTINGENCIES
The Company leases certain equipment, and space for its retail stores, its distribution centers and its support center. The Company also sublets space at various locations with both month-to-month and non-cancelable sublease agreements. The operating leases of certain stores provide for periodic rent adjustments based on store revenues, the consumer price index and contractual rent increases.
The aggregate minimum annual contractual payments under non-cancelable leases, reduced for sublease income, in effect at fiscal year-end 2009 were as follows (in thousands):
| 2010 |
$ | 42,401 | |
| 2011 |
35,644 | ||
| 2012 |
28,622 | ||
| 2013 |
20,974 | ||
| 2014 |
15,933 | ||
| Thereafter |
52,681 | ||
| Minimum non-cancelable lease payments, net |
$ | 196,255 | |
No assets of the Company were subject to capital leases at fiscal year-end 2009, 2008 or 2007. All but a limited number of the Company’s purchase commitments, which are not material, are cancelable without payment and, therefore, have been excluded from the table.
Following is a summary of rent expense by component (in thousands):
| 2009 | 2008 | 2007 | ||||||||||
| Minimum rent |
$ | 43,826 | $ | 51,927 | $ | 43,769 | ||||||
| Percent rent |
98 | 114 | 142 | |||||||||
| Sublease income |
(76 | ) | (89 | ) | (128 | ) | ||||||
| Rent paid to related parties |
1,608 | 1,851 | 1,862 | |||||||||
| Total rent expense |
$ | 45,456 | $ | 53,803 | $ | 45,645 | ||||||
53
Table of Contents
WEST MARINE, INC.
NOTES TO CONSOLIDATED FINANCIAL STATEMENTS—(Continued)
The Company is party to various legal and administrative proceedings, claims and litigation arising from normal business activities. Based on the facts currently available, the Company does not believe that the disposition of matters that are pending or asserted, individually or in the aggregate, will have a material adverse effect on future financial results. However, an adverse judgment by a court, administrative or regulatory agency, arbitrator or a settlement could adversely impact the Company’s results of operations in any given period.
In addition, the Company is subject to various routine and non-routine reviews, audits and investigations by various federal and state governmental regulators, including customs, environmental and tax authorities in the jurisdictions where it conducts business, which may result in assessments of additional taxes, penalties, interest or the revision and recoupment of past payments made based on audit findings. The Company accrues a liability for this type of contingency when it believes that it is both probable that a liability has been incurred and that it can reasonably estimate the amount of the loss. The Company believes it has adequately provided for obligations that would result from these legal and sales and use tax proceedings where it is probable it will pay some amounts and the amounts can be estimated; in some cases, however, it is too early to predict a final outcome. The Company is currently under audit for sales taxes in several jurisdictions. The tax periods open to examination by the major taxing jurisdictions for sales and use taxes are fiscal 2001 through fiscal 2009. Management believes that the ultimate resolution of these matters will not have a material effect on the Company’s future financial condition or results of operations. Additionally, U.S. Customs and Border Protection has advised the Company that it will be performing a “focused assessment” of the Company’s import practices for fiscal 2008. The Company intends to cooperate with the agency in its assessment. At this time, this matter is in a preliminary stage and the outcome cannot be predicted.
NOTE 8: INCOME TAXES
Following is a summary of the (benefit) provision for income taxes (in thousands):
| 2009 | 2008 | 2007 | ||||||||||
| Currently payable: |
||||||||||||
| Federal |
$ | (2,828 | ) | $ | (1,028 | ) | $ | (280 | ) | |||
| State |
463 | 358 | (237 | ) | ||||||||
| Foreign |
108 | 20 | — | |||||||||
| (2,257 | ) | (650 | ) | (517 | ) | |||||||
| Deferred: |
||||||||||||
| Federal |
(371 | ) | 11,775 | (7,435 | ) | |||||||
| State |
— | 2,405 | 2,859 | |||||||||
| Foreign |
(209 | ) | — | — | ||||||||
| (580 | ) | 14,180 | (4,576 | ) | ||||||||
| Income tax (benefit) expense |
$ | (2,837 | ) | $ | 13,530 | $ | (5,093 | ) | ||||
54
Table of Contents
WEST MARINE, INC.
NOTES TO CONSOLIDATED FINANCIAL STATEMENTS—(Continued)
Following is a summary of the difference between the effective income tax rate and the statutory federal income tax rate:
| 2009 | 2008 | 2007 | |||||||
| Statutory federal tax rate |
35.0 | % | (35.0 | %) | (35.0 | %) | |||
| State income taxes, net of federal tax benefit |
7.2 | (4.0 | ) | 3.1 | |||||
| Non-deductible permanent items |
0.3 | 1.6 | 0.3 | ||||||
| Non-deductible goodwill (1) |
— | — | 22.5 | ||||||
| Valuation allowance reversal for prior-year carryback |
(42.1 | ) | |||||||
| Valuation allowance on net deferred tax assets |
(40.3 | ) | 91.7 | — | |||||
| Uncertain tax positions |
11.7 | — | — | ||||||
| Other |
(1.5 | ) | (0.8 | ) | (0.1 | ) | |||
| Effective tax rate |
(29.7 | %) | 53.5 | % | (9.2 | %) | |||
| (1) | Represents the tax effect of the Company’s 2007 non-cash impairment charge of $56.9 million related to goodwill. Of this amount, $35.4 million is permanently non-deductible, resulting in $14.1 million additional tax expense in 2007 for federal and state tax purposes. |
Deferred tax assets and liabilities are determined based upon the estimated future tax effects of the difference between the financial statement and tax basis of assets and liabilities using enacted tax rates. Following is a summary of the tax effects of temporary differences that give rise to significant components of deferred tax assets and liabilities (in thousands):
| 2009 | 2008 | |||||||
| Current: |
||||||||
| Accrued expenses |
$ | 6,581 | $ | 8,861 | ||||
| Deferred compensation costs |
1,498 | 1,436 | ||||||
| Prepaid expenses |
(1,638 | ) | (1,423 | ) | ||||
| Capitalized inventory costs |
805 | 1,029 | ||||||
| Federal effect of state and foreign deferreds |
(5,164 | ) | (1,512 | ) | ||||
| Net operating loss carryforward |
206 | — | ||||||
| Other |
1,184 | 2,099 | ||||||
| Total current |
3,472 | 10,490 | ||||||
| Non-current: |
||||||||
| Deferred rent |
2,119 | 1,641 | ||||||
| Fixed assets |
(2,114 | ) | (1,160 | ) | ||||
| Intangible assets |
5,421 | 6,126 | ||||||
| Charitable contribution carryforward |
583 | 489 | ||||||
| Net operating loss carryforwards |
5,277 | 8,268 | ||||||
| State tax credits |
5,259 | 5,560 | ||||||
| Share-based compensation |
1,460 | 993 | ||||||
| Other |
2,298 | 1,493 | ||||||
| Total non-current |
20,303 | 23,410 | ||||||
| Valuation allowance |
(23,195 | ) | (33,900 | ) | ||||
| Total deferred tax assets |
$ | 580 | $ | — | ||||
55
Table of Contents
WEST MARINE, INC.
NOTES TO CONSOLIDATED FINANCIAL STATEMENTS—(Continued)
Net deferred tax assets were in the accompanying consolidated balance sheet, as follows (in thousands):
| 2009 | 2008 | ||||||
| Current deferred income taxes |
$ | 1,299 | $ | — | |||
| Non-current (included in Deferred rent, and other) |
(719 | ) | — | ||||
| Total deferred tax assets |
580 | — | |||||
During the second quarter of 2008, management forecasted insufficient income in future years to fully utilize all of the Company’s net deferred tax assets. A valuation allowance must be provided if, based on all available evidence, it is more likely than not that some portion or all of the deferred tax assets will not be realized. The valuation allowance should be sufficient to reduce the deferred tax assets to the amount that is more likely than not to be realized. Cumulative losses are a form of objective negative evidence that carries more weight than subjective positive evidence, such as forecasts. After examining all of the available evidence, both positive and negative, the Company determined a valuation allowance was appropriate. The Company recorded valuation allowances against its deferred tax assets of $23.2 and $33.9 million at year end 2009 and 2008, respectively.
These valuation allowance adjustments have no impact on the Company’s cash flow or future prospects, nor do they alter the Company’s ability to utilize the underlying net operating losses and credit carryforwards for income tax purposes in the future, the utilization of which is limited to achieving future taxable income.
At year-end 2009, the Company recognized $3.7 million in federal net operating losses through a carry-back from 2008 to the 2003 and 2004 years.
At year-end 2009, the Company had no federal income tax net loss carryforwards and $46.0 million for state income tax net loss carryforwards that expire between 2010 and 2029. In addition, the Company had California state enterprise zone credits of $3.6 million that may be used for an indefinite period of time and South Carolina tax credits of $1.7 million that expire between 2013 and 2017. These carryforwards are available to offset future state taxable income. At year-end 2009, the Company had foreign net loss carryforwards of $7.0 million that expire between 2010 and 2029.
Following is a summary of the change in valuation allowance (in thousands):
| 2009 | 2008 | 2007 | ||||||||
| Valuation allowance—beginning of year |
$ | 33,900 | $ | 10,719 | $ | 5,612 | ||||
| Valuation allowance additions (reductions) |
(10,705 | ) | 23,181 | 5,107 | ||||||
| Valuation allowance—end of year |
$ | 23,195 | $ | 33,900 | $ | 10,719 | ||||
The Company and its subsidiaries file income tax returns in the U.S. federal jurisdiction, various states, Puerto Rico and Canada. The federal statute of limitations for examination by authorities is open for the years 2003 through 2008, excluding tax year 2005. With few exceptions, the statute of limitations for state jurisdictions is open for the years 2005 through 2008. The statute of limitations for income tax return examinations is four years for Puerto Rico and seven years for Canada.
Unrecognized tax benefits activity for the fiscal years ending is summarized below (in thousands):
| 2009 | 2008 | 2007 | |||||||
| Unrecognized tax benefit—beginning of year |
2,293 | 2,547 | 2,963 | ||||||
| Additions based on tax positions related to the current year |
57 | 67 | 108 | ||||||
| Additions for tax positions of prior years |
990 | 69 | 82 | ||||||
| Reductions for tax positions of prior years |
(27 | ) | (78 | ) | (340 | ) | |||
| Settlements |
(46 | ) | (138 | ) | (200 | ) | |||
| Lapse of statutes of limitations |
(13 | ) | (174 | ) | (66 | ) | |||
| Unrecognized tax benefit—end of year |
3,254 | 2,293 | 2,547 | ||||||
56
Table of Contents
WEST MARINE, INC.
NOTES TO CONSOLIDATED FINANCIAL STATEMENTS—(Continued)
Included in the balance of unrecognized tax benefits at January 2, 2010 and January 3, 2009 are $2.7 million and $1.8 million, respectively, of tax benefits that, if recognized, would affect the Company’s effective tax rate.
In 2009, additions to uncertain tax positions for prior years included $0.1 million for the opening of the statute of limitations for prior years related to a carryback of net operating losses allowable under new federal legislation. Also included is a $0.4 million additional reserve for foreign transfer pricing as a result of the release of a valuation allowance in Puerto Rico. The prior year additions also included $0.4 million related to the statute of limitations expiring on netted tax benefits. In 2008 and 2007, the additions to uncertain tax positions for prior years of $0.1 million each related to open state tax audits.
The Company recognizes accrued interest and penalties related to unrecognized tax benefits in the provision (benefit) for income taxes. During fiscal year 2009, interest and penalties expense were $0.1 million. During both fiscal years 2008 and 2007, the Company recognized less than $0.1 million of interest expense. The Company had accrued $0.3 million in interest and $0.1 million in penalties at January 2, 2010 and $0.2 million for the payment of interest and $0.1 million for the payment of penalties at January 3, 2009, and $0.2 million for the payment of interest at December 29, 2007. The Company is unable to make a determination as to whether or not recognition of any unrecognized tax benefits will occur within the next 12 months nor can we make an estimate of the range of any potential changes to the unrecognized tax benefits.
NOTE 9: EMPLOYEE BENEFIT PLANS
The Company has a defined contribution savings plan covering all eligible associates. The Company matches 33% of an employee’s contribution up to 5% of the employee’s annual compensation, subject to statutory limitations. The Company’s contributions to the plan were $0.6 million for fiscal years 2009, 2008 and 2007. Plan participants may choose from an array of mutual fund investment options. The plan does not permit investments in West Marine common stock.
NOTE 10: SEGMENT INFORMATION
The Company has three reportable segments—Stores, Port Supply (wholesale) and Direct Sales (Internet and call center)—all of which sell merchandise directly to customers. The customer base overlaps between the Company’s Stores and Port Supply segments, and between its Stores and Direct Sales segments. All processes for the three segments within the supply chain are commingled, including purchases from vendors, distribution center activity and customer delivery.
In addition to the Company’s 10 stores located in Canada and two franchised stores located in Turkey, revenues are attributed to geographic locations based on the location to which the Company ships its products. Through the Direct Sales segment, the Company promotes and sells products internationally through both its websites and call center. The Company operates primarily in the United States with foreign revenues representing 5% or less of total net revenues during fiscal years 2009, 2008 and 2007, and foreign long-lived assets totaled less than 2% of long-lived assets at each of these dates.
Segment assets are those directly allocated to an operating segment’s operations. For the Stores segment, assets primarily include leasehold improvements, computer assets, fixtures, land and buildings. For the Port Supply and Direct Sales segments, assets primarily include computer assets. Unallocated assets include merchandise inventory, shared technology infrastructure, distribution centers, corporate headquarters, prepaid expenses, deferred taxes and other assets. Capital expenditures and depreciation expense for each segment are allocated to the assets assigned to the segment. Contribution is defined as net revenues less product costs and direct expenses.
57
Table of Contents
WEST MARINE, INC.
NOTES TO CONSOLIDATED FINANCIAL STATEMENTS—(Continued)
Following is financial information related to the Company’s business segments (in thousands):
| 2009 | 2008 | 2007 | ||||||||||
| Net revenues: |
||||||||||||
| Stores |
$ | 525,392 | $ | 551,815 | $ | 594,080 | ||||||
| Port Supply |
28,936 | 39,483 | 41,636 | |||||||||
| Direct Sales |
34,088 | 39,960 | 43,845 | |||||||||
| Consolidated net revenues |
$ | 588,416 | $ | 631,258 | $ | 679,561 | ||||||
| Contribution: |
||||||||||||
| Stores |
$ | 64,239 | $ | 43,707 | $ | 12,285 | (1) | |||||
| Port Supply |
(1,736 | ) | (1,359 | ) | 1,309 | |||||||
| Direct Sales |
6,829 | 5,659 | 6,251 | |||||||||
| Consolidated contribution |
$ | 69,332 | $ | 48,007 | $ | 19,845 | ||||||
| Reconciliation of consolidated contribution to net income (loss): |
||||||||||||
| Consolidated contribution |
$ | 69,332 | $ | 48,007 | $ | 19,845 | ||||||
| Less: |
||||||||||||
| Indirect costs of goods sold not included in consolidated contribution |
(26,688 | ) | (33,218 | ) | (32,598 | ) | ||||||
| General and administrative expense |
(32,299 | ) | (37,721 | ) | (38,355 | ) | ||||||
| Interest expense |
(806 | ) | (2,338 | ) | (3,962 | ) | ||||||
| Benefit (provision) for income taxes |
2,837 | (13,530 | ) | 5,094 | ||||||||
| Net income (loss) |
$ | 12,376 | $ | (38,800 | ) | $ | (49,976 | ) | ||||
| (1) | Includes $56.9 million of goodwill written off in the fourth quarter of 2007. |
| 2009 | 2008 | 2007 | |||||||
| Assets: |
|||||||||
| Stores |
$ | 37,659 | $ | 37,623 | $ | 43,017 | |||
| Port Supply |
4,414 | 5,400 | 6,812 | ||||||
| Direct Sales |
412 | 808 | 1,409 | ||||||
| Unallocated |
249,752 | 270,761 | 317,080 | ||||||
| Total assets |
$ | 292,237 | $ | 314,592 | $ | 368,318 | |||
| Capital expenditures: |
|||||||||
| Stores |
$ | 9,354 | $ | 9,383 | $ | 10,504 | |||
| Port Supply |
26 | 984 | 158 | ||||||
| Direct Sales |
— | 131 | 2,661 | ||||||
| Unallocated |
4,375 | 4,566 | 4,514 | ||||||
| Total capital expenditures |
$ | 13,755 | $ | 15,064 | $ | 17,837 | |||
| Depreciation and amortization: |
|||||||||
| Stores |
$ | 10,385 | $ | 10,998 | $ | 12,334 | |||
| Port Supply |
190 | 315 | 422 | ||||||
| Direct Sales |
324 | 493 | 820 | ||||||
| Unallocated |
6,131 | 6,974 | 6,160 | ||||||
| Total depreciation and amortization |
$ | 17,030 | $ | 18,780 | $ | 19,736 | |||
58
Table of Contents
WEST MARINE, INC.
NOTES TO CONSOLIDATED FINANCIAL STATEMENTS—(Continued)
NOTE 11: QUARTERLY FINANCIAL DATA
(Unaudited and in thousands, except per share data)
| 2009 | ||||||||||||||||
| First Quarter |
Second Quarter |
Third Quarter |
Fourth Quarter |
|||||||||||||
| Net revenues |
$ | 100,965 | $ | 215,371 | $ | 168,154 | $ | 103,926 | ||||||||
| Gross profit |
21,911 | 73,093 | 47,451 | 18,460 | ||||||||||||
| Selling, general and administrative expense |
36,884 | 40,529 | 38,618 | 36,272 | ||||||||||||
| Income (loss) from operations |
(15,050 | ) | 32,590 | 9,052 | (16,247 | ) | ||||||||||
| Net income (loss) |
(15,778 | ) | 32,488 | 8,473 | (12,807 | ) | ||||||||||
| Net income (loss) per share: |
||||||||||||||||
| Basic |
$ | (0.71 | ) | $ | 1.46 | $ | 0.38 | $ | (0.57 | ) | ||||||
| Diluted |
(0.71 | ) | 1.46 | 0.38 | (0.57 | ) | ||||||||||
| Stock trade price: |
||||||||||||||||
| High |
$ | 5.75 | $ | 6.25 | $ | 9.50 | $ | 8.20 | ||||||||
| Low |
3.80 | 4.95 | 5.48 | 6.88 | ||||||||||||
| 2008 | ||||||||||||||||
| First Quarter |
Second Quarter |
Third Quarter |
Fourth Quarter |
|||||||||||||
| Net revenues |
$ | 113,263 | $ | 226,681 | $ | 180,249 | $ | 111,065 | ||||||||
| Gross profit |
22,485 | 78,411 | 49,731 | 16,819 | ||||||||||||
| Selling, general and administrative expense |
46,821 | 48,872 | 43,853 | 37,284 | ||||||||||||
| Income (loss) from operations |
(24,602 | )(1) | 27,588 | (2) | 4,012 | (4) | (29,930 | )(5) | ||||||||
| Net income (loss) |
(17,661 | )(1) | 4,441 | (2,3) | 3,421 | (4) | (29,001 | )(5) | ||||||||
| Net income (loss) per share: |
||||||||||||||||
| Basic |
$ | (0.81 | )(1) | $ | 0.20 | (2,3) | $ | 0.16 | (4) | $ | (1.31 | )(5) | ||||
| Diluted |
(0.81 | )(1) | 0.20 | (2,3) | 0.16 | (4) | (1.31 | )(5) | ||||||||
| Stock price: |
||||||||||||||||
| High |
$ | 9.44 | $ | 7.05 | $ | 6.21 | $ | 6.47 | ||||||||
| Low |
6.40 | 4.10 | 3.45 | 3.91 | ||||||||||||
| (1) | Includes a $0.3 million charge for impairment of long-lived assets and $1.6 million of costs related to the now-settled SEC investigation. |
| (2) | Includes a $2.0 million charge for impairment of long-lived assets and $0.5 million of costs related to the now-settled SEC investigation. |
| (3) | Includes a charge of $14.6 million to provide a full valuation allowance against all net deferred tax assets. |
| (4) | Includes the following items on a pre-tax basis: a $1.7 million pre-tax charge for store closures and other restructuring costs (see Note 3 to our consolidated financial statements for further discussion), and a $0.2 million pre-tax charge for impairment of long-lived assets. |
| (5) | Includes the following items on a pre-tax basis: a $9.0 million pre-tax charge for store closures and other restructuring costs (see Note 3 to our consolidated financial statements for further discussion), and a $0.4 million pre-tax charge for impairment of long-lived assets. |
59
Table of Contents
ITEM 9—CHANGES IN AND DISAGREEMENTS WITH ACCOUNTANTS ON ACCOUNTING AND FINANCIAL DISCLOSURE
None.
ITEM 9A—CONTROLS AND PROCEDURES
Evaluation of Disclosure Controls and Procedures
West Marine’s management, including our chief executive officer and chief financial officer, evaluated the effectiveness of our disclosure controls and procedures, as defined in Rules 13a-15(e) and 15d-15(e) of the Exchange Act. Based on this review, management has concluded that our disclosure controls and procedures were not effective as of January 2, 2010, due to the existence of the material weakness discussed below.
Description of Material Weakness in Internal Control Over Financial Reporting
West Marine’s management is responsible for establishing and maintaining an effective system of internal control over financial reporting, as defined in Rule 13a-15(f) under the Exchange Act. A material weakness is a deficiency, or a combination of deficiencies, in internal control over financial reporting, such that there is a reasonable possibility that a material misstatement of the company’s annual or interim financial statements will not be prevented or detected on a timely basis. As described in Management’s Report on Internal Control over Financial Reporting, contained in Item 8 of this annual report on Form 10-K, management has concluded that, as of January 2, 2010, we had not maintained effective internal control over financial reporting because we have identified a material weakness arising from the reconciliation performed for estimated freight charges which resulted in an over-accrual. For more information, see “Management’s Report on Internal Control Over Financial Reporting” in Item 8 of this report.
As a result of this material weakness, an adjustment of approximately $1.5 million was necessary to decrease accrued liabilities and to decrease costs of goods sold during the fourth quarter ended January 2, 2010. However, the adjustment related to the material weakness and other fourth quarter adjustments, viewed individually or in the aggregate, did not result in any material misstatement of any financial statements we previously issued. Accordingly, you may continue to rely on our previously issued financial statements.
Changes in Internal Control Over Financial Reporting
There were no changes in our internal control over financial reporting during the quarter ended January 2, 2010 that materially affected, or are reasonably likely to materially affect, our internal control over financial reporting.
As a result of the above described material weakness, we are reevaluating the account level thresholds that trigger additional analysis and we anticipate adding to our accounting expertise to broaden our review of these accounts, including accounts related to freight charges. We intend to improve our monitoring control to bolster our peer review process of account reconciliations on a quarterly basis, including the reconciliation of estimated freight charges.
Management is implementing the above remedial measures for the first quarter of fiscal 2010, and we expect these measures to remediate the deficiency that gave rise to the material weakness. We will monitor and test these measures throughout the year and make any refinements or implement additional measures as needed to remediate the identified deficiency. Management believes that these efforts are reasonably likely to materially affect our internal control over financial reporting as they are designed to remediate the material weakness.
None.
60
Table of Contents
PART III
ITEM 10—DIRECTORS, EXECUTIVE OFFICERS AND CORPORATE GOVERNANCE
The information required by this item is incorporated by reference from our definitive proxy statement for the 2010 annual meeting of stockholders.
ITEM 11—EXECUTIVE COMPENSATION
The information required by this item is incorporated by reference from our definitive proxy statement for the 2010 annual meeting of stockholders.
ITEM 12—SECURITY OWNERSHIP OF CERTAIN BENEFICIAL OWNERS AND MANAGEMENT AND RELATED STOCKHOLDER MATTERS
The information required by this item is incorporated by reference from our definitive proxy statement for the 2010 annual meeting of stockholders.
ITEM 13—CERTAIN RELATIONSHIPS AND RELATED TRANSACTIONS, AND DIRECTOR INDEPENDENCE
The information required by this item is incorporated by reference from our definitive proxy statement for the 2010 annual meeting of stockholders.
ITEM 14—PRINCIPAL ACCOUNTING FEES AND SERVICES
The information required by this item is incorporated by reference from our definitive proxy statement for the 2010 annual meeting of stockholders.
61
Table of Contents
PART IV
ITEM 15—EXHIBITS AND FINANCIAL STATEMENT SCHEDULES
(a) The following documents are filed as part of this report:
| 1 & 2. |
Reports of Independent Registered Public Auditing Firm | |
| Consolidated Balance Sheets as of year-end 2009 and 2008 | ||
| Consolidated Statements of Operations for years 2009, 2008 and 2007 | ||
| Consolidated Statements of Stockholders’ Equity for years 2009, 2008 and 2007 | ||
| Consolidated Statements of Cash Flows for years 2009, 2008 and 2007 | ||
| Notes to Consolidated Financial Statements | ||
| 3. |
Exhibits: | |
62
Table of Contents
Exhibit Index
| Exhibit Number |
Exhibit | |
| 3.1 | Certificate of Incorporation of West Marine, Inc., as amended (incorporated by reference to Exhibit 3.1 to West Marine’s Annual Report on Form 10-K for the year ended January 3, 2004). | |
| 3.2 | Bylaws of West Marine, Inc., as amended (incorporated by reference to Exhibit 3.1 to West Marine’s Current Report on Form 8-K, dated March 8, 2007 and filed with the Commission on March 13, 2007). | |
| 4.1 | Specimen Common Stock Certificate (incorporated by reference to Exhibit 4.1 to West Marine’s Registration Statement on Form S-1 (Registration No. 33-69604)). | |
| 10.1 | Form of Indemnification Agreement between West Marine, Inc. and its directors and officers (incorporated by reference to Exhibit 10.1 to West Marine’s Quarterly Report on Form 10-Q for the quarter ended June 29, 2002). | |
| 10.2* | Omnibus Equity Incentive Plan, as amended (incorporated by reference to Exhibit 10.1 to West Marine’s Current Report on Form 8-K dated May 21, 2008 and filed with the Commission on May 22, 2008). | |
| 10.2.1* | Form of Notice of Grant of Stock Options and Option Agreement for Employees, effective as of June 1, 2007 (incorporated by reference to Exhibit 10.1.1 to West Marine’s Quarterly Report on Form 10-Q for the quarter ended June 30, 2007). | |
| 10.2.2* | Form of Notice of Grant of Stock Options for Non-Employee Directors (incorporated by reference to Exhibit 10.3.2 to West Marine’s Annual Report on Form 10-K for the year ended January 1, 2005). | |
| 10.2.3* | Notice to holders of West Marine, Inc. stock options regarding accelerated vesting (incorporated by reference to Exhibit 10.4 to West Marine, Inc.’s Current Report on Form 8-K dated December 22, 2005 and filed with the Commission on December 29, 2005). | |
| 10.3* | Associates Stock Buying Plan, as amended and restated effective March 2002 (incorporated by reference to Exhibit 10.3 to West Marine’s Quarterly Report on Form 10-Q for the quarter ended June 29, 2002). | |
| 10.3.1* | Amendment Number One to the Associates Stock Buying Plan (incorporated by reference to Exhibit 10.2 to West Marine’s Registration Statement on Form S-8 (Registration No. 333-143285)). | |
| 10.3.2* | Amendment Number Two to the Associates Stock Buying Plan (incorporated by reference to Exhibit 10.3 to West Marine’s Current Report on Form 8-K dated May 20, 2009 and filed with the Commission on May 21, 2009). | |
| 10.4 | Lease Agreement, dated as of June 15, 1995, by and among John E. Van Valkenburgh, Carl D. Panattoni and West Marine Products, Inc., for the Hollister, California distribution facility (incorporated by reference to Exhibit 10.9 to West Marine’s Annual Report on Form 10-K for the year ended December 30, 1995). | |
| 10.4.1 | Addendum, dated as of June 3, 1996, to the Lease Agreement for the Hollister, California distribution facility (incorporated by reference to Exhibit 10.10.1 to West Marine’s Annual Report on Form 10-K for the year ended December 29, 2001). | |
| 10.4.2 | First Amendment, dated as of March 23, 1999, to the Lease Agreement for the Hollister, California distribution facility (incorporated by reference to Exhibit 10.10.2 to West Marine’s Annual Report on Form 10-K for the year ended December 29, 2001). | |
63
Table of Contents
| Exhibit Number |
Exhibit | |
| 10.4.3 | Second Amendment, dated as of June 11, 2002, to the Lease Agreement for the Hollister, California distribution facility (incorporated by reference to Exhibit 10.7 to West Marine’s Quarterly Report on Form 10-Q for the quarter ended March 29, 2003). | |
| 10.4.4 | Third Amendment, dated as of April 1, 2003, to the Lease Agreement for the Hollister, California distribution facility (incorporated by reference to Exhibit 10.7.1 to West Marine’s Quarterly Report on Form 10-Q for the quarter ended March 29, 2003). | |
| 10.5 | Lease Agreement, dated as of March 11, 1997, between Cabot Industrial Venture A, LLC, as successor to Cabot Industrial Properties, L.P., as successor to W/H No. 31, L.L.C, and West Marine, Inc., for the Rock Hill, South Carolina distribution facility and other agreements thereto (incorporated by reference to Exhibit 10.14 to West Marine’s Quarterly Report on Form 10-Q for the quarter ended March 29, 1997). | |
| 10.5.1 | First Amendment, dated as of August 11, 1998, to the Lease Agreement for the Rock Hill, South Carolina distribution facility and other agreements thereto (incorporated by reference to Exhibit 10.11.1 to West Marine’s Annual Report on Form 10-K for the year ended December 29, 2001). | |
| 10.5.2 | Second Amendment, dated as of April 18, 2000, to the Lease Agreement for the Rock Hill, South Carolina distribution facility and other agreements thereto (incorporated by reference to Exhibit 10.11.2 to West Marine’s Quarterly Report on Form 10-K for the year ended December 29, 2001). | |
| 10.5.3 | Third Amendment, dated as of July 26, 2004, to the Lease Agreement for the Rock Hill, South Carolina distribution facility (incorporated by reference to Exhibit 10.1 to West Marine’s Current Report on Form 8-K dated October 4, 2004 and filed with the Commission on October 8, 2004). | |
| 10.6 | Lease Agreement, dated as of June 26, 1997, by and between Watsonville Freeholders and West Marine Products Inc., for the Watsonville, California offices and other agreements thereto (incorporated by reference to Exhibit 10.14 to West Marine’s Quarterly Report on Form 10-Q for the quarter ended June 28, 1997). | |
| 10.6.1 | First Amendment of Lease, dated as of July 27, 2005, to the Lease Agreement for the Watsonville, California offices (incorporated by reference to Exhibit 10.14 to West Marine, Inc.’s Current Report on Form 8-K dated July 27, 2005 and filed with the Commission on July 28, 2005). | |
| 10.6.2 | Second Amendment of Lease, dated as of December 22, 2005, to the Lease Agreement for the Watsonville, California offices (incorporated by reference to Exhibit 10.3 to West Marine, Inc.’s Current Report on Form 8-K dated December 22, 2005 and filed with the Commission on December 29, 2005). | |
| 10.6.3 | Third Amendment of Lease, dated as of November 30, 2006, to the Lease Agreement for the Watsonville, California offices (incorporated by reference to Exhibit 10.4 to West Marine, Inc.’s Current Report on Form 8-K dated July 29, 2009 and filed with the Commission on July 30, 2009). | |
| 10.6.4 | Fourth Amendment of Lease, dated as of July 29, 2009, to the Lease Agreement for the Watsonville, California offices (incorporated by reference to Exhibit 10.5 to West Marine, Inc.’s Current Report on Form 8-K dated July 29, 2009 and filed with the Commission on July 30, 2009). | |
| 10.7 | Loan and Security Agreement, dated as of December 29, 2005, among West Marine Products, Inc., each of the persons identified as borrowers on the signature pages thereof, each of the persons identified as guarantors on the signature pages thereof, the financial institutions from time to time party thereto as lenders, Wells Fargo Bank, National Association, as Issuing Lender, and Wells Fargo Retail Finance, LLC, as Agent for the lenders (incorporated by reference to Exhibit 10.1 to West Marine’s Current Report on Form 8-K dated December 29, 2005 and filed with the Commission on January 4, 2006). | |
64
Table of Contents
| Exhibit Number |
Exhibit | |
| 10.7.1 | Letter Agreement, dated as of December 13, 2006, by and between Wells Fargo Retail Finance, LLC, as Agent and a Lender, and West Marine Products, Inc. (incorporated by reference to Exhibit 10.9.1 to West Marine’s Annual Report on Form 10-K for the year ended December 30, 2006). | |
| 10.8 | Marketing Agreement, dated as of January 14, 2003, by and among Boat America Corporation, the Boat Owners Association of The United States and West Marine Products, Inc. (incorporated by reference to Exhibit 10.1 to West Marine’s Quarterly Report on Form 10-Q for the quarter ended October 2, 2004). | |
| 10.8.1 | Amendment, dated as of April 7, 2005, to Marketing Agreement, dated as of January 14, 2003, by and among Boat America Corporation, the Boat Owners Association of The United States and West Marine Products, Inc. (incorporated by reference to Exhibit 10.1.1 to West Marine’s Quarterly Report on Form 10-Q for the quarter ended April 2, 2005). | |
| 10.9* | Executive Employment Agreement, dated as of December 11, 2006, by and among West Marine, Inc., West Marine Products, Inc. and Thomas Moran (incorporated by reference to Exhibit 10.1 to West Marine’s Current Report on Form 8-K dated December 11, 2006 and filed with the Commission on December 12, 2006). | |
| 10.9.1* | First Amendment to Executive Employment Agreement, dated as of September 27, 2007, by and among West Marine, Inc., West Marine Products, Inc. and Thomas Moran (incorporated by reference to Exhibit 10.2 to West Marine’s Quarterly Report on Form 10-Q for the quarter ended September 29, 2007). | |
| 10.10* | Letter Agreement, dated as of December 10, 2007, by and between West Marine, Inc. and Geoffrey A. Eisenberg (incorporated by reference to Exhibit 10.1 to West Marine’s Current Report on Form 8-K dated December 10, 2007 and filed with the Commission on December 14, 2007). | |
| 10.10.1* | Confidentiality and Non-Solicitation Agreement, dated as of December 14, 2007, by and between West Marine, Inc. and Geoffrey A. Eisenberg (incorporated by reference to Exhibit 10.1 to West Marine’s Current Report on Form 8-K dated December 10, 2007 and filed with the Commission on December 14, 2007). | |
| 10.10.2* | First Amendment to Letter Agreement, dated as of November 7, 2008, by and between West Marine, Inc. and Geoffrey A. Eisenberg (incorporated by reference to Exhibit 10.1 to West Marine’s Current Report on Form 8-K dated November 7, 2008 and filed with the Commission on November 13, 2008). | |
| 10.11* | Executive Termination Compensation Agreement, dated as of September 9, 2004, by and between West Marine, Inc. and Bruce Edwards (incorporated by reference to Exhibit 10.15 of West Marine’s Annual Report on Form 10-K for the year ended December 31, 2005). | |
| 10.12* | Offer Letter, dated as of February 7, 2006, to Ronald Japinga from West Marine, Inc. (incorporated by reference to Exhibit 10.3 of West Marine’s Quarterly Report on Form 10-Q for the quarter ended June 30, 2007). | |
| 10.12.1* | Executive Termination Compensation Agreement, dated as of February 13, 2006, by and between West Marine, Inc. and Ronald Japinga. (incorporated by reference to Exhibit 10.4 of West Marine’s Quarterly Report on Form 10-Q for the quarter ended June 30, 2007). | |
| 21.1 | List of Subsidiaries. | |
| 23.1 | Consent of Grant Thornton LLP. | |
| 23.2 | Consent of Deloitte & Touche LLP | |
| 31.1 | Certification of Chief Executive Officer pursuant to Rule 13a-14(a) under the Securities Exchange Act of 1934, as amended. | |
65
Table of Contents
| Exhibit Number |
Exhibit | |
| 31.2 | Certification of Chief Financial Officer pursuant to Rule 13a-14(a) under the Securities Exchange Act of 1934, as amended. | |
| 32.1 | Certification of Chief Executive Officer and Chief Financial Officer pursuant to Rule 13a-14(b) under the Securities Exchange Act of 1934, as amended. | |
| * | Indicates a management contract or compensatory plan or arrangement within the meaning of Item 601(b)(10)(iii) of Regulation S-K. |
66
Table of Contents
SIGNATURES
Pursuant to the requirements of Section 13 or 15(d) of the Securities Exchange Act of 1934, the registrant has duly caused this report to be signed on its behalf by the undersigned, thereunto duly authorized.
| Date: March 17, 2010 |
WEST MARINE, INC. | |||||||
| By: | /s/ GEOFFREY A. EISENBERG | |||||||
| Geoffrey A. Eisenberg | ||||||||
| President and Chief Executive Officer | ||||||||
67
Table of Contents
Power of Attorney
West Marine, Inc. a Delaware corporation, and each person whose signature appears below, constitutes and appoints Geoffrey A. Eisenberg and Thomas R. Moran, and either of them, with full power to act without the other, such person’s true and lawful attorneys-in-fact, with full power of substitution and resubstitution, for him and in his name, place and stead, in any and all capacities, to sign this annual report on Form 10-K and any and all amendments to such annual report on Form 10-K and other documents in connection therewith, and to file the same, and all exhibits thereto and other documents in connection therewith, with the Securities and Exchange Commission, granting unto said attorneys-in-fact, and each of them, full power and authority to do and perform each and every act and thing necessary or desirable to be done in and about the premises, as fully to all intents and purposes as he might or could do in person, thereby ratifying and confirming all that said attorneys-in-fact, or any of them, or their or his substitute or substitutes, may lawfully do or cause to be done by virtue hereof.
Pursuant to the requirements of the Securities Exchange Act of 1934, as amended, this report has been signed below by the following persons on behalf of West Marine, Inc. and in the capacities and on the dates indicated.
| Signature Capacity |
| /s/ GEOFFREY A. EISENBERG |
| Geoffrey A. Eisenberg |
| President, Chief Executive Officer and Director (Principal Executive Officer) |
| March 17, 2010 |
| /s/ THOMAS R. MORAN |
| Thomas R. Moran |
| Senior Vice President and Chief Financial Officer (Principal Financial Officer and Principal Accounting Officer) |
| March 17, 2010 |
| /s/ RANDOLPH K. REPASS |
| Randolph K. Repass |
| Chairman of the Board and Director |
| March 17, 2010 |
| /s/ DAVID MCCOMAS |
| David McComas |
| Director |
| March 17, 2010 |
| /s/ BARBARA RAMBO |
| Barbara Rambo |
| Director |
| March 17, 2010 |
| /s/ ALICE M. RICHTER |
| Alice M. Richter |
| Director |
| March 17, 2010 |
68
Table of Contents
| /s/ PETER ROY |
| Peter Roy |
| Director |
| March 17, 2010 |
| /s/ DANIEL J. SWEENEY |
| Daniel J. Sweeney |
| Director |
| March 17, 2010 |
| /s/ WILLIAM U. WESTERFIELD |
| William U. Westerfield |
| Director |
| March 17, 2010 |
69