Attached files
| file | filename |
|---|---|
| 8-K - FORM 8-K - VALERO ENERGY CORP/TX | d255886d8k.htm |
 Investor Presentation January 2017 Exhibit 99.01 |
 2 Safe Harbor Statement Statements contained in this presentation that state the company’s or management’s expectations or predictions of the future are forward–looking statements intended to be covered by the safe harbor provisions of the Securities Act of 1933 and the Securities Exchange Act of 1934. The words “believe,” “expect,” “should,” “estimates,” “intend,” and other similar expressions identify forward–looking statements. It is important to note that actual results could differ materially from those projected in such forward– looking statements. For more information concerning factors that could cause actual results to differ from those expressed or forecasted, see Valero’s annual reports on Form 10-K and quarterly reports on Form 10-Q, filed with the Securities and Exchange Commission, and available on Valero’s website at www.valero.com. |
 3 Who We Are World’s Largest Independent Refiner • 15 refineries, 3 million barrels per day (BPD) of high-complexity capacity Greater than 70% of capacity located in U.S. advantaged Gulf Coast and Mid-Continent
• Fuels marketed and distributed through bulk and wholesale channels • General partner and majority owner of Valero Energy Partners LP (NYSE: VLP), a fee-based master limited partnership (MLP) • Significant inventory of midstream assets within Valero that could be dropped into VLP • Operator and 50% owner of Diamond Green Diesel joint venture 11,000 BPD renewable diesel production capacity • Approximately 10,000 employees One of North America’s Largest Ethanol Producers • 11 plants with 1.4 billion gallons per year (85,000 BPD) ethanol production capacity • All convert corn into ethanol and distillers grains • Plants were acquired at a fraction of replacement cost |
 4 Strong Presence in Advantaged U.S. Gulf Coast and Mid-Continent Refineries and ethanol plants are in advantaged locations See slide 23 for capacities. |
 5 Current Macro Environment Abundant global supply of crude oil and natural gas Forecasted world GDP growth Product shortages in Latin America, Europe, Africa, and Eastern Canada Demand response to lower product prices SUPPLY DEMAND North American logistics build out added efficiency and removed Mid-Continent bottlenecks 2 See slide 20 for notes regarding this slide and slides 28 – 31 for supply and demand details. Expect ample supply to keep prices low, which should continue driving increased petroleum demand.
1 3 4 5 |
 Maintain manufacturing
excellence and grow
commercial and operational flexibility Our Strategy for Value Creation Operate safely and reliably and demonstrate environmental responsibility Demonstrate disciplined capital management and deliver peer leading returns 6 |
 Safety
and Reliability are Imperative for Profitability
See slide 20 for notes regarding this slide.
Mechanical Availability
Personnel Index Maintenance Index Non-Energy Cash Opex Energy Intensity Index VLO’s Performance Versus Industry Benchmarks 2008 2010 2012 2014 4 Quartile 1 Quartile 3 Quartile 2 Quartile nd st th rd 1.60 0.60 Personnel Safety Employees Contractors Industry 0.19 0.08 Tier 1 Process Safety |
 8 Advantaged Location in U.S. Gulf Coast 1,444 1,084 743 189 0 0 VLO MPC PSX PBF TSO HFC U.S Gulf Coast CDU Capacity (MBPD) See slide 20 for notes regarding this slide. Capacities from company 10-K reports as
of December 31, 2015.
Includes 90 MBPD of new capacity from the Houston crude unit, which was
commissioned in June 2016.
Does not include announced WNR acquisition, which is expected to close in 1H17.
Over 55% of our throughput capacity is
located in U.S. Gulf Coast
• Access to low cost natural gas and abundant North American and foreign crudes • Access to deep pool of skilled labor • Pipeline capacity additions have increased crude optionality and resulted in improved pricing • Proximity to growing product export markets in Mexico and Latin America • Competitive refined products supplier to Eastern Canada and Northwest Europe • High weighted average regional Nelson Complexity Index • Flexibility to process wide range of crudes and feedstocks (1) (2) (1) (2) |
 $5.30 $3.60 $4.50 $3 $6 Refining Peers 2016 Refining Cash Operating Expenses Per Barrel of Throughput (Excludes Turnaround and D&A) Peer Range VLO Median High Complexity Refineries and Lowest Cost Operator 22% 17% 16% 12% 4% 34% 34% 34% 23% 10% Feedstock Ranges in U.S. Gulf Coast (2012 – 3Q16) See slide 20 for notes regarding this slide. Refining cash operating expenses for nine months ended September 30, 2016.
|
 10 Distillate Gasoline 69 118 246 324 164 253 447 541 2011 2012 2013 2014 2015 2016 Current Capacity Potential Future Capacity VLO’s U.S. Product Exports (MBPD) Gasoline Diesel See slide 20 for notes regarding this slide. (1) Actual export volumes; 2016 volumes through September 30. (1) Our Portfolio Facilitates Optimization of Product Exports 10 (1) |
 Capital Allocation Maintain Strong Balance Sheet Debt-to-cap ratio based on total debt reduced by $2 billion of cash. Peer group includes PSX, MPC, TSO, HFC, and PBF. Payout ratio is the sum of dividends and stock buybacks divided by net income from continuing
operations excluding special items.
Sustaining Capex • Approximately $1.5 billion annually • Key to safe and reliable operations Dividend • Commitment to shareholders • Targeting a dividend payout at the high end of our peer group (2) Growth Capex • 25% IRR hurdle rate for refining projects • Lower hurdle rate for steady cash flow midstream projects Cash Returns • Targeting at least 75% payout ratio of adjusted net income for 2017 • Stock buyback program consists of ratable and opportunistic purchases Acquisitions • Evaluate versus alternative uses of cash • Maintain investment grade credit rating • Target 20% to 30% debt-to-cap ratio (1) 1 2 3 11 (1) (2) (3) (3) |
 12 Demonstrated Discipline in Capital Allocation Sustaining $1.5 Sustaining $1.5 Growth $1.0 Growth $0.7 Dividend $0.8 Dividend $1.1 Buybacks $2.8 Buybacks $1.3 2015 2016E Capital Allocation ($ billion) • Steady investments in maintaining asset base and enhancing margin capability of portfolio.
• Targeting at least 75% payout ratio of adjusted net income for 2017. $1.6 Growth $1.1 2017 Capex Budget (1) ($ billion) (1) Approximately $200 MM growth capex carried forward for Diamond Pipeline from 2016 to 2017. Sustaining (1) (1) |
 13 Growth Investments • Diamond Pipeline completion expected in 4Q17 • 13 MPBD Houston alkylation unit expected to startup in 1H19 Incremental octane would relieve tightness created by Tier 3 gasoline regulations • 6 MBPD production capacity expansion of Diamond Green Diesel plant Project approved in 4Q16; completion expected in 1H18 Renewable diesel margins expected to be supported by increased usage mandates and carbon pricing • Projects under development: Octane enhancement in U.S. Gulf Coast Cogeneration in West Coast and North Atlantic Feedstock and product flexibility in U.S. Gulf Coast and North Atlantic Texas City Refinery |
 14 Delivered Peer Leading Total Stockholder Return Since December 31, 2014 See slide 20 for notes regarding this slide. Total stockholder return (TSR) from Dec 31, 2014, through Dec 30, 2016.
• Since end of 2014, current leadership team has delivered consistent outperformance.
• VLO had second highest TSR in peer group for 2016. VLO +48% Peer average +21% Peer minimum -6% -40% 65% Peer Range VLO Total Stockholder Return |
 15 • Grow VLP primarily through drop downs from VLO • Target organic growth opportunities and midstream deals strategic to VLO’s core business or that provide third party revenue • Grow annual distributions at target rates of 25% through 2017 and at least 20% for 2018 • Maintain investment grade credit rating Strategy See slides 34 – 38 for VLP non-GAAP disclosures. * This is the minimum quarterly distribution (MQD). The actual distribution was smaller as it was prorated for the period of December 16 – 31. As of September 30, 2016. • 81% increase in quarterly cash distribution over MQD • Grew annualized EBITDA attributable to Partnership by more than 2,500% to $265 million (1) • 4.25 million common unit follow-on equity offering completed in Nov 2015 • ATM program established in Sep 2016 • Completed $500 million debt offering in Dec 2016 Accomplishments since IPO Distribution per LP Unit Distributable Cash Flow (millions) 15 (1) Our Sponsored MLP Valero Energy Partners LP (NYSE:VLP) |
 Approximately $1 Billion of Estimated
MLP Eligible EBITDA (2) Inventory Racks, Terminals, and Storage (1) • Over 70 million barrels of active shell capacity for crude oil and products • 139 truck rack bays Rail • Approximately 5,250 purchased railcars, expected to serve long-term needs of ethanol, asphalt, aromatics, and other products Pipelines (1) • Over 1,200 miles of active pipelines • 440-mile Diamond Pipeline from Cushing to Memphis expected to start up in 4Q17 Marine • 51 docks • Two Panamax class vessels (joint venture) Wholesale Fuels Marketing • Approximately 800 MBPD fuels distribution volume 16 (1) Includes assets that have other joint venture or minority interests. Estimate as of September 30, 2016. We are unable to provide a reconciliation of the above forward-looking estimate of non-GAAP EBITDA because certain information needed to make a reasonable forward-looking estimate is difficult to estimate and dependent on future events which may be uncertain or outside of our control, including with respect to unknown financing terms, acquisition timing, unanticipated acquisition costs, negotiation of acquisition terms, and other potential variables. Accordingly, a reconciliation is not available without unreasonable effort. (1) (2) |
 Ethanol Business Operations • 11 ethanol plants with 1.4 billion gallons annual production capacity – Dry mill production process, where corn is ground into flour and mixed with water before fermentation – Low capital investment with scale, located in corn belt – Operational best practices transferred from refining Outlook • Ethanol demand expected to be strong globally • Driven by increasing usage mandates, low absolute finished gasoline prices, increased vehicle miles traveled, and attractive economics for corn-based ethanol exports Ethanol plant in Aurora, South Dakota 17 |
 $5.10 $1.20 $5.10 $3.10 1 5 EBITDA Per Barrel of Throughput (Nine-mos ended Sep 30, 2016) We Believe Valero is an Excellent Investment Payout ratio is the sum of dividends and stock buybacks divided by net income from continuing operations excluding special items. We Believe VLO is Undervalued • Disciplined management team • Strong financial position • Favorable macro environment • Proven operations excellence – Reliability drives profitability • Delivering industry-leading returns – Disciplined investing to drive earnings growth – Unlocking value through growth in MLP-eligible assets and dropdowns to VLP – Delivered peer leading payout ratio (1) and total stockholder return since December 31, 2014 9% -3% 9% 6% -5% 11% Return on Invested Capital (12-mos ended Sep 30, 2016) 3.6 0.6 0.6 1.6 0 4 Net Debt-to-EBITDA (12-mos ended Sep 30, 2016) Peer Range VLO Median 4.3% 2.5% 3.5% 3.2% 2% 5% Dividend Yield (Dec 30, 2016) 18 (1) Chart data sources: Company reports and Bloomberg as of Dec 30, 2016. See slides 20 and 39 – 40 for notes and VLO non-GAAP disclosures, respectively. |
 19 Appendix Contents Topic Pages Notes 20 Guidance 21 Cumulative Cash Returns 22 Refining Operating Statistics 23 – 24 Natural Gas Cost Sensitivity 25 Crude Oil Transportation 26 – 27 Fundamentals 28 – 31 Valero Energy Partners LP 32 – 33 Non-GAAP Disclosures 34 – 40 Investor Relations Contacts 41 |
 20 Notes Slide 5 Macro environment themes represent industry consultant views. Slide 7 Contractor total recordable incident rate from U.S. Bureau of Labor Statistics. Tier 1 process safety event defined within API
Recommended Practice 754. Industry benchmarking and Valero’s
performance statistics from Solomon Associates and Valero. Slide
8 Crude distillation capacities from company 10-K filings and reports
by geographic location. Slide 9
Valero’s U.S. Gulf Coast feedstock ranges are based upon quarterly processing
rates between 2012 and 3Q16. Refining
cash operating expenses per barrel of throughput, excluding D&A, from company reports. Peer group includes PSX, MPC, TSO, HFC, and PBF. Slide 10 Valero’s potential future gasoline and distillate export capacities are based upon expansion opportunities identified at the St. Charles (gasoline and distillate), Port Arthur (gasoline and distillate), and Texas City (distillate) refineries.
Slide 12 Peer group includes PSX, MPC, TSO, HFC, and PBF. TSR for time period includes stock price appreciation and dividends paid.
Slide 18 Peer groups for return on invested capital, EBITDA per barrel of throughput, net debt-to-EBITDA, and dividend yield consist of PSX, MPC,
TSO, HFC, and PBF. Net debt-to-EBITDA chart excludes HFC
due to TTM net loss after tax. |
 Guidance 4Q16 (anticipated) • Throughput (MBPD) – Gulf Coast 1,580 to 1,630 – Mid-Continent 420 to 440 – North Atlantic 450 to 470 – West Coast 270 to 290 • Refining operating expenses per barrel throughput $3.75 • Ethanol – Production (millions of gallons per day) 3.95 – Operating expenses per gallon of production $0.38 • Cash opex $0.33 • Non-cash opex $0.05 – General and administrative expenses $200 MM – Net interest expense $150 MM – Depreciation and amortization expense $465 MM – Effective tax rate 31% 2016 (anticipated) – RINs expense ($MM) $750 to $850 – Capital expenditures ($MM) $2,400 • Sustaining $1,500 • Growth $900 Port Arthur Refinery |
 Delivering Cash Returns to
Stockholders is One of Our Priorities
2016 dividends and buybacks through December 30.
(1) Nine months ended Sep 30, 2016. WASO from company 10-K and 10-Q filings.
(2) WASO for MPC adjusted for stock split which occurred in 2013. Share count as of 12 months ended Dec 31, 2011, and nine months ended Sep 30,
2016. $10.5 billion
Reduced share count by 103 million shares, or 18%, and increased quarterly dividend by
300% since 2011. 111%
74% 82% 90% 70% 105% WASO (2) at 9/30/2016 Relative to 12/31/2011 467 million shares 22 Cumulative Capital Returned and Weighted Average Shares Outstanding as Percentage Relative to 2011 570 million shares 98% 96% 93% 88% [VALUE] (1) Dividends Buybacks WASO 2011 2012 2013 2014 2015 2016 Peer Range VLO Average |
 23 Our Refining Capacity and Nelson Complexity Refinery Capacities (MBPD) (1) Nelson Complexity Index Throughput Crude Corpus Christi (2) 370 275 15.1 Houston 175 90 15.4 Meraux 135 125 9.7 Port Arthur 375 335 12.7 St. Charles 305 215 16.1 Texas City 260 225 11.1 Three Rivers 100 89 13.2 U.S. Gulf Coast 1,720 1,354 13.4 (3) Ardmore 90 86 12.1 McKee 200 195 8.3 Memphis 195 180 7.9 U.S. Mid-Continent 485 461 8.9 (3) Pembroke 270 210 10.1 Quebec City 235 230 7.7 North Atlantic 505 440 8.8 (3) Benicia 170 145 16.1 Wilmington 135 85 15.8 U.S. West Coast 305 230 16.0 Total 3,015 2,485 12.0 (3) Capacities and Nelson complexity indices as of January 1, 2016. Represents the combined capacities of two refineries—Corpus Christi East and Corpus Christi West. 45 MBPD increase in throughput
compared to 2014 is related to the 70 MBPD crude unit commissioned in
December 2015, net of 25 MBPD of displaced FCC feedstock purchases.
Weighted average. (3) (1) (2) (3) |
 Reliability Initiatives Have Improved Refinery
Availability and Enabled Higher Utilization
86% 82% 88% 87% 92% 95% 96% 95% 96% 94% 95% Solomon availability Valero Refinery Availability and Utilization Rates 24 |
 25 $2.55/mmBtu U.S. $0.82/bbl $4.73/mmBtu Europe $1.53/bbl Natural Gas Cost Sensitivity for Valero’s Refineries U.S. Natural Gas Provides Opex and Feedstock Cost Advantages Natural gas prices year for 2016 through December 30 for U.S. and Europe. Estimated per barrel cost of 904,000 mmBtu/day of natural gas
consumption at 93% refinery throughput capacity utilization, or 2.8
MMBPD. $719 MM
pre-tax annual cost advantage • Our refining operations consume approximately 904,000 mmBtu/day of natural gas, of which
57% is operating expense and balance is cost of goods sold
• Significant annual pre-tax cost savings compared to refiners in Europe • Prices expected to remain low and disconnected from global oil and gas markets |
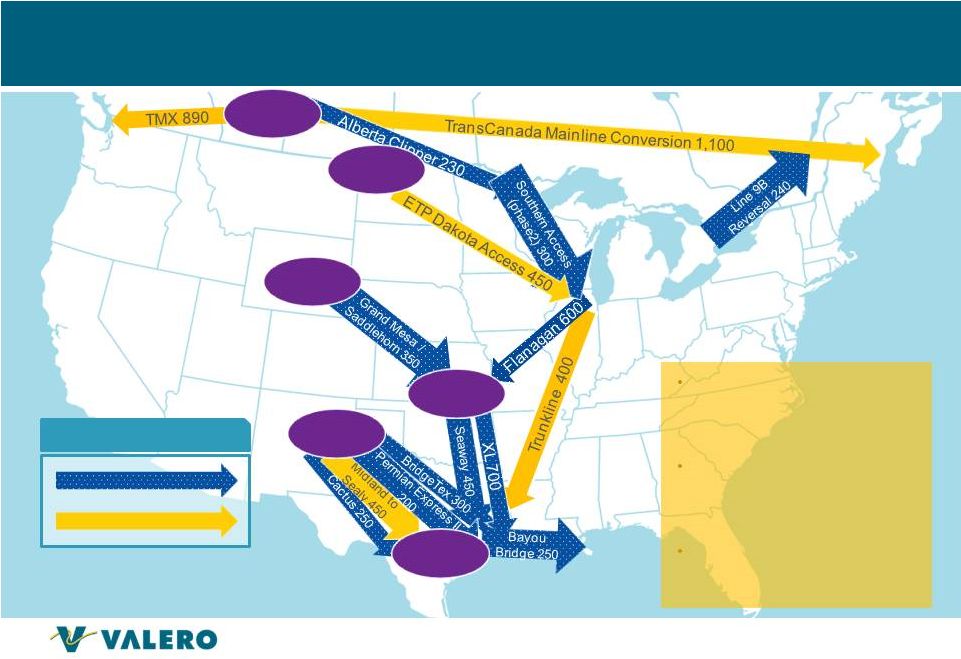 Pipeline Takeaway Capacity Additions Have
Increased Crude Competition in the U.S. Gulf Coast
Niobrara KEY Completed 2017 or Later Startup Capacities in MBPD. Pipeline completion and startup dates are subject to change. Bayou Bridge Phase 1 operational with Phase 2 completion expected in 2017. Cushing Alberta Permian • Pipeline capacity additions increased market liquidity and crude competition in U.S. Gulf Coast • Discounts for inland crudes versus WTI and Brent have narrowed with falling production and excess logistics capacity • Spot space on some pipelines are trading inside of published tariffs Eagle Ford Bakken 26 |
 Investing to Improve Access to North American Crude
Diamond Pipeline • 440 miles of 20-inch pipe (200 MBPD capacity) connecting Memphis to Cushing
• Received permits required to begin construction; project is on track for completion in 4Q17
• Provides supply flexibility and ability to improve crude blend quality • Approximately $925 MM total project cost Exercised option in Dec 2015 to acquire 50% interest; over $200 MM spent through Sep 30, 2016
Expect to receive cash proceeds if 50% interest is dropped to VLP and 12% pre-tax
IRR for VLP 27 |
 Ample
Supply Provides Resource Advantage to North American Refiners
58.4 72.9 U.S. Natural Gas Production (Bcf/day) Source: DOE, 2016 data through September. 9,213 7,889 5,476 8,897 U.S. Crude Oil Production and Imports (MBPD) 28 Imports Production |
 -0.8 -0.4 0.0 0.4 0.8 1.2 1.6 2.0 2013 2014 2015 2016E-2020E Avg MMBPD Source: Consultant and Valero estimates. Net Global Refinery CDU Additions = New Capacity + Restarts – Announced Closures. (Does not include Condensate Splitters.) Global Petroleum Demand Growth Expected to Outpace Refinery Capacity Expansion 29 Europe China Middle East Other Net CDU Capacity Additions World Petroleum Demand Growth |
 30 0 100 200 300 400 500 600 700 800 900 2005 2006 2007 2008 2009 2010 2011 2012 2013 2014 2015 2016 Other Europe Other Latin America Mexico Canada 12 Month Moving Average (MBPD) Gasoline represents all finished gasoline plus all blendstocks (including ethanol, MTBE, and other oxygenates)
Source: DOE Petroleum Supply Monthly data through September 2016. U.S. Gasoline Exports |
 31 Source: DOE Petroleum Supply Monthly data through September 2016. U.S. Diesel Exports 0 200 400 600 800 1000 1200 1400 2005 2006 2007 2008 2009 2010 2011 2012 2013 2014 2015 2016 Other Europe Other Latin America Mexico Canada 12 Month Moving Average (MBPD) |
 Diversified VLP Portfolio
(2) Integrated with VLO’s Refining Assets Texas Crude Systems McKee, Three Rivers, Wynnewood July 1, 2014 - $154 mm (1) Houston and St. Charles Terminals March 1, 2015 - $671 mm (1) Corpus Christi Terminals October 1, 2015 - $465 mm (1) IPO assets Drop downs McKee Terminal April 1, 2016 - $240 mm (1) 1 2 3 4 Meraux and Three Rivers Terminals September 1, 2016 - $325 mm (1) 5 Total consideration value. Portfolio assets as of Jan 1, 2017. 32 (1) (2) |
 33 VLP’s Competitive Strengths Strong Sponsor • Strategic relationship with investment grade sponsor VLO Quality Assets • High quality, well maintained assets integrated with VLO’s refineries and located in advantaged regions Stable and Predictable Revenues • Fee-based agreements with no direct exposure to commodity price risks • Contracts with 10 year initial terms and five year renewal terms • About 85% of revenues supported by minimum volume commitments Strong Balance Sheet • Financial flexibility to fund growth in distribution and distributable cash flow with 2.0x coverage and 3.1x debt/EBITDA ratio (1) • Maintain investment grade credit rating Long Runway for Growth • Drop downs from sponsor • Organic growth and midstream deals that support VLO’s core business or that provide third party revenue Top Tier Distribution Growth • Annual distribution growth targets of 25% through 2017 and at least 20% for 2018 Coverage and debt/EBITDA ratios as of nine months ended September 30, 2016. Debt/EBITDA ratio calculated in accordance with debt covenants. See slides 34 – 38 for VLP non-GAAP disclosures. (1) |
 34 VLP Non-GAAP Disclosures: EBITDA, Distributable Cash Flow, Distribution Coverage, and Debt-to-EBITDA VLP defines EBITDA as net income before income tax expense, interest expense, and depreciation expense. VLP defines
distributable cash flow as EBITDA less (i) EBITDA attributable to its Predecessor and
cash payments during the period for interest, income taxes, and
maintenance capital expenditures; plus (ii) adjustments related to minimum throughput commitments, capital projects prefunded by Valero, and certain other items. VLP defines coverage ratio as the ratio of
distributable cash flow to the total distribution declared.
EBITDA, distributable cash flow, and coverage ratio are supplemental financial measures
that are not defined under GAAP. They may be used by management and
external users of our financial statements, such as industry analysts, investors, lenders, and rating agencies, to: • describe VLP’s expectation of forecasted earnings; • assess VLP’s operating performance as compared to other publicly traded limited partnerships in the transportation and
logistics industry, without regard to historical cost basis or, in the case of EBITDA,
financing methods; •
assess the ability of VLP’s business to generate sufficient cash to support its
decision to make distributions to its unitholders; •
assess VLP’s ability to incur and service debt and fund capital expenditures;
and •
assess the viability of acquisitions and other capital expenditure projects and the
returns on investment of various investment opportunities.
VLP believes that the presentation of EBITDA provides useful information to investors
in assessing its financial condition and results of operations. The GAAP
measures most directly comparable to EBITDA are net income and net cash provided by operating activities. EBITDA should not be considered an alternative to net income or net cash provided by operating activities
presented in accordance with GAAP. EBITDA has important limitations as an analytical
tool because it excludes some, but not all, items that affect net income
or net cash provided by operating activities. EBITDA should not be considered in isolation or as a substitute for analysis of our results as reported under GAAP. Additionally, because EBITDA may be defined differently by
other companies in our industry, VLP’s definition of EBITDA may not be comparable
to similarly titled measures of other companies, thereby diminishing its
utility. |
 35 VLP Non-GAAP Disclosures: EBITDA, Distributable Cash Flow, Distribution Coverage, and Debt-to-EBITDA VLP uses distributable cash flow to measure whether it has generated from its operations, or “earned,” an amount of
cash sufficient to support the payment of the minimum quarterly distributions.
VLP’s partnership agreement contains the concept of “operating
surplus” to determine whether VLP’s operations are generating sufficient cash to support the distributions that it is paying, as opposed to returning capital to VLP’s partners. Because operating surplus is a
cumulative concept (measured from VLP’s IPO date and compared to cumulative
distributions from the IPO date), VLP uses the term distributable cash
flow to approximate operating surplus on a quarterly or annual, rather than a cumulative, basis. As a result, distributable cash flow is not necessarily indicative of the actual cash VLP has on hand to
distribute or that it is required to distribute.
VLP uses the distribution coverage ratio to reflect the relationship between its
distributable cash flow and the total distribution declared.
The debt-to-EBITDA ratio as defined in accordance with VLP’s
debt covenants is the total debt and capital lease obligations divided by
adjusted pro forma EBITDA for the trailing 12 month period. VLP believes that the presentation of net debt-to-EBITDA provides useful information to investors to assess its ability to incur and service debt.
|
 36 VLP Non-GAAP Disclosures: EBITDA, Distributable Cash Flow, and Distribution Coverage VALERO ENERGY PARTNERS LP RECONCILIATION OF NON-GAAP MEASURES TO MOST COMPARABLE AMOUNTS REPORTED UNDER U.S. GAAP
(Unaudited, in Thousands, Except Ratio Amount) Reconciliation of net income to EBITDA and distributable cash flow: Nine Months Ended September 30, 2016 Net income $ 129,032 Plus: Depreciation expense 34,652 Plus: Interest and debt expense, net of capitalized interest 9,582 Plus: Income tax expense 780 EBITDA 174,046 Less: EBITDA attributable to Predecessor (11,492) EBITDA attributable to Partnership 185,538 Plus: Adjustments related to minimum throughput commitments 1,100 Less: Cash interest paid 8,688 Less: Income taxes paid 496 Less: Maintenance capital expenditures 5,759 Distributable cash flow $ 171,695 Total distribution declared $ 86,695 Distribution coverage ratio: Distributable cash flow divided by total distribution declared 2.0x |
 37 VLP Non-GAAP Disclosures: Debt-to-EBITDA VALERO ENERGY PARTNERS LP RECONCILIATION OF NON-GAAP MEASURES TO MOST COMPARABLE AMOUNTS REPORTED UNDER U.S. GAAP
(Unaudited, in Thousands, Except Ratio Amount) September 30, 2016 Numerator: Total debt and capital lease obligations $ 894,057 Nine Months Ended September 30, 2015 Year Ended December 31, 2015 Nine Months Ended September 30, 2016 Denominator: Net income $ 34,517 $ 71,312 $ 129,032 Plus: Depreciation expense 34,702 45,678 34,652 Plus: Interest and debt expense, net of capitalized interest 3,365 6,113 9,582 Plus: Income tax expense (benefit) (62) 251 780 EBITDA 72,522 123,354 174,046 Less: EBITDA attributable to Predecessor (41,605) (47,652) (11,492) EBITDA attributable to Partnership $ 114,127 $ 171,006 $ 185,538 12 Months Ended September 30, 2016 EBITDA attributable to Partnership for 12 months ended Sep 30, 2016: Sum of EBITDA for nine months ended Sep 30, 2016 and year ended December 31, 2015 less EBITDA for nine months ended Sep 30, 2015 $ 242,417 Pro forma EBITDA adjustments: Plus: Apr 1, 2015 – McKee Terminal Services ($28,300 x 6/12 months) 14,150 Plus: Sep 1, 2015 – Meraux and Three Rivers Terminal Services ($38,600 x 11/12 months) 35,383 Adjusted pro forma EBITDA $ 291,950 Debt-to-EBITDA ratio ($894,057/ $291,950): 3.1 |
 38 1Q2014 2Q2014 3Q2014 4Q2014 1Q2015 2Q2015 3Q2015 4Q2015 1Q2016 2Q2016 3Q2016 Net income $4,520 $6,157 $5,658 ($2,907) $6,936 $23,504 $15,625 $44,667 $43,298 $49,447 $48,707 Plus: Depreciation expense 5,916 6,132 7,178 8,583 8,310 9,904 13,760 9,151 9,388 10,622 11,319 Plus: Interest and debt expense, net of capitalized interest 228 221 214 209 601 1,411 1,353 2,748 2,659 3,251 3,672 Plus: Income tax expense 157 150 129 112 (126) (51) 115 313 242 303 235 EBITDA 10,821 12,660 13,179 5,997 15,721 34,768 30,853 56,879 55,587 63,623 63,933 Less: EBITDA attributable to Predecessor (3,037) (2,905) (9,025) (17,744) (12,089) (7,969) (12,727) — — — (2,395) EBITDA attributable to Partnership 13,858 15,565 22,204 23,741 27,810 42,737 43,580 56,879 55,587 63,623 66,328 Plus: Adjustments related to minimum throughput commitments 32 475 (235) (164) (20) 24 — 18 14 221 865 Plus: Projects prefunded by Valero 775 853 418 865 589 — — — — — — Plus: Other — — — — 384 — — — — — — Less: Cash interest paid 236 229 221 213 172 1,406 1,374 2,415 2,502 2,982 3,204 Less: Income taxes paid — 9 — — — 441 — — — 496 — Less: Maintenance capital expenditures 864 1,005 1,035 1,623 1,139 863 326 1,621 2,002 1,518 2,239 Distributable cash flow $13,565 $15,650 $21,131 $22,606 $27,452 $40,051 $41,880 $52,861 $51,097 $58,848 $61,750 VLP Non-GAAP Disclosures: Quarterly EBITDA and Distributable Cash Flow VALERO ENERGY PARTNERS LP RECONCILIATION OF NON-GAAP MEASURES TO MOST COMPARABLE AMOUNTS REPORTED UNDER U.S. GAAP
(Unaudited, in Thousands) |
 39 VLO Non-GAAP Disclosures: Return on Invested Capital VALERO ENERGY CORPORATION RECONCILIATION OF NON-GAAP MEASURES TO MOST COMPARABLE AMOUNTS REPORTED UNDER U.S. GAAP
(Unaudited, in Millions, Except Percentage and Ratio Amounts) Nine Months Ended September 30, 2015 Year Ended December 31, 2015 Nine Months Ended September 30, 2016 Numerator: Operating income $ 5,712 $ 6,358 $ 2,952 Effective tax rate 31.6% 31.3% 24.6% Operating income after tax $ 3,905 $ 4,367 $ 2,227 TTM operating income after tax $2,689 = $2,227 + $4,367 – $3,905 Nine Months Ended September 30, 2015 Nine Months Ended September 30, 2016 Denominator: Current portion of debt and capital lease obligations $ 129 $ 1,064 Debt and capital lease obligations, less current portion 7,252 7,888 Total equity 21,868 21,130 Total invested capital $ 29,249 $ 30,082 TTM total invested capital $29,666 = ($29,249 + $30,082) / 2 TTM return on invested capital 9.1% = $2,689 / $29,666 VLO defines return on invested capital (ROIC) as operating income after tax divided by the total invested capital. VLO defines total invested capital as the sum of total debt and total equity. VLO defines operating income after tax for the trailing 12 month (TTM) period as the sum of operating income after tax for 2015 and the nine months ended Sep 30, 2016, less that for the nine months ended Sep 30, 2015. VLO defines TTM total invested capital as the average of the total invested capital for the current nine month period ended Sep 30, 2016, and the same period one year ago (2015). VLO believes that the presentation of ROIC provides useful information to investors for assessing how efficiently it uses its capital and its ability to generate returns from invested capital. |
 40 VLO Non-GAAP Disclosures: EBITDA and Net Debt-to-EBITDA VALERO ENERGY CORPORATION RECONCILIATION OF NET INCOME TO EBITDA (Unaudited, in Millions, Except Ratio Amount) Nine Months Ended September 30, 2015 Year Ended December 31, 2015 Nine Months Ended September 30, 2016 Net income $ 3,706 $ 4,101 $ 2,001 Less: Deferred turnaround and catalyst costs 509 673 474 Plus: Depreciation and amortization expense 1,348 1,842 1,426 Plus: Interest and debt expense, net of capitalized interest 326 433 334 Plus: Income tax expense 1,715 1,870 652 EBITDA $ 6,586 $ 7,573 $ 3,939 TTM EBITDA $4,926 = $3,939 + $7,573 – $6,586 Nine Months Ended September 30, 2016 Debt and capital lease obligations, less current portion $ 7,888 Current portion of debt and capital lease obligations 1,064 Cash and temporary cash investments (5,949) Total debt net of cash $ 3,003 TTM net debt-to-EBITDA 0.61 = $3,003 / $4,926 VLO defines net debt-to-EBITDA ratio as total debt net of cash divided by EBITDA adjusted for turnaround and catalyst costs. VLO
defines EBITDA for the trailing 12 month period (TTM) as the sum of
EBITDA for 2015 and the nine months ended Sep 30, 2016, less that
for the nine months ended Sep 30, 2015. VLO believes that the
presentation of net debt-to-EBITDA provides useful information to
investors to assess its ability to incur and service debt. |
 41 Investor Relations Contacts For more information, please contact: John Locke Vice President, Investor Relations 210.345.3077 john.locke@valero.com Karen Ngo Sr. Manager, Investor Relations 210.345.4574 karen.ngo@valero.com |