Attached files
| file | filename |
|---|---|
| 8-K - 8-K - Delek US Holdings, Inc. | dk-8kxinvestorpresentation.htm |

January 2017
Delek US Holdings Inc.
Investor Presentation

Disclaimers
2
Delek US Holdings, Inc. (“Delek US”) and Delek Logistics Partners, LP (defined as “we”, “our”) are traded on the New York Stock Exchange in the
United States under the symbols “DK” and ”DKL” respectively, and, as such, are governed by the rules and regulations of the United States
Securities and Exchange Commission. These slides and any accompanying oral and written presentations contain forward-looking statements that
are based upon our current expectations and involve a number of risks and uncertainties. Statements concerning current estimates, expectations
and projections about our future results, performance, prospects and opportunities and other statements, concerns, or matters that are not
historical facts are “forward-looking statements,” as that term is defined under United States securities laws.
Investors are cautioned that the following important factors, among others, may affect these forward-looking statements. These factors include
but are not limited to: risks and uncertainties with respect to the quantities and costs of crude oil we are able to obtain and the price of the refined
petroleum products we ultimately sell; gains and losses from derivative instruments; management's ability to execute its strategy of growth
through acquisitions and the transactional risks associated with acquisitions and dispositions; acquired assets may suffer a diminishment in fair
value as a result of which we may need to record a write-down or impairment in carrying value of the asset; the effect on our financial results by
the financial results of Alon USA Energy, Inc., in which we hold a significant equity investment; uncertainty regarding the outcome of our proposal
to acquire the remaining outstanding stock of Alon USA; changes in the scope, costs, and/or timing of capital and maintenance projects; operating
hazards inherent in transporting, storing and processing crude oil and intermediate and finished petroleum products; our competitive position and
the effects of competition; the projected growth of the industries in which we operate; general economic and business conditions affecting the
southeastern United States; and other risks contained in our filings with the United States Securities and Exchange Commission.
Forward-looking statements should not be read as a guarantee of future performance or results and will not be accurate indications of the times
at, or by which such performance or results will be achieved. Forward-looking information is based on information available at the time and/or
management’s good faith belief with respect to future events, and is subject to risks and uncertainties that could cause actual performance or
results to differ materially from those expressed in the statements. Neither Delek US nor Delek Logistics Partners undertakes any obligation to
update or revise any such forward-looking statements.
Non-GAAP Disclosures:
Delek US and Delek Logistics each believe that the presentation of EBITDA, distributable cash flow and distribution coverage ratio provide useful
information to investors in assessing its financial condition, its results of operations and cash flow its business is generating. EBITDA, distributable
cash flow and distribution coverage ratio should not be considered as alternatives to net income, operating income, cash from operations or any
other measure of financial performance or liquidity presented in accordance with U.S. GAAP. EBITDA, distributable cash flow and distribution
coverage ratio have important limitations as an analytical tool because it excludes some, but not all items that affect net income. Additionally,
because EBITDA, distributable cash flow and distribution coverage ratio may be defined differently by other companies in its industry, Delek US'
and Delek Logistics’ definitions may not be comparable to similarly titled measures of other companies, thereby diminishing its utility. Please see
reconciliations of EBITDA and distributable cash flow to their most directly comparable financial measures calculated and presented in accordance
with U.S. GAAP in the appendix.

REFINING
Delek US Holdings Overview
3
Crude Sourcing/Logistics Flexibility
• Pipeline Access:
Midland (105,000 bpd in
system)
Gulf Coast and Cushing
• Gathered Barrels:
Local barrels in Arkansas/
North Louisiana
East and West Texas
• Rail Capability at El Dorado
Up to 45,000 BPD of light
crude(1); Ability to offload
heavy Canadian crude
Synergies Created through integration:
Logistics assets support
operations and create growth
options
Refinery locations allow
ability to optimize the system
155,000 BPD in total
El Dorado, AR
80,000 BPD
10.2 complexity
Tyler, TX
75,000 BPD
8.7 complexity
9 Terminals
Approx. 1,250 miles of pipelines
8.5 million bbls storage capacity
LOGISTICS (2)
Strategic crude oil supply point
that allows our refining system
access to domestic inland and
Gulf Coast feedstocks
LONGVIEW CRUDE OIL HUB
Mid-Continent Downstream Energy Company
Own approx. 47% of outstanding shares of
Alon (NYSE: ALJ):
Refining - 217,000 bpd capacity
Retail - approx. 307 stores in the southwest
US
Asphalt- 11 terminals in the southwest US
Alon Investment (3)
(1) Rail supplied light crude capability consists of 25,000 bpd of light crude or 12,000 bpd heavy crude offloading that is available at a facility owned by Delek Logistics adjacent to the El
Dorado refinery. In addition, 20,000 bpd light crude capability is currently available via a third party facility adjacent to the El Dorado refinery.
(2) Delek Logistics Partners, LP (NYSE:DKL) began operating on Nov. 7, 2012 and, from that date, 100% of its performance has been reported as a segment of Delek US. Delek US and its
affiliates own approximately 62%, including the 2.0% general partner interest, of DKL. Storage and pipeline amounts are based on total DKL assets.
(3) Please see page 7 for additional information. Approximately 70,000 bpd of refining capacity is not currently operating.
Delek US Investment Highlights
4
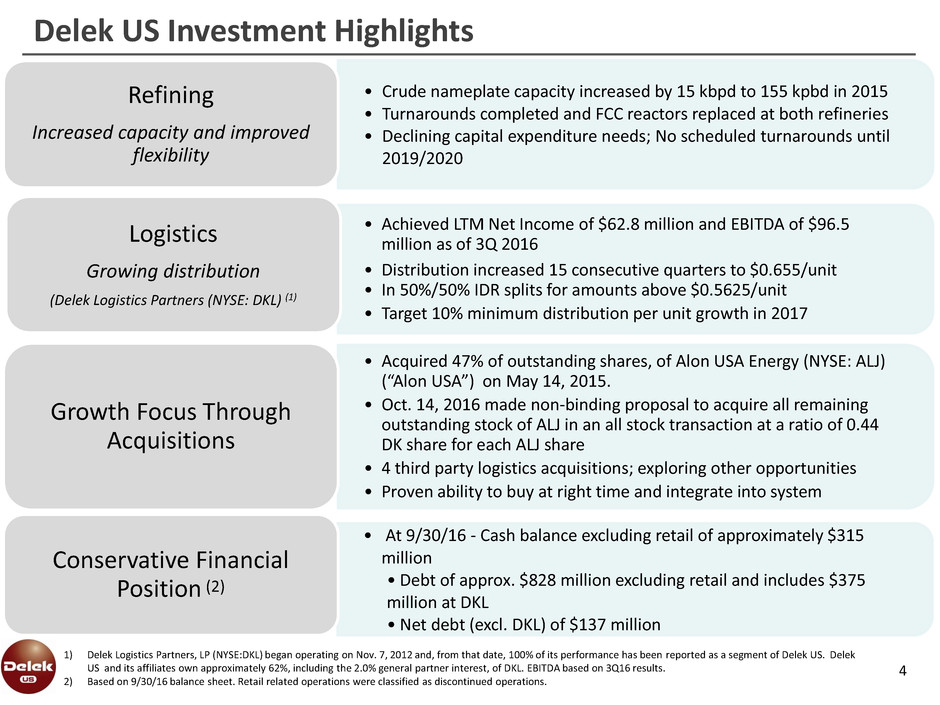
• Crude nameplate capacity increased by 15 kbpd to 155 kpbd in 2015
• Turnarounds completed and FCC reactors replaced at both refineries
• Declining capital expenditure needs; No scheduled turnarounds until
2019/2020
Refining
Increased capacity and improved
flexibility
• Achieved LTM Net Income of $62.8 million and EBITDA of $96.5
million as of 3Q 2016
• Distribution increased 15 consecutive quarters to $0.655/unit
• In 50%/50% IDR splits for amounts above $0.5625/unit
• Target 10% minimum distribution per unit growth in 2017
Logistics
Growing distribution
(Delek Logistics Partners (NYSE: DKL) (1)
• At 9/30/16 - Cash balance excluding retail of approximately $315
million
• Debt of approx. $828 million excluding retail and includes $375
million at DKL
• Net debt (excl. DKL) of $137 million
Conservative Financial
Position (2)
• Acquired 47% of outstanding shares, of Alon USA Energy (NYSE: ALJ)
(“Alon USA”) on May 14, 2015.
• Oct. 14, 2016 made non-binding proposal to acquire all remaining
outstanding stock of ALJ in an all stock transaction at a ratio of 0.44
DK share for each ALJ share
• 4 third party logistics acquisitions; exploring other opportunities
• Proven ability to buy at right time and integrate into system
Growth Focus Through
Acquisitions
1) Delek Logistics Partners, LP (NYSE:DKL) began operating on Nov. 7, 2012 and, from that date, 100% of its performance has been reported as a segment of Delek US. Delek
US and its affiliates own approximately 62%, including the 2.0% general partner interest, of DKL. EBITDA based on 3Q16 results.
2) Based on 9/30/16 balance sheet. Retail related operations were classified as discontinued operations.

2016 Initiatives to Create Value and Improve Financial Flexibility
5
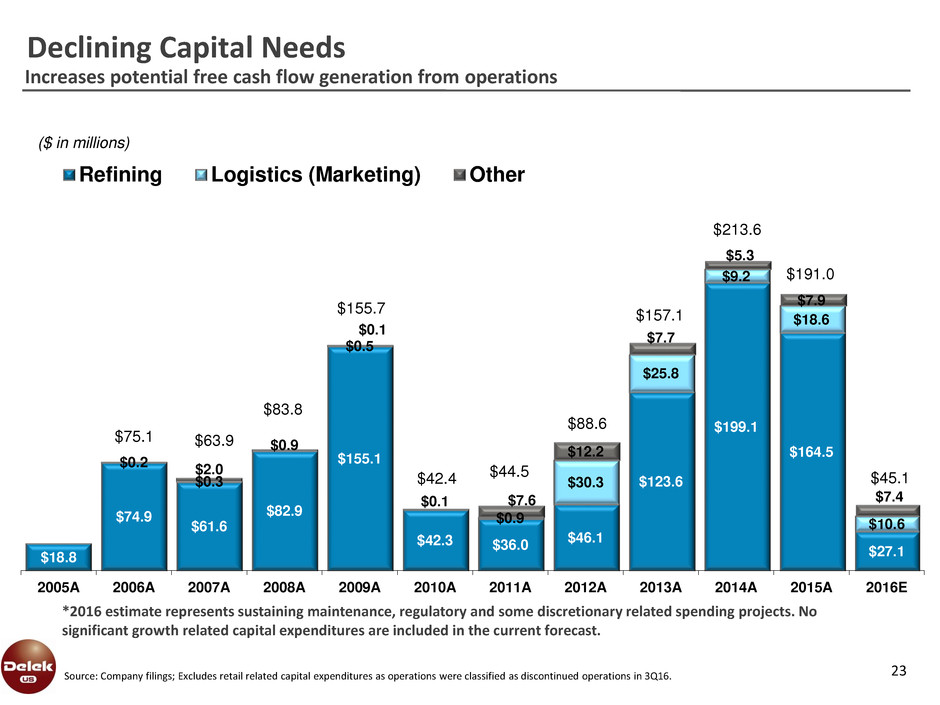
• Total capital expenditure expected to be $45.1 million in 2016
• Reduced from $191.0 million in 2015 and $213.6 million in 2014
• Completed large investment program in refining in 2015
• No scheduled turnarounds until 2019/2020
Reduced Capital
Expenditures
• Experienced a $13.1 million year-over-year decline in operating expense
and overhead in 3Q16; partially due to cost reduction initiatives
• Initiatives focused on cost controls and procurement savings
• Cost management benefited from operating reliability
Focused on Cost
Management
• Reliability consistent with 1st quartile performance in recent Solomon
study (1)
• Benefitting from past capital projects completed in turnarounds
• Reliability Asset Management system used in refining system
• Reduces downtime in the operating units and operating expense
Improving Reliability in
Refining
• On Nov. 14, 2016 closed $535 million transaction
• Repaid retail related debt of $156 million and other fees at closing
• Net cash proceeds before tax of approximately $377 million
• Equates to approximately 12.7x EBITDA multiple (2)
• Compares to other retail transaction in a 11.1x EBITDA multiple range (3)
Unlocked Value of Retail
Assets
• Target improvement in capture rate at refineries
• Efforts focused on reducing RINs exposure
• Optimize crude slate in refining system
Commercial Initiatives
Underway
1) As measured by operational availability
2) Based on midpoint of previous EBITDA guidance range of $40 million to $45 million from the retail assets.
3) Please see page 6 for more information.
Retail Transaction Summary
MAPCO Sale Transaction
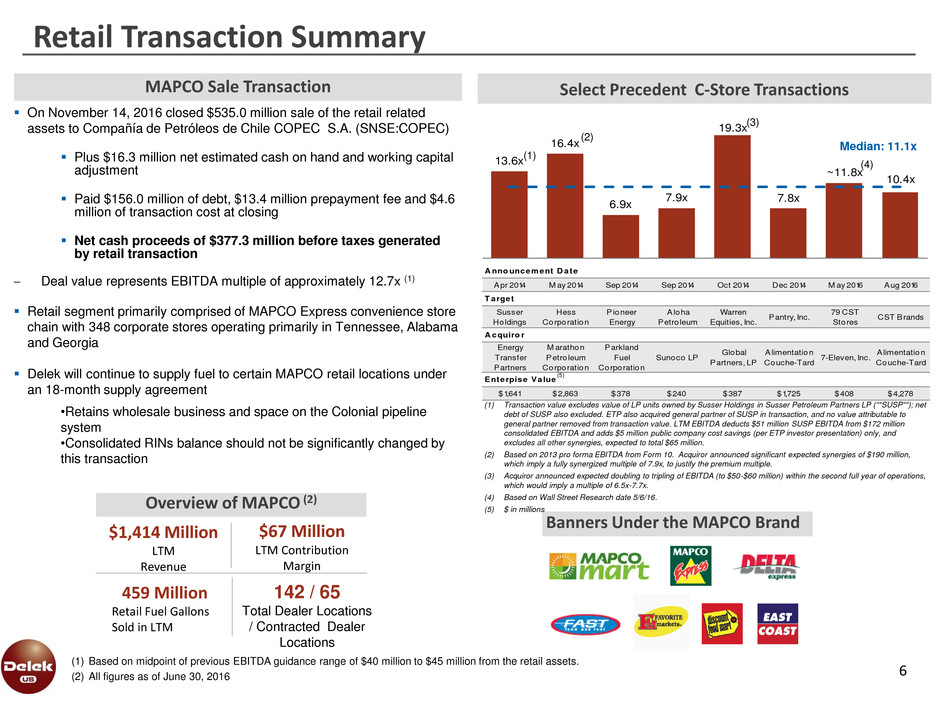
On November 14, 2016 closed $535.0 million sale of the retail related
assets to Compañía de Petróleos de Chile COPEC S.A. (SNSE:COPEC)
Plus $16.3 million net estimated cash on hand and working capital
adjustment
Paid $156.0 million of debt, $13.4 million prepayment fee and $4.6
million of transaction cost at closing
Net cash proceeds of $377.3 million before taxes generated
by retail transaction
Deal value represents EBITDA multiple of approximately 12.7x (1)
Retail segment primarily comprised of MAPCO Express convenience store
chain with 348 corporate stores operating primarily in Tennessee, Alabama
and Georgia
Delek will continue to supply fuel to certain MAPCO retail locations under
an 18-month supply agreement
•Retains wholesale business and space on the Colonial pipeline
system
•Consolidated RINs balance should not be significantly changed by
this transaction
Select Precedent C-Store Transactions
(1) Based on midpoint of previous EBITDA guidance range of $40 million to $45 million from the retail assets.
(2) All figures as of June 30, 2016
Banners Under the MAPCO Brand
Overview of MAPCO (2)
$1,414 Million
LTM
Revenue
142 / 65
Total Dealer Locations
/ Contracted Dealer
Locations
459 Million
Retail Fuel Gallons
Sold in LTM
$67 Million
LTM Contribution
Margin
(1) Transaction value excludes value of LP units owned by Susser Holdings in Susser Petroleum Partners LP (""SUSP""); net
debt of SUSP also excluded. ETP also acquired general partner of SUSP in transaction, and no value attributable to
general partner removed from transaction value. LTM EBITDA deducts $51 million SUSP EBITDA from $172 million
consolidated EBITDA and adds $5 million public company cost savings (per ETP investor presentation) only, and
excludes all other synergies, expected to total $65 million.
(2) Based on 2013 pro forma EBITDA from Form 10. Acquiror announced significant expected synergies of $190 million,
which imply a fully synergized multiple of 7.9x, to justify the premium multiple.
(3) Acquiror announced expected doubling to tripling of EBITDA (to $50-$60 million) within the second full year of operations,
which would imply a multiple of 6.5x-7.7x.
(4) Based on Wall Street Research date 5/6/16.
(5) $ in millions
A nno uncement D ate
Apr 2014 M ay 2014 Sep 2014 Sep 2014 Oct 2014 Dec 2014 M ay 2016 Aug 2016
T arget
Susser
Holdings
Hess
Corporation
Pioneer
Energy
Aloha
Petro leum
Warren
Equities, Inc.
Pantry, Inc.
79 CST
Stores
CST Brands
A cquiro r
Energy
Transfer
Partners
M arathon
Petro leum
Corporation
Parkland
Fuel
Corporation
Sunoco LP
Global
Partners, LP
Alimentation
Couche-Tard
7-Eleven, Inc.
Alimentation
Couche-Tard
Enterpise Value
$1,641 $2,863 $378 $240 $387 $1,725 $408 $4,278
13.6x
16.4x
6.9x
7.9x
19.3x
7.8x
~11.8x
10.4x
Median: 11.1x
(1)
(2)
(3)
(4)
6
(5)
7
0 122 176
146 208 80
0 176 80
255 192 0
0 128 0
127 211 141
158 211 215
185 58 7
127 127 127
Alon USA Investment
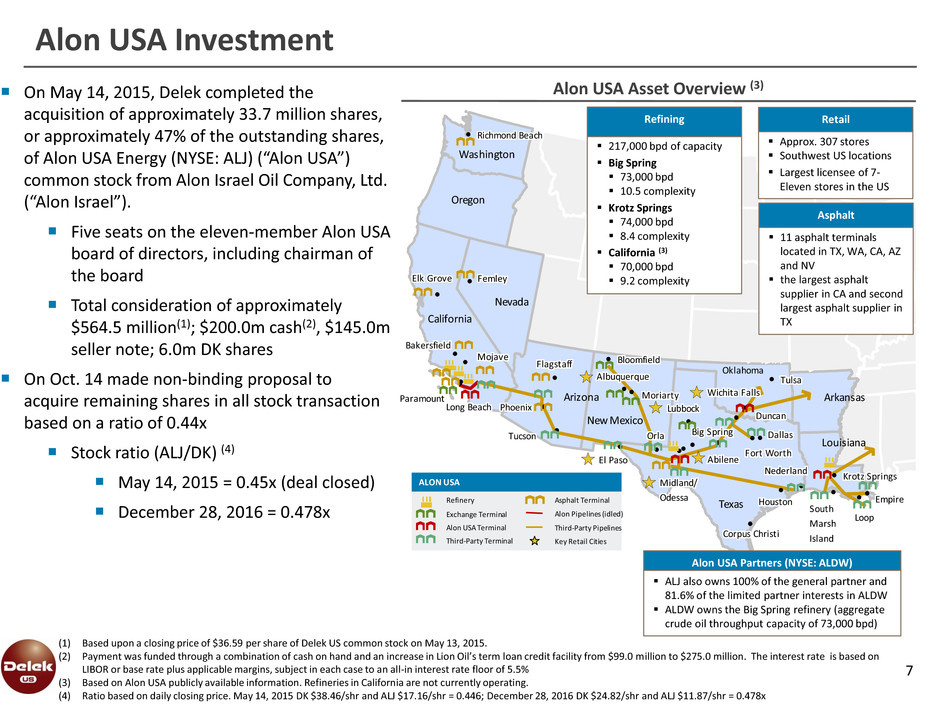
On May 14, 2015, Delek completed the
acquisition of approximately 33.7 million shares,
or approximately 47% of the outstanding shares,
of Alon USA Energy (NYSE: ALJ) (“Alon USA”)
common stock from Alon Israel Oil Company, Ltd.
(“Alon Israel”).
Five seats on the eleven-member Alon USA
board of directors, including chairman of
the board
Total consideration of approximately
$564.5 million(1); $200.0m cash(2), $145.0m
seller note; 6.0m DK shares
On Oct. 14 made non-binding proposal to
acquire remaining shares in all stock transaction
based on a ratio of 0.44x
Stock ratio (ALJ/DK) (4)
May 14, 2015 = 0.45x (deal closed)
December 28, 2016 = 0.478x
(1) Based upon a closing price of $36.59 per share of Delek US common stock on May 13, 2015.
(2) Payment was funded through a combination of cash on hand and an increase in Lion Oil’s term loan credit facility from $99.0 million to $275.0 million. The interest rate is based on
LIBOR or base rate plus applicable margins, subject in each case to an all-in interest rate floor of 5.5%
(3) Based on Alon USA publicly available information. Refineries in California are not currently operating.
(4) Ratio based on daily closing price. May 14, 2015 DK $38.46/shr and ALJ $17.16/shr = 0.446; December 28, 2016 DK $24.82/shr and ALJ $11.87/shr = 0.478x
Key Retail Cities
Asphalt Terminal
Third-Party Terminal
Alon USA Terminal
Exchange Terminal
Refinery
Third-Party Pipelines
ALON USA
Alon Pipelines (idled)
Oklahoma
638167_1.wor [NY0086JT]
Texas
California
New Mexico
Arizona
Nevada
Oregon
Washington
Arkansas
Louisiana
Midland/i l /aidl ndi li li li la /i l /ai ld ndd ndi li li l
Odessassde assassadedeO
Corpus Christi i ir s r stpu hCo C i i i i i i i ir r tr r ts is i i is s i iCo pu Chpu hCo Cr ri ti i ir r t i i
Abileneilb eneA ilililililililAb eneb eneA ilililEl Pasol sE Pal ol l l l asl sal E P oE P ol l l
Bakersfieldfi lrsake e dB fi li li li lr fr fak s i li lsak i lB e e de e dB r fi lfi lr fi l
Mojavejaveojjjavavoj ej eoj
Long Beach L g eacon B h L g ac L g ac on Be heon B h PhoenixiPh en xo iiiiixixiPhoenPh eno iii
TucsonsTuc nocsscTu onTu no
Paramountr tPa a unor tr ta aa aP ounP unor tr t
SouthtS u ho ttSSou hu ho tt
Marshrsa hrrssa ha hrr
IslandI ls andI llllIIsllslandandI lI lI l
Nederlandlrede andllllrrlalalede ndede ndN rllrl
Houstonstu nHo ottssou onu no oH ttH
LoopL pooLLooppoo
Orlalr allllrrlalalOrllrl
Moriartyir rta yo iiiir rtr rti yi yio aaori rtir rti
LubbockLubb ckoL ckL ckubboubbo
Big Springi irg Sp ngBi ii ii ii irrig S i gi ig S gi iB p np nBi rii iri i
Wichita Fallsi i llt sc a Fai hi lli i lli i lli i llttic i a Fallsi i llsc a Fai i llhhi it li i lti i l
Fort Worth rt rtF ho o rt rtrt rtF F o o hho ort rt rt rt
Dallasll sa aD llllllllallasll sa allD llD l
DuncancaDun ncacaun nun nDD
Albuquerquel re eAlbuqu qulll rrlllA buque quee eA buqu qul rl rl
EmpireirE p eiiiirriiiE p eE p eiriri
Flagstaffl ffstF ag al fflll t fft ffFlags al sF ag all t fl ftl f
Elk Grovel rE k vel ol l l rrlk vl k vl E o eE eol Grl rl FemleylFe eyllllF l ylF yle ee elll
Richmond Beachi ch nd eachRi o Bi i i ic aci c aci R h ond Be hh nd e hR o Bi i i
Krotz Springs ir tz r sK Sp ngo i i i ir t rr t rz S i gs iz sS g iK o p nK p nor t ri ir t r i
Bloomfieldl fi leBloo fi ldl i ll i ll i lffl i ll i ll i lB oo e deB oo dl fi ll fi ll fi l
TulsalsT aulllllsalsalTuTulll
217,000 bpd of capacity
Big Spring
73,000 bpd
10.5 complexity
Krotz Springs
74,000 bpd
8.4 complexity
California (3)
70,000 bpd
9.2 complexity
Refining
Approx. 307 stores
Southwest US locations
Largest licensee of 7-
Eleven stores in the US
Retail
11 asphalt terminals
located in TX, WA, CA, AZ
and NV
the largest asphalt
supplier in CA and second
largest asphalt supplier in
TX
Asphalt
ALJ also owns 100% of the general partner and
81.6% of the limited partner interests in ALDW
ALDW owns the Big Spring refinery (aggregate
crude oil throughput capacity of 73,000 bpd)
Alon USA Partners (NYSE: ALDW)
Alon USA Asset Overview (3)

Limited Value Attributed to Delek US Refining Assets in Current Environment
8
Creates attractive capital allocation opportunity
Current
DK
market
cap,
$1,536
Investments
primarily make
up current
market cap
Results in limited value
given to refining assets in
current valuation
• 155,000 bpd of crude
capacity inland refining
system
• Invested $584 million capital
expenditures 2011 to 9/30/16
$386
$602
$348
$465
$193
$98
$349
$0
$200
$400
$600
$800
2011 2012 2013 2014 2015 3QYTD
16
Refining Contribution Margin
Contribution Margin Average
Notes:
• Share prices based on December 28, 2016 and shares outstanding, debt and cash balances as of September 30, 2016.
• DK based on $24.82/share price, ALJ based on 47% ownership and $11.87/share price; DKL based on 60% ownership and $28.00/unit
• GP Distribution range of $12.0m to $20.0m based on estimated amount if Delek Logistics (NYSE: DKL) meets its target of 15% annual growth in limited partner distributions in 2016 and
10% in 2017 based on DKL 3Q16 earnings release. Actual amounts paid in the future based on DKL performance and partnership agreement. Multiple range of 15x to 17x used to calculate
valuation.
• Net cash based on $137.4m net debt at 9/30/16, excluding DKL debt of $375.0m , less $377.3m of net cash proceeds before tax from retail transaction. Estimated taxes to be paid in 1Q17.
($ in millions)
($ in millions)
Market cap
based

Refining Segment
SEGMENT UPDATE

Initiatives Underway to Improve Asset Performance
10
Focus on factors under our control
•Next turnarounds in
2019 and 2020
•No large capital
projects scheduled
•Primarily maintenance
focused capital spend
•Procurement
strategies
•Manage overhead and
operating expenses
•Expand local footprint
•Minimize RINs
exposure
•Balance
production/demand
•Optimize Crude slate
•Safety
• Improve yields
•Maximize high value
products
•Reliability/Utilization
focused
Asset
Optimization Commercial
Capital
Spending
Costs
Control

54% 55% 54% 53% 55%
39% 39% 40% 41% 38%
7% 6% 6% 7% 7%
0%
20%
40%
60%
80%
100%
120%
2013 2014 2015 3Q15 3Q16
Gasoline Diesel Petro/Other
62,304 65,523 60,704 70,802 78,758
Tyler Refinery Overview
11
Overview
Niche market generally priced above Gulf Coast;
supported by Delek Logistics' terminals
Crude slate consists of approx. 65 kbpd Midland
sourced crude; plus east Texas and Cushing crudes
Completed schedule turnaround in March 2015;
FCC reactor replaced; next scheduled turnaround
2020
15 kbpd crude processing expansion completed in
March 2015
Achieved 75 kbpd crude throughput rate
Product yield in line with pre-expansion level
Focus on balancing expanded production level
with refining margin to maximize capture rate
75,000 bpd niche refinery serving Tyler, Texas and surrounding area
Total Production, bpd
$4.63 $4.41 $4.52
$3.81 $3.56
2013 2014 2015 3Q15 3Q16
Operating Expense Per Barrel Sold
Note: Delek US capture rate is defined as refining gross margin per barrel divided by WTI Gulf Coast 5-3-2 crack spread.

80,000 bpd refinery with crude slate flexibility to process light and medium gravity crudes
El Dorado Refinery Overview
12 1) COPEC is a wholly owned subsidiary of Compania de Petroleos de Chile COPEC S.A, which owns and operates convenience stores in Chile, Columbia, Panama, Ecuador, Peru and
Mexico. On Nov. 14, 2016 Delek US closed the transaction to sell its retail related business to COPEC.
Overview
Inland PADD III refinery located in Southern
Arkansas
Flexible crude sourcing
Access to Gulf Cost crudes beginning
in August 2016
Midland, local Arkansas, east Texas
Rail offloading capability
Mid Valley and Exxon North crude oil
pipeline access
Ability to support a portion of retail fuel
needs on direct/indirect basis through 18
month supply agreement with COPEC (1)
Improved flexibility and throughput in 1Q 2014
turnaround; next scheduled turnaround 2019
Pre-flash tower project improved light
crude processing capability to
approximately 80,000 bpd
Replaced FCC reactor with state of the art
technology
49% 50% 52% 51% 52%
38% 39% 37% 36% 37%
11% 9% 8% 8% 8%
3% 2% 3% 4% 3%
0
0
0
1
1
1
1
2013 2014 2015 3Q15 3Q16
Gasoline Diesel Asphalt Petro/Other
71,642 71,286 77,806 74,689 74,946
Total Production, bpd
$4.06 $3.94 $3.97 $4.17 $3.73
2013 2014 2015 3Q15 3Q16
Operating Expense Per Barrel Sold
Increased crude throughput capacity and operating flexibility
Refining Capital Investment Program Improved Operations
13
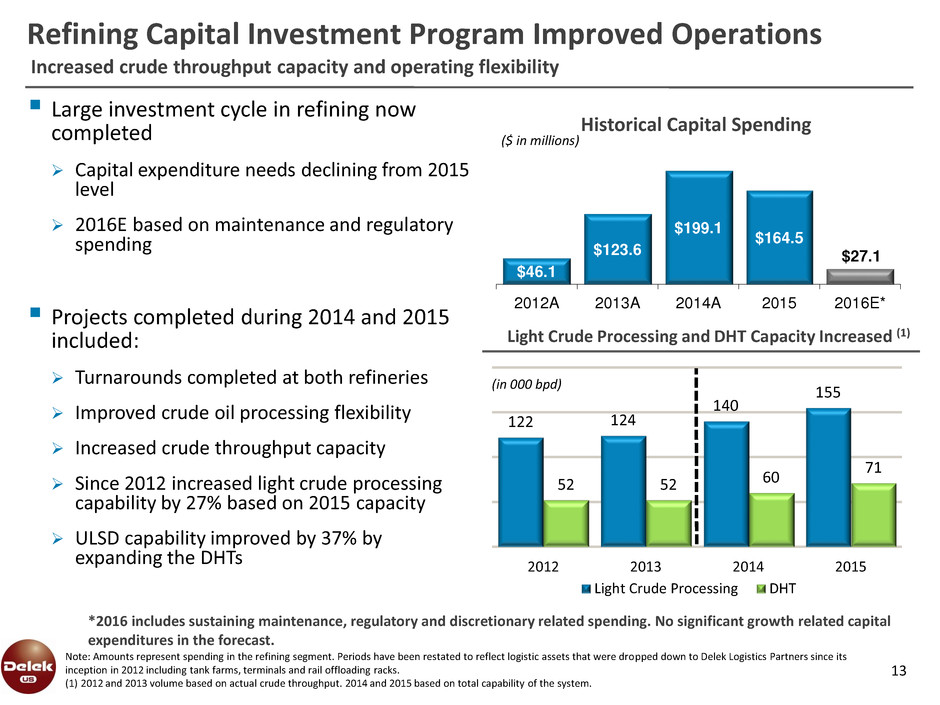
Large investment cycle in refining now
completed
Capital expenditure needs declining from 2015
level
2016E based on maintenance and regulatory
spending
Projects completed during 2014 and 2015
included:
Turnarounds completed at both refineries
Improved crude oil processing flexibility
Increased crude throughput capacity
Since 2012 increased light crude processing
capability by 27% based on 2015 capacity
ULSD capability improved by 37% by
expanding the DHTs
$46.1
$123.6
$199.1
$164.5
$27.1
2012A 2013A 2014A 2015 2016E*
Historical Capital Spending
($ in millions)
Note: Amounts represent spending in the refining segment. Periods have been restated to reflect logistic assets that were dropped down to Delek Logistics Partners since its
inception in 2012 including tank farms, terminals and rail offloading racks.
(1) 2012 and 2013 volume based on actual crude throughput. 2014 and 2015 based on total capability of the system.
122 124
140
155
52 52 60
71
2012 2013 2014 2015
Light Crude Processing DHT
(in 000 bpd)
Light Crude Processing and DHT Capacity Increased (1)
*2016 includes sustaining maintenance, regulatory and discretionary related spending. No significant growth related capital
expenditures in the forecast.

Further benefited by logistics segment that generates RINs
Refineries - Niche Markets/ Wholesale Business Limits RINs Exposure
14
$(0.00) $0.05 $0.02
$0.95
$0.63
$0.78
$0.45
-$0.20
$0.00
$0.20
$0.40
$0.60
$0.80
$1.00
$1.20
1Q1
5
2Q1
5
3Q1
5
4Q1
5
1Q1
6
2Q1
6
3Q1
6
S
p
er
r
ef
in
in
g
b
b
l sol
d
Delek Logistics Partners terminals support
refining system:
Tyler primarily serves a 100 mile radius
El Dorado has access to local markets, as
well as Little Rock and Memphis
Local market netbacks higher than Gulf Coast
basis
Colonial Pipeline space has increased access to
Southeastern market; ability to generate RINs
0
100
200
300
400
500
$0.00
$0.05
$0.10
$0.15
$0.20
$0.25
$0.30
$0.35
Ja
n
-1
3
Ap
r-1
3
Ju
l-
13
O
ct-1
3
Ja
n
-1
4
Ap
r-1
4
Ju
l-
14
O
ct-1
4
Ja
n
-1
5
Ap
r-1
5
Ju
l-
15
O
ct-1
5
Ja
n
-1
6
A
p
r-16
Ju
l-
16
O
ct-1
6
Col
o
n
ial
-
0
0
0
b
b
l p
er
m
o
n
th
$
/b
b
l D
if
f
N
YM
EX
less
G
C
NYMEX GC Diff Colonial Space, bbls per month
Delek US – Consolidated RINs per Refining bbl sold (2) Gasoline– NYMEX less Gulf Coast(1) / Colonial Space
Improving Niche Markets
1) Source for gasoline price differential is Platts with NYMEX RBOB and Gulf Coast CBOB average posted prices through December 28, 2016.
2) Combines RINs cost in the refining segment less RINs benefit from the logistics segment divided by barrels sold from refining to illustrate the net effect on a per barrel basis.

Approximately 80% of crude slate consists of Midland and local crude supply
Access to Midland and Local Crudes
15
45.0 45.0
87.0 105.0 107.0 17.2 17.9
18.6
17.2 16.0
0
50
100
150
200
2012 2013 2014 2015 2016E
In
0
0
0
b
p
d
Midland Local Crude Throughput Capacity
$(3.31)
$(2.71)
$(6.11)
$(1.43) $(1.67) $(1.61)
$(1.20) $(1.26)
$(0.84) $(0.92)
$(0.57)
$(0.60)
2012 2013 2014 2015 1Q16 2Q16 3Q16 Oct. Nov. Dec. Jan. Feb.
Improved access to cost advantaged crude
(Midland/local) in refining system
Midland recently trading near parity with Cushing
Long term outlook for Midland approximately $1-
$2/bbl under Cushing
Ability to access Gulf Coast crude for El Dorado
Refining margin competitive due to:
Cost advantaged crude supply
Serve niche markets
Target to reduce operating expenses per barrel
WTI Midland vs WTI Cushing, $/bbl (1)
Increasing Access to Midland and local crude
1) Differential includes contango of $0.40/bbl (2012); contango of $0.07/bbl (2013); backwardation of $0.77/bbl (2014); contango of $0.97/bbl (2015); $1.80 (1Q16).; $1.43
(2Q16); $0.88 (3Q16), $0.74 (Oct.); $0.63 (Nov.); $0.92 (Dec.); $1.30 (Jan.); $1.06 (Feb.) Source: Argus – as of December 28, 2016; NYMEX futures settle prices.
2) Crack spread based on WTI crude oil and Gulf Coast pricing, using HSD. Current crack spread based on November 11, 2016.
WTI Gulf Coast 5-3-2 Crack Spread(2)
Periods incl. backwardation/contango
$0
$5
$10
$15
$20
$25
Ju
l-
1
4
A
u
g-
1
4
Se
p
-1
4
O
ct
-1
4
N
o
v-
1
4
D
ec
-1
4
Ja
n
-1
5
Fe
b
-1
5
M
ar
-1
5
A
p
r-
1
5
M
ay
-1
5
Ju
n
-1
5
Ju
l-
1
5
A
u
g-
1
5
Se
p
-1
5
O
ct
-1
5
N
o
v-
1
5
D
ec
-1
5
Ja
n
-1
6
Fe
b
-1
6
M
ar
-1
6
A
p
r-
1
6
M
ay
-1
6
Ju
n
-1
6
Ju
l-
1
6
A
u
g-
1
6
Se
p
-1
6
O
ct
-1
6
N
o
v-
1
6
D
ec
-1
6
Cu
rr
en
t
$
p
er
b
b
l.
SEGMENT UPDATE
Logistics

Strategic Partner in Delek Logistics Partners, LP (NYSE: DKL)
17
Delek Logistics Partners , LP (NYSE:DKL) began operating on Nov. 7, 2012 and 100% of its performance is reported as a segment of Delek US beginning 4Q12. Delek US and its affiliates own
approximately 62%, including the 2.0% general partner interest, of DKL. Please see the public filings of DKL for additional information and risks associated with DKL.
Note: Storage and pipeline amounts based on the pipeline and transportation segment and wholesale marketing and terminalling segment.
1. Includes approximately 240 miles of leased pipeline capacity
~ 765 miles (1) of
crude/product
transportation
pipelines, includes
the 195 mile crude
oil pipeline from
Longview to
Nederland, TX
~ 600 mile crude oil
gathering system in
AR/North LA
Rail offloading facility
Pipelines Assets
Storage facilities
with 8.5 million
barrels of active
shell capacity
Storage Assets
Wholesale and
marketing business
in Texas
9 light product
terminals:
TX, TN,AR
Wholesale/
Terminal Assets
Growing logistics assets support crude sourcing and product marketing
DKL: Joint Venture Pipeline Projects
18
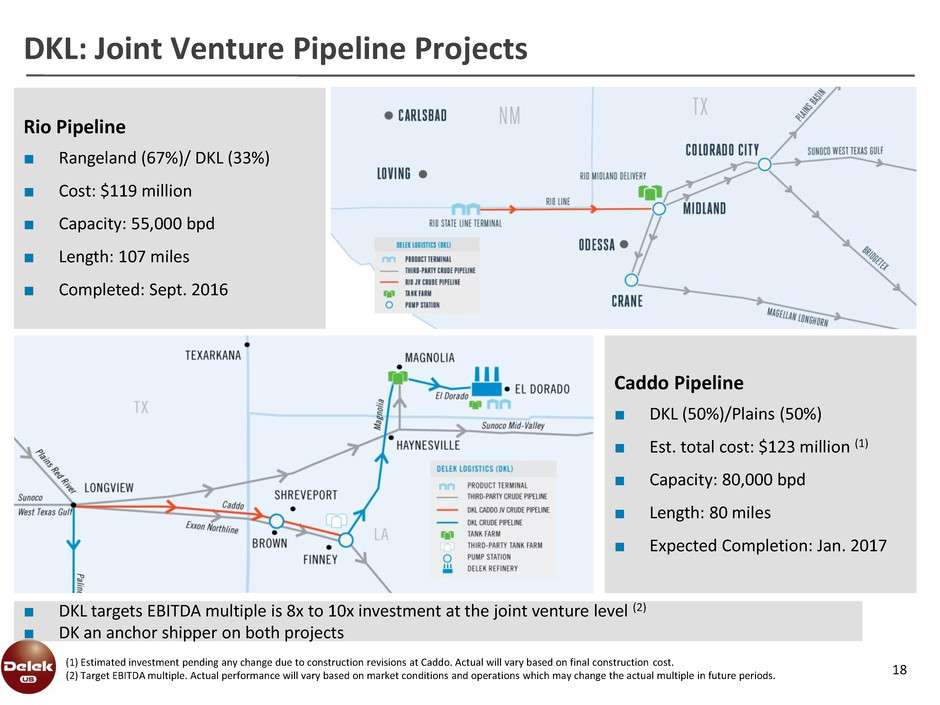
Caddo Pipeline
■ DKL (50%)/Plains (50%)
■ Est. total cost: $123 million (1)
■ Capacity: 80,000 bpd
■ Length: 80 miles
■ Expected Completion: Jan. 2017
Rio Pipeline
■ Rangeland (67%)/ DKL (33%)
■ Cost: $119 million
■ Capacity: 55,000 bpd
■ Length: 107 miles
■ Completed: Sept. 2016
(1) Estimated investment pending any change due to construction revisions at Caddo. Actual will vary based on final construction cost.
(2) Target EBITDA multiple. Actual performance will vary based on market conditions and operations which may change the actual multiple in future periods.
■ DKL targets EBITDA multiple is 8x to 10x investment at the joint venture level (2)
■ DK an anchor shipper on both projects
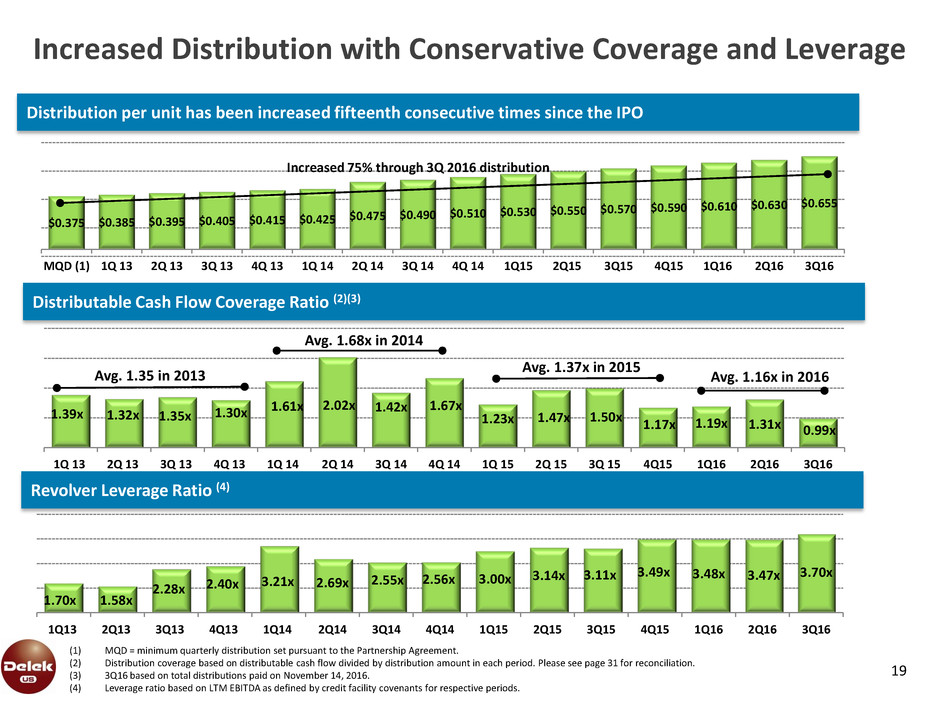
1.39x 1.32x 1.35x 1.30x
1.61x 2.02x 1.42x 1.67x
1.23x 1.47x 1.50x 1.17x 1.19x 1.31x 0.99x
1Q 13 2Q 13 3Q 13 4Q 13 1Q 14 2Q 14 3Q 14 4Q 14 1Q 15 2Q 15 3Q 15 4Q15 1Q16 2Q16 3Q16
Increased Distribution with Conservative Coverage and Leverage
19
Distribution per unit has been increased fifteenth consecutive times since the IPO
$0.375 $0.385 $0.395 $0.405 $0.415 $0.425
$0.475 $0.490 $0.510 $0.530 $0.550
$0.570 $0.590 $0.610 $0.630 $0.655
MQD (1) 1Q 13 2Q 13 3Q 13 4Q 13 1Q 14 2Q 14 3Q 14 4Q 14 1Q15 2Q15 3Q15 4Q15 1Q16 2Q16 3Q16
Increased 75% through 3Q 2016 distribution
Distributable Cash Flow Coverage Ratio (2)(3)
1.70x 1.58x
2.28x 2.40x
3.21x 2.69x 2.55x 2.56x 3.00x
3.14x 3.11x 3.49x 3.48x 3.47x 3.70x
1Q13 2Q13 3Q13 4Q13 1Q14 2Q14 3Q14 4Q14 1Q15 2Q15 3Q15 4Q15 1Q16 2Q16 3Q16
Revolver Leverage Ratio (4)
(1) MQD = minimum quarterly distribution set pursuant to the Partnership Agreement.
(2) Distribution coverage based on distributable cash flow divided by distribution amount in each period. Please see page 31 for reconciliation.
(3) 3Q16 based on total distributions paid on November 14, 2016.
(4) Leverage ratio based on LTM EBITDA as defined by credit facility covenants for respective periods.
Avg. 1.35 in 2013
Avg. 1.68x in 2014
Avg. 1.37x in 2015
Avg. 1.16x in 2016

20
Marginal Percentage Interest in Distributions
Assumed Distribution per Limited Partner Unit if
Delek Logistics Meets Annual Growth Targets (1)
Delek Logistics GP Incentive Distribution Rights
Total Quarterly Distribution Per Unit
Target Amount
Unitholders General Partner
Minimum Quarterly Distribution below $0.37500 98.0% 2.0%
First Target Distribution $0.37500 to $0.43125 98.0% 2.0%
Second Target Distribution $0.43125 to $0.46875 85.0% 15.0%
Third Target Distribution $0.46875 to $0.56250 75.0% 25.0%
Thereafter above $0.56250 50.0% 50.0%
Distribution $0.655/unit
for 3Q 2016
Distribution growth
target: 15% in 2016
10% in 2017
Delek US Ownership:
LP Units: 14,798,516
GP Units: 496,020
(1) Based on no change in number of units and assumes all units are paid distribution, including IDRs to Delek US and its affiliates. Targeted annual growth rate in distribution
based on 15% (per DKL target in 3Q16 earnings press release) from 2015 to 2016 and 10% from 2016 to 2017 based on declared amounts. Delek US and affiliates own
approximately 60% of limited partner units and 100% of the general partner units. Information for illustrative purposes only, actual amounts will be determined by Delek
Logistics based on future performance and pursuant to its partnership agreement.
Assumed Annual Distribution (LP and GP) to Delek US
if Delek Logistics Meets Annual Growth Targets (1)
$1.50 $1.60
$1.90
$2.24
$2.58
$2.83
$-
$0.5
$1.0
$1.5
$2.0
$2.5
$3.0
MQD
annualized
2013A 2014A 2015A 2016E 2017E
Distribution per LP unit
$28.1 $33.1
$37.4 $41.9
$1.9
$5.0
$12.4
$18.7
$-
$10.0
$20.0
$30.0
$40.0
$50.0
$60.0
$70.0
2014 2015 2016E 2017E
Distribution - LP Distribution - GP
$ in millions
+7%
+19%
+18%
+15%
+10%

Financial Update
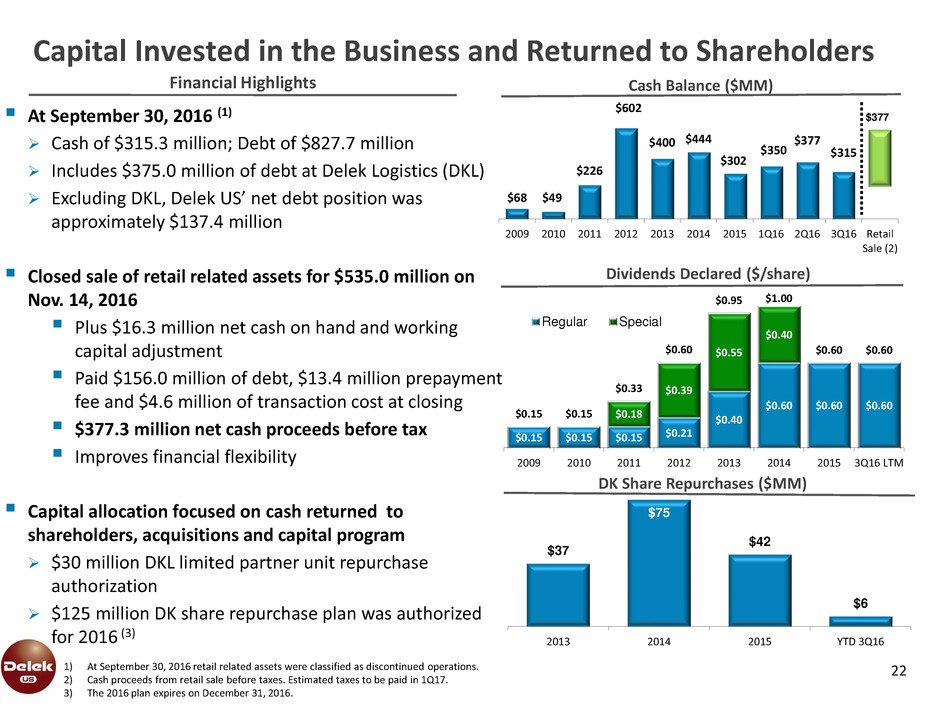
At September 30, 2016 (1)
Cash of $315.3 million; Debt of $827.7 million
Includes $375.0 million of debt at Delek Logistics (DKL)
Excluding DKL, Delek US’ net debt position was
approximately $137.4 million
Closed sale of retail related assets for $535.0 million on
Nov. 14, 2016
Plus $16.3 million net cash on hand and working
capital adjustment
Paid $156.0 million of debt, $13.4 million prepayment
fee and $4.6 million of transaction cost at closing
$377.3 million net cash proceeds before tax
Improves financial flexibility
Capital allocation focused on cash returned to
shareholders, acquisitions and capital program
$30 million DKL limited partner unit repurchase
authorization
$125 million DK share repurchase plan was authorized
for 2016 (3)
Financial Highlights Cash Balance ($MM)
Capital Invested in the Business and Returned to Shareholders
22
$68 $49
$226
$602
$400 $444
$302
$350
$377
$315
$377
2009 2010 2011 2012 2013 2014 2015 1Q16 2Q16 3Q16 Retail
Sale (2)
Dividends Declared ($/share)
$0.15 $0.15 $0.15 $0.21
$0.40
$0.60 $0.60 $0.60
$0.18
$0.39
$0.55
$0.40
$0.15 $0.15
$0.33
$0.60
$0.95 $1.00
$0.60 $0.60
2009 2010 2011 2012 2013 2014 2015 3Q16 LTM
Regular Special
$37
$75
$42
$6
2013 2014 2015 YTD 3Q16
DK Share Repurchases ($MM)
1) At September 30, 2016 retail related assets were classified as discontinued operations.
2) Cash proceeds from retail sale before taxes. Estimated taxes to be paid in 1Q17.
3) The 2016 plan expires on December 31, 2016.
Increases potential free cash flow generation from operations
$18.8
$74.9
$61.6
$82.9
$155.1
$42.3 $36.0
$46.1
$123.6
$199.1
$164.5
$27.1
$0.2
$0.3
$0.9
$0.5
$0.9
$30.3
$25.8
$9.2
$18.6
$10.6
$2.0
$0.1
$0.1 $7.6
$12.2
$7.7
$5.3
$7.9
$7.4
2005A 2006A 2007A 2008A 2009A 2010A 2011A 2012A 2013A 2014A 2015A 2016E
Refining Logistics (Marketing) Other
Declining Capital Needs
23
$42.4 $44.5
$88.6
$157.1
Source: Company filings; Excludes retail related capital expenditures as operations were classified as discontinued operations in 3Q16.
$213.6
$191.0
$155.7
$83.8
$63.9 $75.1
($ in millions)
*2016 estimate represents sustaining maintenance, regulatory and some discretionary related spending projects. No
significant growth related capital expenditures are included in the current forecast.
$45.1
24
Complementary
Logistics Systems
Significant Organic
Growth / Margin
Improvement
Opportunities
Focus on Shareholder
Returns
Strong Balance Sheet
Strategically Positioned
Refining Platform
Questions and Answers

Appendix
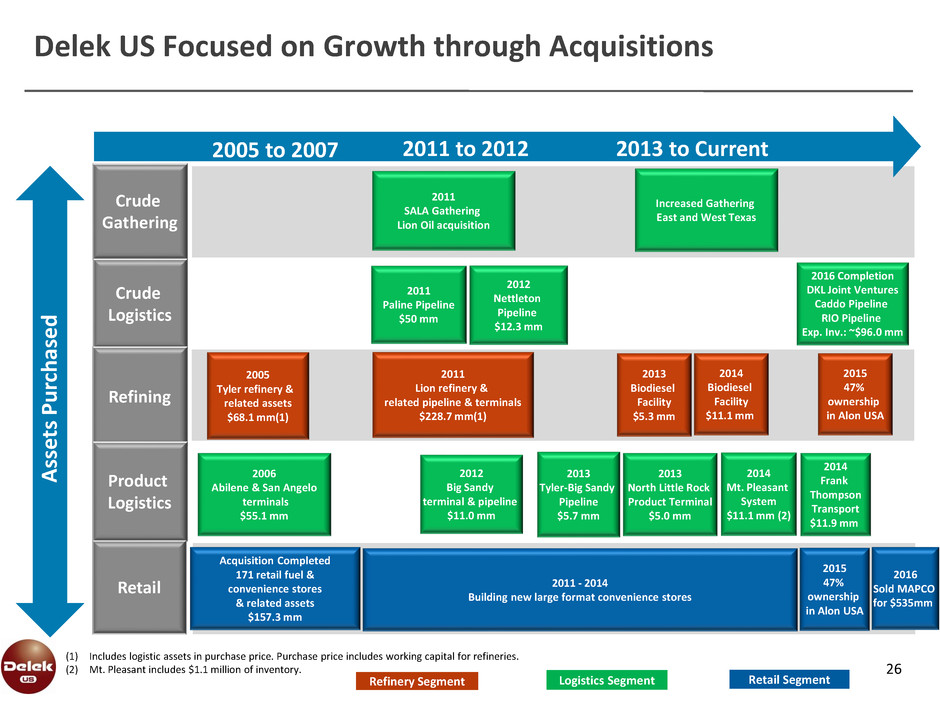
Delek US Focused on Growth through Acquisitions
(1) Includes logistic assets in purchase price. Purchase price includes working capital for refineries.
(2) Mt. Pleasant includes $1.1 million of inventory.
2006
Abilene & San Angelo
terminals
$55.1 mm
2012
Nettleton
Pipeline
$12.3 mm
2011
Paline Pipeline
$50 mm
Acquisition Completed
171 retail fuel &
convenience stores
& related assets
$157.3 mm
2005 to 2007 2011 to 2012 2013 to Current
Crude
Gathering
2013
Biodiesel
Facility
$5.3 mm
2011
Lion refinery &
related pipeline & terminals
$228.7 mm(1)
2005
Tyler refinery &
related assets
$68.1 mm(1)
2011 - 2014
Building new large format convenience stores
2013
Tyler-Big Sandy
Pipeline
$5.7 mm
2014
Biodiesel
Facility
$11.1 mm
Logistics Segment Retail Segment Refinery Segment
Crude
Logistics
Refining
Product
Logistics
Retail
2012
Big Sandy
terminal & pipeline
$11.0 mm
2013
North Little Rock
Product Terminal
$5.0 mm
2011
SALA Gathering
Lion Oil acquisition
Assets
P
u
rc
h
as
e
d
Increased Gathering
East and West Texas
26
2014
Mt. Pleasant
System
$11.1 mm (2)
2014
Frank
Thompson
Transport
$11.9 mm
2016 Completion
DKL Joint Ventures
Caddo Pipeline
RIO Pipeline
Exp. Inv.: ~$96.0 mm
2015
47%
ownership
in Alon USA
2015
47%
ownership
in Alon USA
2016
Sold MAPCO
for $535mm
27
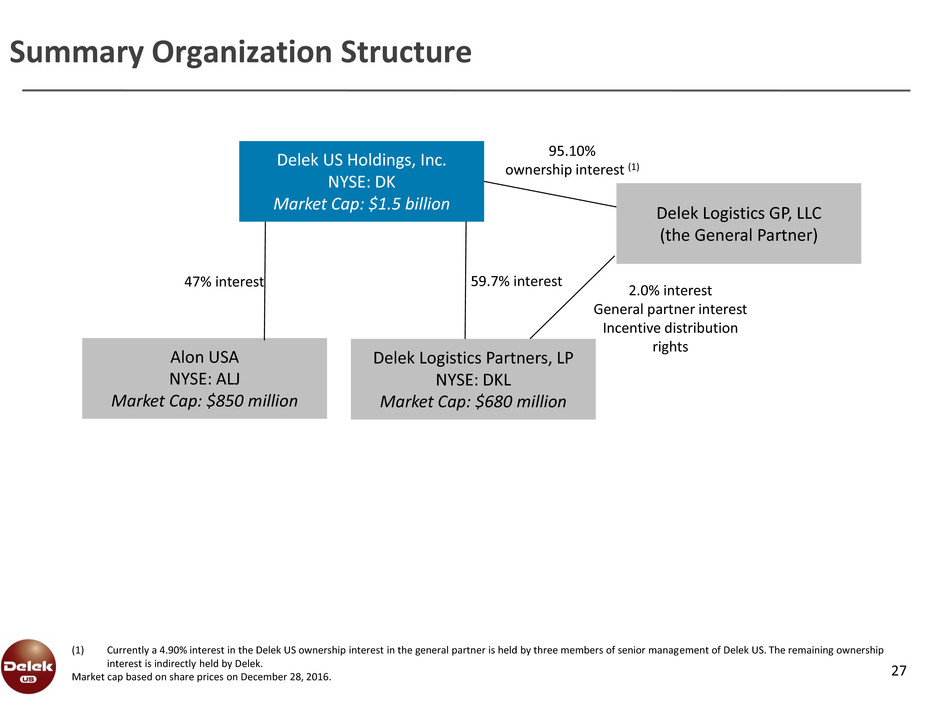
Summary Organization Structure
(1) Currently a 4.90% interest in the Delek US ownership interest in the general partner is held by three members of senior management of Delek US. The remaining ownership
interest is indirectly held by Delek.
Market cap based on share prices on December 28, 2016.
95.10%
ownership interest (1)
2.0% interest
General partner interest
Incentive distribution
rights
Delek Logistics Partners, LP
NYSE: DKL
Market Cap: $680 million
Delek Logistics GP, LLC
(the General Partner)
Delek US Holdings, Inc.
NYSE: DK
Market Cap: $1.5 billion
59.7% interest
Alon USA
NYSE: ALJ
Market Cap: $850 million
47% interest

-$30
-$20
-$10
$0
$10
$20
$30
$40
$50
J
a
n
-1
0
F
e
b
-1
0
M
a
r-
1
0
A
pr
-1
0
M
a
y
-1
0
J
u
n
-1
0
J
u
l-
1
0
A
u
g
-1
0
S
e
p
-1
0
O
c
t-
1
0
No
v
-1
0
De
c
-1
0
J
a
n
-1
1
F
e
b
-1
1
M
a
r-
1
1
A
pr
-1
1
M
a
y
-1
1
J
u
n
-1
1
J
u
l-
1
1
A
u
g
-1
1
S
e
p
-1
1
O
c
t-
1
1
No
v
-1
1
De
c
-1
1
J
a
n
-1
2
F
e
b
-1
2
M
a
r-
1
2
A
pr
-1
2
M
a
y
-1
2
J
u
n
-1
2
J
u
l-
1
2
A
u
g
-1
2
S
e
p
-1
2
O
c
t-
1
2
No
v
-1
2
De
c
-1
2
J
a
n
-1
3
F
e
b
-1
3
M
a
r-
1
3
A
pr
-1
3
M
a
y
-1
3
J
u
n
-1
3
J
u
l-
1
3
A
u
g
-1
3
S
e
p
-1
3
O
c
t-
1
3
No
v
-1
3
De
c
-1
3
J
a
n
-1
4
F
e
b
-1
4
M
a
r-
1
4
A
pr
-1
4
M
a
y
-1
4
J
u
n
-1
4
J
u
l-
1
4
A
u
g
-1
4
S
e
p
-1
4
O
c
t-
1
4
No
v
-1
4
De
c
-1
4
J
a
n
-1
5
F
e
b
-1
5
M
a
r-
1
5
A
pr
-1
5
M
a
y
-1
5
J
u
n
-1
5
J
u
l-
1
5
A
u
g
-1
5
S
e
p
-1
5
O
c
t-
1
5
No
v
-1
5
De
c
-1
5
J
a
n
-1
6
F
e
b
-1
6
M
a
r-
1
6
A
pr
-1
6
M
a
y
-1
6
J
u
n
-1
6
J
u
l-
1
6
A
u
g
-1
6
S
e
p
-1
6
O
c
t-
1
6
No
v
-1
6
De
c
-1
6
Brent-WTI Cushing Spread Per Barrel WTI 5-3-2 Gulf Coast Crack Spread Per Barrel LLS 5-3-2 Gulf Coast Crack Spread Per Barrel
U.S. Refining Environment Trends
Refined Product Margins and WTI-Linked Feedstock Favor Delek US
(1) Source: Platts; 2016 data is as of December 28, 2016; 5-3-2 crack spread based on HSD
(2) Crack Spreads: (+/-) Contango/Backwardation
(1) (2) (2)
28

($14.00)
($12.00)
($10.00)
($8.00)
($6.00)
($4.00)
($2.00)
$0.00
$2.00
Ja
n
-1
1
Fe
b
-1
1
M
ar
-1
1
A
p
r-
11
M
ay
-1
1
Ju
n
-1
1
Ju
l-1
1
A
u
g-
1
1
Se
p
-1
1
O
ct-1
1
N
o
v-
1
1
De
c-
1
1
Ja
n
-1
2
Fe
b
-1
2
M
ar
-1
2
A
p
r-
12
M
ay
-1
2
Ju
n
-1
2
Ju
l-1
2
A
u
g-
1
2
Se
p
-1
2
O
ct-1
2
N
o
v-
1
2
De
c-
1
2
Ja
n
-1
3
Fe
b
-1
3
M
ar
-1
3
A
p
r-
13
M
ay
-1
3
Ju
n
-1
3
Ju
l-1
3
A
u
g-
1
3
Se
p
-1
3
O
ct-1
3
N
o
v-
1
3
De
c-
1
3
Ja
n
-1
4
Fe
b
-1
4
M
ar
-1
4
A
p
r-
14
M
ay
-1
4
Ju
n
-1
4
Ju
l-1
4
A
u
g-
1
4
Se
p
-1
4
O
ct-1
4
N
o
v-
1
4
De
c-
1
4
Ja
n
-1
5
Fe
b
-1
5
M
ar
-1
5
A
p
r-
15
M
ay
-1
5
Ju
n
-1
5
Ju
l-1
5
A
u
g-
1
5
Se
p
-1
5
O
ct-1
5
N
o
v-
1
5
De
c-
1
5
Ja
n
-1
6
Fe
b
-1
6
M
ar
-1
6
A
p
r-
16
M
ay
-1
6
Ju
n
-1
6
Ju
l-1
6
A
u
g-
1
6
Se
p
-1
6
O
ct-1
6
N
o
v-
1
6
De
c-
1
6
Ja
n
-1
7
Fe
b
-1
7
WTI Midland vs. WTI Cushing Crude Pricing
Access to Midland Crudes Benefits Margins
($ per barrel)
105,000 bpd of
Midland crude in
DK system
29
Source: Argus – as of December 28, 2016

Reconciliation of Cash Available for Distribution
30
(1) Distribution for forecast period based on $1.50 per unit; Distribution for year ended December 31, 2013, 2014, 2015 and year to date 2016 based on actual amounts distributed
during the periods; does not include a LTIP accrual. Coverage is defined as cash available for distribution divided by total distribution.
(2) Results in 2013, 2014 and 2015 are as reported excluding predecessor costs related to the drop down of the tank farms and product terminals at both Tyler and El Dorado during
the respective periods.
Note: May not foot due to rounding and annual adjustments that occurred in year end reporting.
(dollars in millions, except coverage) 1Q13 (2) 2Q13(2) 3Q13(2) 4Q13(2) 2013 (2) 1Q14 (2) 2Q14 3Q14 4Q14 2014 (2) 1Q15(2) 2Q15 3Q15 4Q15 2015 (2) 1Q16 2Q16 3Q16
Reconciliation of Distributable Cash Flow to net cash from operating activities
Net cash provided by operating activities $2.0 $18.7 $19.9 $8.9 $49.4 $14.4 $31.2 $20.1 $20.8 $86.6 $15.9 $30.8 $20.2 $1.3 $68.2 $26.4 $31.2 $29.2
Accretion of asset retirement obligations ($0.0) ($0.1) ($0.0) ($0.1) ($0.2) ($0.1) ($0.1) ($0.1) $0.0 ($0.2) ($0.1) ($0.1) ($0.1) ($0.1) ($0.3) ($0.1) ($0.1) ($0.1)
Deferred income taxes $0.0 $0.0 ($0.1) ($0.3) ($0.3) $0.0 ($0.1) ($0.0) $0.2 $0.1 ($0.2) $0.2 $0.0 $0.0 ($0.0) $0.0 $0.0 $0.0
Gain (Loss) on asset disposals $0.0 $0.0 $0.0 ($0.2) ($0.2) $0.0 ($0.1) $0.0 ($0.0) ($0.1) ($0.0) $0.0 $0.0 ($0.1) ($0.1) $0.0 $0.0 ($0.0)
Changes in assets and liabilities $12.1 ($4.9) ($5.1) $6.3 $8.3 $3.4 ($6.0) ($1.6) $3.0 ($1.2) $3.3 ($7.3) $3.6 $20.5 $20.1 ($5.4) ($7.1) ($10.0)
Maint. & Reg. Capital Expenditures ($1.3) ($1.1) ($1.3) ($1.8) ($5.1) ($0.8) ($1.0) ($0.8) ($3.9) ($6.5) ($3.3) ($3.9) ($3.5) ($2.7) ($11.8) ($0.7) ($0.9) ($0.7)
Reimbursement for Capital Expenditures $0.3 $0.2 $0.0 $0.4 $0.8 $0.0 $0.0 $0.0 $1.6 $1.6 $1.2 $1.4 $2.3 $0.0 $5.2 $0.2 $0.6 $0.7
Distributable Cash Flow $13.1 $12.8 $13.4 $13.3 $52.9 $17.0 $24.0 $17.7 $21.8 $80.3 $16.8 $21.1 $22.6 $18.9 $81.3 $20.4 $23.7 $19.1
Coverage (1) 1.39x 1.32x 1.35x 1.30x 1.35x 1.61x 2.02x 1.42x 1.67x 1.68x 1.23x 1.47x 1.50x 1.17x 1.37x 1.19x 1.31x 0.99x
Total Distribution (1) $9.4 $9.7 $9.9 $10.2 $39.3 $10.5 $11.9 $12.4 $13.1 $47.9 $13.7 $14.4 $15.1 $16.1 $59.3 $17.1 $18.1 $19.3
DKL: Reconciliation of Cash Available for Distribution
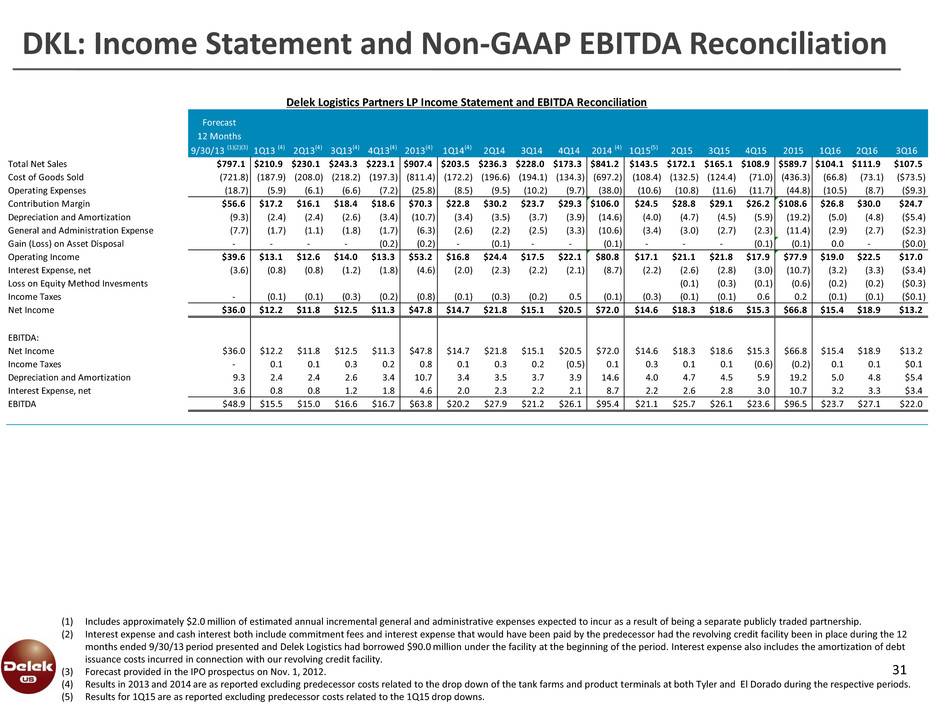
DKL: Income Statement and Non-GAAP EBITDA Reconciliation
31
(1) Includes approximately $2.0 million of estimated annual incremental general and administrative expenses expected to incur as a result of being a separate publicly traded partnership.
(2) Interest expense and cash interest both include commitment fees and interest expense that would have been paid by the predecessor had the revolving credit facility been in place during the 12
months ended 9/30/13 period presented and Delek Logistics had borrowed $90.0 million under the facility at the beginning of the period. Interest expense also includes the amortization of debt
issuance costs incurred in connection with our revolving credit facility.
(3) Forecast provided in the IPO prospectus on Nov. 1, 2012.
(4) Results in 2013 and 2014 are as reported excluding predecessor costs related to the drop down of the tank farms and product terminals at both Tyler and El Dorado during the respective periods.
(5) Results for 1Q15 are as reported excluding predecessor costs related to the 1Q15 drop downs.
Note: May not foot due to rounding.
Forecast
12 Months
9/30/13 (1)(2)(3) 1Q13 (4) 2Q13(4) 3Q13(4) 4Q13(4) 2013(4) 1Q14(4) 2Q14 3Q14 4Q14 2014 (4) 1Q15(5) 2Q15 3Q15 4Q15 2015 1Q16 2Q16 3Q16
Total Net Sales $797.1 $210.9 $230.1 $243.3 $223.1 $907.4 $203.5 $236.3 $228.0 $173.3 $841.2 $143.5 $172.1 $165.1 $108.9 $589.7 $104.1 $111.9 $107.5
Cost of Goods Sold (721.8) (187.9) (208.0) (218.2) (197.3) (811.4) (172.2) (196.6) (194.1) (134.3) (697.2) (108.4) (132.5) (124.4) (71.0) (436.3) (66.8) (73.1) ($73.5)
Operating Expenses (18.7) (5.9) (6.1) (6.6) (7.2) (25.8) (8.5) (9.5) (10.2) (9.7) (38.0) (10.6) (10.8) (11.6) (11.7) (44.8) (10.5) (8.7) ($9.3)
Contribution Margin $56.6 $17.2 $16.1 $18.4 $18.6 $70.3 $22.8 $30.2 $23.7 $29.3 $106.0 $24.5 $28.8 $29.1 $26.2 $108.6 $26.8 $30.0 $24.7
Depreciation and Amortization (9.3) (2.4) (2.4) (2.6) (3.4) (10.7) (3.4) (3.5) (3.7) (3.9) (14.6) (4.0) (4.7) (4.5) (5.9) (19.2) (5.0) (4.8) ($5.4)
General and Administration Expense (7.7) (1.7) (1.1) (1.8) (1.7) (6.3) (2.6) (2.2) (2.5) (3.3) (10.6) (3.4) (3.0) (2.7) (2.3) (11.4) (2.9) (2.7) ($2.3)
Gain (Loss) on Asset Disposal - - - - (0.2) (0.2) - (0.1) - - (0.1) - - - (0.1) (0.1) 0.0 - ($0.0)
Operating Income $39.6 $13.1 $12.6 $14.0 $13.3 $53.2 $16.8 $24.4 $17.5 $22.1 $80.8 $17.1 $21.1 $21.8 $17.9 $77.9 $19.0 $22.5 $17.0
Interest Expense, net (3.6) (0.8) (0.8) (1.2) (1.8) (4.6) (2.0) (2.3) (2.2) (2.1) (8.7) (2.2) (2.6) (2.8) (3.0) (10.7) (3.2) (3.3) ($3.4)
Loss on Equity Method Invesments (0.1) (0.3) (0.1) (0.6) (0.2) (0.2) ($0.3)
Income Taxes - (0.1) (0.1) (0.3) (0.2) (0.8) (0.1) (0.3) (0.2) 0.5 (0.1) (0.3) (0.1) (0.1) 0.6 0.2 (0.1) (0.1) ($0.1)
Net Income $36.0 $12.2 $11.8 $12.5 $11.3 $47.8 $14.7 $21.8 $15.1 $20.5 $72.0 $14.6 $18.3 $18.6 $15.3 $66.8 $15.4 $18.9 $13.2
EBITDA:
Net Income $36.0 $12.2 $11.8 $12.5 $11.3 $47.8 $14.7 $21.8 $15.1 $20.5 $72.0 $14.6 $18.3 $18.6 $15.3 $66.8 $15.4 $18.9 $13.2
Income Taxes - 0.1 0.1 0.3 0.2 0.8 0.1 0.3 0.2 (0.5) 0.1 0.3 0.1 0.1 (0.6) (0.2) 0.1 0.1 $0.1
Depreciation and Amortization 9.3 2.4 2.4 2.6 3.4 10.7 3.4 3.5 3.7 3.9 14.6 4.0 4.7 4.5 5.9 19.2 5.0 4.8 $5.4
Interest Expense, net 3.6 0.8 0.8 1.2 1.8 4.6 2.0 2.3 2.2 2.1 8.7 2.2 2.6 2.8 3.0 10.7 3.2 3.3 $3.4
EBITDA $48.9 $15.5 $15.0 $16.6 $16.7 $63.8 $20.2 $27.9 $21.2 $26.1 $95.4 $21.1 $25.7 $26.1 $23.6 $96.5 $23.7 $27.1 $22.0
Delek Logistics Partners LP Income Statement and EBITDA Reconciliation

Investor Relations Contact:
Assi Ginzburg Keith Johnson
Chief Financial Officer Vice President of Investor Relations
615-435-1452 615-435-1366
