Attached files
| file | filename |
|---|---|
| EX-99.1 - EX-99.1 - CONAGRA BRANDS INC. | d287168dex991.htm |
| 8-K - FORM 8-K - CONAGRA BRANDS INC. | d287168d8k.htm |
Exhibit 99.2
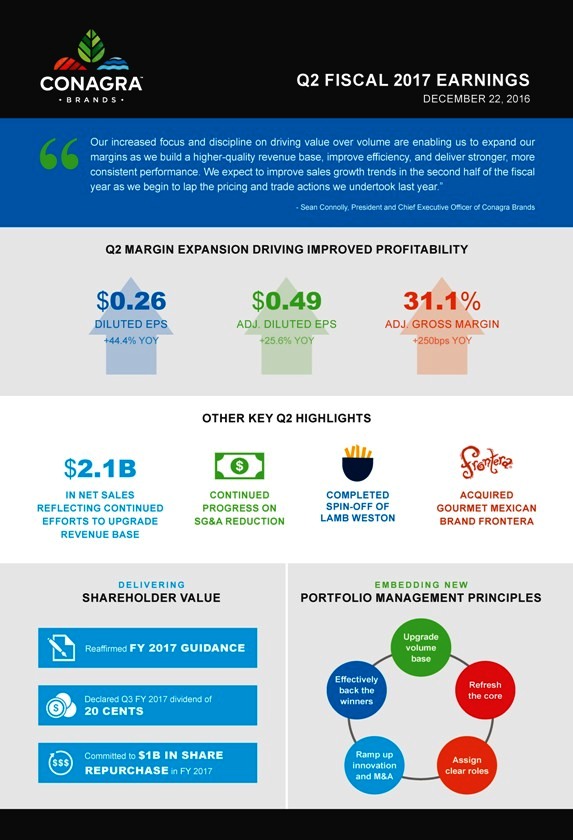
Exhibit 99.2
Q2 FISCAL 2017 EARNINGS
DECEMBER 22, 2016
Our increased focus and discipline on driving value over volume are enabling us to expand our margins as we build a higher-quality revenue base, improve efficiency, and deliver stronger, more consistent performance. We expect to improve sales growth trends in the second half of the fiscal year as we begin to lap the pricing and trade actions we undertook last year.”
- Sean Connolly, President and Chief Executive Officer of Conagra Brands
Q2 MARGIN EXPANSION DRIVING IMPROVED PROFITABILITY
$0.26
DILUTED EPS
+44.4% YOY
$0.49
ADJ. DILUTED EPS
+25.6% YOY
31.1%
ADJ. GROSS MARGIN
+250bps YOY
OTHER KEY Q2 HIGHLIGHTS
$2.1B
IN NET SALES REFLECTING CONTINUED EFFORTS TO UPGRADE REVENUE BASE CONTINUED PROGRESS ON SG&A REDUCTION
COMPLETED SPIN-OFF OF
LAMB WESTON ACQUIRED GOURMET MEXICAN BRAND FRONTERA
DELIVERING SHAREHOLDER VALUE EMBEDDING N E W PORTFOLIO MANAGEMENT PRINCIPLES
Upgrade volume base
Reaffirmed FY 2017 GUIDANCE
Effectively back the winnersRefresh the core
Declared Q3 FY 2017 dividend of 20 CENTS
Committed to $1B IN SHARE Ramp up
Innovation and M&A Assign clear roles
REPURCHASE in FY 2017
Q2 FISCAL 2017 EARNINGS
DECEMBER 22, 2016
NOTE ON FORWARD-LOOKING STATEMENTS
This document contains forward-looking statements within the meaning of the federal securities laws. These forward-looking statements are based on management’s current expectations and are subject to uncertainty and changes in circumstances. We undertake no responsibility for updating these statements. Readers of this document should understand that these statements are not guarantees of performance or results. Many factors could affect our actual financial results and cause them to vary materially from the expectations contained in the forward-looking statements, including those set forth in this document. These risks and uncertainties include, among other things: our ability to achieve the intended benefits of the recent spin-off of our Lamb Weston business; general economic and industry conditions; our ability to successfully execute our long-term value creation strategy; our ability to access capital; our ability to execute our operating and restructuring plans and achieve our targeted operating efficiencies, cost-saving initiatives, and trade optimization programs; the effectiveness of our hedging activities, including volatility in commodities that could negatively impact our derivative positions and, in turn, our earnings; the competitive environment and related market conditions; our ability to respond to changing consumer preferences and the success of our innovation and marketing investments; the ultimate impact of any product recalls and litigation, including litigation related to the lead paint and pigment matters; actions of governments and regulatory factors affecting our businesses, including the Patient Protection and Affordable Care Act; the availability and prices of raw materials, including any negative effects caused by inflation or weather conditions; risks and uncertainties associated with intangible assets, including any future goodwill or intangible assets impairment charges; our ability to realize the synergies and benefits contemplated by the Ardent Mills joint venture; the costs, disruption, and diversion of management’s attention associated with campaigns commenced by activist investors; and other risks described in our reports filed from time to time with the Securities and Exchange Commission. We caution readers not to place undue reliance on any forward-looking statements included in this document, which speak only as of the date of this document.
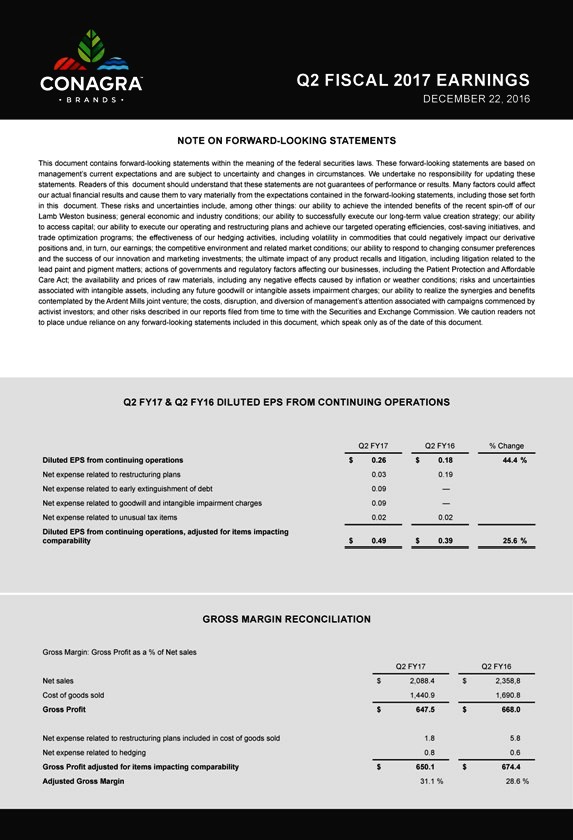
Q2 FY17 & Q2 FY16 DILUTED EPS FROM CONTINUING OPERATIONS
Diluted EPS from continuing operations
Net expense related to restructuring plans
Net expense related to early extinguishment of debt
Net expense related to goodwill and intangible impairment charges
Net expense related to unusual tax items
Diluted EPS from continuing operations, adjusted for items impacting comparability
Q2 FY17
$0.26
0.03
0.09
0.09
0.02
$0.49
Q2 FY16
$0.18
0.19
—
—
0.02
$0.39
% Change
44.4 %
25.6 %
GROSS MARGIN RECONCILIATION
Gross Margin: Gross Profit as a % of Net sales
Net sales
Cost of goods sold
Gross Profit
Net expense related to restructuring plans included in cost of goods sold
Net expense related to hedging
Gross Profit adjusted for items impacting comparability
Adjusted Gross Margin
Q2 FY17
$2,088.4
1,440.9
$647.5
1.8
0.8
$650.1
31.1 %
Q2 FY16
$2,358,8
1,690.8
$668.0
5.8
0.6
$674.4
28.6 %