Attached files
| file | filename |
|---|---|
| EX-32.2 - EX-32.2 - STAR GROUP, L.P. | d260533dex322.htm |
| EX-32.1 - EX-32.1 - STAR GROUP, L.P. | d260533dex321.htm |
| EX-31.2 - EX-31.2 - STAR GROUP, L.P. | d260533dex312.htm |
| EX-31.1 - EX-31.1 - STAR GROUP, L.P. | d260533dex311.htm |
| EX-21 - EX-21 - STAR GROUP, L.P. | d260533dex21.htm |
| EX-10.22 - EX-10.22 - STAR GROUP, L.P. | d260533dex1022.htm |
| EX-10.21 - EX-10.21 - STAR GROUP, L.P. | d260533dex1021.htm |
| EX-10.20 - EX-10.20 - STAR GROUP, L.P. | d260533dex1020.htm |
Table of Contents
UNITED STATES
SECURITIES AND EXCHANGE COMMISSION
Washington, DC 20549
FORM 10-K
(Mark One)
| x | ANNUAL REPORT PURSUANT TO SECTION 13 or 15(d) OF THE SECURITIES EXCHANGE ACT OF 1934 |
For the fiscal year ended September 30, 2016
OR
| ¨ | TRANSITION REPORT PURSUANT TO SECTION 13 OR 15(d) OF THE SECURITIES EXCHANGE ACT OF 1934 |
For the transition period from to
Commission File Number: 001-14129
STAR GAS PARTNERS, L.P.
(Exact name of registrant as specified in its charter)
| Delaware | 06-1437793 | |
| (State or other jurisdiction of incorporation or organization) |
(I.R.S. Employer Identification No.) |
| 9 West Broad Street, Suite 310, Stamford, Connecticut | 06902 | |
| (Address of principal executive office) | (Zip Code) |
(203) 328-7310
(Registrant’s telephone number, including area code)
Securities registered pursuant to Section 12(b) of the Act:
| Title of each class |
Name of each exchange on which registered | |
| Common Units | New York Stock Exchange |
Securities registered pursuant to Section 12(g) of the Act: None
Indicate by check mark if the registrant is a well-known seasoned issuer, as defined in Rule 405 of the Securities Act. Yes ¨ No x
Indicate by check mark if the registrant is not required to file reports pursuant to Section 13 or Section 15(d) of the Act. Yes ¨ No x
¨ Indicate by check mark whether the registrant (1) has filed all reports required to be filed by Section 13 or 15(d) of the Securities Exchange Act of 1934 during the preceding 12 months (or for such shorter period that the registrant was required to file such reports), and (2) has been subject to such filing requirements for the past 90 days. Yes x No ¨
Indicate by check mark whether the registrant has submitted electronically and posted on its corporate Web site, if any, every Interactive Data File required to be submitted and posted pursuant to Rule 405 of Regulation S-T (§232.405 of this chapter) during the preceding 12 months (or for such shorter period that the registrant was required to submit and post such files). Yes x No ¨
Indicate by check mark if disclosure of delinquent filers pursuant to Item 405 of Regulation S-K is not contained herein, and will not be contained, to the best of registrant’s knowledge, in definitive proxy or information statements incorporated by reference in Part III of this Form 10-K or any amendment to this Form 10-K. x
Indicate by check mark whether the registrant is a large accelerated filer, an accelerated filer, a non-accelerated filer, or a smaller reporting company. See definitions of “large accelerated filer,” and “accelerated filer” and “smaller reporting company” in Rule 12b-2 of the Act (check one).
| Large accelerated filer | ¨ | Accelerated filer | x | |||
| Non-accelerated filer | ¨ | Smaller reporting company | ¨ | |||
Indicate by check mark whether the registrant is a shell company (as defined in Rule 12b-2 of the Exchange Act). Yes ¨ No x
The aggregate market value of the registrant’s common units held by non-affiliates on March 31, 2016 was approximately $363,812,946.
As of November 30, 2016, the registrant had 55,887,832 common units outstanding.
Documents Incorporated by Reference: None
Table of Contents
STAR GAS PARTNERS, L.P.
2016 FORM 10-K ANNUAL REPORT
| Page | ||||||
| Item 1. |
3 | |||||
| Item 1A. |
10 | |||||
| Item 1B. |
22 | |||||
| Item 2. |
22 | |||||
| Item 3. |
22 | |||||
| Item 4. |
22 | |||||
| Item 5. |
23 | |||||
| Item 6. |
25 | |||||
| Item 7. |
Management’s Discussion and Analysis of Financial Condition and Results of Operations |
27 | ||||
| Item 7A. |
44 | |||||
| Item 8. |
45 | |||||
| Item 9. |
Changes in and Disagreements with Accountants on Accounting and Financial Disclosure |
45 | ||||
| Item 9A. |
45 | |||||
| Item 9B. |
46 | |||||
| Item 10. |
46 | |||||
| Item 11. |
50 | |||||
| Item 12. |
Security Ownership of Certain Beneficial Owners and Management |
60 | ||||
| Item 13. |
60 | |||||
| Item 14. |
62 | |||||
| Item 15. |
62 | |||||
Statement Regarding Forward-Looking Disclosure
This Annual Report on Form 10-K includes “forward-looking statements” which represent our expectations or beliefs concerning future events that involve risks and uncertainties, including those associated with the effect of weather conditions on our financial performance, the price and supply of the products that we sell, the consumption patterns of our customers, our ability to obtain satisfactory gross profit margins, our ability to obtain new customers and retain existing customers, our ability to make strategic acquisitions, the impact of litigation, our ability to contract for our current and future supply needs, natural gas conversions, future union relations and the outcome of current and future union negotiations, the impact of current and future governmental regulations, including environmental, health, and safety regulations, the ability to attract and retain employees, customer credit worthiness, counterparty credit worthiness, marketing plans, general economic conditions and new technology. All statements other than statements of historical facts included in this Report including, without limitation, the statements under “Management’s Discussion and Analysis of Financial Condition and Results of Operations” and elsewhere herein, are forward-looking statements. Without limiting the foregoing, the words “believe,” “anticipate,” “plan,” “expect,” “seek,” “estimate,” and similar expressions are intended to identify forward-looking statements. Although we believe that the expectations reflected in such forward-looking statements are reasonable, we can give no assurance that such expectations will prove to be correct and actual results may differ materially from those projected as a result of certain risks and uncertainties. These risks and uncertainties include, but are not limited to, those set forth in this Report under the heading “Risk Factors” and “Business Strategy.” Important factors that could cause actual results to differ materially from our expectations (“Cautionary Statements”) are disclosed in this Report. All subsequent written and oral forward-looking statements attributable to the Partnership or persons acting on its behalf are expressly qualified in their entirety by the Cautionary Statements. Unless otherwise required by law, we undertake no obligation to update or revise any forward-looking statements, whether as a result of new information, future events or otherwise after the date of this Report.
2
Table of Contents
| ITEM 1. | BUSINESS |
Structure
Star Gas Partners, L.P. (“Star Gas Partners,” the “Partnership,” “we,” “us,” or “our”) is a home heating oil and propane distributor and services provider with one reportable operating segment that principally provides services to residential and commercial customers to heat homes and buildings. Star Gas Partners is a Delaware limited partnership, which at November 30, 2016, had outstanding 55.9 million common partner units (NYSE: “SGU”) representing a 99.4% limited partner interest in Star Gas Partners, and 0.3 million general partner units, representing a 0.6% general partner interest in Star Gas Partners. Our general partner is Kestrel Heat, LLC, a Delaware limited liability company (“Kestrel Heat” or the “general partner”).
The following chart depicts the ownership of the partnership as of November 30, 2016:
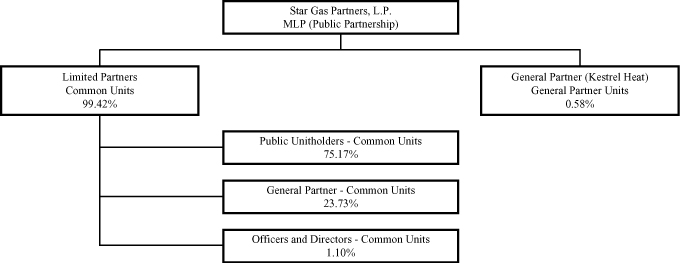
The Partnership is organized as follows:
| • | Our general partner is Kestrel Heat, LLC, a Delaware limited liability company (“Kestrel Heat” or the “general partner”). The Board of Directors of Kestrel Heat is appointed by its sole member, Kestrel Energy Partners, LLC, a Delaware limited liability company (“Kestrel”). |
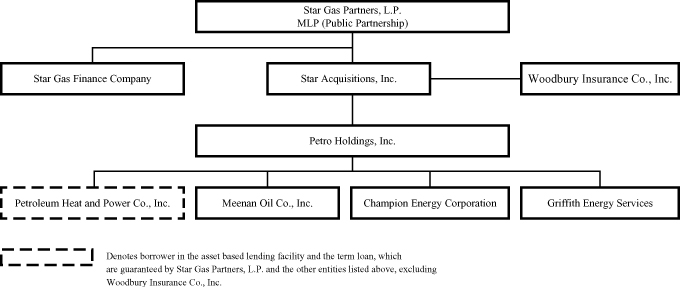
| • | Our operations are conducted through Petro Holdings, Inc., a Minnesota corporation that is a wholly owned subsidiary of Star Acquisitions, Inc., and its subsidiaries. |
| • | Petroleum Heat and Power Co., Inc. (“PH&P”) is a 100% owned subsidiary of the Partnership. PH&P is the borrower and the Partnership is a guarantor of the third amended and restated credit agreement’s five-year senior secured term loan and the $300 million ($450 million during the heating season of December through April of each year) revolving credit facility, both due July 30, 2020. (See Note 11 of the Notes to the Consolidated Financial Statements — Long-Term Debt and Bank Facility Borrowings) |
We file annual, quarterly, current and other reports and information with the Securities and Exchange Commission, or SEC. These filings can be viewed and downloaded from the Internet at the SEC’s website at www.sec.gov. In addition, these SEC filings are available at no cost as soon as reasonably practicable after the filing thereof on our website at www.star-gas.com/sec.cfm. These reports are also available to be read and copied at the SEC’s public reference room located at Judiciary Plaza, 100 F Street, N.E., Washington, D.C. 20549. The public may obtain information on the operation of the public reference room by calling the SEC at 1-800-SEC-0330. You may also obtain copies of these filings and other information at the offices of the New York Stock Exchange located at 11 Wall Street, New York, New York 10005. Please note that any Internet addresses provided in this Annual Report on Form 10-K are for informational purposes only and are not intended to be hyperlinks. Accordingly, no information found and/or provided at such Internet addresses is intended or deemed to be incorporated by reference herein.
3
Table of Contents
Partnership Structure
The following chart summarizes our partnership structure as of September 30, 2016. Other than Star Gas Partners, L.P. all other entities in this structure are taxable as corporations for Federal and state income tax purposes.
Business Overview
We are a home heating oil and propane distributor and service provider to residential and commercial customers who heat their homes and buildings in the Northeast, Central and Southeast U.S. regions. Our customers are principally in the more northern and eastern states. As of September 30, 2016, we sold home heating oil and propane to approximately 437,000 full service residential and commercial customers. We believe we are the largest retail distributor of home heating oil in the United States, based upon sales volume with a market share in excess of 5.5%. We also sell home heating oil, gasoline and diesel fuel to approximately 71,000 customers on a delivery only basis. We install, maintain, and repair heating and air conditioning equipment and to a lesser extent provide these services outside our customer base including 7,700 service contracts for natural gas and other heating systems. In addition, we provide home security and plumbing, to approximately 27,000 customers, many of whom are also existing home heating oil and propane customers. During fiscal 2016, total sales were comprised approximately 62.9% from sales of home heating oil and propane; 21.7% from the installation and repair of heating and air conditioning equipment and ancillary services; and 15.4% from the sale of other petroleum products. We provide home heating equipment repair service and natural gas service 24 hours a day, seven days a week, 52 weeks a year. These services are an integral part of our business, and are intended to maximize customer satisfaction and loyalty.
We conduct our business through an operating subsidiary, Petro Holdings, Inc., utilizing multiple local brand names, such as Petro Home Services, Meenan, and Griffith Energy Services, Inc.
We also offer several pricing alternatives to our residential home heating oil customers, including a variable price (market based) option and a price-protected option, the latter of which either sets the maximum price or a fixed price that a customer will pay. Users choose the plan they feel best suits them which we believe increases customer satisfaction. Approximately 96% of our full service residential and commercial home heating oil customers automatically receive deliveries based on prevailing weather conditions. In addition, approximately 37% of our homeowners take advantage of our “smart pay” budget payment plan under which their estimated annual oil and propane deliveries and service billings are paid for in a series of equal monthly installments. We use derivative instruments as needed to mitigate our exposure to market risk associated with our price-protected offerings and the storing of our physical home heating oil inventory. Given our size, we are able to realize certain benefits of scale and provide consistent, strong customer service.
4
Table of Contents
Currently, we have heating oil and/or propane customers in the following states, regions and counties:
| Maine York
New Hampshire Hillsborough Merrimack Rockingham Strafford
Vermont Bennington
Massachusetts Barnstable Bristol Essex Hampden Middlesex Norfolk Plymouth Suffolk Worcester
Rhode Island Bristol Kent Newport Providence Washington
Connecticut Fairfield Hartford Litchfield Middlesex New Haven New London Tolland Windham
Washington, D.C. District of Columbia
Delaware Kent New Castle Sussex |
New York Albany Bronx Columbia Dutchess Fulton Greene Kings Montgomery Nassau New York Orange Putnam Queens Rensselaer Richmond Rockland Saratoga Schenectady Schoharie Suffolk Sullivan Ulster Warren Washington Westchester
Maryland Anne Arundel Baltimore Calvert Caroline Carroll Cecil Charles Dorchester Frederick Harford Howard Kent Montgomery Prince George’s Queen Anne St. Mary’s Talbot Washington
West Virginia Berkeley Jefferson Morgan |
New Jersey Atlantic Bergen Burlington Camden Cumberland Essex Gloucester Hudson Hunterdon Mercer Middlesex Monmouth Morris Ocean Passaic Salem Somerset Sussex Union Warren
Pennsylvania Adams Berks Bucks Chester Cumberland Dauphin Delaware Franklin Fulton Lancaster Lebanon Lehigh Monroe Montgomery Northampton Perry Philadelphia Schuylkill York
Virginia Arlington Clarke Culpepper Fairfax Frederick Fauquier Loudoun Prince William Stafford Warren |
Tennessee Bradley Hamilton McMinn Meigs Polk
North Carolina Anson Caburras Davidson Forsyth Gaston Guilford Lincoln Mecklenburg Montgomery Randolph Richmond Rowan Stanly Union
South Carolina Bamberg Calhoun Chester Dorchester Fairfield Kershaw Lexington Orangeburg
Georgia Banks Cherokee Dawson Fannin Franklin Forsyth Habersham Hall Jefferson Lumpkin Murray Rabun Stephens Towns White Whitfield |
5
Table of Contents
Industry Characteristics
Home heating oil is primarily used as a source of fuel to heat residences and businesses in the Northeast and Mid-Atlantic regions. According to the U.S. Department of Energy—Energy Information Administration, 2009 Residential Energy Consumption Survey (the latest survey published), these regions account for 83% (5.7 million of 6.9 million) of the households in the United States where heating oil is the main space-heating fuel and 28% (5.7 million of 20.8 million) of the homes in these regions use home heating oil as their main space-heating fuel. Our experience has been that customers have a tendency to increase their conservation efforts as the price of home heating oil increase, thereby reducing their consumption.
The retail home heating oil industry is mature, with total market demand expected to decline in the foreseeable future due to conversions to natural gas and other alternative energy sources. Therefore, our ability to maintain our business or grow within the industry is dependent on the acquisition of other retail distributors, the success of our marketing programs, and the growth of our other service offerings. Based on our records, our customer conversions to natural gas have ranged between 1.3% and 2.4% per year over the last five years. We believe this may continue or increase as natural gas has become less expensive than home heating oil on an equivalent BTU basis. In addition, there are legislative and regulatory efforts underway in several states seeking to encourage homeowners to expand the use of natural gas as a heating fuel.
The retail home heating oil industry is highly fragmented, characterized by a large number of relatively small, independently owned and operated local distributors. Some dealers provide full service, as we do, and others offer delivery only on a cash-on-delivery basis, which we also do to a significantly lesser extent. In addition, the industry is complex and costly due to regulations, working capital requirements, and the costs and risks of hedging for price protected customers
Propane is a by-product of natural gas processing and petroleum refining. Propane use falls into three broad categories: residential and commercial applications; industrial applications; and agricultural uses. In the residential and commercial markets, propane is used primarily for space heating, water heating, clothes drying and cooking. Industrial customers use propane generally as a motor fuel to power over-the-road vehicles, forklifts and stationary engines, to fire furnaces, as a cutting gas and in other process applications. In the agricultural market, propane is primarily used for tobacco curing, crop drying, poultry breeding and weed control.
The retail propane distribution industry is highly competitive, and is generally serviced by large multi-state full-service distributors and small local independent distributors. Like the home heating oil industry, each retail propane distribution provider operates in its own competitive environment because propane distributors typically reside in close proximity to their customers. In most retail propane distribution markets, customers can choose from multiple distributors based on the quality of customer service, safety reputation and price.
It is common practice in our business to price our liquid products to customers based on a per gallon margin over wholesale costs. As a result, we believe distributors such as ourselves generally seek to maintain their per gallon margins by passing wholesale price increases through to customers, thus insulating their margins from the volatility in wholesale prices. However, distributors may be unable or unwilling to pass the entire product cost increases through to customers. In these cases, significant decreases in per gallon margins may result. The timing of cost pass-throughs can also significantly affect margins. (See Customers and Pricing for a discussion on the Partnership’s offerings)
Business Strategy
Our business strategy is to increase Adjusted EBITDA (See Item 6. Selected Historical Financial and Operating Data for a definition and history) and cash flow by effectively managing operations while growing and retaining our customer base as a retail distributor of home heating oil and propane and provider of ancillary products and services. The key elements of this strategy include the following:
Pursue select acquisitions Our senior management team has developed expertise in identifying acquisition opportunities and integrating acquired customers into our operations. We focus on acquiring profitable companies within and outside our current footprint.
We actively pursue home heating oil only companies, propane companies, dual fuel (home heating oil and propane) companies and selectively target motor fuels acquisitions, especially where they are operating in the markets we currently serve. The focus for our acquisitions is both within our current footprint, where we can leverage our existing operating structure to reduce costs, as well as outside of such areas if the target company is of adequate size to sustain profitability as a stand-alone operation. We have used this strategy to expand into several states over the past five years.
6
Table of Contents
Deliver superior customer service We are dedicated to providing the best customer service in our industry to maximize customer satisfaction and retention. We have created a specific department dedicated to training employees to provide superior and consistent service and to reduce gross customer losses. This effort is also supported, reinforced and monitored by our local management teams.
We also have planned a staggered implementation beginning in fiscal 2017 of various management and technological solutions to enhance the customer experience at most of our larger brands. These efforts include conducting enhanced customer satisfaction surveys, including transactional surveys that will provided almost immediate customer feedback, as well as providing our employees an enhanced customer service interface to enable them to provide answers and information to our customers more efficiently. Additionally, we have established a technical training committee to ensure that our field personnel are properly educated in using the latest technology in a safe and efficient manner.
Diversification of product and service offerings In addition to expanding our propane operations, we are focused on expanding our suite of related products and services. These offerings include, but are not limited to, the sales, service and installation of heating and air conditioning equipment, plumbing services, appliance repair, and standby home generators. In addition, we also repair and install natural gas heating systems. We place significant emphasis on growing a solid, credit-worthy customer base with a focus on recurring revenue in the form of annual service agreements.
We conduct customer surveys to gauge the awareness of our product and service offerings, the satisfaction with those services if utilized and the potential for future opportunities. Realizing we have been known primarily as a home heating oil provider, we are in the process of repositioning our larger brands to reflect a broader range of products and services and enable us to leverage our existing organizational structure and improve our sales penetration with current and potential customers.
Geographic expansion We utilize census-based demographic data as well as local field expertise to target areas contiguous to our geographic footprint for organic expansion in a strategic manner. We then operate in such areas using a combination of existing logistical resources and personnel and, if warranted by the business demands or opportunity, adding locations.
We grow the business utilizing advertising and marketing initiatives to expand our presence while building an effective marketing database of prospects and customers.
Seasonality
Our fiscal year ends on September 30. All references to quarters and years respectively in this document are to fiscal quarters and years unless otherwise noted. The seasonal nature of our business results in the sale of approximately 30% of our volume of home heating oil and propane in the first fiscal quarter and 50% of our volume in the second fiscal quarter of each fiscal year, the peak heating season. As a result, we generally realize net income in our first and second fiscal quarters and net losses during our third and fourth fiscal quarters and we expect that the negative impact of seasonality on our third and fourth fiscal quarter operating results will continue. In addition, sales volume typically fluctuates from year to year in response to variations in weather, wholesale energy prices and other factors.
Degree Day
A “degree day” is an industry measurement of temperature designed to evaluate energy demand and consumption. Degree days are based on how far the average daily temperature departs from 65°F. Each degree of temperature above 65°F is counted as one cooling degree day, and each degree of temperature below 65°F is counted as one heating degree day. Degree days are accumulated each day over the course of a year and can be compared to a monthly or a multi-year average to see if a month or a year was warmer or cooler than usual. Degree days are officially observed by the National Weather Service.
Every ten years, the National Oceanic and Atmospheric Administration (“NOAA”) computes and publishes average meteorological quantities, including the average temperature for the last 30 years by geographical location, and the corresponding degree days. The latest and most widely used data covers the years from 1981 to 2010. Our calculations of normal weather are based on these published 30 year averages for heating degree days, weighted by volume for the locations where we have existing operations.
Competition
Most of our operating locations compete with numerous distributors, primarily on the basis of price, reliability of service and response to customer needs. Each such location operates in its own competitive environment.
7
Table of Contents
We compete with distributors offering a broad range of services and prices, from full-service distributors, such as ourselves, to those offering delivery only. As do many companies in our business, we provide home heating and propane equipment repair service on a 24-hour-a-day, seven-day-a-week, 52 weeks a year basis. We believe that this level of service tends to help build customer loyalty. In some instances homeowners have formed buying cooperatives that seek a lower price than individual customers are otherwise able to obtain. Our business competes for retail customers with suppliers of alternative energy products, principally natural gas, propane (in the case of our home heating oil operations) and electricity.
Customer Attrition
We measure net customer attrition for our full service residential and commercial home heating oil and propane customers. Net customer attrition is the difference between gross customer losses and customers added through marketing efforts. Customers added through acquisitions are not included in the calculation of gross customer gains. However, additional customers that are obtained through marketing efforts at newly acquired businesses are included in these calculations. Customer attrition percentage calculations include customers added through acquisitions in the denominators of the calculations on a weighted average basis. Gross customer losses are the result of a number of factors, including price competition, move outs, credit losses and conversions to natural gas. (See Item 7. Management’s Discussion and Analysis of Financial Condition and Results of Operations – Customer Attrition.)
Customers and Pricing
Our full service home heating oil customer base is comprised of 96% residential customers and 4% commercial customers. Our residential customer receives on average 165 gallons per delivery and our commercial accounts receive on average 325 gallons per delivery. Typically, we make four to six deliveries per customer per year. Approximately 96% of our full service residential and commercial home heating oil customers have their deliveries scheduled automatically and 4% of our home heating oil customer base call from time to time to schedule a delivery. Automatic deliveries are scheduled based on each customer’s historical consumption pattern and prevailing weather conditions. Our practice is to bill customers promptly after delivery. We also offer a balanced payment plan in which a customer’s estimated annual oil purchases and service contract fees are paid for in a series of equal monthly payments. Approximately 37% of our residential home heating oil customers have selected this billing option.
We offer several pricing alternatives to our residential home heating oil customers. Our variable pricing program allows the price to float with the home heating oil market and other factors. In addition, we offer price-protected programs, which establish either a ceiling or a fixed price per gallon that the customer pays over a defined period. The following chart depicts the percentage of the pricing plans selected by our residential home heating oil customers as of the end of the fiscal year.
| September 30, | ||||||||||||||||||||
| 2016 | 2015 | 2014 | 2013 | 2012 | ||||||||||||||||
| Variable |
54.6 | % | 51.4 | % | 53.5 | % | 53.1 | % | 54.7 | % | ||||||||||
| Ceiling |
40.8 | % | 43.9 | % | 40.8 | % | 42.3 | % | 40.5 | % | ||||||||||
| Fixed |
4.6 | % | 4.7 | % | 5.7 | % | 4.6 | % | 4.8 | % | ||||||||||
|
|
|
|
|
|
|
|
|
|
|
|||||||||||
| 100.0 | % | 100.0 | % | 100.0 | % | 100.0 | % | 100.0 | % | |||||||||||
|
|
|
|
|
|
|
|
|
|
|
|||||||||||
Sales to residential customers ordinarily generate higher per gallon margins than sales to commercial customers. Due to greater price sensitivity, our own internal marketing efforts, and hedging costs of residential price-protected customers, the per gallon margins realized from price-protected customers generally are less than from variable priced residential customers.
Derivatives
We use derivative instruments in order to mitigate our exposure to market risk associated with the purchase of home heating oil for our price-protected customers, physical inventory on hand, inventory in transit and priced purchase commitments. Currently, the Partnership’s derivative instruments are with the following counterparties: Bank of America, N.A., Bank of Montreal, Cargill, Inc., Citibank, N.A., JPMorgan Chase Bank, N.A., Key Bank, N.A., Munich Re Trading LLC, Regions Financial Corporation, Societe Generale, and Wells Fargo Bank, N.A.
The Financial Accounting Standards Board (“FASB”) Accounting Standards Codification (“ASC”) 815-10-05, Derivatives and Hedging, requires that derivative instruments be recorded at fair value and included in the consolidated balance sheet as assets or liabilities. To the extent derivative instruments designated as cash flow hedges are effective, as defined under this guidance, changes in fair value are recognized in other comprehensive income until the forecasted hedged item is recognized in earnings. We have elected not to designate our derivative instruments as hedging instruments under this guidance, and as a result, the changes in fair value of the derivative instruments during the holding period are recognized in our statement of operations. Therefore, we experience volatility in earnings as outstanding derivative instruments are marked to market and non-cash gains and losses are recorded prior to the sale of the commodity to the customer. The volatility in any given period related to unrealized non-cash gains or losses on derivative instruments can be significant to our overall results. However, we ultimately expect those gains and losses to be offset by the cost of product when purchased. Depending on the risk being hedged, realized gains and losses are recorded in cost of product, cost of installations and services, or delivery and branch expenses.
8
Table of Contents
Suppliers and Supply Arrangements
We purchase our product for delivery in either barge, pipeline or truckload quantities, and as of September 30, 2016 had contracts with approximately 80 third-party terminal sites for the right to temporarily store petroleum products at their facilities. Home heating oil and propane purchases are made under supply contracts or on the spot market. We have entered into market price based contracts for approximately 85% of our expected home heating oil and propane requirements for the fiscal 2017 heating season. We also have market price based contracts for approximately 36% of our expected diesel and gasoline requirements for fiscal 2017.
During fiscal 2016, Global Companies LLC and NIC Holding Corp. provided approximately 13% and 8%, respectively, of our petroleum product purchases. No other single supplier provided more than 8% of our product supply during fiscal 2016. For fiscal 2017, we generally have supply contracts for similar quantities with Global Companies LLC and NIC Holding Corp. Supply contracts typically have terms of 6 to 12 months. All of the supply contracts provide for minimum quantities and in most cases do not establish in advance the price of home heating oil or propane. This price is based upon a published market index price at the time of delivery or pricing date plus an agreed upon differential. We believe that our policy of contracting for the majority of our anticipated supply needs with diverse and reliable sources will enable us to obtain sufficient product should unforeseen shortages develop in worldwide supplies.
Home Heating Oil Price Volatility
In recent years, the wholesale price of home heating oil has been extremely volatile, resulting in increased consumer sensitivity to heating costs and possibly increased gross customer attrition. Like any other market commodity, the price of home heating oil is generally impacted by many factors, including economic and geopolitical forces. The price of home heating oil is closely linked to the price refiners pay for crude oil, which is the principal cost component of home heating oil. The volatility in the wholesale cost of home heating oil, as measured by the New York Mercantile Exchange (“NYMEX”) price per gallon for the fiscal years ended September 30, 2012 through 2016, on a quarterly basis, is illustrated by the following chart:
| Fiscal 2016 (1) | Fiscal 2015 (1) | Fiscal 2014 (1) | Fiscal 2013 (1) | Fiscal 2012 | ||||||||||||||||||||||||||||||||||||
| Low | High | Low | High | Low | High | Low | High | Low | High | |||||||||||||||||||||||||||||||
| Quarter Ended |
||||||||||||||||||||||||||||||||||||||||
| December 31 |
$ | 1.08 | $ | 1.61 | $ | 1.85 | $ | 2.66 | $ | 2.84 | $ | 3.12 | $ | 2.90 | $ | 3.26 | $ | 2.72 | $ | 3.17 | ||||||||||||||||||||
| March 31 |
0.87 | 1.26 | 1.62 | 2.30 | 2.89 | 3.28 | 2.86 | 3.24 | 2.99 | 3.32 | ||||||||||||||||||||||||||||||
| June 30 |
1.08 | 1.57 | 1.68 | 2.02 | 2.85 | 3.05 | 2.74 | 3.09 | 2.53 | 3.25 | ||||||||||||||||||||||||||||||
| September 30 |
1.26 | 1.53 | 1.38 | 1.84 | 2.65 | 2.98 | 2.87 | 3.21 | 2.68 | 3.24 | ||||||||||||||||||||||||||||||
| (1) | Beginning April 1, 2013, the NYMEX contract specifications were changed from high sulfur home heating oil to ultra low sulfur diesel. Ultra low sulfur diesel is similar in composition to ultra low sulfur home heating oil. |
Acquisitions
Part of our business strategy is to pursue select acquisitions. During fiscal 2016, the Partnership acquired a heating oil dealer, a motor fuel dealer, and two propane dealers with an aggregate of approximately 3,300 home heating oil and propane accounts for an aggregate purchase price of approximately $9.8 million. The gross purchase price was allocated $7.4 million to intangible assets, $2.5 million to fixed assets and reduced by $0.1 million for working capital credits. Each acquired company’s operating results are included in the Partnership’s consolidated financial statements starting on its acquisition date. Customer lists, other intangibles and trade names are amortized on a straight-line basis over seven to twenty years.
During fiscal 2015, the Partnership acquired three heating oil and propane dealers (with one dealer also having motor fuel accounts) with approximately 23,300 home heating oil and propane accounts for an aggregate purchase price of approximately $20.8 million. The gross purchase price was allocated $21.8 million to intangible assets, $2.5 million to fixed assets and reduced by $3.5 million for working capital credits.
9
Table of Contents
During fiscal 2014, the Partnership acquired three heating oil dealers with approximately 51,000 home heating oil and propane accounts for an aggregate purchase price of approximately $98.5 million (including the $97.7 million acquisition of Griffith Energy Services, Inc.). The gross purchase price was allocated $53.7 million to intangible assets, $17.6 million to fixed assets and $27.2 million to working capital (net of $4.2 million of cash acquired).
Employees
As of September 30, 2016, we had 3,140 employees, of whom 892 were office, clerical and customer service personnel; 922 were equipment technicians; 491 were fuel delivery drivers and mechanics; 484 were management and 351 were employed in sales. Of these employees 1,285 (41%) are represented by 57 different collective bargaining agreements with local chapters of labor unions. Due to the seasonal nature of our business and depending on the demands of the 2017 heating season, we anticipate that we will augment our current staffing levels during the heating season from among the 374 employees on temporary leave of absence as of September 30, 2016. One collective bargaining agreement, covering approximately 14 employees, expired after September 30, 2016, and 19 more collective bargaining agreements will come up for renewal in fiscal 2017, covering approximately 544 employees (17%). We believe that our relations with both our union and non-union employees are generally satisfactory.
Government Regulations
We are subject to various federal, state and local environmental, health and safety laws and regulations. Generally, these laws impose limitations on the discharge or emission of pollutants and establish standards for the handling of solid and hazardous wastes. These laws include the Resource Conservation and Recovery Act, the Comprehensive Environmental Response, Compensation and Liability Act (“CERCLA”), the Clean Air Act, the Occupational Safety and Health Act, the Emergency Planning and Community Right to Know Act, the Clean Water Act, the Oil Pollution Act, and comparable state statutes. CERCLA, also known as the “Superfund” law, imposes joint and several liabilities without regard to fault or the legality of the original conduct on certain classes of persons that are considered to have contributed to the release or threatened release of a hazardous substance into the environment. Products stored and/or delivered by us and certain automotive waste products generated by our fleet are hazardous substances within the meaning of CERCLA or otherwise subject to investigation and cleanup under other environmental laws and regulations. While we are currently not involved with any material CERCLA claims, and we have implemented programs and policies designed to address potential liabilities and costs under applicable environmental laws and regulations, failure to comply with such laws and regulations could result in civil or criminal penalties or injunctive relief in cases of non-compliance or impose liability for remediation costs.
We have incurred and continue to incur costs to address soil and groundwater contamination at some of our locations, including legacy contamination at properties that we have acquired. A number of our properties are currently undergoing remediation, in some instances funded by prior owners or operators contractually obligated to do so. To date, no material issues have arisen with respect to such prior owners or operators addressing such remediation, although there is no assurance that this will continue to be the case. In addition, we have been subject to proceedings by regulatory authorities for alleged violations of environmental and safety laws and regulations. We do not expect any of these liabilities or proceedings of which we are aware to result in material costs to, or disruptions of, our business or operations.
Transportation of our products by truck are subject to regulations promulgated under the Federal Motor Carrier Safety Act. These regulations cover the transportation of hazardous materials and are administered by the United States Department of Transportation or similar state agencies. Several of our oil terminals are governed under the United States Coast Guard operations Oversite, Federal OPA 90 FRP programs and Federal Spill Prevention Control and Countermeasure programs. All of our propane bulk terminals are governed under Homeland Security Chemical Facility Anti-Terrorism Standards programs. We conduct ongoing training programs to help ensure that our operations are in compliance with applicable regulations. We maintain various permits that are necessary to operate some of our facilities, some of which may be material to our operations.
| ITEM 1A. | RISK FACTORS |
You should consider carefully the risk factors discussed below, as well as all other information, as an investment in the Partnership involves a high degree of risk. We are subject to certain risks and hazards due to the nature of the business activities we conduct. The risks discussed below, any of which could materially and adversely affect our business, financial condition, cash flows, and results of operations, could result in a partial or total loss of your investment, and are not the only risks we face. We may experience additional risks and uncertainties not currently known to us or, as a result of developments occurring in the future, conditions that we currently deem to be immaterial may also materially and adversely affect our business, financial condition, cash flows and results of operations.
10
Table of Contents
Our operating results will be adversely affected if we continue to experience significant net customer attrition in our home heating oil and propane customer base.
The following table depicts our gross customer gains, gross customer losses and net customer attrition from fiscal year 2012 to fiscal year 2016. Net customer attrition is the difference between gross customer losses and customers added through marketing efforts. Customers added through acquisitions are not included in the calculation of gross customer gains. However, additional customers that are obtained through marketing efforts at newly acquired businesses are included in these calculations. Customer attrition percentage calculations include customers added through acquisitions in the denominators of the calculations on a weighted average basis.
| Fiscal Year Ended September 30, | ||||||||||||||||||||
| 2016 | 2015 | 2014 | 2013 | 2012 | ||||||||||||||||
| Gross customer gains |
12.1 | % | 14.6 | % | 16.0 | % | 14.8 | % | 13.4 | % | ||||||||||
| Gross customer losses |
17.2 | % | 16.4 | % | 16.9 | % | 18.1 | % | 18.3 | % | ||||||||||
|
|
|
|
|
|
|
|
|
|
|
|||||||||||
| Net attrition |
(5.1 | %) | (1.8 | %) | (0.9 | %) | (3.3 | %) | (4.9 | %) | ||||||||||
|
|
|
|
|
|
|
|
|
|
|
|||||||||||
The gain of a new customer does not fully compensate for the loss of an existing customer because of the expenses incurred during the first year to add a new customer. Typically, the per gallon margin realized from a new account added is less than the margin of a customer that switches to another provider. Customer losses are the result of various factors, including but not limited to:
| • | price competition; |
| • | customer relocations and home sales/foreclosures; |
| • | conversions to natural gas; and |
| • | credit worthiness. |
The continuing volatility in the energy markets can intensify price competition and add to our difficulty in reducing net customer attrition. Warmer than normal weather can also contribute to an increase in attrition as customers perceive less need for a full service provider like ourselves.
If we are not able to reduce the current level of net customer attrition or if such level should increase, attrition will have a material adverse effect on our business, operating results and cash available for distributions to unitholders. For additional information about customer attrition, see Item 7 “Management’s Discussion and Analysis of Financial Condition and Results of Operations – Customer Attrition.”
Because of the highly competitive nature of our business, we may not be able to retain existing customers or acquire new customers, which would have an adverse impact on our business, operating results and financial condition.
Our business is subject to substantial competition. Most of our operating locations compete with numerous distributors, primarily on the basis of price, reliability of service and responsiveness to customer service needs. Each operating location operates in its own competitive environment.
We compete with distributors offering a broad range of services and prices, from full-service distributors, such as ourselves, to those offering delivery only. As do many companies in our business, we provide home heating equipment repair service on a 24-hour-a-day, seven-day-a-week, 52 weeks a year basis. We believe that this tends to build customer loyalty. In some instances homeowners have formed buying cooperatives that seek to purchase home heating oil from distributors at a price lower than individual customers are otherwise able to obtain. We also compete for retail customers with suppliers of alternative energy products, principally natural gas, propane (in the case of our home heating oil operations) and electricity. If we are unable to compete effectively, we may lose existing customers and/or fail to acquire new customers, which would have a material adverse effect on our business, operating results and financial condition.
Based on data in the 2010 United States Census, from 2000 to 2010 it appears that heating oil customer conversions to natural gas in the states where we do business averaged from under 1% to over 3% per year.
11
Table of Contents
The following table depicts our estimated customer losses to natural gas conversions for the last five fiscal years. We believe conversions will continue as natural gas has become less expensive than home heating oil on an equivalent BTU basis. In addition, certain states encourage homeowners to expand the use of natural gas as a heating fuel through legislation and regulatory efforts.
| Fiscal Year Ended September 30, | ||||||||||||||||||||
| 2016 | 2015 | 2014 | 2013 | 2012 | ||||||||||||||||
| Customer losses to natural gas conversion |
(1.3 | )% | (1.6 | )% | (2.2 | )% | (2.4 | )% | (2.0 | )% | ||||||||||
In addition to our direct customer losses to natural gas competition, any conversion to natural gas by a heating oil consumer in our geographic footprint reduces the pool of available customers from which we can gain new heating oil customers, and could have a material adverse effect on our business, operating results and financial condition.
Energy efficiency and new technology may reduce the demand for our products and adversely affect our operating results.
Increased conservation and technological advances, including installation of improved insulation and the development of more efficient furnaces and other heating devices, have adversely affected the demand for our products by retail customers. Future conservation measures or technological advances in heating, conservation, energy generation or other devices might reduce demand and adversely affect our operating results.
If we do not make acquisitions on economically acceptable terms, our future growth will be limited.
Generally, heating oil and propane are alternative energy sources to new housing construction, because natural gas is usually selected when natural gas infrastructure exists. In certain geographies, utilities are building out their natural gas infrastructure. As such, our industry is not a growth industry. Accordingly, future growth will depend on our ability to make acquisitions on economically acceptable terms. We cannot assure that we will be able to identify attractive acquisition candidates in our sector in the future or that we will be able to acquire businesses on economically acceptable terms. Factors that may adversely affect our operating and financial results may limit our access to capital and adversely affect our ability to make acquisitions. Under the terms of our third amended and restated credit agreement that we sometimes refer to in this Report as our credit agreement, we are restricted from making any individual acquisition in excess of $25.0 million without the lenders’ approval. In addition, to make an acquisition, we are required to have Availability (as defined in our credit agreement) of at least $40.0 million, on a historical pro forma and forward-looking basis. Furthermore, as long as the bank term loan is outstanding, we must be in compliance with the senior secured leverage ratio (as defined in our credit agreement). These covenant restrictions may limit our ability to make acquisitions. Any acquisition may involve potential risks to us and ultimately to our unitholders, including:
| • | an increase in our indebtedness; |
| • | an increase in our working capital requirements; |
| • | an inability to integrate the operations of the acquired business; |
| • | an inability to successfully expand our operations into new territories; |
| • | the diversion of management’s attention from other business concerns; |
| • | an excess of customer loss or loss of key employees from the acquired business; |
| • | loss of key employees from the acquired business; and |
| • | the assumption of additional liabilities including environmental liabilities. |
In addition, acquisitions may be dilutive to earnings and distributions to unitholders, and any additional debt incurred to finance acquisitions may, among other things, affect our ability to make distributions to our unitholders.
High product prices can lead to customer conservation and attrition, resulting in reduced demand for our products.
Prices for our products are subject to volatile fluctuations in response to changes in supply and other market conditions. During periods of high product costs our prices generally increase. High prices can lead to customer conservation and attrition, resulting in reduced demand for our products.
12
Table of Contents
A significant portion of our home heating oil volume is sold to price-protected customers (ceiling and fixed) and our gross margins could be adversely affected if we are not able to effectively hedge against fluctuations in the volume and cost of product sold to these customers.
A significant portion of our home heating oil volume is sold to individual customers under an arrangement pre-establishing the ceiling sales price or a fixed price of home heating oil over a fixed period. When the customer makes a purchase commitment for the next period we currently purchase option contracts, swaps and futures contracts for a substantial majority of the heating oil that we expect to sell to these price-protected customers. The amount of home heating oil volume that we hedge per price-protected customer is based upon the estimated fuel consumption per average customer, per month. If the actual usage exceeds the amount of the hedged volume on a monthly basis, we could be required to obtain additional volume at unfavorable margins. In addition, should actual usage in any month be less than the hedged volume, (including, for example, as a result of early terminations by fixed price customers) our hedging losses could be greater. Currently, we have elected not to designate our derivative instruments as hedging instruments under FASB ASC 815-10-05 Derivatives and Hedging, and the change in fair value of the derivative instruments is recognized in our statement of operations. Therefore, we experience volatility in earnings as these currently outstanding derivative contracts are marked to market and non-cash gains or losses are recorded in the statement of operations.
Our risk management policies cannot eliminate all commodity risk, basis risk, or the impact of adverse market conditions which can adversely affect our financial condition, results of operations and cash available for distribution to our unitholders. In addition, any noncompliance with our risk management policies could result in significant financial losses.
While our hedging policies are designed to minimize commodity risk, some degree of exposure to unforeseen fluctuations in market conditions remains. For example, we change our hedged position daily in response to movements in our inventory. Any difference between the estimated future sales from inventory and actual sales will create a mismatch between the amount of inventory and the hedges against that inventory, and thus change the commodity risk position that we are trying to maintain. Also, significant increases in the costs of the products we sell can materially increase our costs to carry inventory. We use our revolving credit facility as our primary source of financing to carry inventory and may be limited on the amounts we can borrow to carry inventory. Basis risk describes the inherent market price risk created when a commodity of certain grade or location is purchased, sold or exchanged as compared to a purchase, sale or exchange of a like commodity at a different time or place. Transportation costs and timing differentials are components of basis risk. For example, we use the NYMEX to hedge our commodity risk with respect to pricing of energy products traded on the NYMEX. Physical deliveries under NYMEX contracts are made in New York Harbor. To the extent we take deliveries in other ports, such as Boston Harbor, we may have basis risk. In a backward market (when prices for future deliveries are lower than current prices), basis risk is created with respect to timing. In these instances, physical inventory generally loses value as basis declines over time. Basis risk cannot be entirely eliminated, and basis exposure, particularly in backward or other adverse market conditions, can adversely affect our financial condition, results of operations and cash available for distribution to our unitholders.
We monitor processes and procedures to reduce the risk of unauthorized trading and to maintain substantial balance between purchases and sales or future delivery obligations. We can provide no assurance, however, that these steps will detect and/or prevent all violations of such risk management policies and procedures, particularly if deception or other intentional misconduct is involved.
Since weather conditions may adversely affect the demand for home heating oil and propane, our business, operating results and financial condition are vulnerable to warm winters.
Weather conditions in the Northeast and Mid-Atlantic regions in which we operate have a significant impact on the demand for home heating oil and propane because our customers depend on this product principally for space heating purposes. As a result, weather conditions may materially adversely impact our business, operating results and financial condition. During the peak-heating season of October through March, sales of home heating oil and propane historically have represented approximately 80% of our annual oil volume. Actual weather conditions can vary substantially from year to year or from month to month, significantly affecting our financial performance. Warmer than normal temperatures in one or more regions in which we operate can significantly decrease the total volume we sell and the gross profit realized and, consequently, our results of operations. In fiscal years 2016, 2012 and 2002 temperatures were significantly warmer than normal for the areas in which we sell our products, which adversely affected the amount of net income, EBITDA and Adjusted EBITDA that we generated during these periods.
To partially mitigate the adverse effect of warm weather on cash flows, we have used weather hedge contracts for a number of years. In general, such weather hedge contracts provide that we are entitled to receive a specific payment per heating degree-day shortfall, when the total number of heating degree-days in the hedge period is less than approximately 92.5% of the ten year average (the “Payment Threshold”). The hedge generally covers the period from November 1, through March 31, of a fiscal year taken as a whole, and has a maximum payout amount. For example, temperatures in fiscal years 2016 and 2012, taken as a whole met the Payment Threshold, and the heating degree-day shortfall during these periods resulted in our receiving the full $12.5 million payout, which was recorded as a reduction of expenses in the line item delivery and branch expenses in the statements of operations.
13
Table of Contents
For fiscal year 2017 and 2018 we have a weather hedge contract with Swiss Re under which we are entitled to receive a payment of $35,000 per heating degree-day shortfall, when the total number of heating degree-days in the hedge period is less than approximately 92.5% of the ten year average, the Payment Threshold. The hedge covers the period from November 1, through March 31, taken as a whole, for each respective fiscal year, and has a maximum payout of $12.5 million for each respective fiscal year. However, there can be no assurance that such weather hedge contract would fully or substantially offset the adverse effects of warmer weather on our business and operating results during such period.
Failure to effectively estimate employer-sponsored health insurance premiums and incremental costs due to the Affordable Healthcare Act could materially and adversely affect the Company’s financial condition, results of operations, and cash flows.
In March 2010, the United States federal government enacted comprehensive health care reform legislation, which, among other things, includes guaranteed coverage requirements, eliminates pre-existing condition exclusions and annual and lifetime maximum limits, restricts the extent to which policies can be rescinded, and imposes new taxes on health insurers, self-insured companies, and health care benefits. The legislation imposes implementation effective dates that began in 2010 and extend through 2020 with many of the changes requiring additional guidance from federal agencies and regulations. Possible adverse effects could include increased costs, exposure to expanded liability, and requirements for us to revise the ways in which healthcare and other benefits are provided to employees. Such future higher costs could have a material adverse effect on our financial condition, results of operations, and cash flows.
Our obligation to fund multi-employer pension plans to which we contribute may have an adverse impact on us.
We participate in a number of multi-employer pension plans for current and former union employees covered under collective bargaining agreements. The risks of participating in multi-employer plans are different from single-employer plans in that assets contributed are pooled and may be used to provide benefits to current and former employees of other participating employers. Several factors could require us to make significantly higher future contributions to these plans, including the funding status of the plan, unfavorable investment performance, insolvency or withdrawal of participating employers, changes in demographics and increased benefits to participants. Several of these multi-employer plans to which we contribute are underfunded, meaning that the value of such plans’ assets are less than the actuarial value of the plans’ benefit obligations.
We may be subject to additional liabilities imposed by law as a result of our participation in multi-employer defined benefit pension plans. Various Federal laws impose certain liabilities upon an employer who is a contributor to a multi-employer pension plan if the employer withdraws from the plan or the plan is terminated or experiences a mass withdrawal, potentially including an allocable share of the unfunded vested benefits in the plan for all plan participants, not just our retirees. Accordingly, we could be assessed our share of unfunded liabilities should we terminate participation in these plans, or should there be a mass withdrawal from these plans, or if the plans become insolvent or otherwise terminate.
While we currently have no intention of permanently terminating our participation in or otherwise withdrawing from any underfunded multi-employer pension plan, there can be no assurance that we will not be required to record material withdrawal liabilities or be required to make material cash contributions in the future to one or more underfunded plans, whether as a result of withdrawing from a plan, or of agreeing to any alternate funding option, or due to any of the other risks associated with being a participating employer in an underfunded plan. Any of these events could negatively impact our liquidity and financial results.
We rely on the continued solvency of our derivatives, insurance and weather hedge counterparties.
If counterparties to the derivative instruments that we use to hedge the cost of home heating oil sold to price-protected customers, physical inventory and our vehicle fuel costs were to fail, our liquidity, operating results and financial condition could be materially adversely impacted, as we would be obligated to fulfill our operational requirement of purchasing, storing and selling home heating oil and vehicle fuel, while losing the mitigating benefits of economic hedges with a failed counterparty. If one of our insurance carriers were to fail, our liquidity, results of operations and financial condition could be materially adversely impacted, as we would have to fund any catastrophic loss. If our weather hedge counterparty were to fail, we would lose the protection of our weather hedge contract. Currently, we have outstanding derivative instruments with the following counterparties: Bank of America, N.A., Bank of Montreal, Cargill, Inc., Citibank, N.A., JPMorgan Chase Bank, N.A., Key Bank, N.A., Munich Re Trading LLC, Regions Financial Corporation, Societe Generale, and Wells Fargo Bank, N.A. Our primary insurance carriers are American International Group, Federated Mutual Insurance Company, our captive insurance subsidiary, Woodbury Insurance Co., Inc., and our weather hedge counterparties which are subsidiaries of Swiss Re.
14
Table of Contents
Our operating results are subject to seasonal fluctuations.
Our operating results are subject to seasonal fluctuations since the demand for home heating oil and propane is greater during the first and second fiscal quarter of our fiscal year, which is the peak heating season. The seasonal nature of our business has resulted on average in the last five years in the sale of approximately 30% of our volume of home heating oil and propane in the first fiscal quarter and 50% of our volume in the second fiscal quarter of each fiscal year. As a result, we generally realize net income in our first and second fiscal quarters and net losses during our third and fourth fiscal quarters and we expect that the negative impact of seasonality on our third and fourth fiscal quarter operating results will continue. Thus any material reduction in the profitability of the first and second quarters for any reason, including warmer than normal weather, generally cannot be made up by any significant profitability improvements in the results of the third and fourth quarters.
Our substantial debt and other financial obligations could impair our financial condition and our ability to obtain additional financing and have a material adverse effect on us if we fail to meet our financial and other obligations.
At September 30, 2016, we had outstanding under our credit agreement a $92.5 million term loan due July 2020. In addition, under the revolver portion of our credit agreement which expires in July 2020, we had no borrowings, but $50.6 million of letters of credit were issued, $0.3 million of hedge positions were secured, and availability was $163.4 million. During the last three fiscal years we have utilized as much as $253.8 million of our credit agreement in borrowings, letters of credit and hedging reserve. Our substantial indebtedness and other financial obligations could:
| • | impair our ability to obtain additional financing in the future for working capital, capital expenditures, acquisitions, unit repurchases or general partnership purposes; |
| • | have a material adverse effect on us if we fail to comply with financial and affirmative and restrictive covenants in our debt agreements and an event of default occurs that is not cured or waived; |
| • | require us to dedicate a substantial portion of our cash flow for principal and interest payments on our indebtedness and other financial obligations, thereby reducing the availability of our cash flow to fund working capital and capital expenditures; |
| • | expose us to interest rate risk because certain of our borrowings are at variable rates of interest; |
| • | limit our flexibility in planning for, or reacting to, changes in our business and the industry in which we operate; and |
| • | place us at a competitive disadvantage compared to our competitors that have proportionally less debt. |
If we are unable to meet our debt service obligations and other financial obligations, we could be forced to restructure or refinance our indebtedness and other financial transactions, seek additional equity capital or sell our assets. We might then be unable to obtain such financing or capital or sell our assets on satisfactory terms, if at all.
Increases in wholesale product costs may have adverse effects on our business, financial condition and results of operations.
Increases in wholesale product costs may have adverse effects on our business, financial condition and results of operations, including the following:
| • | customer conservation or attrition due to customers converting to lower cost heating products or suppliers; |
| • | reduced liquidity as a result of higher receivables, and/or inventory balances as we must fund a portion of any increase in receivables, inventory and hedging costs from our own resources, thereby tying up funds that would otherwise be available for other purposes; |
| • | higher bad debt expense and credit card processing costs as a result of higher selling prices; |
| • | higher interest expense as a result of increased working capital borrowing to finance higher receivables and/or inventory balances; and |
| • | higher vehicle fuel costs. |
15
Table of Contents
Volatility in wholesale energy costs may adversely affect our liquidity.
Our business requires a significant amount of working capital to finance accounts receivable and inventory during the heating season. Under our revolving credit facility, we may borrow up to $300 million, which increases to $450 million during the peak winter months from December through April of each fiscal year. We are obligated to meet certain financial covenants under our credit agreement, including the requirement to maintain at all times either excess availability (borrowing base less amounts borrowed and letters of credit issued) of 12.5% of the revolving credit commitment then in effect or a fixed charge coverage ratio (as defined in our credit agreement) of not less than 1.1. In addition, as long as our term loan is outstanding, our senior secured leverage ratio cannot at any time be more than 3.0 as calculated during the quarters ending June or September, and cannot at any time be more than 4.5 as calculated during the quarters ending December or March.
If increases in wholesale product costs cause our working capital requirements to exceed the amounts available under our revolving credit facility or should we fail to maintain the required availability or fixed charge coverage ratio, we would not have sufficient working capital to operate our business, which could have a material adverse effect on our financial condition and results of operations.
We purchase synthetic call options from and enter into forward swaps with members of our lending group to manage market risk associated with our commitments to our customers, our physical inventory and fuel we use for our vehicles. These institutions have not required an initial cash margin deposit or any mark to market maintenance margin for these derivatives. Any mark to market exposure reduces our borrowing base and can thus reduce the amount available to us under our credit agreement. The highest mark to market reserve against our borrowing base for these derivative instruments with our lending group was $25.2 million, $28.9 million, and $14.9 million, during fiscal years 2016, 2015, and 2014, respectively.
We also purchase call options to hedge the price of the products to be sold to our price-protected customers which usually require us to pay an upfront cash payment. This reduces our liquidity, as we must pay for the option before any sales are made to the customer. We also purchase synthetic call options which require us to pay for these options as they expire.
For certain of our supply contracts, we are required to establish the purchase price in advance of receiving the physical product. This occurs at the end of the month and is usually 20 days prior to receipt of the product. We use futures contracts or swaps to “short” the purchase commitment such that the commitment floats with the market. As a result, any upward movement in the market for home heating oil would reduce our liquidity, as we would be required to post additional cash collateral for a futures contract or our availability to borrow under our credit agreement would be reduced in the case of a swap.
At December 31, 2016, we expect to have approximately 30 million gallons of priced purchase commitments and physical inventory hedged with a futures contract or swap. If the wholesale price of heating oil increased $1.00 per gallon, our near term liquidity in December would be reduced by $30 million.
At September 30, 2016, we had approximately 138,000 customers, or 37% of our residential customer base, on the balanced payment plan in which a customer’s estimated annual oil purchases and service contract fees are paid for in a series of equal monthly payments. Volatility in wholesale prices could reduce our liquidity if we failed to recalculate the balanced payments on a timely basis or if customers resist higher balanced payments. These customers could possibly owe us more in the future than we had budgeted. Generally, customer credit balances are at their low point after the end of the heating season and at their peak prior to the beginning of the heating season.
Sudden and sharp oil price increases that cannot be passed on to customers may adversely affect our operating results.
Our industry is a “margin-based” business in which gross profit depends on the excess of sales prices per gallon over supply costs per gallon. Consequently, our profitability is sensitive to changes in the wholesale product cost caused by changes in supply or other market conditions. These factors are beyond our control and thus, when there are sudden and sharp increases in the wholesale cost of home heating oil, we may not be able to pass on these increases to customers through increased retail sales prices. In an effort to retain existing accounts and attract new customers we may offer discounts, which will impact the net per gallon gross margin realized.
16
Table of Contents
Significant declines in the wholesale price of home heating oil may cause price-protected customers to renegotiate or terminate their arrangements which may adversely impact our gross profit and operating results.
When the wholesale price of home heating oil declines significantly after a customer enters into a price protection arrangement, some customers attempt to renegotiate their arrangement in order to enter into a lower cost pricing plan with us or terminate their arrangement and switch to a competitor. As a result of significant decreases in the price of home heating oil following the summer of 2008, many price-protected customers attempted to renegotiate their agreements with us in fiscal 2009. It is our policy to bill a termination fee when customers terminate their arrangement with us. We believe that approximately 10,000 customers terminated their relationship with us as a result of being billed the termination fee in fiscal 2009. Under our current price-protected programs, approximately 40.8% and 4.6% of our residential customers are respectively categorized as being either ceiling or fixed.
Economic conditions could adversely affect our results of operations and financial condition.
Uncertainty about economic conditions poses a risk as our customers may reduce or postpone spending in response to tighter credit, negative financial news and/or declines in income or asset values, which could have a material negative effect on the demand for our equipment and services and could lead to increased conservation, as we have seen certain of our customers seek lower cost providers. Any increase in existing customers or potential new customers seeking lower cost providers and/or increase in our rejection rate of potential accounts because of credit considerations could increase our overall rate of net customer attrition. In addition, we could experience an increase in bad debts from financially distressed customers, which would have a negative effect on our liquidity, results of operations and financial condition.
We are subject to operating and litigation risks that could adversely affect our operating results whether or not covered by insurance.
Our operations are subject to all operating hazards and risks normally incidental to handling, storing, transporting and otherwise providing customers with our products such as natural disasters, adverse weather, accidents, fires, explosions, hazardous materials releases, mechanical failures and other events beyond our control. If any of these events were to occur, we could incur substantial losses because of personal injury or loss of life, severe damage to and destruction of property and equipment, and pollution or other environmental damage resulting in curtailment or suspension of our related operations. As a result, we may be a defendant in legal proceedings and litigation arising in the ordinary course of business. The Partnership records a liability when it is probable that a loss has been incurred and the amount is reasonably estimable.
As we self-insure workers’ compensation, automobile and general liability claims up to pre-established limits, we establish reserves based upon expectations as to what our ultimate liability will be for claims based on our historical factors. We evaluate on an annual basis the potential for changes in loss estimates with the support of qualified actuaries. As of September 30, 2016, we had approximately $64.1 million of net insurance reserves and had issued $44.8 million in letters of credit for current and future claims. Other than matters for which we self-insure, we maintain insurance policies with insurers in amounts and with coverage and deductibles that we believe are reasonable and prudent.
However, there can be no assurance that the ultimate settlement of these claims will not differ materially from the assumptions used to calculate the reserves or that the insurance we maintain will be adequate to protect us from all material expenses related to potential future claims for remediation costs and personal and property damage or that these levels of insurance will be available in the future at economical prices, either of which could have a material effect on our results of operations. Further, certain types of claims may be excluded from our insurance coverage. If we were to incur substantial liability and the damages are not covered by insurance or are in excess of policy limits, or if we incur liability at a time when we are not able to obtain liability insurance, then our business, results of operations and financial condition could be materially adversely affected.
Our captive insurance company may not bring the benefits we expect.
Beginning October 1, 2016, we have elected to insure through a wholly-owned captive insurance company, Woodbury Insurance Co., Inc., certain self insured or deductible amounts. We continue to maintain our normal, historical, insurance policies with a third party insurer. In addition to certain business and operating benefits of having a captive insurance company, Star Gas expects to receive certain cash flow benefits related to the timing of the tax deduction related to these claims. Such expected cash tax timing benefits related to coverage provided by Woodbury Insurance Co., Inc. may not materialize, or any cash tax savings may not be as much as anticipated.
17
Table of Contents
Our results of operations and financial condition may be adversely affected by governmental regulation and associated environmental and regulatory costs.
Our business is subject to a wide range of federal, state and local laws and regulations related to environmental and other matters. Such laws and regulations have become increasingly stringent over time. Some state and local governments have enacted or are attempting to enact regulations and incentive programs encouraging the phase-out of the products that we sell in favor other types of fuels, such as natural gas. We may experience increased costs due to stricter pollution control requirements or liabilities resulting from noncompliance with operating or other regulatory permits. New regulations might adversely impact operations, including those relating to underground storage, transportation and delivery of the products that we sell. In addition, there are environmental risks inherently associated with home heating oil operations, such as the risks of accidental releases or spills. We have incurred and continue to incur costs to remediate soil and groundwater contamination at some of our locations. We cannot be sure that we have identified all such contamination, that we know the full extent of our obligations with respect to contamination of which we are aware, or that we will not become responsible for additional contamination not yet discovered. It is possible that material costs and liabilities will be incurred, including those relating to claims for damages to property and persons.
In addition, our financial condition, results of operations and ability to pay distributions to our unitholders may be negatively impacted by significant changes in federal and state tax law. For example, an increase in federal and state income tax rates will reduce the amount of cash to pay distributions.
There is increasing attention in the United States and worldwide concerning the issue of climate change and the effect of emissions of greenhouse gases (“GHG”), in particular from the combustion of fossil fuels. Federal, regional and state regulatory authorities in many jurisdictions have begun taking steps to regulate GHG emissions. For example in October 2015, the United States Environmental Protection Agency (“EPA”) issued its final “Clean Power Plan” for regulation of GHG emissions. Under the Clean Power Plan, the EPA will set state-specific goals for GHG emissions reductions, leaving the states with flexibility to determine how to achieve such goals. The Clean Power Plan is currently the subject of multiple judicial challenges and it is unclear what, if any, effect the results of the 2016 elections will have on the Clean Power Plan. But even if the Clean Power Plan is ultimately upheld by the courts, it is too early to predict how the states where we operate or from which we obtain our products will elect to control GHG emissions. Further, irrespective of federal legislation and regulation, individual states or cities may enact laws and regulations controlling GHG emissions. It is likely that any regulatory program that caps emissions or imposes a carbon tax will increase costs for us and our customers, which could lead to increased conservation or customers seeking lower cost alternatives. We cannot yet estimate the compliance costs or business impact of potential national, regional or state greenhouse gas emissions reduction legislation, regulations or initiatives, since many such programs and proposals are still in development.
Our operations would be adversely affected if service at our third-party terminals or on the common carrier pipelines used is interrupted.
The products that we sell are transported in either barge, pipeline or in truckload quantities to third-party terminals where we have contracts to temporarily store our products. Any significant interruption in the service of these third-party terminals or on the common carrier pipelines used would adversely affect our ability to obtain product.
The risk of global terrorism and political unrest may adversely affect the economy and the price and availability of the products that we sell and have a material adverse effect on our business, financial condition and results of operations.
Terrorist attacks and political unrest may adversely impact the price and availability of the products that we sell, our results of operations, our ability to raise capital and our future growth. The impact that the foregoing may have on our industry in general, and on our business in particular, is not known at this time. An act of terror could result in disruptions of crude oil supplies, markets and facilities, and the source of the products that we sell could be direct or indirect targets. Terrorist activity may also hinder our ability to transport our products if our normal means of transportation become damaged as a result of an attack. Instability in the financial markets as a result of terrorism could also affect our ability to raise capital. Terrorist activity could likely lead to increased volatility in the prices of our products.
The impact of hurricanes and other natural disasters could cause disruptions in supply and could also reduce the demand for the products that we sell, which would have a material adverse effect on our business, financial condition and results of operations.
Hurricanes and other natural disasters may cause disruptions in the supply chains for the products that we sell. Disruptions in supply could have a material adverse effect on our business, financial condition and results of operations, causing an increase in wholesale prices and a decrease in supply. Hurricanes and other natural disasters could also cause disruptions in the power grid, which could prevent our customers from operating their home heating oil systems, thereby reducing our sales. For example, on October 29, 2012, storm Sandy made landfall in our service area, resulting in widespread power outages that affected a number of our customers. Deliveries of home heating oil and propane were less than expected for certain of our customers who were without power for several weeks subsequent to storm Sandy.
18
Table of Contents
We depend on the use of information technology systems that could fail or be the target of cyber-attacks.
Our systems and networks are maintained internally and by third-party vendors, and their failure could significantly impede operations. In addition, our systems and networks, as well as those of our vendors, banks and counterparties, may receive and store personal/business information in connection with human resources operations, customer offerings, and other aspects of our business. A cyber-attack or material network breach in the security of these systems could include the theft of proprietary information or employee and customer information, as well as disrupt our operations or damage our facilities or those of third parties. This could have a material adverse effect on our revenues and increase our operating and capital costs, which could reduce the amount of cash otherwise available for distribution. To the extent that any disruption or security breach results in a loss or damage to the Partnership’s data, or an inappropriate disclosure of confidential or customer or employee information, it could cause significant damage to the Partnership’s reputation, affect relationships with its customers and employees, lead to claims against the Partnership, and ultimately harm our business. In addition, we may be required to incur additional costs to modify, remediate and protect against damage caused by these disruptions or security breaches in the future.
If we fail to maintain an effective system of internal controls, then we may not be able to accurately report our financial results or prevent fraud. As a result, current and potential unitholders could lose confidence in our financial reporting, which would harm our business and the trading price of our common units.
Effective internal controls are necessary for us to provide reliable financial reports, prevent fraud and operate successfully as a public company. In connection with management’s assessment of the effectiveness of internal control over financial reporting during the fourth quarter of fiscal 2014, management identified certain deficiencies which it concluded constituted a material weakness in our internal control related to financial reporting as of June 30, 2014 and as of the end of certain prior fiscal periods. In response, management implemented several processes to remediate the material weakness in our internal control over financial reporting and the ineffectiveness of its disclosure controls and procedures. We may experience difficulties in implementing effective internal controls as part of our integration of acquisitions from private companies, which are not subject to the internal control requirements imposed on public companies. If we are unable to maintain adequate controls over our financial processes and reporting in the future or if the businesses we acquire have ineffective internal controls, our operating results could be harmed or we may fail to meet our reporting obligations. Ineffective internal controls over financial reporting could cause our unitholders to lose confidence in our reported financial information, which would likely have a negative effect on the trading price of our common units.
Conflicts of interest have arisen and could arise in the future.
Conflicts of interest have arisen and could arise in the future as a result of relationships between the general partner and its affiliates, on the one hand, and us or any of our limited partners and noteholders, on the other hand. As a result of these conflicts the general partner may favor its own interests and those of its affiliates over the interests of the unitholders and noteholders. The nature of these conflicts is ongoing and includes the following considerations:
| • | The general partner’s affiliates are not prohibited from engaging in other business or activities, including direct competition with us. |
| • | The general partner determines the amount and timing of asset purchases and sales, capital expenditures, borrowings and reserves, each of which can impact the amount of cash, if any, available for distribution to unitholders, and available to pay principal and interest on debt and the amount of incentive distributions payable in respect of the general partner units. |
| • | The general partner controls the enforcement of obligations owed to us by the general partner. |
| • | The general partner decides whether to retain its counsel or engage separate counsel to perform services for us. |
| • | In some instances the general partner may borrow funds in order to permit the payment of distributions to unitholders. |
| • | The general partner may limit its liability and reduce its fiduciary duties, while also restricting the remedies available to unitholders for actions that might, without limitations, constitute breaches of fiduciary duty. |
| • | Unitholders are deemed to have consented to some actions and conflicts of interest that might otherwise be deemed a breach of fiduciary or other duties under applicable state law. |
| • | The general partner is allowed to take into account the interests of parties in addition to the Partnership in resolving conflicts of interest, thereby limiting its fiduciary duty to the unitholders. |
| • | The general partner determines whether to issue additional units or other of our securities. |
| • | The general partner determines which costs are reimbursable by us. |
| • | The general partner is not restricted from causing us to pay the general partner or its affiliates for any services rendered on terms that are fair and reasonable to us or entering into additional contractual arrangements with any of these entities on our behalf. |
19
Table of Contents
A substantial portion of our workforce is unionized, and we may face labor actions that could disrupt our operations or lead to higher labor costs and adversely affect our business.
As of September 30, 2016, approximately 41% of our employees were covered under 57 different collective bargaining agreements. As a result, we are usually involved in union negotiations with several local bargaining units at any given time. There can be no assurance that we will be able to negotiate the terms of any expired or expiring agreement on terms satisfactory to us. Although we consider our relations with our employees to be generally satisfactory, we may experience strikes, work stoppages or slowdowns in the future. If our unionized workers were to engage in a strike, work stoppage or other slowdown, we could experience a significant disruption of our operations, which could have a material adverse effect on our business, results of operations and financial condition. Moreover, our non-union employees may become subject to labor organizing efforts. If any of our current non-union facilities were to unionize, we could incur increased risk of work stoppages and potentially higher labor costs.
Cash distributions (if any) are not guaranteed and may fluctuate with performance and reserve requirements.
Distributions of available cash by us to unitholders will depend on the amount of cash generated, and distributions may fluctuate based on our performance. The actual amount of cash that is available will depend upon numerous factors, including:
| • | profitability of operations, |
| • | required principal and interest payments on debt or debt prepayments, |
| • | debt covenants, |
| • | margin account requirements, |
| • | cost of acquisitions, |
| • | issuance of debt and equity securities, |
| • | fluctuations in working capital, |
| • | capital expenditures, |
| • | units repurchased, |
| • | adjustments in reserves, |
| • | prevailing economic conditions, |
| • | financial, business and other factors, |
| • | increased pension funding requirements, and |
| • | the amount of cash taxes we have to pay in Federal, State and local corporate income and franchise taxes. |
Our credit agreement imposes restrictions on our ability to pay distributions to unitholders, including the need to maintain certain covenants. (See the third amended and restated credit facility agreement and Note 11 of the Notes to the Consolidated Financial Statements—Long-Term Debt and Bank Facility Borrowings)
Unitholders have in the past and may in the future have to report income for Federal income tax purposes on their investment in us without receiving any cash distributions from us.
We are a master limited partnership. Currently, our main asset and source of income is our 100% ownership interest in Star Acquisitions, Inc. (“Star Acquisitions”), which is the parent company of Petro Holdings, Inc. Our unitholders do not receive any of the tax benefits normally associated with owning units in a publicly traded partnership, as any cash coming from Star Acquisitions to us will generally have been taxed first at a corporate level and then may also be taxable to our unitholders as dividends, reported via annual Forms K-1. We expect that a unitholder will be allocated taxable income (generally dividend income from Star Acquisitions) regardless of whether a cash distribution has been paid. Our unitholders are required to report for Federal income tax purposes their allocable share of our income, gains, losses, deductions and credits, regardless of whether we make cash distributions. For example, our unitholders may receive dividend income for cash dividends received by Star Gas Partners from Star Acquisitions that are then used by Star Gas Partners to repurchase its units.
20
Table of Contents
We are not required to accumulate cash for the purpose of meeting our future obligations to our lenders, which may limit the cash available to service the final payment due on the term loan outstanding under our credit agreement.
Subject to the limitations on restricted payments that are contained in our credit agreement, we are not required to accumulate cash for the purpose of meeting our future obligations to our lenders. As a result, we may be required to refinance the final payment of our term loan. Our ability to refinance the term loan will depend upon our future results of operation and financial condition as well as developments in the capital markets. Our general partner will determine the future use of our cash resources and has broad discretion in determining such uses and in establishing reserves for such uses, which may include but are not limited to:
| • | complying with the terms of any of our agreements or obligations; |
| • | providing for distributions of cash to our unitholders in accordance with the requirements of our Partnership Agreement; |
| • | providing for future capital expenditures and other payments deemed by our general partner to be necessary or advisable, including to make acquisitions; and |
| • | repurchasing common units. |
Depending on the timing and amount of our use of cash, this could significantly reduce the cash available to us in subsequent periods to make payments on borrowings under our credit agreement.
Restrictive covenants in our credit agreement may reduce our operating flexibility.
Our credit agreement contains various covenants that limit our ability and the ability of our subsidiaries to, among other things:
| • | incur indebtedness; |
| • | make distributions to our unitholders; |
| • | purchase or redeem our outstanding equity interests or subordinated indebtedness; |
| • | make investments; |
| • | create liens; |
| • | sell assets; |
| • | engage in transactions with affiliates; |
| • | restrict the ability of our subsidiaries to make payments, loans, guarantees and transfers of assets or interests in assets; |
| • | engage in sale-leaseback transactions; |
| • | effect a merger or consolidation with or into other companies, a sale of all or substantially all of our properties or assets; and |
| • | engage in other lines of business. |
These restrictions could limit our ability to obtain future financings, make capital expenditures, withstand a future downturn in our business or the economy in general, conduct operations or otherwise take advantage of business opportunities that may arise. Our credit agreement also requires us to maintain specified financial ratios and satisfy other financial conditions. Our ability to meet those financial ratios and conditions can be affected by events beyond their control, such as weather conditions and general economic conditions. Accordingly, we may be unable to meet those ratios and conditions.
Any breach of any of these covenants, failure to meet any of these ratios or conditions, or occurrence of a change of control would result in a default under the terms of the relevant indebtedness or other financial obligations to become immediately due and payable. If we were unable to repay those amounts, the lenders could initiate a bankruptcy proceeding or liquidation proceeding or proceed against the collateral, if any. If the lenders of our indebtedness or other financial obligations accelerate the repayment of borrowings or other amounts owed, we may not have sufficient assets to repay our indebtedness or other financial obligations, including the notes.
Under our credit agreement, the occurrence of a “change of control” is considered a default. We may be unable to repay borrowings under our credit agreement if the indebtedness outstanding thereunder is accelerated following a change of control.
We may be unable to satisfy our obligations under our credit agreement unless we are able to refinance or obtain waivers under our other indebtedness. We may not have the financial resources to repay borrowings under our credit agreement.
21
Table of Contents
| ITEM 1B. | UNRESOLVED STAFF COMMENTS |
Not applicable.
| ITEM 2. | PROPERTIES |
We provide services to our customers in the United States from seventeen states and the District of Columbia, ranging from Maine to Georgia from 43 principal operating locations and 73 depots, 42 of which are owned and 74 of which are leased. As of September 30, 2016, we had a fleet of 1,142 truck and transport vehicles, many of which were owned and 1,325 service vans, the majority of which were leased. We lease our corporate headquarters in Stamford, Connecticut. Our obligations under our credit agreement are secured by liens and mortgages on substantially all of the Partnership’s and subsidiaries’ real and personal property.
| ITEM 3. | LEGAL PROCEEDINGS—LITIGATION |
On February 18, 2016, a civil action was filed in the United States District Court, District of New Jersey, entitled M. Norman Donnenfeld v. Petro Home Services, Petro Holdings Inc. and Petro, Inc., Civil Action Number 2:16-cv-00882 JMV-JBC, against Petro Home Services which is a brand name, Petro Holdings Inc. and Petro, Inc. Plaintiff alleges he did not receive expected contractual benefits under his protected price plan contract when oil prices fell and asserts various claims for relief including breach of contract, violation of the New York General Business Law and fraud. The Plaintiff also seeks to have a class certified of all customers of the defendants in the United States who entered into protected price plan contracts and were denied the same contractual benefits and to be appointed to represent them. No class has yet been certified in this action. The Plaintiff seeks compensatory, punitive and other damages in unspecified amounts. On May 9, 2016, the Partnership filed a motion to dismiss the complaint for lack of personal jurisdiction and failure to state a claim for relief and to strike the class action allegations. The motion was fully briefed and submitted to the court on July 12, 2016 and no decision has been issued yet. The Partnership believes the allegations lack merit and intends to vigorously defend the action; at this time we cannot assess the potential outcome or materiality of this matter.
| ITEM 4. | MINE SAFETY DISCLOSURES |
Not applicable.
22
Table of Contents
| ITEM 5. | MARKET FOR REGISTRANT’S UNITS AND RELATED MATTERS |
The common units, representing limited partner interests in the Partnership, are listed and traded on the New York Stock Exchange, Inc. (“NYSE”) under the symbol “SGU”.
The following tables set forth the range of the daily high and low sales prices per common unit and the cash distributions declared on each unit for the periods indicated.
| SGU – Common Unit Price Range | Distributions Declared | |||||||||||||||||||||||
| High | Low | per Unit | ||||||||||||||||||||||
| Quarter Ended | Fiscal Year 2016 |
Fiscal Year 2015 |
Fiscal Year 2016 |
Fiscal Year 2015 |
Fiscal Year 2016 |
Fiscal Year 2015 |
||||||||||||||||||
| December 31, |
$ | 8.82 | $ | 6.69 | $ | 6.77 | $ | 5.36 | $ | 0.0950 | $ | 0.0875 | ||||||||||||
| March 31, |
$ | 8.40 | $ | 7.83 | $ | 7.25 | $ | 5.77 | $ | 0.0950 | $ | 0.0875 | ||||||||||||
| June 30, |
$ | 9.00 | $ | 9.11 | $ | 8.10 | $ | 7.00 | $ | 0.1025 | $ | 0.0950 | ||||||||||||
| September 30, |
$ | 9.75 | $ | 9.98 | $ | 8.54 | $ | 8.31 | $ | 0.1025 | $ | 0.0950 | ||||||||||||
As of November 30, 2016, there were approximately 275 holders of record of common units.
There is no established public trading market for the Partnership’s 0.3 million general partner units.
Partnership Distribution Provisions
We are required to make distributions in an amount equal to our Available Cash, as defined in our Partnership Agreement, no more than 45 days after the end of each fiscal quarter, to holders of record on the applicable record dates. Available Cash, as defined in our Partnership Agreement, generally means all cash on hand at the end of the relevant fiscal quarter less the amount of cash reserves established by the Board of Directors of our general partner in its reasonable discretion for future cash requirements. These reserves are established for the proper conduct of our business, including the payment of debt principal and interest, for minimum quarterly distributions during the next four quarters and to comply with applicable laws and the terms of any debt agreements or other agreement to which we are subject. The Board of Directors of our general partner reviews the level of Available Cash each quarter based upon information provided by management.
According to the terms of our Partnership Agreement, minimum quarterly distributions on the common units accrue at the rate of $0.0675 per quarter ($0.27 on an annual basis). The information concerning restrictions on distributions required by Item 5 of this report is incorporated by reference to Note 3. Quarterly Distribution of Available Cash, of the Partnership’s consolidated financial statements. The credit agreement imposes certain restrictions on our ability to pay distributions to unitholders. In order to pay any distributions to unitholders or repurchase Common Units, the Partnership must maintain Availability (as defined in the third amended and restated credit facility agreement) of $45 million, 15.0% of the facility size of $300 million (assuming the non-seasonal aggregate commitment is in effect), on a historical pro forma and forward-looking basis, and a fixed charge coverage ratio of not less than 1.15 measured as of the date of repurchase. (See Note 11 of the Notes to the Consolidated Financial Statements—Long-Term Debt and Bank Facility Borrowings).
On October 20, 2016, we declared a quarterly distribution of $0.1025 per unit, or $0.41 per unit on an annualized basis, on all Common Units with respect to the fourth quarter of fiscal 2016, payable on November 9, 2016, to holders of record on October 31, 2016. In accordance with our Partnership Agreement, the amount of distributions in excess of the minimum quarterly distribution of $0.0675, are distributed 90% to Common Unit holders and 10% to the General Partner unit holders (until certain distribution levels are met), subject to the management incentive compensation plan. As a result, $5.7 million was paid to the Common Unit holders, $0.1 million to the General Partner unit holders (including $0.1 million of incentive distribution as provided in our Partnership Agreement) and $0.1 million to management pursuant to the management incentive compensation plan which provides for certain members of management to receive incentive distributions that would otherwise be payable to the General Partner.
Common Unit Repurchase Plans and Retirement
From July 21, 2009 (the start of the Plan I Common Units repurchase program) to November 30, 2016 (the current Plan III Common Units repurchase program in effect) the Partnership has repurchased and retired 19.9 million Common Units at an aggregate purchase price of $95.9 million or an average price of $4.82 per unit.
23
Table of Contents
In fiscal 2010, the Partnership concluded its Plan I Common Units repurchase program and retired all 7.5 million Common Units authorized for repurchase at an average price paid of $4.04 per unit.
In fiscal 2012, the Partnership concluded its Plan II Common Units repurchase program and retired all 7.25 million Common Units authorized for repurchase at an average price paid of $4.94 per unit.
In July 2012, the Board of Directors (the “Board”) of the general partner of the Partnership authorized the repurchase of up to 3.0 million of the Partnership’s Common Units (“Plan III”). In July 2013, the Board authorized the repurchase of an additional 1.9 million Common Units under Plan III. The authorized Common Unit repurchases may be made from time-to-time in the open market, in privately negotiated transactions or in such other manner deemed appropriate by management. There is no guarantee of the exact number of units that will be purchased under the program and the Partnership may discontinue purchases at any time. The program does not have a time limit. The Board may also approve additional purchases of units from time to time in private transactions. The Partnership’s repurchase activities take into account SEC safe harbor rules and guidance for issuer repurchases. All of the Common Units purchased in the repurchase program will be retired.
| (in thousands, except per unit amounts) |
||||||||||||
| Period |
Total Number of Units Purchased (a) |
Average Price Paid per Unit (b) |
Maximum Number of Units that May Yet Be Purchased (c) |
|||||||||
| Plan III - Number of units authorized |
4,894 | |||||||||||
| Private transaction - Number of units authorized |
|
2,450 | ||||||||||
|
|
|
|||||||||||
| 7,344 | ||||||||||||
| Plan III - Fiscal year 2012 total |
22 | $ | 4.26 | 2,978 | ||||||||
|
|
|
|
|
|||||||||
| Plan III - Fiscal year 2013 total (d) |
3,284 | $ | 4.63 | 2,738 | ||||||||
|
|
|
|
|
|||||||||
| Plan III - Fiscal year 2014 total |
313 | $ | 5.32 | 2,425 | ||||||||
|
|
|
|
|
|||||||||
| Plan III - Fiscal year 2015 total |
123 | $ | 5.64 | 2,302 | ||||||||
|
|
|
|
|
|||||||||
| Plan III - Fiscal year 2016 total (e) |
1,395 | $ | 8.62 | 2,207 | ||||||||
|
|
|
|
|
|||||||||
| Plan III - October 2016 |
— | $ | — | 2,207 | ||||||||
|
|
|
|
|
|||||||||
| Plan III - November 2016 |
— | $ | — | 2,207 | ||||||||
|
|
|
|
|
|||||||||
| (a) | Units were repurchased as part of a publicly announced program, except as noted in a private transaction. |
| (b) | Amounts include repurchase costs. |
| (c) | Number reflects what was authorized to yet be purchased as of the end of the respective period. |
| (d) | Fiscal year 2013 common unit repurchases include 1.15 million common units acquired in a private transaction. |
| (e) | Fiscal year 2016 common unit repurchases include 1.3 million common units acquired in a private transaction. |
24
Table of Contents
| ITEM 6. | SELECTED HISTORICAL FINANCIAL AND OPERATING DATA |
The selected financial data as of September 30, 2016 and 2015, and for the years ended September 30, 2016, 2015 and 2014 is derived from the financial statements of the Partnership included elsewhere in this Report. The selected financial data as of September 30, 2014, 2013 and 2012 and for the years ended September 30, 2013 and 2012 is derived from financial statements of the Partnership not included in this Report. See Item 7. Management’s Discussion and Analysis of Financial Condition and Results of Operations.
| Fiscal Years Ending September 30, | ||||||||||||||||||||
| (in thousands, except per unit data) | 2016 | 2015 | 2014 | 2013 | 2012 | |||||||||||||||
| Statement of Operations Data: |
||||||||||||||||||||
| Sales |
$ | 1,161,338 | $ | 1,674,291 | $ | 1,961,724 | $ | 1,741,796 | $ | 1,497,588 | ||||||||||
| Costs and expenses: |
||||||||||||||||||||
| Cost of sales |
768,841 | 1,203,588 | 1,555,300 | 1,388,668 | 1,199,811 | |||||||||||||||
| (Increase) decrease in the fair value of derivative instruments |
(18,217 | ) | 4,187 | 6,566 | 6,775 | (8,549 | ) | |||||||||||||
| Delivery and branch expenses |
276,493 | 309,025 | 282,646 | 250,210 | 217,376 | |||||||||||||||
| Depreciation and amortization expenses |
26,530 | 24,930 | 21,635 | 17,303 | 16,395 | |||||||||||||||
| General and administrative expenses |
23,366 | 25,908 | 22,592 | 18,356 | 18,689 | |||||||||||||||
| Multiemployer pension plan withdrawal charge |
— | 17,796 | — | — | — | |||||||||||||||
| Finance charge income |
(3,079 | ) | (4,756 | ) | (6,870 | ) | (5,521 | ) | (4,393 | ) | ||||||||||
|
|
|
|
|
|
|
|
|
|
|
|||||||||||
| Operating income |
87,404 | 93,613 | 79,855 | 66,005 | 58,259 | |||||||||||||||
| Interest expense, net |
7,485 | 14,059 | 16,854 | 14,433 | 14,060 | |||||||||||||||
| Amortization of debt issuance costs |
1,247 | 1,818 | 1,602 | 1,745 | 1,634 | |||||||||||||||
| Loss on redemption of debt |
— | 7,345 | — | — | — | |||||||||||||||
|
|
|
|
|
|
|
|
|
|
|
|||||||||||
| Income before income taxes |
78,672 | 70,391 | 61,399 | 49,827 | 42,565 | |||||||||||||||
| Income tax expense |
33,738 | 32,835 | 25,315 | 19,921 | 16,576 | |||||||||||||||
|
|
|
|
|
|
|
|
|
|
|
|||||||||||
| Net income |
$ | 44,934 | $ | 37,556 | $ | 36,084 | $ | 29,906 | $ | 25,989 | ||||||||||
|
|
|
|
|
|
|
|
|
|
|
|||||||||||
| Weighted average number of limited partner units: |
||||||||||||||||||||
| Basic and diluted |
57,022 | 57,285 | 57,476 | 59,409 | 61,931 | |||||||||||||||
| Fiscal Years Ended September 30, | ||||||||||||||||||||
| (in thousands, except per unit data) | 2016 | 2015 | 2014 | 2013 | 2012 | |||||||||||||||
| Per Unit Data: |
||||||||||||||||||||
| Basic and diluted net income per unit (a) |
$ | 0.70 | $ | 0.59 | $ | 0.57 | $ | 0.47 | $ | 0.40 | ||||||||||
| Cash distribution declared per common unit |
$ | 0.395 | $ | 0.365 | $ | 0.340 | $ | 0.320 | $ | 0.310 | ||||||||||
| Balance Sheet Data (end of period): |
||||||||||||||||||||
| Current assets |
$ | 294,858 | $ | 271,479 | $ | 296,465 | $ | 305,880 | $ | 301,519 | ||||||||||
| Total assets |
$ | 692,970 | $ | 685,508 | $ | 685,107 | $ | 632,504 | $ | 639,347 | ||||||||||
| Long-term debt |
$ | 76,300 | $ | 90,000 | $ | 124,572 | $ | 124,460 | $ | 124,357 | ||||||||||
| Partners’ Capital |
$ | 301,493 | $ | 289,886 | $ | 273,245 | $ | 259,281 | $ | 260,145 | ||||||||||
| Summary Cash Flow Data: |
||||||||||||||||||||
| Net cash provided by operating activities |
$ | 101,957 | $ | 136,853 | $ | 95,155 | $ | 18,492 | $ | 105,828 | ||||||||||
| Net cash used in investing activities |
$ | (19,631 | ) | $ | (30,385 | ) | $ | (107,318 | ) | $ | (6,960 | ) | $ | (44,517 | ) | |||||
| Net cash used in financing activities |
$ | (43,646 | ) | $ | (54,959 | ) | $ | (23,895 | ) | $ | (34,566 | ) | $ | (40,009 | ) | |||||
| Other Data: |
||||||||||||||||||||
| Earnings from continuing operations before net interest expense, income taxes, depreciation and amortization (EBITDA) (b) |
$ | 113,934 | $ | 111,198 | $ | 101,490 | $ | 83,308 | $ | 74,654 | ||||||||||
| Adjusted EBITDA (b) |
$ | 95,717 | $ | 140,526 | $ | 108,056 | $ | 90,083 | $ | 66,105 | ||||||||||
| Retail home heating oil and propane gallons sold |
302,517 | 382,834 | 360,972 | 324,797 | 277,204 | |||||||||||||||
| Temperatures (warmer) colder than normal (c) |
(17.8 | )% | 5.0 | % | 4.9 | % | (4.1 | )% | (21.7 | )% | ||||||||||
25
Table of Contents
| (a) | Net income per unit is computed in accordance with FASB ASC 260-10-45-60 Earnings per Share, Master Limited Partnerships (EITF 03-06). See Note 17. Earnings Per Limited Partner Units, of the condensed consolidated financial statements. |
| (b) | EBITDA (Earnings from continuing operations before net interest expense, income taxes, depreciation and amortization) and Adjusted EBITDA (Earnings from continuing operations before net interest expense, income taxes, depreciation and amortization, (increase) decrease in the fair value of derivatives, multiemployer pension plan withdrawal charge, gain or loss on debt redemption, goodwill impairment, and other non-cash and non-operating charges) are non-GAAP financial measures that are used as supplemental financial measures by management and external users of our financial statements, such as investors, commercial banks and research analysts, to assess: |
| • | our compliance with certain financial covenants included in our debt agreements; |
| • | our financial performance without regard to financing methods, capital structure, income taxes or historical cost basis; |
| • | our operating performance and return on invested capital as compared to those of other companies in the retail distribution of refined petroleum products business, without regard to financing methods and capital structure; |
| • | our ability to generate cash sufficient to pay interest on our indebtedness and to make distributions to our partners; and |
| • | the viability of acquisitions and capital expenditure projects and the overall rates of return of alternative investment opportunities. |
The method of calculating Adjusted EBITDA may not be consistent with that of other companies, and EBITDA and Adjusted EBITDA both have limitations as an analytical tool and so should not be viewed in isolation and should be viewed in conjunction with measurements that are computed in accordance with GAAP. Some of the limitations of EBITDA and Adjusted EBITDA are:
| • | EBITDA and Adjusted EBITDA do not reflect our cash used for capital expenditures; |
| • | Although depreciation and amortization are non-cash charges, the assets being depreciated or amortized often will have to be replaced and EBITDA and Adjusted EBITDA do not reflect the cash requirements for such replacements; |
| • | EBITDA and Adjusted EBITDA do not reflect changes in, or cash requirements for, our working capital requirements; |
| • | EBITDA and Adjusted EBITDA do not reflect the cash necessary to make payments of interest or principal on our indebtedness; and |
| • | EBITDA and Adjusted EBITDA do not reflect the cash required to pay taxes. |
EBITDA and Adjusted EBITDA are calculated for the fiscal years ended September 30 as follows:
| (in thousands) | 2016 | 2015 | 2014 | 2013 | 2012 | |||||||||||||||
| Net income |
$ | 44,934 | $ | 37,556 | $ | 36,084 | $ | 29,906 | $ | 25,989 | ||||||||||
| Plus: |
||||||||||||||||||||
| Income tax expense |
33,738 | 32,835 | 25,315 | 19,921 | 16,576 | |||||||||||||||
| Amortization of debt issuance cost |
1,247 | 1,818 | 1,602 | 1,745 | 1,634 | |||||||||||||||
| Interest expense, net |
7,485 | 14,059 | 16,854 | 14,433 | 14,060 | |||||||||||||||
| Depreciation and amortization |
26,530 | 24,930 | 21,635 | 17,303 | 16,395 | |||||||||||||||
|
|
|
|
|
|
|
|
|
|
|
|||||||||||
| EBITDA from continuing operations |
113,934 | 111,198 | 101,490 | 83,308 | 74,654 | |||||||||||||||
| (Increase)/decrease in the fair value of derivative instruments |
(18,217 | ) | 4,187 | 6,566 | 6,775 | (8,549 | ) | |||||||||||||
| Multiemployer pension plan withdrawal charge |
— | 17,796 | — | — | — | |||||||||||||||
| Loss on redemption of debt |
— | 7,345 | — | — | — | |||||||||||||||
|
|
|
|
|
|
|
|
|
|
|
|||||||||||
| Adjusted EBITDA |
95,717 | 140,526 | 108,056 | 90,083 | 66,105 | |||||||||||||||
| Add/(subtract) |
||||||||||||||||||||
| Income tax expense |
(33,738 | ) | (32,835 | ) | (25,315 | ) | (19,921 | ) | (16,576 | ) | ||||||||||
| Interest expense, net |
(7,485 | ) | (14,059 | ) | (16,854 | ) | (14,433 | ) | (14,060 | ) | ||||||||||
| Multiemployer pension plan withdrawal charge |
— | (17,796 | ) | — | — | — | ||||||||||||||
| (Recovery) provision for losses on accounts receivable |
(639 | ) | 3,738 | 7,514 | 6,481 | 6,017 | ||||||||||||||
| (Increase) decrease in accounts receivables |
10,965 | 30,141 | 12,771 | (14,074 | ) | 5,804 | ||||||||||||||
| (Increase) decrease in inventories |
9,979 | 4,326 | 14,057 | (20,664 | ) | 34,335 | ||||||||||||||
| Increase (decrease) in customer credit balances |
6,490 | 3,992 | (2,433 | ) | (15,878 | ) | 11,952 | |||||||||||||
| Change in deferred taxes |
9,670 | (4,101 | ) | 658 | 1,676 | 12,913 | ||||||||||||||
| Change in other operating assets and liabilities |
10,998 | 22,921 | (3,299 | ) | 5,222 | (662 | ) | |||||||||||||
|
|
|
|
|
|
|
|
|
|
|
|||||||||||
| Net cash provided by operating activities |
$ | 101,957 | $ | 136,853 | $ | 95,155 | $ | 18,492 | $ | 105,828 | ||||||||||
|
|
|
|
|
|
|
|
|
|
|
|||||||||||
| Net cash used in investing activities |
$ | (19,631 | ) | $ | (30,385 | ) | $ | (107,318 | ) | $ | (6,960 | ) | $ | (44,517 | ) | |||||
|
|
|
|
|
|
|
|
|
|
|
|||||||||||
| Net cash used in financing activities |
$ | (43,646 | ) | $ | (54,959 | ) | $ | (23,895 | ) | $ | (34,566 | ) | $ | (40,009 | ) | |||||
|
|
|
|
|
|
|
|
|
|
|
|||||||||||
| (c) | Temperatures (warmer) colder than normal are for those locations where the Partnership had existing operations, which we sometimes refer to as the “base business” (i.e. excluding acquisitions), temperatures (measured on a degree day basis) as reported by the National Oceanic and Atmospheric Administration (“NOAA”). |
26
Table of Contents
| ITEM 7. | MANAGEMENT’S DISCUSSION AND ANALYSIS OF FINANCIAL CONDITION AND RESULTS OF OPERATIONS |
Statement Regarding Forward-Looking Disclosure
This Annual Report on Form 10-K includes “forward-looking statements” which represent our expectations or beliefs concerning future events that involve risks and uncertainties, including those associated with the effect of weather conditions on our financial performance, the price and supply of the products that we sell, the consumption patterns of our customers, our ability to obtain satisfactory gross profit margins, our ability to obtain new customers and retain existing customers, our ability to make strategic acquisitions, the impact of litigation, our ability to contract for our current and future supply needs, natural gas conversions, future union relations and the outcome of current and future union negotiations, the impact of current and future governmental regulations, including environmental, health, and safety regulations, the ability to attract and retain employees, customer credit worthiness, counterparty credit worthiness, marketing plans, general economic conditions and new technology. All statements other than statements of historical facts included in this Report including, without limitation, the statements under “Management’s Discussion and Analysis of Financial Condition and Results of Operations” and elsewhere herein, are forward-looking statements. Without limiting the foregoing, the words “believe,” “anticipate,” “plan,” “expect,” “seek,” “estimate,” and similar expressions are intended to identify forward-looking statements. Although we believe that the expectations reflected in such forward-looking statements are reasonable, we can give no assurance that such expectations will prove to be correct and actual results may differ materially from those projected as a result of certain risks and uncertainties. These risks and uncertainties include, but are not limited to, those set forth in this Report under the headings “Risk Factors” and “Business Strategy.” Important factors that could cause actual results to differ materially from our expectations (“Cautionary Statements”) are disclosed in this Report. All subsequent written and oral forward-looking statements attributable to the Partnership or persons acting on its behalf are expressly qualified in their entirety by the Cautionary Statements. Unless otherwise required by law, we undertake no obligation to update or revise any forward-looking statements, whether as a result of new information, future events or otherwise after the date of this Report.
Weather Hedge Contract
Weather conditions have a significant impact on the demand for home heating oil and propane because customers depend on these products principally for space heating purposes. Actual weather conditions may vary substantially from year to year, significantly affecting Star’s financial performance. To partially mitigate the adverse effect of warm weather on cash flow, we have used weather hedging contracts for a number of years.
The Partnership has entered into weather hedge contracts for the fiscal years 2016, 2017 and 2018 with Swiss Re, under which Star is entitled to receive a payment of $35,000 per heating degree-day shortfall if the total number of heating degree-days within the hedge period is less than approximately 92.5% of the ten year average (the “Payment Threshold”). The hedge period runs from November 1 through March 31, taken as a whole, for each respective fiscal year and has a maximum payout of $12.5 million for each fiscal year. The hedge covers the period from November 1 through March 31 taken as a whole and has a maximum payout of $12.5 million. During the first quarter of 2016, the Partnership recorded a credit of $12.5 million under this contract that reduced delivery and branch expenses. This amount was collected in April 2016. The Partnership did not record any benefit under its weather hedge contract during fiscal years 2014 and 2015.
Per Gallon Gross Profit Margins
We believe home heating oil and propane margins should be evaluated on a cents per gallon basis, before the effects of increases or decreases in the fair value of derivative instruments (as we believe that realized per gallon margins should not include the impact of non-cash changes in the market value of hedges before the settlement of the underlying transaction).
A significant portion of our home heating oil volume is sold to individual customers under an arrangement pre-establishing a ceiling price or fixed price for home heating oil over a fixed period of time, generally twelve to twenty-four months (“price-protected” customers). When these price-protected customers agree to purchase home heating oil from us for the next heating season, we purchase option contracts, swaps and futures contracts for a substantial majority of the heating oil that we expect to sell to these customers. The amount of home heating oil volume that we hedge per price-protected customer is based upon the estimated fuel consumption per average customer per month. In the event that the actual usage exceeds the amount of the hedged volume on a monthly basis, we may be required to obtain additional volume at unfavorable costs. In addition, should actual usage in any month be less than the hedged volume, our hedging costs and losses could be greater, thus reducing expected margins.
27
Table of Contents
Derivatives
FASB ASC 815-10-05 Derivatives and Hedging requires that derivative instruments be recorded at fair value and included in the consolidated balance sheet as assets or liabilities. To the extent derivative instruments designated as cash flow hedges are effective, as defined under this guidance, changes in fair value are recognized in other comprehensive income until the forecasted hedged item is recognized in earnings. We have elected not to designate our derivative instruments as hedging instruments under this guidance and, as a result, the changes in fair value of the derivative instruments are recognized in our statement of operations. Therefore, we experience volatility in earnings as outstanding derivative instruments are marked to market and non-cash gains and losses are recorded prior to the sale of the commodity to the customer. The volatility in any given period related to unrealized non-cash gains or losses on derivative instruments can be significant to our overall results. However, we ultimately expect those gains and losses to be offset by the cost of product when purchased.
Income Taxes
Book Versus Tax Deductions
The amount of cash flow that we generate in any given year depends upon a variety of factors including the amount of cash income taxes that our corporate subsidiaries are required to pay, which will increase as tax depreciation and amortization decreases. The amount of depreciation and amortization that we deduct for book (i.e., financial reporting) purposes will differ from the amount that our subsidiaries can deduct for tax purposes. The table below compares the estimated depreciation and amortization for book purposes to the amount that our subsidiaries expect to deduct for tax purposes based on currently owned assets. Our subsidiaries file their tax returns based on a calendar year. The amounts below are based on our September 30 fiscal year.
Estimated Depreciation and Amortization Expense
| (In thousands) Fiscal Year |
Book | Tax | ||||||
| 2016 |
$ | 27,767 | $ | 33,638 | ||||
| 2017 |
26,412 | 26,210 | ||||||
| 2018 |
23,390 | 20,968 | ||||||
| 2019 |
21,223 | 17,499 | ||||||
| 2020 |
18,034 | 14,880 | ||||||
| 2021 |
13,656 | 12,951 | ||||||
Non-Deductible Partnership Expenses
The Partnership incurs certain expenses at the Partnership level that are not deductible for Federal or state income tax purposes by our corporate subsidiaries. As a result, our effective tax rate could differ from the statutory rate that would be applicable if such expenses were deductible.
Customer Attrition
We measure net customer attrition on an ongoing basis for our full service residential and commercial home heating oil and propane customers. Net customer attrition is the difference between gross customer losses and customers added through marketing efforts. Customers added through acquisitions are not included in the calculation of gross customer gains. However, additional customers that are obtained through marketing efforts or lost at newly acquired businesses are included in these calculations. Customer attrition percentage calculations include customers added through acquisitions in the denominators of the calculations on a weighted average basis. Gross customer losses are the result of a number of factors, including price competition, move-outs, credit losses and conversion to natural gas. When a customer moves out of an existing home, we count the “move out” as a loss and, if we are successful in signing up the new homeowner, the “move in” is treated as a gain.
28
Table of Contents
Gross customer gains and losses
| Fiscal Year Ended | ||||||||||||||||||||||||||||||||||||
| 2016 | 2015 | 2014 | ||||||||||||||||||||||||||||||||||
| Net | Net | Net | ||||||||||||||||||||||||||||||||||
| Gross Customer | Gains / | Gross Customer | Gains / | Gross Customer | Gains / | |||||||||||||||||||||||||||||||
| Gains | Losses | (Attrition) | Gains | Losses | (Attrition) | Gains | Losses | (Attrition) | ||||||||||||||||||||||||||||
| First Quarter |
22,800 | 24,200 | (1,400 | ) | 27,400 | 23,100 | 4,300 | 25,700 | 22,700 | 3,000 | ||||||||||||||||||||||||||
| Second Quarter |
13,700 | 19,300 | (5,600 | ) | 16,000 | 18,200 | (2,200 | ) | 16,800 | 16,700 | 100 | |||||||||||||||||||||||||
| Third Quarter |
7,400 | 14,100 | (6,700 | ) | 7,400 | 14,000 | (6,600 | ) | 8,100 | 14,100 | (6,000 | ) | ||||||||||||||||||||||||
| Fourth Quarter |
11,400 | 21,200 | (9,800 | ) | 13,900 | 17,900 | (4,000 | ) | 17,500 | 18,700 | (1,200 | ) | ||||||||||||||||||||||||
|
|
|
|
|
|
|
|
|
|
|
|
|
|
|
|
|
|
|
|||||||||||||||||||
| Total |
55,300 | 78,800 | (23,500 | ) | 64,700 | 73,200 | (8,500 | ) | 68,100 | 72,200 | (4,100 | ) | ||||||||||||||||||||||||
|
|
|
|
|
|
|
|
|
|
|
|
|
|
|
|
|
|
|
|||||||||||||||||||
Net customer gains (attrition) as a percentage of home heating oil and propane customer base
| Fiscal Year Ended | ||||||||||||||||||||||||||||||||||||
| 2016 | 2015 | 2014 | ||||||||||||||||||||||||||||||||||
| Net | Net | Net | ||||||||||||||||||||||||||||||||||
| Gross Customer | Gains / | Gross Customer | Gains / | Gross Customer | Gains / | |||||||||||||||||||||||||||||||
| Gains | Losses | (Attrition) | Gains | Losses | (Attrition) | Gains | Losses | (Attrition) | ||||||||||||||||||||||||||||
| First Quarter |
5.0 | % | 5.3 | % | (0.3 | %) | 6.2 | % | 5.2 | % | 1.0 | % | 6.1 | % | 5.3 | % | 0.8 | % | ||||||||||||||||||
| Second Quarter |
3.0 | % | 4.2 | % | (1.2 | %) | 3.6 | % | 4.1 | % | (0.5 | %) | 3.9 | % | 3.9 | % | 0.0 | % | ||||||||||||||||||
| Third Quarter |
1.6 | % | 3.1 | % | (1.5 | %) | 1.7 | % | 3.1 | % | (1.4 | %) | 1.9 | % | 3.3 | % | (1.4 | %) | ||||||||||||||||||
| Fourth Quarter |
2.5 | % | 4.6 | % | (2.1 | %) | 3.1 | % | 4.0 | % | (0.9 | %) | 4.1 | % | 4.4 | % | (0.3 | %) | ||||||||||||||||||
|
|
|
|
|
|
|
|
|
|
|
|
|
|
|
|
|
|
|
|||||||||||||||||||
| Total |
12.1 | % | 17.2 | % | (5.1 | %) | 14.6 | % | 16.4 | % | (1.8 | %) | 16.0 | % | 16.9 | % | (0.9 | %) | ||||||||||||||||||
|
|
|
|
|
|
|
|
|
|
|
|
|
|
|
|
|
|
|
|||||||||||||||||||
During fiscal 2016, the Partnership lost 23,500 accounts (net), or 5.1%, of our home heating oil and propane customer base, compared to 8,500 accounts lost (net), or 1.8% of our home heating oil and propane customer base, during fiscal 2015. For fiscal 2016, our gross customer gains were 9,400 accounts less than the prior year’s comparable period and our gross customer losses for fiscal 2016 were 5,600 accounts higher than fiscal 2015. We believe that gross customer gains in fiscal 2016 (and ability to attract new accounts in general) were impacted by the extremely warm weather since potential new accounts did not see a need for the higher level of service we can provide. We also believe that the precipitous drop in the wholesale cost of product over the last two fiscal years enabled competitors to lower their prices to levels which are not economically attractive for us. The increase in gross customer losses was due to customers leaving in search of lower prices, an increase in customers moving out of existing locations and the purging of certain customers that had switched their delivery classification from automatic to will call.
During fiscal 2015, the Partnership lost 8,500 accounts (net), or 1.8%, of our home heating oil and propane customer base, compared to 4,100 accounts lost (net), or 0.9% of our home heating oil and propane customer base, during fiscal 2014. The net attrition rates achieved in fiscal 2015 and fiscal 2014 were the lowest in the last five years. We believe that we benefitted from the effects of a declining cost of product as well as temperatures that were colder than normal which favorably impacted the gross customer loss rate. Excluding the Griffith acquisition, gross customer gains were lower by 7,200 accounts and gross customer losses were lower by 3,200 accounts year-over-year. We believe the decline in home heating oil prices drove a reduction in marketing leads and resulted in lower gross customer gains as well as lower gross customer losses. During fiscal 2014, the Partnership’s gross customer gains benefitted from operational difficulties of a few competitors.
During fiscal 2016, we estimate that we lost 1.3% of our home heating oil accounts to natural gas conversions versus 1.6% for fiscal 2015 and 2.2% for fiscal 2014. Losses to natural gas in our footprint for the heating oil industry could be greater or less than the Partnership’s estimates. Conversions to natural gas may continue as it remains less expensive than home heating oil on an equivalent BTU basis.
Consolidated Results of Operations
The following is a discussion of the consolidated results of operations of the Partnership and its subsidiaries and should be read in conjunction with the historical financial and operating data and Notes thereto included elsewhere in this Annual Report.
29
Table of Contents
Fiscal Year Ended September 30, 2016
Compared to Fiscal Year Ended September 30, 2015
Volume
For fiscal 2016, retail volume of home heating oil and propane sold decreased by 80.3 million gallons, or 21.0%, to 302.5 million gallons, compared to 382.8 million gallons for fiscal 2015. For those locations where the Partnership had existing operations during both periods, which we sometimes refer to as the “base business” (i.e., excluding acquisitions), temperatures (measured on a heating degree day basis) for fiscal 2016 were 21.6% warmer than fiscal 2015, and 17.8% warmer than normal, as reported by NOAA. For the twelve months ended September 30, 2016, net customer attrition for the base business was 5.3%. The impact of fuel conservation, along with any period-to-period differences in delivery scheduling, the timing of accounts added or lost during fiscal years, equipment efficiency, and other volume variances not otherwise described, are included in the chart below under the heading “Other.” An analysis of the change in the retail volume of home heating oil and propane, which is based on management’s estimates, sampling, and other mathematical calculations and certain assumptions, is found below:
| (in millions of gallons) |
Heating Oil and Propane |
|||
| Volume - Fiscal 2015 |
382.8 | |||
| Acquisitions |
15.0 | |||
| Weather impact |
(78.1 | ) | ||
| Net customer attrition |
(18.4 | ) | ||
| Other |
1.2 | |||
|
|
|
|||
| Change |
(80.3 | ) | ||
|
|
|
|||
| Volume -Fiscal 2016 |
302.5 | |||
|
|
|
|||
The following chart sets forth the percentage by volume of total home heating oil sold to residential variable-price customers, residential price-protected customers, and commercial/industrial/other customers for fiscal 2016 compared to fiscal 2015:
| Twelve Months Ended | ||||||||
| Customers |
September 30, 2016 | September 30, 2015 | ||||||
| Residential Variable |
40.8 | % | 37.9 | % | ||||
| Residential Price-Protected |
46.5 | % | 48.1 | % | ||||
| Commercial/Industrial/Other |
12.7 | % | 14.0 | % | ||||
|
|
|
|
|
|||||
| Total |
100.0 | % | 100.0 | % | ||||
|
|
|
|
|
|||||
Volume of other petroleum products sold increased by 8.2 million gallons, or 8.0%, to 109.5 million gallons for fiscal 2016, compared to 101.4 million gallons for fiscal 2015, as a decline in the base business of 5.8 million gallons, or 5.7%, was more than offset by acquisitions which contributed 14.0 million gallons. The decline in the base business was largely due to a weather-driven decrease in low margin wholesale sales.
Product Sales
For fiscal 2016, product sales decreased $0.5 billion, or 36.4%, to $0.9 billion, compared to $1.4 billion for fiscal 2015, reflecting a decline in wholesale product costs of $0.7089 per gallon, or 35.1%, and a decline in total volume of 14.9%, which was slightly offset by higher per gallon gross profit margins.
Installations and Services Sales
For fiscal 2016, installation and service sales increased $7.6 million, or 3.1%, to $250.3 million, compared to $242.7 million for fiscal 2015, due to acquisitions and additional services in the base business.
30
Table of Contents
Cost of Product
For fiscal 2016, cost of product decreased $437.8 million, or 44.8%, to $539.8 million, compared to $977.6 million for fiscal 2015, due largely to a $0.7089 per gallon, or 35.1%, decrease in wholesale product cost and a decline in total volume of 14.9%.
Gross Profit—Product
The table below calculates the Partnership’s per gallon margins and reconciles product gross profit for home heating oil and propane and other petroleum products. We believe the change in home heating oil and propane margins should be evaluated before the effects of increases or decreases in the fair value of derivative instruments, as we believe that realized per gallon margins should not include the impact of non-cash changes in the market value of hedges before the settlement of the underlying transaction. On that basis, home heating oil and propane margins for fiscal 2016 increased by $0.016 per gallon, or 1.4%, to $1.1222 per gallon, from $1.1062 per gallon during fiscal 2015. The Partnership was able to expand its per gallon margins due to the decline in per gallon wholesale product costs. Over the last several years, the cost of home heating oil has declined significantly. Going forward, the Partnership cannot assume that the per gallon margins achieved during either fiscal 2016 or 2015 are sustainable. Product sales and cost of product include home heating oil, propane, other petroleum products, and liquidated damages billings.
| Twelve Months Ended | ||||||||||||||||
| September 30, 2016 | September 30, 2015 | |||||||||||||||
| Home Heating Oil and Propane |
Amount (in millions) |
Per Gallon |
Amount (in millions) |
Per Gallon |
||||||||||||
| Volume |
302.5 | 382.8 | ||||||||||||||
|
|
|
|
|
|||||||||||||
| Sales |
$ | 731.2 | $ | 2.4172 | $ | 1,202.5 | $ | 3.1410 | ||||||||
| Cost |
$ | 391.7 | $ | 1.2950 | $ | 779.0 | $ | 2.0348 | ||||||||
|
|
|
|
|
|
|
|
|
|||||||||
| Gross Profit |
$ | 339.5 | $ | 1.1222 | $ | 423.5 | $ | 1.1062 | ||||||||
|
|
|
|
|
|
|
|
|
|||||||||
| Other Petroleum Products |
Amount (in millions) |
Per Gallon |
Amount (in millions) |
Per Gallon |
||||||||||||
| Volume |
109.5 | 101.4 | ||||||||||||||
|
|
|
|
|
|||||||||||||
| Sales |
$ | 179.8 | $ | 1.6415 | $ | 229.1 | $ | 2.2601 | ||||||||
| Cost |
$ | 148.1 | $ | 1.3520 | $ | 198.6 | $ | 1.9595 | ||||||||
|
|
|
|
|
|
|
|
|
|||||||||
| Gross Profit |
$ | 31.7 | $ | 0.2895 | $ | 30.5 | $ | 0.3006 | ||||||||
|
|
|
|
|
|
|
|
|
|||||||||
| Total Product |
Amount (in millions) |
Amount (in millions) |
||||||||||||||
| Sales |
$ | 911.0 | $ | 1,431.6 | ||||||||||||
| Cost |
$ | 539.8 | $ | 977.6 | ||||||||||||
|
|
|
|
|
|||||||||||||
| Gross Profit |
$ | 371.2 | $ | 454.0 | ||||||||||||
|
|
|
|
|
|||||||||||||
For fiscal 2016, total product gross profit was $371.2 million, down $82.8 million, or 18.2%, versus fiscal 2015, as the impact of slightly higher home heating oil and propane margins ($4.8 million) and an increase in gross profit from other petroleum products ($1.2 million) was more than offset by a decline in home heating oil and propane volume ($88.8 million).
Cost of Installations and Services
Total installation costs for fiscal 2016 increased by $2.7 million, or 3.7%, to $75.9 million, compared to $73.2 million in installation costs for fiscal 2015, due to acquisitions and some growth in the base business. Installation costs as a percentage of installation sales for fiscal 2016 and fiscal 2015 were 83.7% and 84.2%, respectively.
Service expenses increased slightly to $153.1 million for fiscal 2016, or 95.9% of service sales, versus $152.8 million, or 98.1% of service sales, for fiscal 2015, as the additional service expense related to acquisitions of $4.4 million was almost totally offset by a reduction in the base business of $4.0 million. During fiscal 2015, temperatures were much colder than normal and drove an increase in the number of service hours required to ensure customers’ heating systems were operational. By contrast the mild weather experienced during fiscal 2016 did not require a similar level of service and, as a result, expenses were lower. We realized a
31
Table of Contents
combined gross profit from service and installation of $21.3 million for fiscal 2016 compared to a combined gross profit of $16.7 million for fiscal 2015. Management views the service and installation department on a combined basis because many overhead functions and direct expenses such as service technician time cannot be separated or precisely allocated to either service or installation billings.
(Increase) Decrease in the Fair Value of Derivative Instruments
During fiscal 2016, the change in the fair value of derivative instruments resulted in a $18.2 million credit due to the expiration of certain hedged positions (a $15.3 million credit) and an increase in the market value for unexpired hedges (a $2.9 million credit).
During fiscal 2015, the change in the fair value of derivative instruments resulted in a $4.2 million charge due to the expiration of certain hedged positions (a $12.1 million credit) and a decrease in the market value of unexpired hedges (a $16.3 million charge).
Delivery and Branch Expenses
For fiscal 2016, delivery and branch expenses decreased $32.5 million, or 10.5%, to $276.5 million, compared to $309.0 million for fiscal 2015, as an acquisition related increase of $10.4 million was more than offset by lower delivery and branch expenses of $42.9 million, or 13.9%, largely due to the weather related decline in home heating oil and propane volume in the base business of 24.9%, lower bad debt expense of $4.3 million, and a $12.5 million credit recorded in the first quarter of fiscal 2016 under the Partnership’s weather hedge contract.
Depreciation and Amortization
For fiscal 2016, depreciation and amortization expense increased by $1.6 million, or 6.4%, to $26.5 million, compared to $24.9 million for fiscal 2015, due to acquisitions.
General and Administrative Expenses
For fiscal 2016, general and administrative expenses decreased $2.5 million, to $23.4 million, from $25.9 million for fiscal 2015, primarily due to a reduction in profit sharing. The Partnership accrues approximately 6% of Adjusted EBITDA, as defined in the profit sharing plan, for distribution to its employees, and this amount is payable when the Partnership achieves Adjusted EBITDA of at least 70% of the amount budgeted. The dollar amount of the profit sharing pool is subject to increases and decreases in line with increases and decreases in Adjusted EBITDA.
Multiemployer Pension Plan Withdrawal Charge
In fiscal 2015, we entered into an agreement among certain Star subsidiaries and the New England Teamsters and Trucking Industry Pension Fund (the “NETTI Fund”), a multiemployer pension plan in which such Star subsidiaries participate, providing for Star’s participating subsidiaries to withdraw from the NETTI Fund’s original employer pool and enter the NETTI Fund’s new employer pool. The withdrawal from the original employer pool triggered an undiscounted withdrawal obligation of $48.0 million to be paid in equal monthly installments over 30 years, or $1.6 million per year. The estimated annual after-tax cash impact of entering into this agreement is $0.9 million. In September 2015, we recorded a non-cash charge in order to establish a withdrawal obligation of approximately $17.8 million on the consolidated balance sheet, representing the present value of the $48.0 million of future payment obligation at a discount rate of 8.22%. We also recorded a non-cash deferred tax benefit from the agreement of approximately $7.0 million. We believe the new agreement reduces long-term financial risk for the Partnership. This 2015 expense is non-recurring.
Finance Charge Income
For fiscal 2016, finance charge income decreased by $1.7 million, or 35.3%, to $3.1 million compared to $4.8 million for fiscal 2015. The decline in the wholesale cost of product and the decline in volume sold led to lower product sales and thus a decline in accounts receivable balances subject to a finance charge.
32
Table of Contents
Interest Expense, Net
For fiscal 2016, interest expense decreased $6.6 million, or 46.8%, to $7.5 million compared to $14.1 million for fiscal 2015. In September 2015, the Partnership redeemed its $125.0 million principal amount of 8.875% Senior Notes outstanding due 2017 with proceeds from a new, five year $100.0 million bank term-loan and cash. This refinancing drove the reduction in interest expense due to lower variable rates and lower principal outstanding.
Amortization of Debt Issuance Costs
For fiscal 2016, amortization of debt issuance costs decreased $0.6 million to $1.2 million compared to $1.8 million for fiscal 2015. The refinancing of the Partnership’s 8.875% Senior Notes with the bank term-loan resulted in a lower level of deferred charges to be written off.
Loss on Debt Redemption of Debt
In September 2015, the Partnership redeemed all of its $125.0 million principal amount of 8.875% Senior Notes due 2017, at the then current redemption price of $104.438 per $100 of principal plus accrued interest. The Partnership recorded a loss of $7.3 million on this transaction, resulting from the $5.5 million redemption price premium, the related write-offs of $1.5 million in unamortized deferred charges and $0.3 million of unamortized debt discount. This expense is non-recurring in fiscal 2016.
Income Tax Expense
For fiscal 2016, the Partnership’s income tax expense increased by $0.9 million to $33.7 million, from $32.8 million for fiscal 2015, primarily due to an increase in income before income taxes of $8.3 million, partially offset by a reduction in the effective income tax rate. The Partnership’s effective income tax rate was 42.9% for fiscal 2016, compared to 46.6 % for fiscal 2015. In fiscal 2015, the loss on the redemption of the Partnership’s $125.0 million principal amount of 8.875% Senior Notes due 2017 was not deductible at the Partnership’s corporate subsidiaries which caused an increase in the effective tax rate for that year.
Net Income
For fiscal 2016, net income increased $7.4 million, or 19.6%, to $44.9 million, from $37.6 million for fiscal 2015, primarily due to an increase in pretax profit of $8.3 million.
Adjusted EBITDA
For fiscal 2016, Adjusted EBITDA decreased by $44.8 million, or 31.9%, to $95.7 million as the impact of slightly higher home heating oil and propane per gallon margins, lower operating expenses in the base business, lower service and installation costs and the $12.5 million credit recorded in the first quarter of 2016 under the weather insurance contract were more than offset by the impact of the decline in volume attributable to the 21.6% warmer weather and net customer attrition for fiscal 2016.
EBITDA and Adjusted EBITDA should not be considered as an alternative to net income (as an indicator of operating performance) or as an alternative to cash flow (as a measure of liquidity or ability to service debt obligations), but each provides additional information for evaluating our ability to make the Minimum Quarterly Distribution.
33
Table of Contents
EBITDA and Adjusted EBITDA are calculated as follows:
| Twelve Months Ended September 30, |
||||||||
| (in thousands) |
2016 | 2015 | ||||||
| Net income |
$ | 44,934 | $ | 37,556 | ||||
| Plus: |
||||||||
| Income tax expense |
33,738 | 32,835 | ||||||
| Amortization of debt issuance cost |
1,247 | 1,818 | ||||||
| Interest expense, net |
7,485 | 14,059 | ||||||
| Depreciation and amortization |
26,530 | 24,930 | ||||||
|
|
|
|
|
|||||
| EBITDA (a) |
113,934 | 111,198 | ||||||
| (Increase) / decrease in the fair value of derivative instruments |
(18,217 | ) | 4,187 | |||||
| Multiemployer pension plan withdrawal charge |
— | 17,796 | ||||||
| Loss on redemption of debt |
— | 7,345 | ||||||
|
|
|
|
|
|||||
| Adjusted EBITDA (a) |
95,717 | 140,526 | ||||||
| Add / (subtract) |
||||||||
| Income tax expense |
(33,738 | ) | (32,835 | ) | ||||
| Interest expense, net |
(7,485 | ) | (14,059 | ) | ||||
| Multiemployer pension plan withdrawal charge |
— | (17,796 | ) | |||||
| (Recovery) provision for losses on accounts receivable |
(639 | ) | 3,738 | |||||
| Decrease in accounts receivables |
10,965 | 30,141 | ||||||
| Decrease in inventories |
9,979 | 4,326 | ||||||
| Increase in customer credit balances |
6,490 | 3,992 | ||||||
| Change in deferred taxes |
9,670 | (4,101 | ) | |||||
| Change in other operating assets and liabilities |
10,998 | 22,921 | ||||||
|
|
|
|
|
|||||
| Net cash provided by operating activities |
$ | 101,957 | $ | 136,853 | ||||
|
|
|
|
|
|||||
| Net cash used in investing activities |
$ | (19,631 | ) | $ | (30,385 | ) | ||
|
|
|
|
|
|||||
| Net cash used in financing activities |
$ | (43,646 | ) | $ | (54,959 | ) | ||
|
|
|
|
|
|||||
| (a) | EBITDA (Earnings from continuing operations before net interest expense, income taxes, depreciation and amortization) and Adjusted EBITDA (Earnings from continuing operations before net interest expense, income taxes, depreciation and amortization, (increase) decrease in the fair value of derivatives, multiemployer pension plan withdrawal charge, gain or loss on debt redemption, goodwill impairment, and other non-cash and non-operating charges) are non-GAAP financial measures that are used as supplemental financial measures by management and external users of our financial statements, such as investors, commercial banks and research analysts, to assess: |
| • | our compliance with certain financial covenants included in our debt agreements; |
| • | our financial performance without regard to financing methods, capital structure, income taxes or historical cost basis; |
| • | our operating performance and return on invested capital compared to those of other companies in the retail distribution of refined petroleum products, without regard to financing methods and capital structure; |
| • | our ability to generate cash sufficient to pay interest on our indebtedness and to make distributions to our partners; and |
| • | the viability of acquisitions and capital expenditure projects and the overall rates of return of alternative investment opportunities. |
The method of calculating Adjusted EBITDA may not be consistent with that of other companies, and EBITDA and Adjusted EBITDA both have limitations as analytical tools and so should not be viewed in isolation and should be viewed in conjunction with measurements that are computed in accordance with GAAP. Some of the limitations of EBITDA and Adjusted EBITDA are:
| • | EBITDA and Adjusted EBITDA do not reflect our cash used for capital expenditures; |
| • | Although depreciation and amortization are non-cash charges, the assets being depreciated or amortized often will have to be replaced and EBITDA and Adjusted EBITDA do not reflect the cash requirements for such replacements; |
| • | EBITDA and Adjusted EBITDA do not reflect changes in, or cash requirements for, our working capital requirements; |
| • | EBITDA and Adjusted EBITDA do not reflect the cash necessary to make payments of interest or principal on our indebtedness; and |
| • | EBITDA and Adjusted EBITDA do not reflect the cash required to pay taxes. |
34
Table of Contents
Fiscal Year Ended September 30, 2015
Compared to Fiscal Year Ended September 30, 2014
Volume
For fiscal 2015, retail volume of home heating oil and propane sold increased by 21.8 million gallons, or 6.1%, to 382.8 million gallons, compared to 361.0 million gallons for fiscal 2014. For those locations where the Partnership had existing operations during both periods, which we sometimes refer to as the “base business” (i.e., excluding acquisitions), temperatures (measured on a heating degree day basis) for fiscal 2015 were approximately equal to fiscal 2014 but 5.0% colder than normal, as reported by NOAA. For fiscal 2015, net customer attrition for the base business was 1.8%. Due to various reasons, we believe that our customers are adopting conservation measures to use less of our products. The impact of any such conservation, along with any period-to-period differences in delivery scheduling, the timing of accounts added or lost during the fiscal years, equipment efficiency and other volume variances not otherwise described, are also included in the chart under the heading “Other.” An analysis of the change in the retail volume of home heating oil and propane, which is based on management’s estimates, sampling and other mathematical calculations and certain assumptions, is found below:
| (in millions of gallons) |
Heating Oil and Propane |
|||
| Volume - Fiscal 2014 |
361.0 | |||
| Acquisitions |
27.0 | |||
| Weather impact |
(0.1 | ) | ||
| Net customer attrition |
(9.3 | ) | ||
| Other |
4.2 | |||
|
|
|
|||
| Change |
21.8 | |||
|
|
|
|||
| Volume - Fiscal 2015 |
382.8 | |||
|
|
|
|||
The following chart sets forth the percentage by volume of total home heating oil sold to residential variable-price customers, residential price-protected customers and commercial/industrial/other customers for fiscal 2015 compared to fiscal 2014:
| Twelve Months Ended | ||||||||
| Customers |
September 30, 2015 | September 30, 2014 | ||||||
| Residential Variable |
37.9 | % | 39.8 | % | ||||
| Residential Price-Protected |
48.1 | % | 45.9 | % | ||||
| Commercial/Industrial/Other |
14.0 | % | 14.3 | % | ||||
|
|
|
|
|
|||||
| Total |
100.0 | % | 100.0 | % | ||||
|
|
|
|
|
|||||
The Partnership has experienced a shift from our variable pricing plans to our price-protected plans as new customers and existing customers seek surety of price, which may impact our weighted average per gallon margins in the future.
Volume of other petroleum products sold increased by 15.5 million gallons, or 18.0%, to 101.4 million gallons for fiscal 2015, compared to 85.9 million gallons for fiscal 2014, largely due to the additional volume from acquisitions of 21.1 million gallons, partially offset by a decline in the base business of 5.6 million gallons.
Product Sales
For fiscal 2015, product sales decreased $0.3 billion, or 17.5%, to $1.4 billion, compared to $1.7 billion for fiscal 2014, as the impact from an increase in total volume of 8.4% and higher per gallon gross profit margins was more than offset by a decline in wholesale product costs of $1.0006 per gallon, or 33.1%.
35
Table of Contents
Installations and Services Sales
For fiscal 2015, installation and service sales increased $15.5 million, or 6.8%, to $242.7 million, compared to $227.3 million for fiscal 2014, primarily due to additional revenue from acquisitions of $10.8 million and an increase in the base business of $4.7 million.
Cost of Product
For fiscal 2015, cost of product decreased $0.371 billion, or 27.6%, to $0.978 billion, compared to $1.349 billion for fiscal 2014, as an increase in total volume of 8.4% was more than offset by a 33.1% decline, or $1.0006 per gallon, in wholesale product costs.
Gross Profit—Product
The table below calculates the Partnership’s per gallon margins and reconciles product gross profit for home heating oil and propane and other petroleum products. We believe the change in home heating oil and propane margins should be evaluated before the effects of unrealized increases or decreases in the fair value of derivative instruments, as we believe that realized per gallon margins should not include the impact of non-cash changes in the market value of hedges before the settlement of the underlying transaction. On that basis, home heating oil and propane margins for fiscal 2015 increased by $0.1058 per gallon, or 10.6%, to $1.1062 per gallon, from $1.0004 per gallon during fiscal 2014, due in part to the impact of the Griffith acquisition and primarily due to an increase in the base business as home heating oil and propane margins increased $0.0938 per gallon or 9.4%. In the previous five fiscal years, on average, our home heating oil and propane margins have increased by $0.0204 per gallon annually. The expansion of the Partnership’s margins during fiscal 2015 is in excess of the historical average by $0.0734 per gallon in the base business. The Partnership was able to expand its per gallon margins due to the precipitous decline in per gallon wholesale product costs. In addition, numerous snow storms and the intensity of the winter weather conditions experienced during the second quarter of fiscal 2015, drove an increase in operating and service costs and necessitated an increase in per gallon margins to help defray these additional operating expenses. Going forward, the Partnership cannot guarantee that the per gallon margins achieved during fiscal 2015 are sustainable and anticipates that per gallon margins will contract. Product sales and cost of product include the wholesale cost of home heating oil, propane, other petroleum products and liquidated damages billings.
| Twelve Months Ended | ||||||||||||||||
| September 30, 2015 | September 30, 2014 | |||||||||||||||
| Home Heating Oil and Propane |
Amount (in millions) |
Per Gallon |
Amount (in millions) |
Per Gallon |
||||||||||||
| Volume |
382.8 | 361.0 | ||||||||||||||
|
|
|
|
|
|||||||||||||
| Sales |
$ | 1,202.5 | $ | 3.1410 | $ | 1,452.5 | $ | 4.0241 | ||||||||
| Cost |
779.0 | $ | 2.0348 | $ | 1,091.4 | $ | 3.0237 | |||||||||
|
|
|
|
|
|
|
|
|
|||||||||
| Gross Profit |
$ | 423.5 | $ | 1.1062 | $ | 361.1 | $ | 1.0004 | ||||||||
|
|
|
|
|
|
|
|
|
|||||||||
| Other Petroleum Products |
Amount (in millions) |
Per Gallon |
Amount (in millions) |
Per Gallon |
||||||||||||
| Volume |
101.4 | 85.9 | ||||||||||||||
|
|
|
|
|
|||||||||||||
| Sales |
$ | 229.1 | $ | 2.2601 | $ | 281.9 | $ | 3.2812 | ||||||||
| Cost |
$ | 198.6 | $ | 1.9595 | $ | 258.0 | $ | 3.0027 | ||||||||
|
|
|
|
|
|
|
|
|
|||||||||
| Gross Profit |
$ | 30.5 | $ | 0.3006 | $ | 23.9 | $ | 0.2785 | ||||||||
|
|
|
|
|
|
|
|
|
|||||||||
| Total Product |
Amount (in millions) |
Amount (in millions) |
||||||||||||||
| Sales |
$ | 1,431.6 | $ | 1,734.4 | ||||||||||||
| Cost |
$ | 977.6 | $ | 1,349.4 | ||||||||||||
|
|
|
|
|
|||||||||||||
| Gross Profit |
$ | 454.0 | $ | 385.0 | ||||||||||||
|
|
|
|
|
|||||||||||||
36
Table of Contents
For fiscal 2015, total product gross profit increased by $69.0 million to $454.0 million, compared to $385.0 million for fiscal 2014, due to an increase in home heating oil and propane volume ($21.9 million), the impact of higher home heating oil and propane margins ($40.5 million), and the additional gross profit from other petroleum products ($6.5 million).
Cost of Installations and Services
For fiscal 2015, cost of installations and services increased by $20.1 million, or 9.8%, to $225.9 million, compared to $205.8 million for fiscal 2014, reflecting a $9.7 million increase related to acquisitions and $10.4 million higher expenses in our base business.
Installation costs for fiscal 2015, rose by $2.8 million, or 4.0%, to $73.2 million, compared to $70.4 million in installation costs for fiscal 2014 due to acquisitions. Installation costs as a percentage of installation sales for fiscal 2015 and fiscal 2014 were 84.2% and 85.3%, respectively. Service expenses increased to $152.8 million for fiscal 2015, or 98.1% of service sales, versus $135.5 million, or 93.6% of service sales, for fiscal 2014. The higher service expense of $17.3 million reflects an increase related to acquisitions of $6.6 million and an increase in the base business of $10.6 million, or 7.9%. In addition to normal inflationary pressures on service expenses, the 5.8% colder temperatures experienced in the second quarter of fiscal 2015 drove an increase in the amount of service work required to ensure our customers’ heating systems were operational. The numerous snow storms in certain areas of our footprint hampered productivity and also drove an increase in service costs as the additional service work was performed at premium labor rates. In addition, the Partnership’s expansion of its service offerings resulted in an increase in service costs. We experienced a combined gross profit from service and installation of $16.7 million for fiscal 2015, compared to a combined gross profit of $21.4 million fiscal 2014. Management views the service and installation department on a combined basis because many overhead functions and direct expenses such as service technician time cannot be separated or precisely allocated to either service or installation billings.
(Increase) / Decrease in the Fair Value of Derivative Instruments
During fiscal 2015, the change in the fair value of derivative instruments resulted in a $4.2 million charge due to the expiration of certain hedged positions (a $12.1 million credit) and a decrease in the market value for unexpired hedges (a $16.3 million charge).
During fiscal 2014, the change in the fair value of derivative instruments resulted in a $6.6 million charge due to the expiration of certain hedged positions (a $5.6 million credit) and a decrease in the market value for unexpired hedges (a $12.2 million charge).
Delivery and Branch Expenses
For fiscal 2015, delivery and branch expense increased $26.4 million, or 9.3%, to $309.0 million, compared to $282.6 million for fiscal 2014, as a result of an increase related to acquisitions of $19.3 million and an increase in the base business of $7.1 million due in part to the colder temperatures experienced during the second quarter of fiscal 2015.
On a cents per gallon basis, delivery and branch expenses for fiscal 2015, increased slightly to $0.6529 compared to $0.6514 for fiscal 2014. The additional volume delivered during the second fiscal quarter (due to colder weather) was at premium labor rates, and the numerous snow storms created operational inefficiencies which also led to a higher than expected cents per gallon of delivery and branch expenses. This was offset by lower per gallon operating expense from acquisitions.
Depreciation and Amortization
For fiscal 2015, depreciation and amortization expense increased by $3.3 million, or 15.2%, to $24.9 million, compared to $21.6 million for fiscal 2014 largely due to fiscal 2014 and 2015 acquisitions.
General and Administrative Expenses
For fiscal 2015, general and administrative expenses increased $3.3 million, or 14.7 %, to $25.9 million, from $22.6 million for fiscal 2014, as a result of an increase in profit sharing expense of $1.8 million and $1.5 million in legal and professional fees largely due to a debt refinancing abandoned by the Partnership in the first quarter of fiscal 2015.
The Partnership accrues approximately 6% of Adjusted EBITDA as defined in the profit sharing plan for distribution to its employees, and this amount is payable when the Partnership achieves Adjusted EBITDA of at least 70% of the amount budgeted. The dollar amount of the profit sharing pool is subject to increases and decreases in line with increases and decreases in Adjusted EBITDA.
37
Table of Contents
Multiemployer Pension Plan Withdrawal Charge
In fiscal 2015, we entered into an agreement among certain Star subsidiaries and the New England Teamsters and Trucking Industry Pension Fund (the “NETTI Fund”), a multiemployer pension plan in which such Star subsidiaries participate, providing for Star’s participating subsidiaries to withdraw from the NETTI Fund’s original employer pool and enter the NETTI Fund’s new employer pool. The withdrawal from the original employer pool triggered an undiscounted withdrawal obligation of $48.0 million to be paid in equal monthly installments over 30 years, or $1.6 million per year. The estimated annual after-tax cash impact of entering into this agreement is $0.9 million. In September 2015, we recorded a non-cash charge in order to establish a withdrawal obligation of approximately $17.8 million on the consolidated balance sheet, representing the present value of the $48.0 million future payment obligation at a discount rate of 8.22%. We also recorded a non-cash deferred tax benefit from the agreement of approximately $7.0 million. We believe the new agreement reduces long-term financial risk for the Partnership.
Finance Charge Income
For fiscal 2015, finance charge income decreased $2.1 million to $4.8 million, compared to $6.9 million for fiscal 2014. The decline in the wholesale cost of product led to lower retail selling prices and thus a decline in accounts receivable balances subject to a finance charge.
Interest Expense, Net
For fiscal 2015, interest expense decreased $2.8 million, or 16.6 %, to $14.1 million compared to $16.9 million for fiscal 2014 primarily due in part to a decrease in average working capital borrowings of $68.7 million. Working capital borrowings were lower due to lower wholesale product costs. In September 2015, the Partnership redeemed its $125.0 million principal amount of 8.875% Senior Notes outstanding due 2017 with proceeds from a new, five year $100.0 million bank term-loan and cash. This refinancing resulted in a reduction of interest expense of $0.6 million due to lower variable rates.
Amortization of Debt Issuance Costs
For fiscal 2015, amortization of debt issuance costs increased by $0.2 million to $1.8 million compared to $1.6 million for fiscal 2014 largely due to the Partnership’s debt refinancing.
Loss on Debt Redemption
In September 2015, the Partnership redeemed all its $125.0 million principal amount of 8.875% Senior Notes due 2017, at the then current redemption price of $104.438 per $100 of principal plus accrued interest. The Partnership recorded a loss of $7.3 million on this transaction, resulting from the $5.5 million redemption price premium, the related write-offs of $1.5 million in unamortized deferred charges, and $0.3 million of unamortized debt discount.
Income Tax Expense
For fiscal 2015, income tax expense increased by $7.5 million to $32.8 million from $25.3 million for fiscal 2014, due to an increase in pretax income of $9.0 million as well as an increase in the effective income tax rate. The Partnership’s effective tax rate was 46.6% for fiscal 2015 versus 41.2% for fiscal 2014. The loss on the redemption of the Partnership’s $125.0 million principal amount of 8.875% Senior Notes due 2017 was not deductible at the Partnership’s corporate subsidiaries which drove the increase in the effective tax rate.
Net Income
For fiscal 2015, net income increased $1.5 million to $37.6 million, from $36.1 million for fiscal 2014, as the increase in pretax income of $9.0 million was greater than the increase in income tax expense of $7.5 million.
Adjusted EBITDA
For fiscal 2015, Adjusted EBITDA increased by $32.5 million, or 30.0 %, to $140.5 million as the impact of higher home heating oil and propane per gallon margins and acquisitions more than offset higher operating and service costs largely attributable to colder temperatures and numerous snow storms during the second quarter of fiscal 2015 and the volume decline in the base business attributable to net customer attrition.
38
Table of Contents
EBITDA and Adjusted EBITDA should not be considered as an alternative to net income (as an indicator of operating performance) or as an alternative to cash flow (as a measure of liquidity or ability to service debt obligations), but provides additional information for evaluating our ability to make the Minimum Quarterly Distribution.
EBITDA and Adjusted EBITDA are calculated as follows:
| Twelve Months Ended September 30, |
||||||||
| (in thousands) |
2015 | 2014 | ||||||
| Net income |
$ | 37,556 | $ | 36,084 | ||||
| Plus: |
||||||||
| Income tax expense |
32,835 | 25,315 | ||||||
| Amortization of debt issuance cost |
1,818 | 1,602 | ||||||
| Interest expense, net |
14,059 | 16,854 | ||||||
| Depreciation and amortization |
24,930 | 21,635 | ||||||
|
|
|
|
|
|||||
| EBITDA (a) |
111,198 | 101,490 | ||||||
| (Increase) / decrease in the fair value of derivative instruments |
4,187 | 6,566 | ||||||
| Multiemployer pension plan withdrawal charge |
17,796 | — | ||||||
| Loss on redemption of debt |
7,345 | — | ||||||
|
|
|
|
|
|||||
| Adjusted EBITDA (a) |
140,526 | 108,056 | ||||||
| Add / (subtract) |
||||||||
| Income tax expense |
(32,835 | ) | (25,315 | ) | ||||
| Interest expense, net |
(14,059 | ) | (16,854 | ) | ||||
| Multiemployer pension plan withdrawal charge |
(17,796 | ) | — | |||||
| Provision for losses on accounts receivable |
3,738 | 7,514 | ||||||
| Decrease in accounts receivables |
30,141 | 12,771 | ||||||
| Decrease in inventories |
4,326 | 14,057 | ||||||
| Increase (decrease) in customer credit balances |
3,992 | (2,433 | ) | |||||
| Change in deferred taxes |
(4,101 | ) | 658 | |||||
| Change in other operating assets and liabilities |
22,921 | (3,299 | ) | |||||
|
|
|
|
|
|||||
| Net cash provided by operating activities |
$ | 136,853 | $ | 95,155 | ||||
|
|
|
|
|
|||||
| Net cash used in investing activities |
$ | (30,385 | ) | $ | (107,318 | ) | ||
|
|
|
|
|
|||||
| Net cash used in financing activities |
$ | (54,959 | ) | $ | (23,895 | ) | ||
|
|
|
|
|
|||||
| (a) | EBITDA (Earnings from continuing operations before net interest expense, income taxes, depreciation and amortization) and Adjusted EBITDA (Earnings from continuing operations before net interest expense, income taxes, depreciation and amortization, (increase) decrease in the fair value of derivatives, multiemployer pension plan withdrawal charge, gain or loss on debt redemption, goodwill impairment, and other non-cash and non-operating charges) are non-GAAP financial measures that are used as supplemental financial measures by management and external users of our financial statements, such as investors, commercial banks and research analysts, to assess: |
| • | our compliance with certain financial covenants included in our debt agreements; |
| • | our financial performance without regard to financing methods, capital structure, income taxes or historical cost basis; |
| • | our operating performance and return on invested capital compared to those of other companies in the retail distribution of refined petroleum products, without regard to financing methods and capital structure; |
| • | our ability to generate cash sufficient to pay interest on our indebtedness and to make distributions to our partners; and |
| • | the viability of acquisitions and capital expenditure projects and the overall rates of return of alternative investment opportunities. |
39
Table of Contents
The method of calculating Adjusted EBITDA may not be consistent with that of other companies, and EBITDA and Adjusted EBITDA both have limitations as analytical tools and so should not be viewed in isolation and should be viewed in conjunction with measurements that are computed in accordance with GAAP. Some of the limitations of EBITDA and Adjusted EBITDA are:
| • | EBITDA and Adjusted EBITDA do not reflect our cash used for capital expenditures; |
| • | Although depreciation and amortization are non-cash charges, the assets being depreciated or amortized often will have to be replaced and EBITDA and Adjusted EBITDA do not reflect the cash requirements for such replacements; |
| • | EBITDA and Adjusted EBITDA do not reflect changes in, or cash requirements for, our working capital requirements; |
| • | EBITDA and Adjusted EBITDA do not reflect the cash necessary to make payments of interest or principal on our indebtedness; and |
| • | EBITDA and Adjusted EBITDA do not reflect the cash required to pay taxes. |
DISCUSSION OF CASH FLOWS
We use the indirect method to prepare our Consolidated Statements of Cash Flows. Under this method, we reconcile net income to cash flows provided by operating activities by adjusting net income for those items that impact net income but may not result in actual cash receipts or payment during the period.
Operating Activities
Due to the seasonal nature of our business, cash is generally used in operations during the winter (our first and second fiscal quarters) as we require additional working capital to support the high volume of sales during this period, and cash is generally provided by operating activities during the spring and summer (our third and fourth quarters) when customer payments exceed the cost of deliveries.
During fiscal 2016, cash provided by operating activities decreased by $34.9 million to $102.0 million, compared to $136.9 million of cash provided by operating activities during fiscal 2015, largely due to a $29.7 million decrease in cash generated from operations and an unfavorable change in accounts receivable of $16.7 million (including customer credit balances). The impact of the significantly warmer weather drove the reduction in cash flow from operating activities and the change in accounts receivable. Cash flow from operations was positively impacted by a change in other assets and liabilities of $11.5 million.
During fiscal 2015, cash provided by operating activities increased by $41.7 million to $136.9 million, compared to $95.2 million of cash provided by operating activities during fiscal 2014, as a $19.2 million increase in cash generated from operations and a favorable change in accounts receivable of $23.8 million (including customer credit balances) were reduced by changes in other assets and liabilities of $1.3 million. Cash flow from operating activities increased largely due to the impact of acquisitions and accounts receivable were favorably impacted by a decline in wholesale product costs.
Investing Activities
Our capital expenditures for fiscal 2016 totaled $10.1 million, as we invested in computer hardware and software ($2.8 million), refurbished certain physical plants ($1.3 million), expanded our propane operations ($2.9 million) and made additions to our fleet and other equipment ($3.1 million). We also completed four acquisitions for $9.8 million and allocated $7.4 million of the gross purchase price to intangible assets, $2.5 million to fixed assets and reduced working capital by $0.1 million.
Our capital expenditures for fiscal 2015 totaled $9.6 million, as we invested in computer hardware and software ($2.9 million), refurbished certain physical plants ($1.4 million), expanded our propane operations ($2.7 million) and made additions to our fleet and other equipment ($2.6 million). We also completed two acquisitions for $21.1 million and allocated $20.7 million of the gross purchase price to intangible assets, $2.5 million to fixed assets and reduced working capital by $2.1 million.
Financing Activities
During fiscal 2016, we paid distributions of $22.6 million to our common unit holders, $0.5 million to our general partner (including $0.4 million of incentive distributions as provided in our Partnership Agreement) and repaid $7.5 million of our term-loan. We also repurchased 1.4 million common units for $12.0 million in connection with our unit repurchase plan.
40
Table of Contents
During fiscal 2015, we borrowed $12.3 million under our credit facility and repaid $12.3 million during the period. We also paid distributions of $21.3 million to our common unit holders, $0.4 million to our general partner (including $0.3 million of incentive distributions as provided in our Partnership Agreement). In September 2015, the Partnership redeemed its $125.0 million principal amount of 8.875% Senior Notes due 2017 with the proceeds of a $100.0 million bank term-loan and cash. We paid a total of $8.0 million in call premiums and bank fees relating to this transaction.
FINANCING AND SOURCES OF LIQUIDITY
Liquidity and Capital Resources
Our primary uses of liquidity are to provide funds for our working capital, capital expenditures, distributions on our units, acquisitions and unit repurchases. Our ability to provide funds for such uses depends on our future performance, which will be subject to prevailing economic, financial, business and weather conditions, the ability to pass on the full impact of high product costs to customers, the effects of high net customer attrition, conservation and other factors. Capital requirements, at least in the near term, are expected to be provided by cash flows from operating activities, cash on hand as of September 30, 2016 ($139.2 million) or a combination thereof. To the extent future capital requirements exceed cash on hand plus cash flows from operating activities, we anticipate that working capital will be financed by our revolving credit facility, as discussed below, and repaid from subsequent seasonal reductions in inventory and accounts receivable. As of September 30, 2016, we had no borrowings under our revolving credit facility and $50.6 million in letters of credit were outstanding, primarily for current and future insurance reserves, and our ability to borrow was reduced by $0.3 million to secure hedges with the bank group.
Under the terms of the third amended and restated credit agreement, we must maintain at all times Availability (borrowing base less amounts borrowed and letters of credit issued) of 12.5% of the maximum facility size and a fixed charge coverage ratio of not less than 1.1. While the term-loan is outstanding we must maintain a senior secured leverage ratio that at any time cannot be more than 3.0 as calculated during the quarters ending June or September, and at any time no more than 4.5 as calculated during the quarters ending December or March. As of September 30, 2016, Availability, as defined in the credit agreement, was $163.4 million, and we were in compliance with the fixed charge coverage ratio and senior secured leverage ratio.
Maintenance capital expenditures for fiscal 2017 are estimated to be approximately $9.9 million, excluding the capital requirements for leased fleet. In addition, we plan to invest an additional $4.0 million in our propane operations including several start-up operations. Distributions for fiscal 2017, at the current quarterly level of $0.1025 per unit, would result in an aggregate of approximately $22.9 million to common unit holders, $0.5 million to our general partner (including $0.4 million of incentive distribution as provided for in our Partnership Agreement) and $0.4 million to management pursuant to the management incentive compensation plan which provides for certain members of management to receive incentive distributions that would otherwise be payable to the general partner. Under the terms of our credit facility, our term-loan is repayable in quarterly payments of $2.5 million, or $10 million annually, and the Partnership expects to make an additional term-loan payment of $6.2 million in December 2016 due to Excess Cash Flow (as defined in the credit agreement) generated for fiscal 2016. As a result of the NETTI Fund agreement, the Partnership will be paying $1.6 million to the fund in fiscal 2017. We also intend to contribute $2.0 million into the Partnership’s frozen pension plan and, continue to repurchase Common Units pursuant to our unit repurchase plan, and seek attractive acquisition opportunities within the Availability constraints of our credit agreement and funding resources.
41
Table of Contents
Contractual Obligations and Off-Balance Sheet Arrangements
We have no special purpose entities or off balance sheet debt, other than operating leases entered into in the ordinary course of business.
Long-term contractual obligations, except for our long-term debt and NETTI withdrawal obligations, are not recorded in our consolidated balance sheet. Non-cancelable purchase obligations are obligations we incur during the normal course of business, based on projected needs. The Partnership had no capital lease obligations as of September 30, 2016.
The table below summarizes the payment schedule of our contractual obligations at September 30, 2016 (in thousands):
| Payments Due by Fiscal Year | ||||||||||||||||||||
| 2018 | 2020 | |||||||||||||||||||
| Total | 2017 | and 2019 | and 2021 | Thereafter | ||||||||||||||||
| Long-term debt obligations (a) |
$ | 92,500 | $ | 16,200 | $ | 20,000 | $ | 56,300 | $ | — | ||||||||||
| Operating lease obligations (b) |
117,448 | 17,671 | 29,990 | 22,875 | 46,912 | |||||||||||||||
| Purchase obligations and other (c) |
68,387 | 14,231 | 8,273 | 4,503 | 41,380 | |||||||||||||||
| Interest obligations (d) |
11,679 | 5,504 | 4,631 | 1,544 | — | |||||||||||||||
| Long-term liabilities reflected on the balance sheet (e) |
2,246 | 350 | 700 | 700 | 496 | |||||||||||||||
|
|
|
|
|
|
|
|
|
|
|
|||||||||||
| $ | 292,260 | $ | 53,956 | $ | 63,594 | $ | 85,922 | $ | 88,788 | |||||||||||
|
|
|
|
|
|
|
|
|
|
|
|||||||||||
| (a) | Excludes potential prepayments resulting from Excess Cash Flow as defined in our credit agreement beyond fiscal year 2017. |
| (b) | Represents various operating leases for office space, trucks, vans and other equipment with third parties. |
| (c) | Represents non-cancelable commitments as of September 30, 2016 for operations such as weather hedge premiums, customer related invoice and statement processing, voice and data phone/computer services, real estate taxes on leased property and our undiscounted future payment obligations to the New England Teamsters and Trucking Industry Pension Fund. |
| (d) | Reflects interest obligations on our term loan due July 2020 and the unused commitment fee on the revolving credit facility. |
| (e) | Reflects long-term liabilities excluding a pension accrual of approximately $2.4 million. The Partnership is not obligated to make a minimum required contribution to its two frozen defined benefit pension plans in fiscal year 2017. |
Recent Accounting Pronouncements
In May 2014, the Financial Accounting Standards Board (“FASB”) issued Accounting Standards Update (“ASU”) No. 2014-09, Revenue from Contracts with Customers, which requires an entity to recognize the amount of revenue to which it expects to be entitled for the transfer of promised goods or services to customers. This ASU will replace most existing revenue recognition guidance in GAAP when it becomes effective. This new guidance is effective for our annual reporting period beginning in the first quarter of fiscal 2019, with early adoption permitted beginning in the first quarter of fiscal 2018. The standard permits the use of either the retrospective or cumulative effect transition method. The Partnership is evaluating the effect that ASU 2014-09 will have on its consolidated financial statements and related disclosures. The Partnership has not yet selected a transition method nor has it determined the timing of adoption.
In April 2015, the FASB issued ASU No. 2015-03, Interest—Imputation of Interest (Subtopic 835-30): Simplifying the Presentation of Debt Issuance Costs. The update requires debt issuance costs related to a recognized debt liability be presented in the balance sheet as a direct deduction from the carrying amount of the related debt liability instead of being presented as an asset. The update requires retrospective application and represents a change in accounting principle. The update is effective for our annual reporting period beginning in the first quarter of fiscal 2017, with early adoption permitted. The Partnership expects the impact of ASU No. 2015-03 will be limited to the presentation of debt issuance cost on its balance sheet.
In July 2015, the FASB issued ASU No. 2015-11, Simplifying the Measurement of Inventory. The update changes the measurement principle for inventory from the lower of cost or market to the lower of cost and net realizable value. This new guidance is effective for our annual reporting period beginning in the first quarter of fiscal 2018, with early adoption permitted. The Partnership does not expect ASU No. 2015-11 to have a material impact on its consolidated financial statements and related disclosures.
42
Table of Contents
In September 2015, the FASB issued ASU No. 2015-16, Simplifying the Accounting for Measurement-Period Adjustments, which requires an acquiring entity to recognize adjustments to provisional amounts that are identified during the measurement period in the reporting period in which the adjustment amounts are determined. The acquiring entity is required to record, in the same period’s financial statements, the effect on earnings of changes in depreciation, amortization, or other income effects, if any, as a result of the change to the provisional amounts, calculated as if the accounting had been completed at the acquisition date. In addition, the acquiring entity is to present separately on the face of its income statement or disclose in the notes the portion of the amount recorded in current-period earnings by line item that would have been recorded in previous reporting periods as if the adjustment to the provisional amounts had been recognized as of the acquisition date. This new guidance is effective for our annual reporting period beginning in the first quarter of fiscal 2017. The Partnership does not expect ASU No. 2015-16 to have a material impact on its consolidated financial statements and related disclosures.
In November 2015, FASB issued ASU 2015-17, Income Taxes—Balance Sheet Classification of Deferred Taxes, which eliminates the requirement for companies to present deferred tax assets and liabilities as current and non-current in a classified balance sheet. Instead, companies are required to classify all deferred tax assets and liabilities as non-current. The Partnership retrospectively adopted the ASU effective September 30, 2016. As a result of the adoption, certain prior year balances changed to conform to the current year presentation.
In February 2016, the FASB issued ASU No. 2016-02, Leases. The update requires all leases with a term greater than twelve months to be recognized on the balance sheet through a right-of-use asset and a lease liability and the disclosure of key information pertaining to leasing arrangements. This new guidance is effective for our annual reporting period beginning in the first quarter of fiscal 2020, with early adoption permitted. The Partnership is evaluating the effect that ASU No. 2016-02 will have on its consolidated financial statements and related disclosures, but has not yet selected a transition method or determined the timing of adoption.
In June 2016, the FASB issued ASU No. 2016-13, Financial Instruments – Credit Losses. The update broadens the information that an entity should consider in developing expected credit loss estimates, eliminates the probable initial recognition threshold, and allows for the immediate recognition of the full amount of expected credit losses. This new guidance is effective for our annual reporting period beginning in the first quarter of fiscal 2021, with early adoption permitted in the first quarter of fiscal 2020. The Partnership is evaluating the effect that ASU No. 2016-13 will have on its consolidated financial statements and related disclosures, but has not yet determined the timing of adoption.
In August 2016, the FASB issued ASU No. 2016-15, Statement of Cash Flow (Topic 230): Classification of Certain Cash Receipts and Cash Payments. The update addresses the issues of debt prepayment or debt extinguishment costs, settlement of zero-coupon debt instruments or other debt instruments with coupon interest rates that are insignificant in relation to the effective interest rate of the borrowing, contingent consideration payments made after a business combination, proceeds from the settlement of insurance claims, proceeds from the settlement of corporate owned life insurance policies, distributions received from equity method investees, beneficial interests in securitization transactions, and separately identifiable cash flows and application of the predominance principle. This new guidance is effective for our annual reporting period beginning in the first quarter of fiscal 2019, with early adoption permitted. The Partnership does not expect ASU No. 2016-15 to have a material impact on its consolidated financial statements and related disclosures.
Critical Accounting Estimates
The preparation of financial statements in conformity with Generally Accepted Accounting Principles requires management to establish accounting policies and make estimates and assumptions that affect reported amounts of assets and liabilities at the date of the Consolidated Financial Statements. The Partnership evaluates its policies and estimates on an on-going basis. A change in any of these critical accounting estimates could have a material effect on the results of operations. The Partnership’s Consolidated Financial Statements may differ based upon different estimates and assumptions. The Partnership’s critical accounting estimates have been reviewed with the Audit Committee of the Board of Directors.
Our significant accounting policies are discussed in Note 2 of the Notes to the Consolidated Financial Statements. We believe the following are our critical accounting policies and estimates:
Goodwill and Other Intangible Assets
We calculate amortization using the straight-line method over periods ranging from five to twenty years for intangible assets with finite useful lives based on historical statistics. We use amortization methods and determine asset values based on our best estimates using reasonable and supportable assumptions and projections. Key assumptions used to determine the value of these intangibles include projections of future customer attrition or growth rates, product margin increases, operating expenses, our cost of
43
Table of Contents
capital, and corporate income tax rates. For significant acquisitions we may engage a third party valuation firm to assist in the valuation of intangible assets of that acquisition. We assess the useful lives of intangible assets based on the estimated period over which we will receive benefit from such intangible assets such as historical evidence regarding customer churn rate. In some cases, the estimated useful lives are based on contractual terms. At September 30, 2016, we had $97.7 million of net intangible assets subject to amortization. If lives were shortened by one year, we estimate that amortization for these assets for fiscal 2016 would have increased by approximately $2.7 million.
FASB ASC 350-10-05, Intangibles-Goodwill and Other, requires goodwill to be assessed at least annually for impairment. The Partnership has one reporting segment and performs its annual assessment at the end of August. As provided for by the standard, we performed qualitative assessments (commonly referred to as Step 0) to evaluate whether it is more-likely-than-not (a likelihood that is more than 50%) that goodwill has been impaired, as a basis to determine whether it is necessary to perform the two-step quantitative impairment test. The Partnership’s qualitative assessment included a review of factors such as our reporting segment’s market value compared to its carrying value, our short-term and long-term unit price performance, our planned overall business strategy compared to recent financial results, as well as macroeconomic conditions, industry and market considerations, cost factors, and other relevant Partnership-specific events. In considering the totality of the qualitative factors assessed, based on the weight of evidence it was determined that it was not more-likely-than-not that goodwill was impaired as of August 31, 2016, and as such it was determined that further goodwill testing was not necessary.
Intangible assets with finite lives must be assessed for impairment whenever changes in circumstances indicate that the assets may be impaired. The assessment for impairment requires estimates of future cash flows related to the intangible asset. To the extent the carrying value of the assets exceeds its future undiscounted cash flows, an impairment loss is recorded based on the fair value of the asset.
Fair Values of Derivatives
FASB ASC 815-10-05, Derivatives and Hedging, requires that derivative instruments be recorded at fair value and included in the consolidated balance sheet as assets or liabilities. The Partnership has elected not to designate its derivative instruments as hedging instruments under this guidance, and the change in fair value of the derivative instruments are recognized in our statement of operations.
We have established the fair value of our derivative instruments using estimates determined by our counterparties and subsequently evaluated them internally using established index prices and other sources. These values are based upon, among other things, future prices, volatility, time-to-maturity value and credit risk. The estimate of fair value we report in our financial statements changes as these estimates are revised to reflect actual results, changes in market conditions, or other factors, many of which are beyond our control.
Insurance Reserves
We currently self-insure a portion of workers’ compensation, auto and general liability claims. We establish reserves based upon expectations as to what our ultimate liability may be for outstanding claims using developmental factors based upon historical claim experience, supplemented by a third-party actuary. We periodically evaluate the potential for changes in loss estimates with the support of qualified actuaries. As of September 30, 2016, we had approximately $64.1 million of net insurance reserves. The ultimate resolution of these claims could differ materially from the assumptions used to calculate the reserves, which could have a material adverse effect on results of operations.
| ITEM 7A. | QUANTITATIVE AND QUALITATIVE DISCLOSURES ABOUT MARKET RISK |
We are exposed to interest rate risk primarily through our bank credit facilities. We utilize these borrowings to meet our working capital needs.
At September 30, 2016, we had outstanding borrowings totaling $92.5 million, which are subject to variable interest rates under our credit agreement. In the event that interest rates associated with this facility were to increase 100 basis points, the after tax impact on annual future cash flows would be a decrease of $0.6 million.
We regularly use derivative financial instruments to manage our exposure to market risk related to changes in the current and future market price of home heating oil. The value of market sensitive derivative instruments is subject to change as a result of movements in market prices. Sensitivity analysis is a technique used to evaluate the impact of hypothetical market value changes. Based on a hypothetical ten percent increase in the cost of product at September 30, 2016, the potential impact on our hedging activity would be to increase the fair market value of these outstanding derivatives by $12.2 million to a fair market value of $14.7 million; and conversely a hypothetical ten percent decrease in the cost of product would decrease the fair market value of these outstanding derivatives by $6.1 million to a negative fair market value of $3.6 million.
44
Table of Contents
| ITEM 8. | FINANCIAL STATEMENTS AND SUPPLEMENTARY DATA |
The financial statements and financial statement schedules referred to in the index contained on page F-1 of this report are incorporated herein by reference.
| ITEM 9. | CHANGES IN AND DISAGREEMENTS WITH ACCOUNTANTS ON ACCOUNTING AND FINANCIAL DISCLOSURE |
None.
| ITEM 9A. | CONTROLS AND PROCEDURES |
(a) Evaluation of disclosure controls and procedures.
Our general partner’s chief executive officer and its chief financial officer evaluated the effectiveness of the Partnership’s disclosure controls and procedures (as that term is defined in Rule 13a-15(e) of the Securities Exchange Act of 1934, as amended) as of September 30, 2016. Based on that evaluation, such chief executive officer and chief financial officer concluded that the Partnership’s disclosure controls and procedures were effective as of September 30, 2016 at the reasonable level of assurance. For purposes of Rule 13a-15(e), the term disclosure controls and procedures means controls and other procedures of an issuer that are designed to ensure that information required to be disclosed by the issuer in the reports that it files or submits under the Act (15 U.S.C. 78a et seq.) is recorded, processed, summarized and reported, within the time periods specified in the Commission’s rules and forms. Disclosure controls and procedures include, without limitation, controls and procedures designed to ensure that information required to be disclosed by an issuer in the reports that it files or submits under the Act is accumulated and communicated to the issuer’s management, including its chief executive and chief financial officer, or persons performing similar functions, as appropriate to allow timely decisions regarding required disclosure.
(b) Management’s Report on Internal Control over Financial Reporting.
Our management is responsible for establishing and maintaining adequate internal control over financial reporting, as such term is defined in Exchange Act Rules 13a-15(f) under the Securities Exchange Act of 1934, as amended. Under the supervision of management and with the participation of our management, including our chief executive officer and chief financial officer, we conducted an evaluation of the effectiveness of our internal control over financial reporting based on the framework Internal Control—Integrated Framework (2013) issued by the Committee of Sponsoring Organizations of the Treadway Commission (COSO). Based on our evaluation of internal control over financial reporting, our management concluded that our internal control over financial reporting was effective as of September 30, 2016.
The effectiveness of our internal control over financial reporting as of September 30, 2016 has been audited by our independent registered public accounting firm, as stated in their report which is included herein.
(c) Change in Internal Control over Financial Reporting.
There were no changes in our internal control over financial reporting during the Partnership’s most recent fiscal quarter that has materially affected, or is reasonably likely to materially affect, our internal control over financial reporting.
(d) Other
Our general partner and the Partnership believe that a controls system, no matter how well designed and operated, cannot provide absolute assurance that the objectives of the controls system are met, and no evaluation of controls can provide absolute assurance that all control issues and instances of fraud, if any, within a Partnership have been detected. Therefore, a control system, no matter how well conceived and operated, can provide only reasonable, not absolute, assurance that the objectives of the control system are met. Our disclosure controls and procedures are designed to provide such reasonable assurances of achieving our desired control objectives, and the chief executive officer and chief financial officer of our general partner have concluded, as of September 30, 2016, that our disclosure controls and procedures were effective in achieving that level of reasonable assurance.
45
Table of Contents
| ITEM 9B. | OTHER INFORMATION |
On December 6, 2016, the Partnership entered into an employment agreement with Steven J. Goldman, effective as of October 1, 2016 pursuant to which he will continue to serve as President of the Partnership. Pursuant to this agreement Mr. Goldman will receive a base salary of $450,000 per annum. The agreement may be terminated at any time by either party. Under his employment agreement, if Mr. Goldman is terminated for reasons other than cause or if he terminates his employment for good reason, Mr. Goldman will be entitled to one year’s salary as severance. Mr. Goldman also agreed not to compete with the Partnership or to engage in the sale of heating oil or propane on a retail basis during the period of his employment and for twelve months thereafter.
The description of this agreement is qualified in its entirety by the text of the agreement that is filed as an exhibit hereto.
| ITEM 10. | DIRECTORS, EXECUTIVE OFFICERS AND CORPORATE GOVERNANCE |
Partnership Management
Our general partner is Kestrel Heat. The Board of Directors of Kestrel Heat is appointed by its sole member, Kestrel, which is a private equity investment partnership formed by Yorktown Energy Partners VI, L.P., Paul A. Vermylen Jr. and other investors.
Kestrel Heat, as our general partner, oversees our activities. Unitholders do not directly or indirectly participate in our management or operation or elect the directors of the general partner. The Board of Directors (sometimes referred to as the “Board”) of Kestrel Heat has adopted a set of Partnership Governance Guidelines in accordance with the requirements of the New York Stock Exchange. A copy of these Guidelines is available on our website at www.Star-Gas.com or a copy may be obtained without charge by contacting Richard F. Ambury, (203) 328-7310.
As of November 30, 2016, Kestrel Heat and its affiliates owned an aggregate of 13,261,350 common units, representing 23.73% of the issued and outstanding common units, and Kestrel Heat owned 325,729 general partner units.
The general partner owes a fiduciary duty to the unitholders. However, our Partnership Agreement contains provisions that allow the general partner to take into account the interests of parties other than the limited partners in resolving conflict of interest, thereby limiting such fiduciary duty. Notwithstanding any limitation on obligations or duties, the general partner will be liable, as our general partner, for all our debts (to the extent not paid by us), except to the extent that indebtedness or other obligations incurred by us are made specifically non-recourse to the general partner.
As is commonly the case with publicly traded limited partnerships, the general partner does not directly employ any of the persons responsible for managing or operating the Partnership.
Directors and Executive Officers of the General Partner
Directors are appointed for an indefinite term, subject to the discretion of Kestrel. The following table shows certain information for directors and executive officers of the general partner as of November 30, 2016:
| Name |
Age | Position | ||||
| Paul A. Vermylen, Jr. |
69 | Chairman, Director | ||||
| Steven J. Goldman |
56 | President, Chief Executive Officer and Director | ||||
| Richard F. Ambury |
59 | Chief Financial Officer, Executive Vice President, Treasurer and Secretary | ||||
| Richard G. Oakley |
56 | Senior Vice President - Accounting | ||||
| Henry D. Babcock(1) |
76 | Director | ||||
| C. Scott Baxter(1) |
55 | Director | ||||
| Daniel P. Donovan |
70 | Director | ||||
| Bryan H. Lawrence |
74 | Director | ||||
| Sheldon B. Lubar |
87 | Director | ||||
| William P. Nicoletti (1) |
71 | Director | ||||
| (1) | Audit Committee member |
46
Table of Contents
Paul A. Vermylen, Jr. Mr. Vermylen has been the Chairman and a director of Kestrel Heat since April 28, 2006. Mr. Vermylen is a founder of Kestrel and has served as its President and as a manager since July 2005. Mr. Vermylen had been employed since 1971, serving in various capacities, including as a Vice President of Citibank N.A. and Vice President-Finance of Commonwealth Oil Refining Co. Inc. Mr. Vermylen served as Chief Financial Officer of Meenan Oil Co., L.P. (“Meenan”) from 1982 until 1992 and as President of Meenan until 2001, when we acquired Meenan. Since 2001, Mr. Vermylen has pursued private investment opportunities.
Mr. Vermylen serves as a director of certain non-public companies in the energy industry in which Kestrel holds equity interests including Downeast LNG, Inc. Mr. Vermylen is a graduate of Georgetown University and has an M.B.A. from Columbia University.
Mr. Vermylen’s substantial experience in the home heating oil industry and his leadership skills and experience as an executive officer of Meenan, among other factors, led the Board to conclude that he should serve as the Chairman and a director of Kestrel Heat.
Steven J. Goldman. Mr. Goldman has been President and Chief Executive Officer of Kestrel Heat since October 1, 2013. Mr. Goldman has been a director of Kestrel Heat since October 29, 2013. From May 1, 2010 to September 30, 2013, Mr. Goldman was Executive Vice President and Chief Operating Officer of Kestrel Heat, and was Senior Vice President of Operations from April 1, 2007 until April 30, 2010. Mr. Goldman was Vice President of Operations of Petro Holdings, Inc. from July 2004 until May 31, 2007. From February 2000 to June 2004, Mr. Goldman held various operating management positions with Petro. Prior to joining Petro Holdings, Inc. as a General Manager in 2000, Mr. Goldman worked for United Parcel Service from 1982 to 2000. Mr. Goldman has also held various positions within the management of companies in industrial engineering and those with international operations. Mr. Goldman is a graduate of the State University of New York at Stony Brook.
Mr. Goldman’s in-depth knowledge of the Partnership’s business and his substantial experience in the home heating oil industry, among other factors, led the Board to conclude that he should serve as a director of Kestrel Heat.
Richard F. Ambury. Mr. Ambury has been Executive Vice President of Kestrel Heat since May 1, 2010 and has been Chief Financial Officer, Treasurer and Secretary of Kestrel Heat since April 28, 2006. Mr. Ambury was Chief Financial Officer, Treasurer and Secretary of Star Gas Partners from May 2005 until April 28, 2006. From November 2001 to May 2005, Mr. Ambury was Vice President and Treasurer of Star Gas Partners. From March 1999 to November 2001, Mr. Ambury was Vice President of Star Gas Propane, L.P. From February 1996 to March 1999, Mr. Ambury served as Vice President—Finance of Star Gas Corporation, a predecessor general partner. Mr. Ambury was employed by Petroleum Heat and Power Co., Inc. from June 1983 through February 1996, where he served in various accounting/finance capacities. From 1979 to 1983, Mr. Ambury was employed by a predecessor firm of KPMG, a public accounting firm. Mr. Ambury has been a Certified Public Accountant since 1981 and is a graduate of Marist College.
Richard G. Oakley. Mr. Oakley has been Senior Vice President of Kestrel Heat since May 1, 2014. From May 22, 2006 until April 30, 2014, Mr. Oakley was Vice President and Controller of Kestrel Heat. From September 1982 until May 2006 he held various positions with Meenan Oil Co. LP, most recently that of Controller since 1993. Mr. Oakley is a graduate of Long Island University.
Henry D. Babcock. Mr. Babcock has been a director of Kestrel Heat since April 28, 2006. Mr. Babcock is a consultant to Train, Babcock Advisors LLC, a privately owned registered investment advisor. He joined the firm in 1976, became a partner in 1980, CEO in 1999 and Chairman in 2006. Prior to this, he ran an affiliated venture capital company that was active in the U.S. and abroad. Mr. Babcock is a graduate of Yale University and received an MBA from Columbia University. He is President of The Caumsett Foundation, Inc.
Mr. Babcock’s significant experience in capital markets, corporate finance and venture capital, among other factors, led the Board to conclude that he should serve as a director of Kestrel Heat.
Scott Baxter. Mr. Baxter has been a director of Kestrel Heat since April 28, 2006. Mr. Baxter is currently Managing Director and Head of Energy for Sagent Advisors, headquartered in New York City. Mr. Baxter has over 25 years of energy investment banking experience and has been a primary advisor in sourcing and executing over $150 billion in corporate M&A, restructuring and equity financing transactions in the energy industry. Mr. Baxter also has significant experience advising independent committees of boards including rending over 30 independent fairness opinions spanning the upstream, downstream and midstream energy sectors including for many MLPs.
Prior to Sagent, Mr. Baxter had opened and ran the Houston office for Petrie Partners, and prior to that, his career has included serving as Head of the Americas for J.P. Morgan’s global energy group, Managing Director in the global energy group at Citigroup (Salomon Brothers), founding and running his own firm, Baxter Energy Partners, an upstream energy M&A advisory firm, and serving as head of the energy group for Houlihan Lokey.
47
Table of Contents
Mr. Baxter holds a B.S. degree in Economics from Weber State University where he graduated cum laude, and received an MBA degree from the University of Chicago Graduate School of Business. Mr. Baxter has also served as an adjunct professor of finance at Columbia University’s Graduate School of Business and has been on the President’s advisory board for Weber State University since 1996.
Mr. Baxter’s significant experience as an investor and a senior investment banker focused on the energy field, among other factors, led the Board to conclude that he should serve as a director of Kestrel Heat.
Daniel P. Donovan. Mr. Donovan has been a director of Kestrel Heat since April 28, 2006. Mr. Donovan was Chief Executive Officer of Kestrel Heat from May 31, 2007 to September 30, 2013 and had been President from April 28, 2006 to September 30, 2013. From April 28, 2006 to May 30, 2007 Mr. Donovan was also the Chief Operating Officer of Kestrel Heat. Mr. Donovan was the President and Chief Operating Officer of a predecessor general partner, Star Gas LLC (“Star Gas”), from March 2005 until April 28, 2006. From May 2004 to March 2005 he was President and Chief Operating Officer of the Partnership’s heating oil segment. Mr. Donovan held various management positions with Meenan Oil Co. LP, from January 1980 to May 2004, including Vice President and General Manager from 1998 to 2004. Mr. Donovan worked for Mobil Oil Corp. from 1971 to 1980. His last position with Mobil was President and General Manager of its heating oil subsidiary in New York City and Long Island. Mr. Donovan is a graduate of St. Francis College in Brooklyn, New York and received an M.B.A. from Iona College.
Mr. Donovan’s in-depth knowledge of the Partnership’s business, having been its president and chief executive officer, and his substantial experience in the home heating oil industry, among other factors, led the Board to conclude that he should serve as a director of Kestrel Heat.
Bryan H. Lawrence. Mr. Lawrence has been a director of Kestrel Heat since April 28, 2006 and a manager of Kestrel since July 2005. Mr. Lawrence is a founder and senior manager of Yorktown Partners LLC, the manager of the Yorktown group of investment partnerships, which make investments in companies engaged in the energy industry. The Yorktown partnerships were formerly affiliated with the investment firm of Dillon, Read & Co. Inc., where Mr. Lawrence was employed beginning in 1966, serving as a Managing Director until the merger of Dillon Read with SBC Warburg in September 1997. Mr. Lawrence also serves as a director of Carbon Natural Resources, Hallador Petroleum Company (each a United States publicly traded company), and certain non-public companies in the energy industry in which Yorktown partnerships hold equity interests. Mr. Lawrence is a graduate of Hamilton College and received an M.B.A. from Columbia University.
Mr. Lawrence’s significant financial and investment experience, and experience as a founder of Yorktown Energy Partners LLC, among other factors, led the Board to conclude that he should serve as a director of Kestrel Heat.
Sheldon B. Lubar. Mr. Lubar has been a director of Kestrel Heat since April 28, 2006 and a manager of Kestrel since July 2005. Mr. Lubar has been Chairman of the board of Lubar & Co. Incorporated, a private investment and venture capital firm he founded, since 1977. He was Chairman of the board of Christiana Companies, Inc., a logistics and manufacturing company, from 1987 until its merger with Weatherford International in 1995. Mr. Lubar had also been Chairman of Total Logistics, Inc., a logistics and manufacturing company until its acquisition in 2005 by SuperValu Inc. He has served as a director of Approach Resources, Inc. since June 2007 and Hallador Energy Company since 2008. He is also a director of several private companies. Mr. Lubar holds a bachelor’s degree in Business Administration and a Law degree from the University of Wisconsin-Madison. He was awarded honorary Doctor of Commercial Science degrees from the University of Wisconsin-Milwaukee, Medical College of Wisconsin, and the University of Wisconsin-Madison.
Mr. Lubar’s significant experience as a senior executive officer and as a director of other public companies, among other factors, led the Board to conclude that he should serve as a director of Kestrel Heat.
William P. Nicoletti. Mr. Nicoletti has been a director of Kestrel Heat since April 28, 2006. Mr. Nicoletti was the non-executive chairman of the board of Star Gas from March 2005 until April 28, 2006. Mr. Nicoletti was a director of Star Gas from March 1999 until April 28, 2006 and was a director of Star Gas Corporation from November 1995 until March 1999. Since February 1, 2009, he has been a Managing Director of Parkman Whaling LLC, a Houston, Texas based energy investment banking firm. Previously, he was Managing Director of Nicoletti & Company, Inc., a private investment banking firm. Mr. Nicoletti was formerly a senior officer and head of Energy Investment Banking for E. F. Hutton & Company, Inc., PaineWebber Incorporated and McDonald Investments, Inc. Mr. Nicoletti is a graduate of Seton Hall University and received an M.B.A. from Columbia University.
Mr. Nicoletti’s current and prior leadership experience in the energy investment banking industry and his significant experience in finance, accounting and corporate governance matters, among other factors, led the Board to conclude that he should serve as a director of Kestrel Heat.
48
Table of Contents
Director Independence
Section 303A of the New York Stock Exchange listed company manual provides that limited partnerships are not required to have a majority of independent directors. It is the policy of the Board of Directors that the Board shall at all times have at least three independent directors or such higher number as may be necessary to comply with the applicable federal securities law requirements. For the purposes of this policy, “independent director” has the meaning set forth in Section 10A(m) of the Securities Exchange Act of 1934, as amended, any applicable stock exchange rules and the rules and regulations promulgated in the Partnership governance guidelines available on its website www.Star-Gas.com. The Board of Directors has determined that Messrs. Nicoletti, Babcock, and Baxter are independent directors.
Meetings of Directors
During fiscal 2016, the Board of Directors of Kestrel Heat met four times. All directors attended each meeting except for one meetings in which a director did not attend.
Committees of the Board of Directors
Kestrel Heat’s Board of Directors has one standing committee, the Audit Committee. Its members are appointed by the Board of Directors for a one-year term and until their respective successors are elected. The NYSE corporate governance standards do not require limited partnerships to have a Nominating or Compensation Committee.
Audit Committee
William P. Nicoletti, Henry D. Babcock and C. Scott Baxter have been appointed to serve on the Audit Committee, which has adopted an Audit Committee Charter. Mr. Nicoletti serves as chairman of the Audit Committee. A copy of this charter is available on the Partnership’s website at www.Star-Gas.com or a copy may be obtained without charge by contacting Richard F. Ambury at (203) 328-7310. The Audit Committee reviews the external financial reporting of the Partnership, selects and engages the Partnership’s independent registered public accountants and approves all non-audit engagements of the independent registered public accountants.
Members of the Audit Committee may not be employees of Kestrel Heat’s or its affiliated companies and must otherwise meet the New York Stock Exchange and SEC independence requirements for service on the Audit Committee. The Board of Directors has determined that Messrs. Nicoletti, Babcock and Baxter are independent directors in that they do not have any material relationships with the Partnership (either directly, or as a partner, shareholder or officer of an organization that has a relationship with the Partnership) and they otherwise meet the independence requirements of the NYSE and the SEC. The Partnership’s Board of Directors has also determined that at least one member of the Audit Committee, Mr. Nicoletti, meets the SEC criteria of an “audit committee financial expert.” Please see Mr. Nicoletti’s biography under “Directors and Officers of the General Partner” for his relevant experience regarding his qualifications as an “audit committee financial expert.”
During fiscal 2016, the Audit Committee of Kestrel Heat, LLC met six times. All members attended each meeting.
Reimbursement of Expenses of the General Partner
The general partner does not receive any management fee or other compensation for its management of the Partnership. The general partner is reimbursed for all expenses incurred on behalf of the Partnership, including the cost of compensation, that are properly allocable to the Partnership. The Partnership Agreement provides that the general partner shall determine the expenses that are allocable to the Partnership in any reasonable manner determined by the general partner in its sole discretion. In addition, the general partner and its affiliates may provide services to the Partnership for which a reasonable fee would be charged as determined by the general partner. There were no reimbursements of the General Partner in fiscal year 2016.
Adoption of Code of Business Conduct and Ethics
The Partnership has adopted a written Code of Business Conduct and Ethics that applies to the Partnership’s officers and employees and the directors of its general partner. A copy of the Code of Business Conduct and Ethics is available on the Partnership’s website at www.Star-Gas.com or a copy may be obtained without charge, by contacting Investor Relations, (203) 328-7310.
The Partnership intends to post amendments to or waivers of its Code of Business Conduct and Ethics (to the extent applicable to any executive officer or director) on its website.
49
Table of Contents
Section 16(a) Beneficial Ownership Reporting Compliance
Based on copies of reports furnished to us, we believe that during fiscal year 2016, all reporting persons complied with the Section 16(a) filing requirements applicable to them.
Non-Management Directors and Interested Party Communications
The non-management directors on the Board of Directors of the general partner are Messrs. Babcock, Baxter, Donovan, Lawrence, Lubar, Nicoletti and Vermylen. The non-management directors have selected Mr. Vermylen, the Chairman of the Board, to serve as lead director to chair executive sessions of the non-management directors. Interested parties who wish to contact the non-management directors as a group may do so by contacting Paul A. Vermylen, Jr. c/o Star Gas Partners, L.P., 9 West Broad Street, Suite 310, Stamford, CT 06902.
| ITEM 11. | EXECUTIVE COMPENSATION |
Compensation Discussion and Analysis
The Partnership’s Second Amended and Restated Agreement of Limited Partnership, provides that the general partner of the Partnership, Kestrel Heat, shall conduct, direct and manage all activities of the Partnership. The limited liability company agreement of the general partner provides that the business of the general partner shall be managed by a Board of Directors. The responsibility of the Board is to supervise and direct the management of the Partnership in the interest and for the benefit of the Partnership’s unitholders. Among the Board’s responsibilities is to regularly evaluate the performance and to approve the compensation of the Chief Executive Officer and, with the advice of the Chief Executive Officer, regularly evaluate the performance and approve the compensation of key executives.
As a limited partnership that is listed on the New York Stock Exchange, the Partnership is not required to have a Compensation Committee. Since the Chairman of the general partner and the majority of the Board are not employees, the Board determined that it has adequate independence to act in the capacity of a Compensation Committee to establish and review the compensation of the Partnership’s executive officers and directors. The Board is comprised of Paul A. Vermylen Jr. (Chairman), Steven J. Goldman (President and Chief Executive Officer), Daniel P. Donovan, Henry D. Babcock, C. Scott Baxter, Bryan H. Lawrence, Sheldon B. Lubar, and William P. Nicoletti.
Throughout this Report, each person who served as chief executive officer (“CEO”) during fiscal 2016, each person who served as chief financial officer (“CFO”) during fiscal 2016 and the one other most highly compensated executive officer serving at September 30, 2016 (there being no other executive officers who earned more than $100,000 during fiscal 2016) are referred to as the “named executive officers” and are included in the Executive Compensation Table.
In this Compensation Discussion and Analysis, we address the compensation paid or awarded to Messrs. Goldman, Ambury and Oakley. We refer to these executive officers as our “named executive officers.”
Compensation decisions for the above named executive officers were made by the Board of Directors of the Partnership.
Compensation Philosophy and Policies
The primary objectives of the Partnership’s compensation program, including compensation of the named executive officers, are to attract and retain highly qualified officers, employees and directors and to reward individual contributions to our success. The Board of Directors considers the following policies in determining the compensation of the named executive officers:
| • | compensation should be related to the performance of the individual executive and the performance measured against both financial and non-financial achievements; |
| • | compensation levels should be competitive to ensure that we will be able to attract, motivate and retain highly qualified executive officers; and |
| • | compensation should be related to improving unitholder value over time. |
Compensation Methodology
The elements of the Partnership’s compensation program for named executive officers are intended to provide a total incentive package designed to drive performance and reward contributions in support of business strategies at the Partnership. Subject to the terms of employment agreements that have been entered into with the named executive officers, all compensation determinations are discretionary and subject to the decision-making authority of the Board of Directors. We do not use benchmarking as a fixed criterion
50
Table of Contents
to determine compensation. Rather, after subjectively setting compensation based on the policies discussed above under “Compensation Philosophy and Policies”, we reviewed the compensation paid to officers holding similar positions at our peer group companies and certain information for privately held companies to obtain a general understanding of the reasonableness of base salaries and other compensation payable to our named executive officers. Our peer group of public companies was comprised of the following companies: Amerigas Partners, L.P., Suburban Propane Partners, L.P., Ferrellgas Partners, L.P. and Global Partners, L.P. We chose these companies because they are master limited partnerships that are engaged in the distribution of energy products like the Partnership.
Elements of Executive Compensation
For the fiscal year ended September 30, 2016, the principal components of compensation for the named executive officers were:
| • | base salary; |
| • | annual discretionary profit sharing allocation; |
| • | management incentive compensation plan; and |
| • | retirement and health benefits. |
Under our compensation structure, the mix of base salary, discretionary profit sharing allocation and long-term compensation provided to each executive officer varies depending on their position. The base salary for each executive officer is the only fixed component of compensation. All other compensation, including annual discretionary profit sharing allocation and long-term incentive compensation, is variable in nature.
The majority of the Partnership’s compensation allocation is weighted towards base salary and annual discretionary profit sharing allocation. In addition, during fiscal 2016, an aggregate of $177,034 was paid to the named executive officers under the terms of the Partnership’s management incentive compensation plan and represented a small portion of the executive compensation that was paid to these officers. If the Partnership is successful in increasing the overall level of distributions payable to unitholders, the amounts payable to the named executive officers under the management incentive compensation plan should increase.
We believe that together all of our compensation components provide a balanced mix of fixed compensation and compensation that is contingent upon each executive officer’s individual performance and our overall performance. A goal of the compensation program is to provide executive officers with a reasonable level of security through base salary and benefits, while rewarding them through incentive compensation to achieve business objectives and create unitholder value over time. We believe that each of our compensation components is important in achieving this goal. Base salaries provide executives with a base level of monthly income and security. Annual discretionary profit sharing allocations and long-term incentive awards provide an incentive to our executives to achieve business objectives that increase our financial performance, which creates unitholder value through continuity of, and increases in, distributions and increases in the market value of the units. In addition, we want to ensure that our compensation programs are appropriately designed to encourage executive officer retention, which is accomplished through all of our compensation elements.
Base Salary
The Board of Directors establishes base salaries for the named executive officers based on a number of factors, including:
| • | The historical salaries for services rendered to the Partnership and responsibilities of the named executive officer. |
| • | The salaries of equivalent executive officers at our peer group companies and other data for our industry. |
| • | The prevailing levels of compensation and cost of living in the location in which the named executive officer works. |
In determining the initial base compensation payable to individual named executive officers when they are first hired by the Partnership, our starting point is the historical compensation levels that the Partnership has paid to officers performing similar functions over the past few years. We also consider the level of experience and accomplishments of individual candidates and general labor market conditions, including the availability of candidates to fill a particular position. When we make adjustments to the base salaries of existing named executive officers, we review the individual’s performance, the value each named executive officer brings to us and general labor market conditions.
51
Table of Contents
Elements of individual performance considered, among others, without any specific weight given to each element, include business-related accomplishments during the year, difficulty and scope of responsibilities, effective leadership, experience, expected future contributions to the Partnership and difficulty of replacement. While base salary provides a base level of compensation intended to be competitive with the external market, the base salary for each named executive officer is determined on a subjective basis after consideration of these factors and is not based on target percentiles or other formal criteria. Although we believe that base salaries for our named executive officers are generally competitive with the external market, we do not use benchmarking as a fixed criterion to determine base compensation. Rather, after subjectively setting base salaries based on the above factors, we review the compensation paid to officers holding similar positions at our peer group companies to obtain a general understanding of the reasonableness of base salaries and other compensation payable to our named executive officers. The Partnership also takes into account geographic differences for similar positions in the New York Metropolitan area. While cost of living is considered in determining annual increases, the Partnership does not typically provide full cost of living adjustments as salary increases are constrained by budgetary restrictions and the ability to fund the Partnership’s current cash needs such as interest expense, maintenance capital, income taxes and distributions.
Profit Sharing Allocations
The Partnership maintains a profit sharing pool for certain employees, including named executive officers, which is equal to approximately 6% of the Partnership’s earnings before income taxes, depreciation and amortization, excluding items affecting comparability (“adjusted EBITDA”) for the given fiscal year. The annual discretionary profit sharing allocations paid to the named executive officers are payable from this pool. The size of the pool fluctuates based upon upward or downwards changes in adjusted EBITDA and the size of an individual award to a named executive officer fluctuates based on the size of the profit sharing pool and the number of participants in the plan. Depending upon the size of the profit sharing pool, and the number of participants in the plan, the amount paid to the named officers could be more or less.
There are no set formulas for determining the amount payable to our named executive officers from the profit sharing plan. Factors considered by our CEO and the Board in determining the level of profit sharing allocations generally include, without assigning a particular weight to any factor:
| • | whether or not we achieved certain budgeted goals for the year and any material shortfalls or superior performances relative to expectations. Under the plan, no profit sharing was payable with respect to fiscal 2016 unless the Partnership achieved actual adjusted EBITDA for fiscal 2016 of at least 70% of the amount of budgeted adjusted EBITDA for fiscal 2016. |
| • | the level of difficulty associated with achieving such objectives based on the opportunities and challenges encountered during the year; and |
| • | significant transactions or accomplishments for the period not included in the goals for the year. |
Our CEO takes these factors into consideration as well as the relative contributions of each of the named executive officers to the year’s performance in developing his recommendations for profit sharing amounts. Based on such assessment, our CEO submits recommendations to the Board of Directors for the annual profit sharing amounts to be paid to our named executive officers (other than the CEO), for the Board’s review and approval. Similarly, the Chairman assesses the CEO’s contribution toward meeting the Partnership’s goals based upon the above factors, and recommends to the Board of Directors a profit sharing allocation for the CEO it believes to be commensurate with such contribution.
The Board of Directors retains the ultimate discretion to determine whether the named executive officers will receive annual profit sharing allocations based upon the factors discussed above.
Management Incentive Compensation Plan
In fiscal 2007, following the Partnership’s recapitalization, the Board of Directors adopted the Management Incentive Compensation Plan (the “Plan”) for employees of the Partnership. Under the Plan, certain named employees who participate shall be entitled to receive a pro rata share (as determined in the manner described below) of an amount in cash equal to:
| • | 50% of the distributions (“Incentive Distributions”) of Available Cash in excess of the minimum quarterly distribution of $0.0675 per unit otherwise distributable to Kestrel Heat pursuant to the Partnership Agreement on account of its general partner units; and |
| • | 50% of the cash proceeds (the “Gains Interest”) which Kestrel Heat shall receive from any sale of its general partner units (as defined in the Partnership Agreement), less expenses and applicable taxes. |
52
Table of Contents
The Partnership believes that the Plan provides a long-term incentive to its participants because it encourages the Partnership’s management to increase the Partnership’s available cash for distributions in order to trigger the incentive distributions that are only payable if distributions from available cash exceeds certain target distribution levels, with higher amounts of incentive distributions triggered by higher levels of distributions. Such increases are not sustainable on a consistent basis without long-term improvements in the Partnership’s operations. In addition, under certain Plan amendments that were adopted in 2012, the participation points of existing plan participants will vest and become irrevocable over a four year period, provided that the participants continue to be employed by the Partnership during the vesting period. The Partnership believes that this will help ensure that the Plan participants, which include our named executive officers, will have a continuing personal interest in the success of the Partnership.
The pro rata share payable to each participant under the Plan is based on the number of participation points as described under “Fiscal 2016 Compensation Decisions—Management Incentive Compensation Plan.” The amount paid in Incentive Distributions is governed by the partnership agreement and the calculation of Available Cash (as defined in our partnership agreement) is distributed to the holders of the Partnership’s common units and general partner units in the following manner:
First, 100% to all common units, pro rata, until there has been distributed to each common unit an amount equal to the minimum quarterly distribution of $0.0675 for that quarter;
Second, 100% to all common units, pro rata, until there has been distributed to each common unit an amount equal to any arrearages in the payment of the minimum quarterly distribution for prior quarters;
Third, 100% to all general partner units, pro rata, until there has been distributed to each general partner unit an amount equal to the minimum quarterly distribution;
Fourth, 90% to all common units, pro rata, and 10% to all general partner units, pro rata, until each common unit has received the first target distribution of $0.1125; and
Finally, 80% to all common units, pro rata, and 20% to all general partner units, pro rata.
Available Cash, as defined in our partnership agreement, generally means all cash on hand at the end of the relevant fiscal quarter less the amount of cash reserves established by the Board of Directors of our general partner in its reasonable discretion for future cash requirements. These reserves are established for the proper conduct of our business, including acquisitions, the payment of debt principal and interest and for distributions during the next four quarters and to comply with applicable law and the terms of any debt agreements or other agreements to which we are subject. The Board of Directors of our general partner reviews the level of Available Cash each quarter based upon information provided by management.
To fund the benefits under the Plan, Kestrel Heat has agreed to permanently and irrevocably forego receipt of the amount of Incentive Distributions that are payable to plan participants. For accounting purposes, amounts payable to management under this Plan will be treated as compensation and will reduce both EBITDA and net income but not adjusted EBITDA. Kestrel Heat has also agreed to contribute to the Partnership, as a contribution to capital, an amount equal to the Gains Interest payable to participants in the Plan by the Partnership. The Partnership is not required to reimburse Kestrel Heat for amounts payable pursuant to the Plan.
The Plan is administered by the Partnership’s Chief Financial Officer under the direction of the Board or by such other officer as the Board may from time to time direct. In general, no payments will be made under the Plan if the Partnership is not distributing cash under the Incentive Distributions described above.
Effective as of July 19, 2012, the Board of Directors adopted certain amendments (the “Plan Amendments”) to the Plan. Under the Plan Amendments, the number and identity of the Plan participants and their participation interests in the Plan have been frozen at the current levels. In addition, under the Plan Amendments, the plan benefits (to the extent vested) may be transferred upon the death of a participant to his or her heirs. A participant’s vested percentage of his or her plan benefits will be 100% during the time a participant is an employee or consultant of the Partnership. Following the termination of such positions, a participant’s vested percentage shall be equal to 20% for each full or partial year of employment or consultation with the Partnership starting with the fiscal year ended September 30, 2012 (33 1/3% in the case of the Partnership’s chief executive officer at that time).
The Partnership distributed approximately $397,422 in Incentive Distributions under the Plan during fiscal 2016, including payments to the named executive officers of approximately $177,034. With regard to the Gains Interest, Kestrel Heat has not given any indication that it will sell its general partner units within the next twelve months. Thus the Plan’s value attributable to the Gains Interest currently cannot be determined.
53
Table of Contents
Retirement and Health Benefits
The Partnership offers a health and welfare and retirement program to all eligible employees. The named executive officers are generally eligible for the same programs on the same basis as other employees of the Partnership. The Partnership maintains a tax-qualified 401(k) retirement plan that provides eligible employees with an opportunity to save for retirement on a tax advantaged basis. Under the Partnership’s 401(k) plan, subject to IRS limitations, each participant can contribute from 0% to 60% of compensation.
The Partnership makes a 4% (or a maximum of 5.5% for participants who had 10 or more years of service at the time the Partnership’s defined benefit plans were frozen and who have reached the age 55) core contribution of a participant’s compensation and generally can match 2/3 (up to 3.0%) of a participant’s contributions, subject to IRS limitations.
In addition, the Partnership has two frozen defined benefit pension plans that were maintained for all its eligible employees, including certain executive officers. The present value of accumulated benefits under these frozen defined benefit pension plans for certain executive officers is provided in the table labeled, pension plans pursuant to which named executive officers have an accumulated benefit but are not currently accruing benefits.
Fiscal 2016 Compensation Decisions
For fiscal 2016, the foregoing elements of compensation were applied as follows:
Base Salary
The following table sets forth each named executive officer’s base salary as of October 1, 2016 and the percentage increase in base salary over October 1, 2015. The current base salaries for our named executive officers were determined based upon the factors discussed under the caption “Base Salary.” The average percentage increase in base salary for executives in our peer group was approximately 8.3%.
| Name |
Salary | Percentage Change From Prior Year |
||||||
| Steven J. Goldman |
$ | 450,000 | 7.1 | % | ||||
| Richard F. Ambury |
$ | 376,548 | 4.0 | % | ||||
| Richard G. Oakley |
$ | 250,000 | 2.0 | % | ||||
Annual Discretionary Profit Sharing Allocation
Based on the annual performance reviews for the Partnership’s CEO and named executive officers, the Board approved annual profit sharing allocations as reflected in the “Summary Compensation Table” and notes thereto. For fiscal 2016 the profit sharing amounts reflected in the Summary Compensation Table are 43%, 43%, and 47% lower than fiscal 2015 for Messrs. Goldman, Ambury, and Oakley, respectively. One of the Partnership’s primary performance measures for profit sharing purpose is adjusted EBITDA. This adjusted EBITDA decreased by $60.9 million, or 41.8%, to $84.7 million for fiscal 2016. The Partnership’s decrease in adjusted EBITDA was primarily due to the impacts of warmer weather and an increase in net customer attrition to 5.1% for fiscal 2016 compared to 1.8% for fiscal 2015. The Partnership’s use of weather hedge contracts and margin management reduced the impact of the warmer temperatures. For the Partnership’s peer group, the average percentage decrease in adjusted EBITDA was 24.0%. In fiscal 2016, the Partnership completed four acquisitions with a total purchase price of $9.8 million and added approximately 3,300 customers. The Partnership has also continued to focus on its initiatives to increase revenues other than through the sale of home heating oil and organically expanded its presence in the distribution of propane and its other service offerings during fiscal 2016.
Management Incentive Compensation Plan
In 2012 under the Plan Amendments adopted by the Board, the number and identity of the Plan participants and their participation points were frozen at the current levels in order to more closely align the interests of Plan participants and unitholders and to give Plan participants a continuing personal interest in the success of the Partnership. The number of participation points that were previously awarded to the named executive officers was based on the length of service and level of responsibility of the named executive and the Partnership’s desire to retain the named executive, in order to promote the long-term best interest of the Partnership.
54
Table of Contents
In fiscal 2016, $177,034 was paid to the named executive officers under the Plan as indicated in the following chart:
| Name |
Points | Percentage | Management Incentive Payments |
|||||||||
| Steven J. Goldman |
215 | 19.5 | % | $ | 77,678 | |||||||
| Richard F. Ambury |
235 | 21.4 | % | 84,904 | ||||||||
| Richard G. Oakley |
40 | 3.6 | % | 14,452 | ||||||||
| Other Plan Participants (a) |
610 | 55.5 | % | 220,388 | ||||||||
|
|
|
|
|
|
|
|||||||
| Total |
1,100 | 100.0 | % | $ | 397,422 | |||||||
|
|
|
|
|
|
|
|||||||
| (a) | Includes 300 points (27.3%) that were awarded to Mr. Donovan prior to his retirement as the Partnership’s President and Chief Executive Officer effective September 30, 2013. |
Retirement and Health Benefits
The named executive officers participate in the Partnership’s retirement and health benefit plans.
Employment Contracts and Severance Agreements
Agreement with Steven J. Goldman
Effective October 1, 2013, Steven J. Goldman was appointed the President and Chief Executive Officer of the Partnership. Mr. Goldman entered into a three year employment agreement with the Partnership, effective as of October 1, 2013. In December 2016 the Partnership entered into an employment agreement with Mr. Goldman effective as of October 1, 2016 where Mr. Goldman will continue to serve as President and Chief Executive Officer of the Partnership and its subsidiaries on an at-will basis. Under his employment agreement, if Mr. Goldman is terminated for reasons other than cause or if he terminates his employment for good reason, Mr. Goldman will be entitled to one year’s salary as severance.
Agreement with Richard F. Ambury
The Partnership entered into an employment agreement with Mr. Ambury effective as of April 28, 2008. Mr. Ambury will serve as Chief Financial Officer and Treasurer of the Partnership and its subsidiaries on an at-will basis. The employment agreement provides for one year’s salary as severance if Mr. Ambury’s employment is terminated without cause or by Mr. Ambury for good reason.
Agreement with Richard G. Oakley
Effective November 2, 2009, the Partnership entered into an agreement with Mr. Richard G. Oakley pursuant to which Mr. Oakley will continue to be employed as Senior Vice President on an at-will basis, and provides for one year’s salary as severance if his employment is terminated for reasons other than cause.
Change In Control Agreements
We have entered into a Change In Control Agreement with Mr. Goldman, Chief Executive Officer and Mr. Ambury, Chief Financial Officer. Under the terms of each agreement, if either of these executive officers is terminated as a result of a change in control (as defined in the agreement) he will be entitled to a payment equal to two times his base annual salary in the year of such termination plus two times the average amount paid as a bonus and/or as profit sharing during the three years preceding the year of such termination. The term change in control means the present equity owners of Kestrel and their affiliates collectively cease to beneficially own equity interests having the voting power to elect at least a majority of the members of the board of directors or other governing board of the general partner of the Partnership or any successor entity to the Partnership. If a change in control were to have occurred and their employment was terminated as of the date of this report, Mr. Goldman would have received a payment of $2,458,633 and Mr. Ambury would have received a payment of $1,992,729.
Indemnification Agreements
We have entered into an indemnification agreement with each of our directors and senior executives. These agreements provide for us to, among other things, indemnify such persons against certain liabilities that may arise by reason of their status or service as directors or officers, to advance their expenses incurred as a result of a proceeding as to which they may be indemnified and to cover such person under any directors’ and officers’ liability insurance policy we choose, in our discretion, to maintain. These indemnification agreements are intended to provide indemnification rights to the fullest extent permitted under applicable
55
Table of Contents
indemnification rights statutes in the State of Delaware and are in addition to any other rights such person may have under our partnership agreement and the operating agreement of our general partner, and applicable law. We believe these indemnification agreements enhance our ability to attract and retain knowledgeable and experienced executives and independent, non-management directors.
Board of Directors Report
The Board of Directors of the general partner of the Partnership does not have a separate compensation committee. Executive compensation is determined by the Board of Directors.
The Board of Directors reviewed and discussed with the Partnership’s management the Compensation Discussion and Analysis contained in this annual report on Form 10-K. Based on that review and discussion, the Board of Directors recommends that the Compensation Discussion and Analysis be included in the Partnership’s annual report on Form 10-K for the year ended September 30, 2016.
Paul A. Vermylen, Jr.
Steven J. Goldman
Henry D. Babcock
C. Scott Baxter
Daniel P. Donovan
Bryan H. Lawrence
Sheldon B. Lubar
William P. Nicoletti
Executive Compensation Table
The following table sets forth the annual salary compensation, bonus and all other compensation awards earned and accrued by the named executive officers in the fiscal year.
| Summary Compensation Table | ||||||||||||||||||||||||||||||||||||
| Change in | ||||||||||||||||||||||||||||||||||||
| Pension | ||||||||||||||||||||||||||||||||||||
| Non- | Value and | |||||||||||||||||||||||||||||||||||
| Equity | Nonqualified | |||||||||||||||||||||||||||||||||||
| Incentive | Deferred | |||||||||||||||||||||||||||||||||||
| Name and | Fiscal | Unit | Option | Plan | Comp. | All Other | ||||||||||||||||||||||||||||||
| Principal Position |
Year | Salary | Bonus | Awards | Awards | Comp.(1) | Earnings (2) | Comp.(3) | Total | |||||||||||||||||||||||||||
| Steven J. Goldman |
2016 | $ | 420,000 | — | — | — | $ | 547,000 | $ | — | $ | 120,173 | $ | 1,087,173 | ||||||||||||||||||||||
| President and |
2015 | $ | 390,000 | — | — | — | $ | 957,950 | $ | — | $ | 102,563 | $ | 1,450,513 | ||||||||||||||||||||||
| Chief Executive Officer |
2014 | $ | 360,000 | — | — | — | $ | 833,000 | $ | — | $ | 80,933 | $ | 1,273,933 | ||||||||||||||||||||||
| Richard F. Ambury |
2016 | $ | 368,100 | — | — | — | $ | 434,000 | $ | 40,838 | $ | 129,326 | $ | 972,264 | ||||||||||||||||||||||
| Chief Financial Officer, |
2015 | $ | 353,947 | — | — | — | $ | 762,450 | $ | 6,942 | $ | 110,522 | $ | 1,233,861 | ||||||||||||||||||||||
| Executive Vice President, |
2014 | $ | 342,345 | — | — | — | $ | 663,000 | $ | 48,781 | $ | 86,559 | $ | 1,140,685 | ||||||||||||||||||||||
| Treasurer and Secretary |
||||||||||||||||||||||||||||||||||||
| Richard G. Oakley |
2016 | $ | 247,083 | — | — | — | $ | 145,750 | $ | 62,632 | $ | 58,491 | $ | 513,956 | ||||||||||||||||||||||
| Senior Vice President - |
2015 | $ | 242,083 | — | — | — | $ | 275,000 | $ | 9,236 | $ | 53,975 | $ | 580,294 | ||||||||||||||||||||||
| Accounting |
2014 | $ | 230,958 | — | — | — | $ | 250,000 | $ | 68,728 | $ | 41,719 | $ | 591,405 | ||||||||||||||||||||||
| (1) | Payable pursuant to the Partnership’s profit sharing pool, which is described under “Compensation Discussion and Analysis – Profit Sharing Allocation.” |
| (2) | The Partnership has two frozen defined benefit pension plans that we sometimes refer in this Report as the Petro defined benefit pension plan and the Meenan defined benefit pension plan, where participants are not accruing additional benefits. Mr. Ambury also participated in a tax-qualified supplemental employee retirement plan which prior to being frozen in 1997, represented contributions to an employee plan to compensate for a reduction in certain benefits prior to 1997. Included in Mr. Ambury’s amounts for the Change in Pension Value and Nonqualified Deferred Comp. Earnings are $6,560, $1,115, and $7,836 for fiscal years 2016, 2015, and 2014 respectively, for the actuarial changes in the value of his frozen supplemental employee retirement plan. The change in all the named executive’s pension values (including the supplemental employee retirement plan) are non-cash, and reflect normal adjustments resulting from changes in discount rates and government mandated mortality tables. |
56
Table of Contents
| (3) | All other compensation is subdivided as follows: |
| Name |
Management Incentive Compensation Plan |
Company Match and Core Contribution to 401(K) Plan |
Car Allowance or Monetary Value for Personal Use of Company Owned Vehicle |
Total | ||||||||||||
| Steven J. Goldman |
$ | 77,678 | $ | 16,472 | $ | 26,023 | $ | 120,173 | ||||||||
| Richard F. Ambury |
$ | 84,904 | $ | 20,422 | $ | 24,000 | $ | 129,326 | ||||||||
| Richard G. Oakley |
$ | 14,452 | $ | 20,039 | $ | 24,000 | $ | 58,491 | ||||||||
| Grants of Plan-Based Awards | ||||||||||||||||||||||||||||||||||||||||||||
| All Other Stocks Awards: Number of Shares of Stock or Units (#) |
All Other Option Awards: Number of Securities Underlying Options (#) |
Exercise or ($/Sh) |
Grant Date Fair Value of Stock and Option Awards |
|||||||||||||||||||||||||||||||||||||||||
| Estimated Future Payouts | Estimated Future Payouts | |||||||||||||||||||||||||||||||||||||||||||
| Equity Incentive Plan Awards (1) |
Under Equity Incentive Plan |
|||||||||||||||||||||||||||||||||||||||||||
| Name | Grant Date (1) |
Threshold ($) |
Target ($) (2) |
Maximum ($) |
Threshold (#) |
Target (#) |
Maximum (#) |
|||||||||||||||||||||||||||||||||||||
| Steven J. Goldman |
7/21/09 | — | 547,000 | — | — | — | — | — | — | — | — | |||||||||||||||||||||||||||||||||
| Richard F. Ambury |
7/21/09 | — | 434,000 | — | — | — | — | — | — | — | — | |||||||||||||||||||||||||||||||||
| Richard G. Oakley |
7/21/09 | — | 145,750 | — | — | — | — | — | — | — | — | |||||||||||||||||||||||||||||||||
| (1) | On July 21, 2009, the Board of Directors authorized the continuance of the Partnership’s annual profit sharing plan, subject to its power to terminate the plan at any time. Profit sharing allocations are described under “Compensation Philosophy and Policies—Profit Sharing Allocations.” |
| (2) | The Partnership’s annual profit sharing plan does not provide for thresholds or maximums; the amounts listed represent the actual awards to the named executive officers for fiscal 2016. |
Outstanding Equity Awards at Fiscal Year-End
None.
Option Exercises and Stock Vested
None.
Pension Plans Pursuant to Which Named Executive Officers Have an Accumulated Benefit But Are Not Currently Accruing Benefits
| Name |
Plan Name | Number of Years Credited Service |
Present Value of Accumulated Benefit |
Payments During Last Fiscal Year | ||||
| Richard F. Ambury (1) | Retirement Plan | 14 | $ 268,488 | $ — | ||||
| Supplemental Employee | ||||||||
| Retirement Plan | — | $ 51,383 | $ — | |||||
| Richard G. Oakley (1) | Retirement Plan | 20 | $ 428,068 | $ — |
| 1) | The named executive officers have accumulated benefits in the tax-qualified Petro defined benefit pension plan that was frozen in 1997 or in the tax-qualified Meenan defined benefit pension plan that was frozen in 2002, subsequent to its combination with Petro. Mr. Ambury also participated in a tax-qualified supplemental employee retirement plan which, prior to being frozen in 1997, represented contributions to an employee plan to compensate for a reduction in certain benefits prior to 1997. Mr. Goldman was not a participant in any of these plans. Each year, the named executive officer’s accumulated benefits are actuarially calculated generally based on the credited years of service and each employee’s compensation at the time the plan was frozen. The present value of these amounts are the present value of a single life annuity generally payable at later or normal retirement age, adjusted for changes in discount rates and government mandated mortality tables. See Note 12. Employee Benefit Plans, to the Partnership’s Consolidated Financial Statements, for the material assumptions applied in quantifying the present value of the accumulated benefits of these frozen plans. |
57
Table of Contents
Nonqualified Defined Contribution and Other Nonqualified Deferred Compensation Plans
None.
Potential Payments upon Termination
If Mr. Goldman’s employment is terminated by the Partnership for reasons other than for cause or if Mr. Goldman terminates his employment for good reason, he will be entitled to receive one-year’s salary as severance except in the case of a termination following a change in control which is discussed above under “Change in Control Agreements.” For 12 months following the termination of his employment, Mr. Goldman is prohibited from competing with the Partnership or from becoming involved either as an employee, as a consultant or in any other capacity, in the sale of heating oil or propane on a retail basis.
If Mr. Ambury’s employment is terminated for reasons other than cause or if Mr. Ambury terminates his employment for a good reason, he will be entitled to receive a severance payment of one year’s salary except in the case of a termination following a change in control which is discussed above under “Change in Control Agreements.” For 12 months following the termination of his employment, Mr. Ambury is prohibited from competing with the Partnership or from becoming involved either as an employee, as a consultant or in any other capacity, in the sale of heating oil or propane on a retail basis.
If Mr. Oakley’s employment is terminated by the Partnership without cause, he will be entitled to receive one-year’s salary as severance. For 12 months following the termination of his employment, Mr. Oakley is prohibited from competing with the Partnership or from becoming involved either as an employee, as a consultant or in any other capacity, in the sale of heating oil or propane on a retail basis.
The amounts shown in the table below assume that the triggering event for each named executive officer’s termination or change in control payment was effective as of the date of this report based upon their historical compensation arrangements as of such date. The actual amounts to be paid out can only be determined at the time of such named executive officer’s termination of employment or the Partnership’s change of control.
The employment agreements of the foregoing officers also require that they not reveal confidential information of the Partnership within twelve months following the termination of their employment.
| Name |
Potential Payments Upon Termination |
Potential Payments Following a Change of Control |
||||||
| Steven J. Goldman |
$ | 450,000 | $ | 2,458,633 | ||||
| Richard F. Ambury |
$ | 376,548 | $ | 1,992,729 | ||||
| Richard G. Oakley |
$ | 250,000 | $ | — | ||||
58
Table of Contents
Compensation of Directors
| Director Compensation Table | ||||||||||||||||||||||||||||
| Name |
Fees Earned or Paid in Cash |
Unit Awards |
Option Awards |
Non-Equity Incentive Plan Compensation |
Change in Pension Value and Nonqualified Deferred Compensation Earnings (2) |
All Other Compensation (3) |
Total | |||||||||||||||||||||
| Paul A. Vermylen, Jr. (1) |
$ | 127,500 | — | — | — | $ | 51,933 | $ | 69,527 | $ | 248,960 | |||||||||||||||||
| Daniel P. Donovan (4) |
$ | — | — | — | — | $ | 56,416 | $ | 421,499 | $ | 477,915 | |||||||||||||||||
| Henry D. Babcock (5) |
$ | 81,500 | — | — | — | $ | — | $ | — | $ | 81,500 | |||||||||||||||||
| C. Scott Baxter (5) |
$ | 81,500 | — | — | — | $ | — | $ | — | $ | 81,500 | |||||||||||||||||
| Bryan H. Lawrence (6) |
$ | — | — | — | — | $ | — | $ | — | $ | — | |||||||||||||||||
| Sheldon B. Lubar |
$ | 59,917 | — | — | — | $ | — | $ | — | $ | 59,917 | |||||||||||||||||
| William P. Nicoletti (7) |
$ | 92,583 | — | — | — | $ | — | $ | — | $ | 92,958 | |||||||||||||||||
| (1) | Mr. Vermylen is non-executive Chairman of the Board. |
| (2) | Mr. Vermylen and Mr. Donovan participate in one of the Partnership’s frozen defined benefit pension plans. Participants are currently not accruing additional benefits under the frozen plan. The change in the pension value reflects normal non-cash adjustments resulting from changes in discount rates and government mandated mortality tables. |
| (3) | Mr. Vermylen and Mr. Donovan reached the Partnership’s frozen defined benefit pension plan full retirement age in fiscal year 2012 and 2011, respectively, and started receiving pension payments. |
| (4) | Mr. Donovan was a management director until September 30, 2013. Mr. Donovan retired as the President and Chief Executive Officer of the Partnership and its subsidiaries, effective as of September 30, 2013. Mr. Donovan will continue as a director of our general partner but will not receive fees for board or committee service. In addition, in accordance to the first amendment to the letter agreement effective as of September 30, 2015, Mr. Donovan will serve as a consultant to us for an additional two year period for which he will receive consulting fees of $250,000 per annum. The amount included for Mr. Donovan in all other compensation represents $250,000 for consulting fees, $108,388 for amounts paid to him under the management incentive compensation plan, and $63,111 for pension payments. |
| (5) | Mr. Babcock and Mr. Baxter are Audit Committee members. |
| (6) | Mr. Lawrence has chosen not to receive any fees as a director of the general partner of the Partnership. |
| (7) | Mr. Nicoletti is Chairman of the Audit Committee. |
Each non-management director receives an annual fee of $56,000 plus $1,500 for each regular and telephonic meeting attended. The Chairman of the Audit Committee receives an annual fee of $22,400 while other Audit Committee members receive an annual fee of $11,200. Each member of the Audit Committee receives $1,500 for every regular and telephonic meeting attended. The non-executive chairman of the Board receives an annual fee of $120,000.
59
Table of Contents
| ITEM 12. | SECURITY OWNERSHIP OF CERTAIN BENEFICIAL OWNERS AND MANAGEMENT |
The following table shows the beneficial ownership as of November 30, 2016 of common units and general partner units by:
(1) Kestrel and certain beneficial owners;
(2) each of the named executive officers and directors of Kestrel Heat;
(3) all directors and executive officers of Kestrel Heat as a group; and
(4) each person the Partnership knows to hold 5% or more of the Partnership’s units.
Except as indicated, the address of each person is c/o Star Gas Partners, L.P. at 9 West Broad, Street, Suite 310, Stamford, Connecticut 06902.
| Common Units | General Partner Units | |||||||||||||||
| Name |
Number | Percentage | Number | Percentage | ||||||||||||
| Kestrel (a) |
13,261,350 | 23.73 | % | 325,729 | 100.00 | % | ||||||||||
| Paul A. Vermylen, Jr. |
200,000 | * | ||||||||||||||
| Sheldon B. Lubar |
200,000 | * | ||||||||||||||
| Henry D. Babcock |
106,121 | * | ||||||||||||||
| William P. Nicoletti |
35,506 | * | ||||||||||||||
| Bryan H. Lawrence |
— | — | ||||||||||||||
| C. Scott Baxter |
— | — | ||||||||||||||
| Daniel P. Donovan |
25,000 | * | ||||||||||||||
| Richard F. Ambury |
23,890 | * | ||||||||||||||
| Steven J. Goldman |
24,900 | * | ||||||||||||||
| Richard G. Oakley |
— | — | ||||||||||||||
| All officers and directors and Kestrel Heat, LLC as a group (11 persons) |
13,876,767 | 24.83 | % | 325,729 | 100.00 | % | ||||||||||
| Bandera Partners LLC (b) |
3,560,068 | 6.37 | % | |||||||||||||
| (a) | Includes (i) 500,000 common units and 325,729 general partner units owned by Kestrel Heat, and (ii) 12,761,350 common units owned by KM2, LLC, a Delaware limited liability company (“KM2”) as to which Kestrel, in its capacity as sole member of Kestrel Heat and KM2, may be deemed to share beneficial ownership. |
| (b) | According to a Form 13F filed by Bandera Partners LLC with the SEC on November 13, 2015. |
| * | Amount represents less than 1%. |
| ITEM 13. | CERTAIN RELATIONSHIPS AND RELATED TRANSACTIONS |
The Partnership has a written conflict of interest policy and procedure that requires all officers, directors and employees to report to senior corporate management or the board of directors, all personal, financial or family interest in transactions that involve the individual and the Partnership. In addition, the Partnership Governance Guidelines provide that any monetary arrangement between a director and his or her affiliates (including any member of a director’s immediate family) and the Partnership or any of its affiliates for goods or services shall be subject to approval by the full Board of Directors.
The general partner does not receive any management fee or other compensation for its management of the Partnership. The general partner is reimbursed for all expenses incurred on behalf of the Partnership, including the cost of compensation, that are properly allocable to the Partnership. The Partnership’s Partnership Agreement provides that the general partner shall determine the expenses that are allocable to the Partnership in any reasonable manner determined by the general partner in its sole discretion. In addition, the general partner and its affiliates may provide services to the Partnership for which a reasonable fee would be charged as determined by the general partner.
60
Table of Contents
Kestrel has the ability to elect the Board of Directors of Kestrel Heat, including Messrs. Vermylen, Lawrence and Lubar. Messrs. Vermylen, Lawrence and Lubar are also members of the board of managers of Kestrel and, either directly or through affiliated entities, own equity interests in Kestrel. Kestrel owns all of the issued and outstanding membership interests of Kestrel Heat and KM2.
Policies Regarding Transactions with Related Persons
Our Code of Business Conduct and Ethics, Partnership Governance Guidelines and Partnership Agreement set forth policies and procedures with respect to transactions with persons affiliated with the Partnership and the resolution of conflicts of interest, which taken together provide the Partnership with a framework for the review and approval of “transactions” with “related persons” as such terms are defined in Item 404 of Regulation S-K.
For the years ended September 30, 2016, 2015, and 2014, the Partnership had no related party transactions or agreements pursuant to Item 404 of Regulation S-K.
Our Code of Business Conduct and Ethics applies to our directors, officers, employees and their affiliates. It deals with conflicts of interest (e.g., transactions with the Partnership), confidential information, use of Partnership assets, business dealings, and other similar topics. The Code requires officers, directors and employees to avoid even the appearance of a conflict of interest and to report potential conflicts of interest to the Partnership’s Controller or Manager of Internal Audit.
Our Partnership Governance Guidelines provide that any monetary arrangement between a director and his or her affiliates (including any member of a director’s immediate family) and the Partnership or any of its affiliates for goods or services shall be subject to approval by the full Board of Directors. Although the Partnership Governance Guidelines by their terms only apply to directors the Board intends to apply this requirement to officers and employees and their affiliates.
To the extent that the Board determines that it would be in the best interests of the Partnership to enter into a transaction with a related person, the Board intends to utilize the procedures set forth in the Partnership Agreement for the review and approval of potential conflicts of interest. Our Partnership Agreement provides that whenever a potential conflict of interest exists or arises between the general partner or any of its Affiliates (including its directors, executive officers and controlling members), on the one hand, and the Partnership or any partner, on the other hand, any resolution or course of action in respect of such conflict of interest shall be permitted and deemed approved by all partners, and shall not constitute a breach of the Partnership Agreement, of any agreement contemplated therein, or of any duty stated or implied by law or equity, if the resolution or course of action is, or by operation of the Partnership Agreement is deemed to be, fair and reasonable to the Partnership.
Any conflict of interest and any resolution of such conflict of interest shall be conclusively deemed fair and reasonable to the Partnership if such conflict of interest or resolution is (i) approved by a committee of independent directors (the “Conflicts Committee”), (ii) on terms no less favorable to the Partnership than those generally being provided to or available from unrelated third parties or (iii) fair to the Partnership, taking into account the totality of the relationships between the parties involved (including other transactions that may be particularly favorable or advantageous to the Partnership).
The general partner (including the Conflicts Committee) is authorized in connection with its determination of what is “fair and reasonable” to the Partnership and in connection with its resolution of any conflict of interest to consider:
| (A) | the relative interests of any party to such conflict, agreement, transaction or situation and the benefits and burdens relating to such interest; |
| (B) | any customary or accepted industry practices and any customary or historical dealings with a particular person; |
| (C) | any applicable generally accepted accounting practices or principles; and |
| (D) | such additional factors as the general partner (including the Conflicts Committee) determines in its sole discretion to be relevant, reasonable or appropriate under the circumstances. |
61
Table of Contents
| ITEM 14. | PRINCIPAL ACCOUNTING FEES AND SERVICES |
The following table represents the aggregate fees for professional audit services rendered by KPMG LLP including fees for the audit of the Partnership’s annual financial statements for the fiscal years 2016 and 2015, and for fees billed and accrued for other services rendered by KPMG LLP (in thousands).
| 2016 | 2015 | |||||||
| Audit Fees(1) |
$ | 1,900 | $ | 2,150 | ||||
| Tax Fees(2) |
339 | 385 | ||||||
|
|
|
|
|
|||||
| Total Fees |
$ | 2,239 | $ | 2,535 | ||||
|
|
|
|
|
|||||
| (1) | Audit fees were for professional services rendered in connection with audits and quarterly reviews of the consolidated financial statements of the Partnership. |
| (2) | Tax fees related to services for tax consultation and tax compliance. |
Audit Committee: Pre-Approval Policies and Procedures. At its regularly scheduled and special meetings, the Audit Committee of the Board of Directors considers and pre-approves any audit and non-audit services to be performed by the Partnership’s independent accountants. The Audit Committee has delegated to its chairman, an independent member of the Partnership’s Board of Directors, the authority to grant pre-approvals of non-audit services provided that the service(s) shall be reported to the Audit Committee at its next regularly scheduled meeting. On June 18, 2003, the Audit Committee adopted its pre-approval policies and procedures. Since that date, there have been no audit or non-audit services rendered by the Partnership’s principal accountants that were not pre-approved.
| ITEM 15. | EXHIBITS AND FINANCIAL STATEMENT SCHEDULES |
1. Financial Statements—See “Index to Consolidated Financial Statements and Financial Statement Schedule” set forth on page F-1.
2. Financial Statement Schedule—See “Index to Consolidated Financial Statements and Financial Statement Schedule” set forth on page F-1.
3. Exhibits—See “Index to Exhibits” set forth on the following page.
62
Table of Contents
INDEX TO EXHIBITS
| Exhibit Number |
Incorp by Ref. to Exh. |
Description | ||
| 3.1 | 3.1(1) | Amended and Restated Certificate of Limited Partnership | ||
| 4.1 | 99.1(2) | Second Amended and Restated Agreement of Limited Partnership | ||
| 4.2 | 99.3(3) | Amendment No. 1 to Second Amended and Restated Agreement of Limited Partnership | ||
| 4.3 | 4.3(11) | Amendment No. 2 to Second Amended and Restated Agreement of Limited Partnership | ||
| 4.4 | (12) | Amendment No. 3 to Second Amended and Restated Agreement of Limited Partnership | ||
| 10.1 | 99.2(5) | Letter Agreement and general release dated March 7, 2005 between Star Gas Partners L.P. and Irik P. Sevin† | ||
| 10.2 | 99.2(3) | Management Incentive Compensation Plan† | ||
| 10.3 | (12) | Amended and Restated Management Incentive Compensation Plan† | ||
| 10.4 | 99.4(3) | Form of Indemnification Agreement for Officers and Directors. | ||
| 10.5 | (4) | Approved Dealer / Contractor Agreement dated as of July 11, 2006 by and between AFC First Financial Corporation and Petro Holdings, Inc. | ||
| 10.6 | 99.4(6) | Form of Amendment No. 1 to Indemnification Agreement. | ||
| 10.7 | (15) | Description of 2014 Profit Sharing Plan.† | ||
| 10.8 | (7) | Change in Control Agreement dated December 4, 2007 between Star Gas Partners, L.P. and Daniel P. Donovan.† | ||
| 10.9 | (7) | Change in Control Agreement dated December 4, 2007 between Star Gas Partners, L.P. and Richard F. Ambury.† | ||
| 10.10 | (8) | Employment Agreement dated April 28, 2008 between Star Gas Partners, L.P. and Richard Ambury† | ||
| 10.11 | (9) | Agreement dated November 2, 2009 between Star Gas Partners, L.P. and Richard G. Oakley.† | ||
| 10.12 | (10) | Champion Equity Purchase Agreement dated as of May 10, 2010. | ||
| 10.13 | (13) | Letter Agreement, dated as of July 22, 2013, between the Partnership and Dan Donovan. | ||
| 10.14 | (13) | Letter Agreement, dated as of July 22, 2013, between the Partnership and Steven Goldman regarding employment.† | ||
| 10.15 | (13) | Letter Agreement, dated as of July 22, 2013, between the Partnership and Steven Goldman regarding Change of Control.† | ||
| 10.16 | (14) | Stock Purchase Agreement between Central Hudson Enterprises Corporation and Petro Holdings, Inc. dated as of January 27, 2014. | ||
| 10.17 | (17) | Third Amended and Restated Credit Agreement dated July 30, 2015. | ||
| 10.18 | (17) | Third Amended and Restated Pledge and Security Agreement dated July 30, 2015. | ||
| 10.19 | (18) | First Amendment to Letter Agreement, dated as of September 30, 2015, between the Partnership and Dan Donovan. | ||
| 10.20 | * | Unit Purchase Agreement, dated as of August 4, 2016, between the Partnership and Bandera Partners, LLC. | ||
| 10.21 | * | First Amendment to the Third Amended and Restated Credit Agreement, dated as of September 23, 2016 | ||
| 10.22 | * | Letter Agreement, dated as of December 6, 2016, between the Partnership and Steven Goldman regarding employment.† | ||
| 14 | (16) | Code of Business Conduct and Ethics | ||
| 21 | * | Subsidiaries of the Registrant | ||
| 31.1 | * | Certification of Chief Executive Officer, Star Gas Partners, L.P., pursuant to Rule 13a-14(a)/15d-14(a). | ||
| 31.2 | * | Certification of Chief Financial Officer, Star Gas Partners, L.P., pursuant to Rule 13a-14(a)/15d-14(a). | ||
63
Table of Contents
| Exhibit Number |
Incorp by Ref. to Exh. |
Description | ||
| 32.1 | * | Certification of Chief Executive Officer pursuant to 18 U.S.C. Section 1350, as adopted pursuant to Section 906 of the Sarbanes-Oxley Act of 2002. | ||
| 32.2 | * | Certification of Chief Financial Officer pursuant to 18 U.S.C. Section 1350, as adopted pursuant to Section 906 of the Sarbanes-Oxley Act of 2002. | ||
| 101.INS | * | XBRL Instance Document. | ||
| 101.SCH | * | XBRL Taxonomy Extension Schema Document. | ||
| 101.CAL | * | XBRL Taxonomy Extension Calculation Linkbase Document. | ||
| 101.LAB | * | XBRL Taxonomy Extension Label Linkbase Document. | ||
| 101.PRE | * | XBRL Taxonomy Extension Presentation Linkbase Document. | ||
| 101.DEF | * | XBRL Taxonomy Extension Definition Linkbase Document. | ||
| * | Filed Herewith |
| † | Employee compensation plan. |
| (1) | Incorporated by reference to an exhibit to the Registrant’s Quarterly Report on Form 10-Q filed with the Commission on May 9, 2006. |
| (2) | Incorporated by reference to an exhibit to the Registrant’s Form 8-K dated April 28, 2006. |
| (3) | Incorporated by reference to an exhibit to the Registrant’s Form 8-K dated July 20, 2006. |
| (4) | Incorporated by reference to an exhibit to the Registrant’s Annual Report on Form 10-K for the fiscal year ended September 30, 2006, filed with the Commission on January 17, 2007. |
| (5) | Incorporated by reference to an exhibit to the Registrant’s Current Report on Form 8-K filed with the Commission on March 8, 2005. |
| (6) | Incorporated by reference to an exhibit to the Registrant’s Current Report on Form 8-K dated October 19, 2006. |
| (7) | Incorporated by reference to an exhibit to the Registrant’s Annual Report on Form 10-K for the fiscal year ended September 30, 2007 filed with the Commission on December 7, 2007. |
| (8) | Incorporated by reference to an exhibit to the Registrant’s Annual Report on Form 10-K for the fiscal year ended September 30, 2008 filed with the Commission on December 10, 2008. |
| (9) | Incorporated by reference to an exhibit to the Registrant’s Current Report on Form 8-K dated November 3, 2009. |
| (10) | Incorporated by reference to an exhibit to the Registrant’s Quarterly Report on Form 10-Q for the fiscal quarter ended June 30, 2010. |
| (11) | Incorporated by reference to an exhibit to the Registrant’s Annual Report on Form 10-K for the fiscal year ended September 30, 2010. |
| (12) | Incorporated by reference to an exhibit to the Registrant’s Current Report on Form 8-K dated July 20, 2012. |
| (13) | Incorporated by reference to an exhibit to the Registrant’s Current Report on Form 8-K dated July 23, 2013. |
| (14) | Incorporated by reference to an exhibit to the Registrant’s Quarterly Report on Form 10-Q for the fiscal quarter ended December 31, 2013. |
| (15) | Incorporated by reference to an exhibit to the Registrant’s Annual Report on Form 10-K for the fiscal year ended September 30, 2014. |
| (16) | Incorporated by reference to an exhibit to the Registrant’s Current Report on Form 8-K dated November 14, 2014. |
| (17) | Incorporated by reference to an exhibit to the Registrant’s Current Report on Form 8-K dated July 30, 2015. |
| (18) | Incorporated by reference to an exhibit to the Registrant’s Current Report on Form 8-K dated October 2, 2015. |
64
Table of Contents
SIGNATURE
Pursuant to the requirements of the Securities Exchange Act of 1934, the general partner has duly caused this report to be signed on its behalf by the undersigned thereunto duly authorized:
| STAR GAS PARTNERS, L.P. | ||
| By: | KESTREL HEAT, LLC (General Partner) | |
| By: | /s/ Steven J. Goldman | |
| Steven J. Goldman | ||
| President and Chief Executive Officer | ||
Pursuant to the requirements of the Securities Exchange Act of 1934, this report has been signed by the following persons in the capacities and on the date indicated:
| Signature |
Title |
Date | ||
| /s/ Steven J. Goldman |
President and Chief Executive Officer and Director Kestrel Heat, LLC |
December 7, 2016 | ||
| Steven J. Goldman | ||||
| /s/ Richard F. Ambury |
Chief Financial Officer, Executive Vice President, |
December 7, 2016 | ||
| Richard F. Ambury | Treasurer and Secretary (Principal Financial Officer) Kestrel Heat, LLC |
|||
| /s/ Cory A. Czekanski |
Vice President—Controller (Principal Accounting Officer) Kestrel Heat, LLC |
December 7, 2016 | ||
| Cory A. Czekanski | ||||
| /s/ Paul A. Vermylen, Jr. |
Non-Executive Chairman of the Board and Director Kestrel Heat, LLC |
December 7, 2016 | ||
| Paul A. Vermylen, Jr. | ||||
| /s/ Henry D. Babcock |
Director Kestrel Heat, LLC |
December 7, 2016 | ||
| Henry D. Babcock | ||||
| /s/ C. Scott Baxter |
Director Kestrel Heat, LLC |
December 7, 2016 | ||
| C. Scott Baxter | ||||
| /s/ Daniel P. Donovan |
Director Kestrel Heat, LLC |
December 7, 2016 | ||
| Daniel P. Donovan | ||||
| /s/ Bryan H. Lawrence |
Director Kestrel Heat, LLC |
December 7, 2016 | ||
| Bryan H. Lawrence | ||||
| /s/ Sheldon B. Lubar |
Director Kestrel Heat, LLC |
December 7, 2016 | ||
| Sheldon B. Lubar | ||||
| /s/ William P. Nicoletti |
Director Kestrel Heat, LLC |
December 7, 2016 | ||
| William P. Nicoletti | ||||
65
Table of Contents
STAR GAS PARTNERS, L.P. AND SUBSIDIARIES
INDEX TO CONSOLIDATED FINANCIAL STATEMENTS
AND FINANCIAL STATEMENT SCHEDULE
| Page | ||||
| Part II Financial Information: |
||||
| Item 8—Financial Statements |
||||
| F-2 | ||||
| Consolidated Balance Sheets as of September 30, 2016 and September 30, 2015 |
F-3 | |||
| F-4 | ||||
| F-5 | ||||
| F-6 | ||||
| F-7 | ||||
| F-8 – F-32 | ||||
| Schedules for the years ended September 30, 2016, September 30, 2015 and September 30, 2014 |
||||
| F-33 – F-35 | ||||
| F-36 | ||||
| All other schedules are omitted because they are not applicable or the required information is shown in the consolidated financial statements or the notes therein. |
||||
F-1
Table of Contents
Report of Independent Registered Public Accounting Firm
The Partners of Star Gas Partners, L.P.:
We have audited the accompanying consolidated balance sheets of Star Gas Partners, L.P. and Subsidiaries (the “Partnership”) as of September 30, 2016 and 2015, and the related consolidated statements of operations, comprehensive income, partners’ capital and cash flows for each of the years in the three-year period ended September 30, 2016. In connection with our audits of the consolidated financial statements, we have also audited the financial statement schedules I and II listed in the accompanying index. We also have audited the Partnership’s internal control over financial reporting as of September 30, 2016, based on criteria established in Internal Control – Integrated Framework (2013) issued by the Committee of Sponsoring Organizations of the Treadway Commission (COSO). The Partnership’s management is responsible for these consolidated financial statements and financial statement schedules, for maintaining effective internal control over financial reporting, and for its assessment of the effectiveness of internal control over financial reporting, included in the accompanying Management’s Report on Internal Control over Financial Reporting. Our responsibility is to express an opinion on these consolidated financial statements and financial statement schedules and an opinion on the Partnership’s internal control over financial reporting based on our audits.
We conducted our audits in accordance with the standards of the Public Company Accounting Oversight Board (United States). Those standards require that we plan and perform the audits to obtain reasonable assurance about whether the financial statements are free of material misstatement and whether effective internal control over financial reporting was maintained in all material respects. Our audits of the consolidated financial statements included examining, on a test basis, evidence supporting the amounts and disclosures in the financial statements, assessing the accounting principles used and significant estimates made by management, and evaluating the overall financial statement presentation. Our audit of internal control over financial reporting included obtaining an understanding of internal control over financial reporting, assessing the risk that a material weakness exists, and testing and evaluating the design and operating effectiveness of internal control based on the assessed risk. Our audits also included performing such other procedures as we considered necessary in the circumstances. We believe that our audits provide a reasonable basis for our opinions.
A company’s internal control over financial reporting is a process designed to provide reasonable assurance regarding the reliability of financial reporting and the preparation of financial statements for external purposes in accordance with generally accepted accounting principles. A company’s internal control over financial reporting includes those policies and procedures that (1) pertain to the maintenance of records that, in reasonable detail, accurately and fairly reflect the transactions and dispositions of the assets of the company; (2) provide reasonable assurance that transactions are recorded as necessary to permit preparation of financial statements in accordance with generally accepted accounting principles, and that receipts and expenditures of the company are being made only in accordance with authorizations of management and directors of the company; and (3) provide reasonable assurance regarding prevention or timely detection of unauthorized acquisition, use, or disposition of the company’s assets that could have a material effect on the financial statements.
Because of its inherent limitations, internal control over financial reporting may not prevent or detect misstatements. Also, projections of any evaluation of effectiveness to future periods are subject to the risk that controls may become inadequate because of changes in conditions, or that the degree of compliance with the policies or procedures may deteriorate.
In our opinion, the consolidated financial statements referred to above present fairly, in all material respects, the financial position of Star Gas Partners, L.P. and Subsidiaries as of September 30, 2016 and 2015, and the results of its operations and its cash flows for each of the years in the three-year period ended September 30, 2016, in conformity with U.S. generally accepted accounting principles. In addition, in our opinion, the related financial statement schedules I and II listed in the accompanying index, when considered in relation to the basic consolidated financial statements taken as a whole, present fairly, in all material respects, the information set forth therein. Also in our opinion, Star Gas Partners, L.P. and Subsidiaries maintained, in all material respects, effective internal control over financial reporting as of September 30, 2016, based on criteria established in Internal Control – Integrated Framework (2013) issued by COSO.
/s/ KPMG LLP
Stamford, Connecticut
December 7, 2016
F-2
Table of Contents
STAR GAS PARTNERS, L.P. AND SUBSIDIARIES
| September 30, | ||||||||
| (in thousands) |
2016 | 2015 | ||||||
| ASSETS |
||||||||
| Current assets |
||||||||
| Cash and cash equivalents |
$ | 139,188 | $ | 100,508 | ||||
| Receivables, net of allowance of $4,419 and $6,713, respectively |
78,650 | 89,230 | ||||||
| Inventories |
45,894 | 55,671 | ||||||
| Fair asset value of derivative instruments |
3,987 | 935 | ||||||
| Prepaid expenses and other current assets |
27,139 | 25,135 | ||||||
|
|
|
|
|
|||||
| Total current assets |
294,858 | 271,479 | ||||||
|
|
|
|
|
|||||
| Property and equipment, net |
70,410 | 68,123 | ||||||
| Goodwill |
212,760 | 211,045 | ||||||
| Intangibles, net |
97,656 | 107,317 | ||||||
| Deferred tax assets, net |
5,353 | 16,308 | ||||||
| Deferred charges and other assets, net |
11,933 | 11,236 | ||||||
|
|
|
|
|
|||||
| Total assets |
$ | 692,970 | $ | 685,508 | ||||
|
|
|
|
|
|||||
| LIABILITIES AND PARTNERS’ CAPITAL |
||||||||
| Current liabilities |
||||||||
| Accounts payable |
$ | 25,690 | $ | 25,322 | ||||
| Fair liability value of derivative instruments |
2,285 | 12,819 | ||||||
| Current maturities of long-term debt |
16,200 | 10,000 | ||||||
| Accrued expenses and other current liabilities |
103,855 | 107,745 | ||||||
| Unearned service contract revenue |
56,971 | 44,419 | ||||||
| Customer credit balances |
84,921 | 78,207 | ||||||
|
|
|
|
|
|||||
| Total current liabilities |
289,922 | 278,512 | ||||||
|
|
|
|
|
|||||
| Long-term debt |
76,300 | 90,000 | ||||||
| Other long-term liabilities |
25,255 | 27,110 | ||||||
| Partners’ capital |
||||||||
| Common unitholders |
322,771 | 312,713 | ||||||
| General partner |
(516 | ) | (283 | ) | ||||
| Accumulated other comprehensive loss, net of taxes |
(20,762 | ) | (22,544 | ) | ||||
|
|
|
|
|
|||||
| Total partners’ capital |
301,493 | 289,886 | ||||||
|
|
|
|
|
|||||
| Total liabilities and partners’ capital |
$ | 692,970 | $ | 685,508 | ||||
|
|
|
|
|
|||||
See accompanying notes to consolidated financial statements.
F-3
Table of Contents
STAR GAS PARTNERS, L.P. AND SUBSIDIARIES
CONSOLIDATED STATEMENTS OF OPERATIONS
| Years Ended September 30, | ||||||||||||
| (in thousands, except per unit data) |
2016 | 2015 | 2014 | |||||||||
| Sales: |
||||||||||||
| Product |
$ | 911,014 | $ | 1,431,585 | $ | 1,734,475 | ||||||
| Installations and services |
250,324 | 242,706 | 227,249 | |||||||||
|
|
|
|
|
|
|
|||||||
| Total sales |
1,161,338 | 1,674,291 | 1,961,724 | |||||||||
| Cost and expenses: |
||||||||||||
| Cost of product |
539,831 | 977,631 | 1,349,432 | |||||||||
| Cost of installations and services |
229,010 | 225,957 | 205,868 | |||||||||
| (Increase) decrease in the fair value of derivative instruments |
(18,217 | ) | 4,187 | 6,566 | ||||||||
| Delivery and branch expenses |
276,493 | 309,025 | 282,646 | |||||||||
| Depreciation and amortization expenses |
26,530 | 24,930 | 21,635 | |||||||||
| General and administrative expenses |
23,366 | 25,908 | 22,592 | |||||||||
| Multiemployer pension plan withdrawal charge |
— | 17,796 | — | |||||||||
| Finance charge income |
(3,079 | ) | (4,756 | ) | (6,870 | ) | ||||||
|
|
|
|
|
|
|
|||||||
| Operating income |
87,404 | 93,613 | 79,855 | |||||||||
| Interest expense, net |
(7,485 | ) | (14,059 | ) | (16,854 | ) | ||||||
| Amortization of debt issuance costs |
(1,247 | ) | (1,818 | ) | (1,602 | ) | ||||||
| Loss on redemption of debt |
— | (7,345 | ) | — | ||||||||
|
|
|
|
|
|
|
|||||||
| Income before income taxes |
78,672 | 70,391 | 61,399 | |||||||||
| Income tax expense |
33,738 | 32,835 | 25,315 | |||||||||
|
|
|
|
|
|
|
|||||||
| Net income |
$ | 44,934 | $ | 37,556 | $ | 36,084 | ||||||
| General Partner’s interest in net income |
252 | 212 | 203 | |||||||||
|
|
|
|
|
|
|
|||||||
| Limited Partners’ interest in net income |
$ | 44,682 | $ | 37,344 | $ | 35,881 | ||||||
|
|
|
|
|
|
|
|||||||
| Basic and diluted income per Limited Partner Unit (1): |
$ | 0.70 | $ | 0.59 | $ | 0.57 | ||||||
|
|
|
|
|
|
|
|||||||
| Weighted average number of Limited Partner units outstanding: |
||||||||||||
| Basic and Diluted |
57,022 | 57,285 | 57,476 | |||||||||
|
|
|
|
|
|
|
|||||||
| (1) | See Note 17 Earnings Per Limited Partner Units. |
See accompanying notes to consolidated financial statements.
F-4
Table of Contents
STAR GAS PARTNERS, L.P. AND SUBSIDIARIES
CONSOLIDATED STATEMENTS OF COMPREHENSIVE INCOME
| Years Ended September 30, | ||||||||||||
| (in thousands) |
2016 | 2015 | 2014 | |||||||||
| Net income |
$ | 44,934 | $ | 37,556 | $ | 36,084 | ||||||
| Other comprehensive income (loss): |
||||||||||||
| Unrealized gain (loss) on pension plan obligation (1) |
3,067 | 1,827 | (1,070 | ) | ||||||||
| Tax effect of unrealized gain (loss) on pension plan obligation |
(1,285 | ) | (753 | ) | 463 | |||||||
|
|
|
|
|
|
|
|||||||
| Total other comprehensive income (loss) |
1,782 | 1,074 | (607 | ) | ||||||||
|
|
|
|
|
|
|
|||||||
| Total comprehensive income |
$ | 46,716 | $ | 38,630 | $ | 35,477 | ||||||
|
|
|
|
|
|
|
|||||||
| (1) | These items are included in the computation of net periodic pension cost. See Note 12 - Employee Benefit Plans. |
See accompanying notes to consolidated financial statements.
F-5
Table of Contents
STAR GAS PARTNERS, L.P. AND SUBSIDIARIES
CONSOLIDATED STATEMENTS OF PARTNERS’ CAPITAL
Years Ended September 30, 2016, 2015 and 2014
| Number of Units | ||||||||||||||||||||||||
| (in thousands) |
Common | General Partner |
Common | General Partner |
Accum. Other Comprehensive Income (Loss) |
Total Partners’ Capital |
||||||||||||||||||
| Balance as of September 30, 2013 |
57,718 | 326 | $ | 282,289 | $ | 3 | $ | (23,011 | ) | $ | 259,281 | |||||||||||||
| Net income |
35,881 | 203 | 36,084 | |||||||||||||||||||||
| Unrealized loss on pension plan obligation (1) |
(1,070 | ) | (1,070 | ) | ||||||||||||||||||||
| Tax effect of unrealized loss on pension plan obligation |
463 | 463 | ||||||||||||||||||||||
| Distributions (2) |
(19,539 | ) | (311 | ) | (19,850 | ) | ||||||||||||||||||
| Retirement of units (3) |
(313 | ) | (1,663 | ) | (1,663 | ) | ||||||||||||||||||
|
|
|
|
|
|
|
|
|
|
|
|
|
|||||||||||||
| Balance as of September 30, 2014 |
57,405 | 326 | $ | 296,968 | $ | (105 | ) | $ | (23,618 | ) | $ | 273,245 | ||||||||||||
| Net income |
37,344 | 212 | 37,556 | |||||||||||||||||||||
| Unrealized gain on pension plan obligation (1) |
1,827 | 1,827 | ||||||||||||||||||||||
| Tax effect of unrealized gain on pension plan obligation |
(753 | ) | (753 | ) | ||||||||||||||||||||
| Distributions (2) |
(20,908 | ) | (390 | ) | (21,298 | ) | ||||||||||||||||||
| Retirement of units (3) |
(123 | ) | (691 | ) | (691 | ) | ||||||||||||||||||
|
|
|
|
|
|
|
|
|
|
|
|
|
|||||||||||||
| Balance as of September 30, 2015 |
57,282 | 326 | $ | 312,713 | $ | (283 | ) | $ | (22,544 | ) | $ | 289,886 | ||||||||||||
| Net income |
44,682 | 252 | 44,934 | |||||||||||||||||||||
| Unrealized gain on pension plan obligation (1) |
3,067 | 3,067 | ||||||||||||||||||||||
| Tax effect of unrealized gain on pension plan obligation |
(1,285 | ) | (1,285 | ) | ||||||||||||||||||||
| Distributions (2) |
(22,607 | ) | (485 | ) | (23,092 | ) | ||||||||||||||||||
| Retirement of units (3) |
(1,395 | ) | (12,017 | ) | (12,017 | ) | ||||||||||||||||||
|
|
|
|
|
|
|
|
|
|
|
|
|
|||||||||||||
| Balance as of September 30, 2016 |
55,887 | 326 | $ | 322,771 | $ | (516 | ) | $ | (20,762 | ) | $ | 301,493 | ||||||||||||
|
|
|
|
|
|
|
|
|
|
|
|
|
|||||||||||||
| (1) | These items are included in the computation of net periodic pension cost. See Note 12 - Employee Benefit Plans. |
| (2) | See Note 3 - Quarterly Distributions of Available Cash. |
| (3) | See Note 4 - Common Unit Repurchase Plans and Retirement. |
See accompanying notes to consolidated financial statements.
F-6
Table of Contents
STAR GAS PARTNERS, L.P. AND SUBSIDIARIES
CONSOLIDATED STATEMENTS OF CASH FLOWS
| Years Ended September 30, | ||||||||||||
| (in thousands) |
2016 | 2015 | 2014 | |||||||||
| Cash flows provided by (used in) operating activities: |
||||||||||||
| Net income |
$ | 44,934 | $ | 37,556 | $ | 36,084 | ||||||
| Adjustments to reconcile net income to net cash provided by (used in) operating activities: |
||||||||||||
| (Increase) decrease in fair value of derivative instruments |
(18,217 | ) | 4,187 | 6,566 | ||||||||
| Depreciation and amortization |
27,777 | 26,748 | 23,237 | |||||||||
| Multiemployer pension plan withdrawal charge |
— | 17,796 | — | |||||||||
| Loss on redemption of debt |
— | 7,345 | — | |||||||||
| (Recovery) provision for losses on accounts receivable |
(639 | ) | 3,738 | 7,514 | ||||||||
| Change in deferred taxes |
9,670 | (4,101 | ) | 658 | ||||||||
| Changes in operating assets and liabilities net of amounts related to acquisitions: |
||||||||||||
| Decrease in receivables |
10,965 | 30,141 | 12,771 | |||||||||
| Decrease in inventories |
9,979 | 4,326 | 14,057 | |||||||||
| (Increase) decrease in other assets |
(2,354 | ) | 113 | 2,571 | ||||||||
| Increase (decrease) in accounts payable |
(705 | ) | 3,189 | (8,091 | ) | |||||||
| Increase (decrease) in customer credit balances |
6,490 | 3,992 | (2,433 | ) | ||||||||
| Increase in other current and long-term liabilities |
14,057 | 1,823 | 2,221 | |||||||||
|
|
|
|
|
|
|
|||||||
| Net cash provided by operating activities |
101,957 | 136,853 | 95,155 | |||||||||
|
|
|
|
|
|
|
|||||||
| Cash flows provided by (used in) investing activities: |
||||||||||||
| Capital expenditures |
(10,134 | ) | (9,555 | ) | (9,112 | ) | ||||||
| Proceeds from sales of fixed assets |
318 | 300 | 257 | |||||||||
| Acquisitions (net of cash acquired of $0, $0, and $4,151, respectively) |
(9,815 | ) | (21,130 | ) | (98,463 | ) | ||||||
|
|
|
|
|
|
|
|||||||
| Net cash used in investing activities |
(19,631 | ) | (30,385 | ) | (107,318 | ) | ||||||
|
|
|
|
|
|
|
|||||||
| Cash flows provided by (used in) financing activities: |
||||||||||||
| Revolving credit facility borrowings |
— | 12,296 | 195,482 | |||||||||
| Revolving credit facility repayments |
— | (12,296 | ) | (195,482 | ) | |||||||
| Redemption of senior notes |
— | (125,000 | ) | — | ||||||||
| Debt redemption cost |
— | (5,548 | ) | — | ||||||||
| Proceeds from term loan |
— | 100,000 | — | |||||||||
| Loan repayments |
(7,500 | ) | — | — | ||||||||
| Distributions |
(23,092 | ) | (21,298 | ) | (19,850 | ) | ||||||
| Unit repurchases |
(12,017 | ) | (691 | ) | (1,663 | ) | ||||||
| Customer retainage payments |
(740 | ) | — | — | ||||||||
| Payments of debt issue costs |
(297 | ) | (2,422 | ) | (2,382 | ) | ||||||
|
|
|
|
|
|
|
|||||||
| Net cash used in financing activities |
(43,646 | ) | (54,959 | ) | (23,895 | ) | ||||||
|
|
|
|
|
|
|
|||||||
| Net increase (decrease) in cash |
38,680 | 51,509 | (36,058 | ) | ||||||||
| Cash and equivalents at beginning of period |
100,508 | 48,999 | 85,057 | |||||||||
|
|
|
|
|
|
|
|||||||
| Cash and equivalents at end of period |
$ | 139,188 | $ | 100,508 | $ | 48,999 | ||||||
|
|
|
|
|
|
|
|||||||
See accompanying notes to consolidated financial statements.
F-7
Table of Contents
STAR GAS PARTNERS, L.P. AND SUBSIDIARIES
NOTES TO CONSOLIDATED FINANCIAL STATEMENTS
1) Partnership Organization
Star Gas Partners, L.P. (“Star Gas Partners,” the “Partnership,” “we,” “us,” or “our”) is a full service provider specializing in the sale of home heating products and services to residential and commercial customers. The Partnership also services and sells heating and air conditioning equipment to its home heating oil and propane customers and to a lesser extent, provides these offerings to customers outside of our home heating oil and propane customer base. In certain of our marketing areas, we provide home security and plumbing services primarily to our home heating oil and propane customer base. We also sell diesel fuel, gasoline and home heating oil on a delivery only basis. These products and services are offered through our home heating oil and propane locations. The Partnership has one reportable segment for accounting purposes. We believe we are the nation’s largest retail distributor of home heating oil based upon sales volume. Including our propane locations, we serve customers in the more northern and eastern states within the Northeast, Central and Southeast U.S. regions.
The Partnership is organized as follows:
| • | The Partnership is a master limited partnership, which at September 30, 2016, had outstanding 55.9 million Common Units (NYSE: “SGU”), representing 99.42% limited partner interest in Star Gas Partners, and 0.3 million general partner units, representing 0.58% general partner interest in Star Gas Partners. The general partner of the Partnership is Kestrel Heat, LLC, a Delaware limited liability company (“Kestrel Heat” or the “general partner”). The Board of Directors of Kestrel Heat (the “Board”) is appointed by its sole member, Kestrel Energy Partners, LLC, a Delaware limited liability company (“Kestrel”). |
| • | The Partnership owns 100% of Star Acquisitions, Inc. (“SA”), a Minnesota corporation, that owns 100% of Petro Holdings, Inc. (“Petro”). SA and its subsidiaries are subject to Federal and state corporate income taxes. The Partnership’s operations are conducted through Petro and its subsidiaries. Petro is primarily a Northeast, Central and Southeast region retail distributor of home heating oil and propane that at September 30, 2016, served approximately 437,000 full-service residential and commercial home heating oil and propane customers. Petro also sold diesel fuel, gasoline and home heating oil to approximately 71,000 customers on a delivery only basis. In addition, Petro installed, maintained, and repaired heating and air conditioning equipment for its customers and provided ancillary home services, including home security and plumbing, to approximately 27,000 customers. |
| • | Petroleum Heat and Power Co., Inc. (“PH&P”) is a 100% owned subsidiary of the Partnership. PH&P is the borrower and the Partnership is the guarantor of the third amended and restated credit agreement’s five-year senior secured term loan and the $300 million ($450 million during the heating season of December through April of each year) revolving credit facility, both due July 30, 2020. (See Note 11—Long-Term Debt and Bank Facility Borrowings) |
2) Summary of Significant Accounting Policies
Basis of Presentation
The Consolidated Financial Statements include the accounts of Star Gas Partners, L.P. and its subsidiaries. All material intercompany items and transactions have been eliminated in consolidation.
Comprehensive Income
Comprehensive income is comprised of net income and other comprehensive income (loss). Other comprehensive income (loss) consists of the unrealized gain (loss) amortization on the Partnership’s pension plan obligation for its two frozen defined benefit pension plans, and the corresponding tax effect.
Use of Estimates
The preparation of financial statements in accordance with U.S. generally accepted accounting principles requires management to make estimates and assumptions that affect the reported amounts of assets and liabilities and disclosure of contingent assets and liabilities at the date of the financial statements and the reported amounts of revenue and expenses during the reporting period. Actual results could differ from those estimates.
F-8
Table of Contents
Revenue Recognition
Sales of petroleum products are recognized at the time of delivery to the customer and sales of heating and air conditioning equipment are recognized upon completion of installation. Revenue from repairs, maintenance and other services are recognized upon completion of the service. Payments received from customers for equipment service contracts are deferred and amortized into income over the terms of the respective service contracts, on a straight-line basis, which generally do not exceed one year. To the extent that the Partnership anticipates that future costs for fulfilling its contractual obligations under its service maintenance contracts will exceed the amount of deferred revenue currently attributable to these contracts, the Partnership recognizes a loss in current period earnings equal to the amount that anticipated future costs exceed related deferred revenues.
Cost of Product
Cost of product includes the cost of home heating oil, diesel, propane, kerosene, heavy oil, gasoline, throughput costs, barging costs, option costs, and realized gains/losses on closed derivative positions for product sales.
Cost of Installations and Services
Cost of installations and services includes equipment and material costs, wages and benefits for equipment technicians, dispatchers and other support personnel, subcontractor expenses, commissions and vehicle related costs.
Delivery and Branch Expenses
Delivery and branch expenses include wages and benefits and department related costs for drivers, dispatchers, garage mechanics, customer service, sales and marketing, compliance, credit and branch accounting, information technology, vehicle and property rental costs, insurance, weather hedge contract costs and recoveries, and operational management and support.
General and Administrative Expenses
General and administrative expenses include property rental costs, wages and benefits and department related costs for human resources, finance and partnership accounting, internal audit, administrative support and supply.
Allocation of Net Income
Net income for partners’ capital and statement of operations is allocated to the general partner and the limited partners in accordance with their respective ownership percentages, after giving effect to cash distributions paid to the general partner in excess of its ownership interest, if any.
Net Income per Limited Partner Unit
Income per limited partner unit is computed in accordance with the Financial Accounting Standards Board (“FASB”) Accounting Standards Codification (“ASC”) 260-10-05 Earnings Per Share, Master Limited Partnerships (EITF 03-06), by dividing the limited partners’ interest in net income by the weighted average number of limited partner units outstanding. The pro forma nature of the allocation required by this standard provides that in any accounting period where the Partnership’s aggregate net income exceeds its aggregate distribution for such period, the Partnership is required to present net income per limited partner unit as if all of the earnings for the periods were distributed, regardless of whether those earnings would actually be distributed during a particular period from an economic or practical perspective. This allocation does not impact the Partnership’s overall net income or other financial results. However, for periods in which the Partnership’s aggregate net income exceeds its aggregate distributions for such period, it will have the impact of reducing the earnings per limited partner unit, as the calculation according to this standard results in a theoretical increased allocation of undistributed earnings to the general partner. In accounting periods where aggregate net income does not exceed aggregate distributions for such period, this standard does not have any impact on the Partnership’s net income per limited partner unit calculation. A separate and independent calculation for each quarter and year-to-date period is performed, in which the Partnership’s contractual participation rights are taken into account.
Cash equivalents, Receivables, Revolving Credit Facility Borrowings, and Accounts Payable
The carrying amount of cash equivalents, receivables, revolving credit facility borrowings, and accounts payable approximates fair value because of the short maturity of these instruments.
F-9
Table of Contents
Cash Equivalents
The Partnership considers all highly liquid investments with an original maturity of three months or less, when purchased, to be cash equivalents.
Receivables and Allowance for Doubtful Accounts
Accounts receivables from customers are recorded at the invoiced amounts. Finance charges may be applied to trade receivables that are more than 30 days past due, and are recorded as finance charge income.
The allowance for doubtful accounts is the Partnership’s best estimate of the amount of trade receivables that may not be collectible. The allowance is determined at an aggregate level by grouping accounts based on certain account criteria and its receivable aging. The allowance is based on both quantitative and qualitative factors, including historical loss experience, historical collection patterns, overdue status, aging trends, and current economic conditions. The Partnership has an established process to periodically review current and past due trade receivable balances to determine the adequacy of the allowance. No single statistic or measurement determines the adequacy of the allowance. The total allowance reflects management’s estimate of losses inherent in its trade receivables at the balance sheet date. Different assumptions or changes in economic conditions could result in material changes to the allowance for doubtful accounts.
Inventories
Liquid product inventories are stated at the lower of cost or market using the weighted average cost method of accounting. All other inventories, representing parts and equipment are stated at the lower of cost or market using the FIFO method.
Property and Equipment
Property and equipment are stated at cost. Depreciation is computed over the estimated useful lives of the depreciable assets using the straight-line method.
Goodwill and Intangible Assets
Goodwill and intangible assets include goodwill, customer lists, trade names and covenants not to compete.
Goodwill is the excess of cost over the fair value of net assets in the acquisition of a company. In accordance with FASB ASC 350-10-05 Intangibles-Goodwill and Other, goodwill and intangible assets with indefinite useful lives are not amortized, but instead are annually tested for impairment. Also in accordance with this standard, intangible assets with finite useful lives are amortized over their respective estimated useful lives to their estimated residual values, and reviewed for impairment. The Partnership performs its annual impairment review during its fiscal fourth quarter or more frequently if events or circumstances indicate that the value of goodwill might be impaired.
Customer lists are the names and addresses of an acquired company’s customers. Based on historical retention experience, these lists are amortized on a straight-line basis over seven to ten years.
Trade names are the names of acquired companies. Based on the economic benefit expected and historical retention experience of customers, trade names are amortized on a straight-line basis over seven to twenty years.
Business Combinations
The Partnership uses the acquisition method of accounting in accordance with FASB ASC 805 Business Combinations. The acquisition method of accounting requires the Partnership to use significant estimates and assumptions, including fair value estimates, as of the business combination date, and to refine those estimates as necessary during the measurement period (defined as the period, not to exceed one year, in which the amounts recognized for a business combination may be adjusted). Each acquired company’s operating results are included in the Partnership’s consolidated financial statements starting on the date of acquisition. The purchase price is equivalent to the fair value of consideration transferred. Tangible and identifiable intangible assets acquired and liabilities assumed as of the date of acquisition are recorded at the acquisition date fair value. The separately identifiable intangible assets generally are comprised of customer lists, trade names and covenants not to compete. Goodwill is recognized for the excess of the purchase price over the net fair value of assets acquired and liabilities assumed.
F-10
Table of Contents
Costs that are incurred to complete the business combination such as legal and other professional fees are not considered part of consideration transferred, and are charged to general and administrative expense as they are incurred. For any given acquisition, certain contingent consideration may be identified. Estimates of the fair value of liability or asset classified contingent consideration are included under the acquisition method as part of the assets acquired or liabilities assumed. At each reporting date, these estimates are remeasured to fair value, with changes recognized in earnings.
Impairment of Long-lived Assets
The Partnership reviews intangible assets and other long-lived assets in accordance with FASB ASC 360-10-05-4 Property Plant and Equipment, Impairment or Disposal of Long-Lived Assets subsection, for impairment whenever events or changes in circumstances indicate that the carrying amount of such assets may not be recoverable. The Partnership determines whether the carrying values of such assets are recoverable over their remaining estimated lives through undiscounted future cash flow analysis. If such a review should indicate that the carrying amount of the assets is not recoverable, the Partnership will reduce the carrying amount of such assets to fair value.
Deferred Charges
Deferred charges represent the costs associated with the issuance of the revolving credit facility and are amortized over the life the facility.
Advertising and Direct Mail Expenses
Advertising and direct mail costs are expensed as they are incurred. Advertising and direct mail expenses were $14.9 million, $14.5 million, and $12.5 million, in 2016, 2015, and 2014, respectively and are recorded in delivery and branch expenses.
Customer Credit Balances
Customer credit balances represent payments received in advance from customers pursuant to a balanced payment plan (whereby customers pay on a fixed monthly basis) and the payments made have exceeded the charges for liquid product and other services.
Environmental Costs
Costs associated with managing hazardous substances and pollution are expensed on a current basis. Accruals are made for costs associated with the remediation of environmental pollution when it becomes probable that a liability has been incurred and the amount can be reasonably estimated.
Insurance Reserves
The Partnership uses a combination of insurance, self-insured retention and self-insurance for a number of risks, including workers’ compensation, general liability, vehicle liability and property. Reserves are established and periodically evaluated, based upon expectations as to what our ultimate liability may be for outstanding claims using developmental factors based upon historical claim experience, including frequency, severity, demographic factors and other actuarial assumptions, supplemented with support from qualified actuaries.
Income Taxes
The Partnership is a master limited partnership and is not subject to tax at the entity level for Federal and State income tax purposes. Rather, income and losses of the Partnership are allocated directly to the individual partners (the Partnership’s corporate subsidiaries are subject to tax at the entity level for federal and state income tax purposes). While the Partnership will generate non-qualifying Master Limited Partnership revenue through its corporate subsidiaries, distributions from the corporate subsidiaries to the Partnership are generally included in the determination of qualified Master Limited Partnership income. All or a portion of the distributions received by the Partnership from the corporate subsidiaries could be a dividend or capital gain to the partners.
The accompanying financial statements are reported on a fiscal year, however, the Partnership and its Corporate subsidiaries file Federal and State income tax returns on a calendar year.
F-11
Table of Contents
As most of the Partnership’s income is derived from its corporate subsidiaries, these financial statements reflect significant Federal and State income taxes. For corporate subsidiaries of the Partnership, a consolidated Federal income tax return is filed. Deferred tax assets and liabilities are recognized for the future tax consequences attributable to differences between the financial statement carrying amount of assets and liabilities and their respective tax bases and operating loss carry-forwards. Deferred tax assets and liabilities are measured using enacted tax rates expected to apply to taxable income in the years in which those temporary differences are expected to be recovered or settled. A valuation allowance is recognized if, based on the weight of available evidence including historical tax losses, it is more likely than not that some or all of deferred tax assets will not be realized.
Sales, Use and Value Added Taxes
Taxes are assessed by various governmental authorities on many different types of transactions. Sales reported for product, installations and services excludes taxes.
Derivatives and Hedging
FASB ASC 815-10-05 Derivatives and Hedging, requires that derivative instruments be recorded at fair value and included in the consolidated balance sheet as assets or liabilities. The Partnership has elected not to designate its derivative instruments as hedging instruments under this guidance, and the changes in fair value of the derivative instruments are recognized in our statement of operations.
Weather Hedge Contract
To partially mitigate the adverse effect of warm weather on cash flows, the Partnership has used weather hedge contracts for a number of years. Weather hedge contracts are recorded in accordance with the intrinsic value method defined by FASB ASC 815-45-15 Derivatives and Hedging, Weather Derivatives (EITF 99-2). The premium paid is included in the caption prepaid expenses and other current assets in the accompanying balance sheets and amortized over the life of the contract, with the intrinsic value method applied at each interim period.
For fiscal years 2014, 2015, and 2016 the Partnership has a weather hedge contract with Swiss Re under which we are entitled to receive a payment of $35,000 per heating degree-day shortfall, when the total number of heating degree-days in the hedge period is less than approximately 92.5% of the ten year average, the Payment Threshold. The hedge covers the period from November 1, through March 31, taken as a whole, for each respective fiscal year, and has a maximum payout of $12.5 million for each respective fiscal year. During the first quarter of 2016, the Partnership recorded a credit of $12.5 million under this contract that reduced delivery and branch expenses. This amount was collected in April 2016. The Partnership did not record any benefit under its weather hedge contract during fiscal years 2014 and 2015.
Recently Adopted Accounting Pronouncements
In November 2015, FASB issued ASU 2015-17, Income Taxes—Balance Sheet Classification of Deferred Taxes, which eliminates the requirement for companies to present deferred tax assets and liabilities as current and non-current in a classified balance sheet. Instead, companies are required to classify all deferred tax assets and liabilities as non-current. The Partnership retrospectively adopted the ASU effective September 30, 2016. As a result of the adoption, certain prior year balances changed to conform to the current year presentation as follows: current deferred tax assets, net decreased from $37.8 million to $0, long-term deferred tax liabilities, net decreased from $21.5 million to $0, and deferred tax assets, net increased from $0 to $16.3 million.
Recently Issued Accounting Pronouncements
In May 2014, the Financial Accounting Standards Board (“FASB”) issued Accounting Standards Update (“ASU”) No. 2014-09, Revenue from Contracts with Customers, which requires an entity to recognize the amount of revenue to which it expects to be entitled for the transfer of promised goods or services to customers. This ASU will replace most existing revenue recognition guidance in GAAP when it becomes effective. This new guidance is effective for our annual reporting period beginning in the first quarter of fiscal 2019, with early adoption permitted beginning in the first quarter of fiscal 2018. The standard permits the use of either the retrospective or cumulative effect transition method. The Partnership is evaluating the effect that ASU 2014-09 will have on its consolidated financial statements and related disclosures. The Partnership has not yet selected a transition method nor has it determined the timing of adoption.
In April 2015, the FASB issued ASU No. 2015-03, Interest—Imputation of Interest (Subtopic 835-30): Simplifying the Presentation of Debt Issuance Costs. The update requires debt issuance costs related to a recognized debt liability be presented in the balance sheet as a direct deduction from the carrying amount of the related debt liability instead of being presented as an asset. The update requires retrospective application and represents a change in accounting principle. The update is effective for our annual reporting period beginning in the first quarter of fiscal 2017, with early adoption permitted. The Partnership expects the impact of ASU No. 2015-03 will be limited to the presentation of debt issuance cost on its balance sheet.
F-12
Table of Contents
In July 2015, the FASB issued ASU No. 2015-11, Simplifying the Measurement of Inventory. The update changes the measurement principle for inventory from the lower of cost or market to the lower of cost and net realizable value. This new guidance is effective for our annual reporting period beginning in the first quarter of fiscal 2018, with early adoption permitted. The Partnership does not expect ASU No. 2015-11 to have a material impact on its consolidated financial statements and related disclosures.
In September 2015, the FASB issued ASU No. 2015-16, Simplifying the Accounting for Measurement-Period Adjustments, which requires an acquiring entity to recognize adjustments to provisional amounts that are identified during the measurement period in the reporting period in which the adjustment amounts are determined. The acquiring entity is required to record, in the same period’s financial statements, the effect on earnings of changes in depreciation, amortization, or other income effects, if any, as a result of the change to the provisional amounts, calculated as if the accounting had been completed at the acquisition date. In addition, the acquiring entity is to present separately on the face of its income statement or disclose in the notes the portion of the amount recorded in current-period earnings by line item that would have been recorded in previous reporting periods as if the adjustment to the provisional amounts had been recognized as of the acquisition date. This new guidance is effective for our annual reporting period beginning in the first quarter of fiscal 2017. The Partnership does not expect ASU No. 2015-16 to have a material impact on its consolidated financial statements and related disclosures.
In February 2016, the FASB issued ASU No. 2016-02, Leases. The update requires all leases with a term greater than twelve months to be recognized on the balance sheet through a right-of-use asset and a lease liability and the disclosure of key information pertaining to leasing arrangements. This new guidance is effective for our annual reporting period beginning in the first quarter of fiscal 2020, with early adoption permitted. The Partnership is evaluating the effect that ASU No. 2016-02 will have on its consolidated financial statements and related disclosures, but has not yet selected a transition method or determined the timing of adoption.
In June 2016, the FASB issued ASU No. 2016-13, Financial Instruments – Credit Losses. The update broadens the information that an entity should consider in developing expected credit loss estimates, eliminates the probable initial recognition threshold, and allows for the immediate recognition of the full amount of expected credit losses. This new guidance is effective for our annual reporting period beginning in the first quarter of fiscal 2021, with early adoption permitted in the first quarter of fiscal 2020. The Partnership is evaluating the effect that ASU No. 2016-13 will have on its consolidated financial statements and related disclosures, but has not yet determined the timing of adoption.
In August 2016, the FASB issued ASU No. 2016-15, Statement of Cash Flow (Topic 230): Classification of Certain Cash Receipts and Cash Payments. The update addresses the issues of debt prepayment or debt extinguishment costs, settlement of zero-coupon debt instruments or other debt instruments with coupon interest rates that are insignificant in relation to the effective interest rate of the borrowing, contingent consideration payments made after a business combination, proceeds from the settlement of insurance claims, proceeds from the settlement of corporate owned life insurance policies, distributions received from equity method investees, beneficial interests in securitization transactions, and separately identifiable cash flows and application of the predominance principle. This new guidance is effective for our annual reporting period beginning in the first quarter of fiscal 2019, with early adoption permitted. The Partnership does not expect ASU 2016-15 to have a material impact on its consolidated financial statements and related disclosures.
3) Quarterly Distribution of Available Cash
The Partnership agreement provides that beginning October 1, 2008, minimum quarterly distributions on the common units will start accruing at the rate of $0.0675 per quarter ($0.27 on an annual basis) in accordance with the Partnership agreement. In general, the Partnership intends to distribute to its partners on a quarterly basis, all of its available cash, if any, in the manner described below. “Available cash” generally means, for any of its fiscal quarters, all cash on hand at the end of that quarter, less the amount of cash reserves that are necessary or appropriate in the reasonable discretion of the general partners to:
| • | provide for the proper conduct of the Partnership’s business including acquisitions and debt payments; |
| • | comply with applicable law, any of its debt instruments or other agreements; or |
| • | provide funds for distributions to the common unitholders during the next four quarters, in some circumstances. |
F-13
Table of Contents
Available cash will generally be distributed as follows:
| • | first, 100% to the common units, pro rata, until the Partnership distributes to each common unit the minimum quarterly distribution of $0.0675; |
| • | second, 100% to the common units, pro rata, until the Partnership distributes to each common unit any arrearages in payment of the minimum quarterly distribution on the common units for prior quarters; |
| • | third, 100% to the general partner units, pro rata, until the Partnership distributes to each general partner unit the minimum quarterly distribution of $0.0675; |
| • | fourth, 90% to the common units, pro rata, and 10% to the general partner units, pro rata (subject to the Management Incentive Plan), until the Partnership distributes to each common unit the first target distribution of $0.1125; and |
| • | thereafter, 80% to the common units, pro rata, and 20% to the general partner units, pro rata. |
The Partnership is obligated to meet certain financial covenants under the third amended and restated credit agreement. The Partnership must maintain excess availability of at least 15.0% of the revolving commitment then in effect and a fixed charge coverage ratio of 1.15 in order to make any distributions to unitholders.
For fiscal 2016, 2015, and 2014, cash distributions declared per common unit were $0.395, $0.365, and $0.34, respectively.
For fiscal 2016, 2015, and 2014, $0.4 million, $0.3 million, and $0.2 million, respectively, of incentive distributions were paid to the general partner, exclusive of amounts paid subject to the Management Incentive Plan.
4) Common Unit Repurchase Plans and Retirement
In July 2012, the Board of Directors (“the Board”) of the general partner of the Partnership authorized the repurchase of up to 3.0 million of the Partnership’s Common Units (“Plan III”). In July 2013, the Board authorized the repurchase of an additional 1.9 million Common Units under Plan III. The authorized Common Unit repurchases may be made from time-to-time in the open market, in privately negotiated transactions or in such other manner deemed appropriate by management. There is no guarantee of the exact number of units that will be purchased under the program and the Partnership may discontinue purchases at any time. The program does not have a time limit. The Board may also approve additional purchases of units from time to time in private transactions. The Partnership’s repurchase activities take into account SEC safe harbor rules and guidance for issuer repurchases. All of the Common Units purchased in the repurchase program will be retired.
Under the Partnership’s third amended and restated credit agreement dated July 30, 2015, in order to repurchase Common Units we must maintain Availability (as defined in the amended and restated credit agreements) of $45 million, 15.0% of the facility size of $300 million (assuming the non-seasonal aggregate commitment is outstanding) on a historical pro forma and forward-looking basis, and a fixed charge coverage ratio of not less than 1.15 measured as of the date of repurchase. The Partnership was in compliance with this covenant (or the equivalent covenant under the credit agreement then in effect) for all unit repurchases made during the twelve months ended September 30, 2016.
F-14
Table of Contents
The following table shows repurchases under Plan III.
| (in thousands, except per unit amounts) Period |
Total Number of Units Purchased (a) |
Average Price Paid per Unit (b) |
Maximum Number of Units that May Yet Be Purchased |
|||||||||
| Plan III - Number of units authorized |
4,894 | |||||||||||
| Private transaction - Number of units authorized |
2,450 | |||||||||||
|
|
|
|||||||||||
| 7,344 | ||||||||||||
|
|
|
|
|
|||||||||
| Plan III - Fiscal years 2012 to 2015 total (c) |
3,742 | $ | 4.72 | 2,302 | ||||||||
|
|
|
|
|
|||||||||
| Plan III - First quarter fiscal year 2016 total |
3 | $ | 7.02 | 2,299 | ||||||||
| Plan III - Second quarter fiscal year 2016 total |
92 | $ | 7.49 | 2,207 | ||||||||
| Plan III - Third quarter fiscal year 2016 total |
— | $ | — | 2,207 | ||||||||
| Plan III - Fourth quarter fiscal year 2016 total (d) |
1,300 | $ | 8.70 | 2,207 | ||||||||
|
|
|
|
|
|||||||||
| Plan III - Fiscal year 2016 total |
1,395 | $ | 8.62 | 2,207 | ||||||||
|
|
|
|
|
|||||||||
| (a) | Units were repurchased as part of a publicly announced program, except as noted in a private transaction. |
| (b) | Amounts include repurchase costs. |
| (c) | Includes 1.15 million common units acquired in a private transaction. |
| (d) | Includes 1.3 million common units acquired in a private transaction. |
5) Derivatives and Hedging—Disclosures and Fair Value Measurements
The Partnership uses derivative instruments such as futures, options and swap agreements in order to mitigate exposure to market risk associated with the purchase of home heating oil for price-protected customers, physical inventory on hand, inventory in transit, priced purchase commitments and internal fuel usage. The Partnership has elected not to designate its derivative instruments as hedging derivatives, but rather as economic hedges whose change in fair value is recognized in its statement of operations in the line item (Increase) decrease in the fair value of derivative instruments. Depending on the risk being economically hedged, realized gains and losses are recorded in cost of product, cost of installations and services, or delivery and branch expenses.
As of September 30, 2016, to hedge a substantial majority of the purchase price associated with heating oil gallons anticipated to be sold to its price-protected customers, the Partnership held the following derivative instruments that settle in future months to match anticipated sales: 9.9 million gallons of swap contracts with a notional value of $14.3 million and a fair value of $1.2 million, 6.8 million gallons of call options with a notional value of $13.8 million and a fair value of $0.3 million, 6.2 million gallons of put options with a notional value of $6.5 million and a fair value of $0.02 million, and 84.9 million net gallons of synthetic call options with an average notional value of $133.5 million and a fair value of $1.3 million. To hedge the inter-month differentials for its price-protected customers, its physical inventory on hand and inventory in transit, the Partnership, as of September 30, 2016, had 1.2 million gallons of purchased swap contracts with a notional value of $1.7 million and a fair value of $0.2 million, 4.4 million gallons of purchased future contracts with a notional value of $6.7 million and a fair value of $0.5 million, and 21.8 million gallons of sold future contracts with a notional value of $32.2 million and a fair value of $(2.1) million that settle in future months. In addition to the previously described hedging instruments, to lock-in the differential between high sulfur home heating oil and ultra low sulfur diesel, the Partnership as of September 30, 2016, had 7.9 million gallons of spread contracts (simultaneous long and short positions) with an average notional value of $10.8 million and a net fair value of $(0.04) million. To hedge its internal fuel usage and other related activities for fiscal 2017, the Partnership, as of September 30, 2016, had 5.7 million gallons of swap contracts with a notional value of $7.7 million and a fair value of $1.1 million that settle in future months.
F-15
Table of Contents
As of September 30, 2015, to hedge a substantial majority of the purchase price associated with heating oil gallons anticipated to be sold to its price-protected customers, the Partnership held the following derivative instruments that settle in future months to match anticipated sales: 6.8 million gallons of swap contracts with a notional value of $12.7 million and a fair value of $(1.9) million, 7.2 million gallons of call options with a notional value of $17.1 million and a fair value of $0.1 million, 5.5 million gallons of put options with a notional value of $6.5 million and a fair value of $0.2 million, and 94.6 million net gallons of synthetic call options with an average notional value of $183.9 million and a fair value of $(12.0) million. To hedge the inter-month differentials for its price-protected customers, its physical inventory on hand and inventory in transit, the Partnership, as of September 30, 2015, had 1.8 million gallons of purchased swap contracts with a notional value of $3.4 million and a fair value of $(0.5) million, 8.9 million gallons of purchased future contracts with a notional value of $17.2 million and a fair value of $(2.0) million, and 32.0 million gallons of sold future contracts with a notional value of $54.1 million and a fair value of $2.9 million that settle in future months. In addition to the previously described hedging instruments, to lock-in the differential between high sulfur home heating oil and ultra low sulfur diesel, the Partnership as of September 30, 2015, had 12.3 million gallons of spread contracts (simultaneous long and short positions) with an average notional value of $18.3 million and a net fair value of $(0.5) million. To hedge its internal fuel usage and other related activities for fiscal 2016, the Partnership, as of September 30, 2015, had 6.0 million gallons of swap contracts with a notional value of $11.1 million and a fair value of $(1.9) million that settle in future months.
The Partnership’s derivative instruments are with the following counterparties: Bank of America, N.A., Bank of Montreal, Cargill, Inc., Citibank, N.A., JPMorgan Chase Bank, N.A., Key Bank, N.A., Munich Re Trading LLC, Regions Financial Corporation, Societe Generale, and Wells Fargo Bank, N.A. The Partnership assesses counterparty credit risk and considers it to be low. We maintain master netting arrangements that allow for the non-conditional offsetting of amounts receivable and payable with counterparties to help manage our risks and record derivative positions on a net basis. The Partnership generally does not receive cash collateral from its counterparties and does not restrict the use of cash collateral it maintains at counterparties. At September 30, 2016, the aggregate cash posted as collateral in the normal course of business at counterparties was $2.9 million. Positions with counterparties who are also parties to our credit agreement are collateralized under that facility. As of September 30, 2016, $0.3 million of hedge positions and payable amounts were secured under the credit facility.
FASB ASC 815-10-05 Derivatives and Hedging, established accounting and reporting standards requiring that derivative instruments be recorded at fair value and included in the consolidated balance sheet as assets or liabilities, along with qualitative disclosures regarding the derivative activity. To the extent derivative instruments designated as cash flow hedges are effective and the standard’s documentation requirements have been met, changes in fair value are recognized in other comprehensive income until the underlying hedged item is recognized in earnings. The Partnership has elected not to designate its derivative instruments as hedging instruments under this standard and the change in fair value of the derivative instruments is recognized in our statement of operations in the line item (Increase) decrease in the fair value of derivative instruments. Depending on the risk being hedged, realized gains and losses are recorded in cost of product, cost of installations and services, or delivery and branch expenses.
FASB ASC 820-10 Fair Value Measurements and Disclosures, established a three-tier fair value hierarchy, which classified the inputs used in measuring fair value. These tiers include: Level 1, defined as observable inputs such as quoted prices for identical instruments in active markets; Level 2, defined as inputs other than quoted prices in active markets that are either directly or indirectly observable; and Level 3, defined as unobservable inputs in which little or no market data exists, therefore requiring an entity to develop its own assumptions. The Partnership’s Level 1 derivative assets and liabilities represent the fair value of commodity contracts used in its hedging activities that are identical and traded in active markets. The Partnership’s Level 2 derivative assets and liabilities represent the fair value of commodity contracts used in its hedging activities that are valued using either directly or indirectly observable inputs, whose nature, risk and class are similar. No significant transfers of assets or liabilities have been made into and out of the Level 1 or Level 2 tiers. All derivative instruments were non-trading positions and were either a Level 1 or Level 2 instrument. The Partnership had no Level 3 derivative instruments. The fair market value of our Level 1 and Level 2 derivative assets and liabilities are calculated by our counter-parties and are independently validated by the Partnership. The Partnership’s calculations are, for Level 1 derivative assets and liabilities, based on the published New York Mercantile Exchange (“NYMEX”) market prices for the commodity contracts open at the end of the period. For Level 2 derivative assets and liabilities the calculations performed by the Partnership are based on a combination of the NYMEX published market prices and other inputs, including such factors as present value, volatility and duration.
F-16
Table of Contents
The Partnership had no assets or liabilities that are measured at fair value on a nonrecurring basis subsequent to their initial recognition. The Partnership’s financial assets and liabilities measured at fair value on a recurring basis are listed on the following table.
| (In thousands) | Fair Value Measurements at Reporting Date Using: | |||||||||||||
| Derivatives Not Designated as Hedging Instruments |
Quoted Prices in Active Markets for Identical Assets |
Significant Other Observable Inputs |
||||||||||||
| Under FASB ASC 815-10 |
Balance Sheet Location |
Total | Level 1 | Level 2 | ||||||||||
| Asset Derivatives at September 30, 2016 |
||||||||||||||
| Commodity contracts |
Fair asset and fair liability value of derivative instruments |
$ | 11,692 | $ | — | $ | 11,692 | |||||||
| Commodity contracts |
Long-term derivative assets included in the other long-term liabilities balance |
1,369 | 481 | 888 | ||||||||||
|
|
|
|
|
|
|
|||||||||
| Commodity contract assets at September 30, 2016 |
$ | 13,061 | $ | 481 | $ | 12,580 | ||||||||
|
|
|
|
|
|
|
|||||||||
| Liability Derivatives at September 30, 2016 |
||||||||||||||
| Commodity contracts |
Fair liability and fair asset value of derivative instruments |
$ | (9,990 | ) | $ | (1,603 | ) | $ | (8,387 | ) | ||||
| Commodity contracts |
Cash collateral |
— | — | — | ||||||||||
| Commodity contracts |
Long-term derivative liabilities included in the other long-term liabilities balance |
(565 | ) | (484 | ) | (81 | ) | |||||||
|
|
|
|
|
|
|
|||||||||
| Commodity contract liabilities at September 30, 2016 |
$ | (10,555 | ) | $ | (2,087 | ) | $ | (8,468 | ) | |||||
|
|
|
|
|
|
|
|||||||||
| Asset Derivatives at September 30, 2015 |
||||||||||||||
| Commodity contracts |
Fair asset and fair liability value of derivative instruments |
$ | 26,628 | $ | 930 | $ | 25,698 | |||||||
| Commodity contracts |
Long-term derivative assets included in the other long-term liabilities balance |
4,975 | 2,017 | 2,958 | ||||||||||
|
|
|
|
|
|
|
|||||||||
| Commodity contract assets at September 30, 2015 |
$ | 31,603 | $ | 2,947 | $ | 28,656 | ||||||||
|
|
|
|
|
|
|
|||||||||
| Liability Derivatives at September 30, 2015 |
||||||||||||||
| Commodity contracts |
Fair liability and fair asset value of derivative instruments |
$ | (41,270 | ) | $ | — | $ | (41,270 | ) | |||||
| Commodity contracts |
Cash collateral |
2,758 | 2,758 | — | ||||||||||
| Commodity contracts |
Long-term derivative liabilities included in the other long-term liabilities balance |
(5,977 | ) | (2,038 | ) | (3,939 | ) | |||||||
|
|
|
|
|
|
|
|||||||||
| Commodity contract liabilities at September 30, 2015 |
$ | (44,489 | ) | $ | 720 | $ | (45,209 | ) | ||||||
|
|
|
|
|
|
|
|||||||||
The Partnership’s derivative assets (liabilities) offset by counterparty and subject to an enforceable master netting arrangement are listed on the following table.
F-17
Table of Contents
| (In thousands) | Gross Amounts Not Offset in the Statement of Financial Position |
|||||||||||||||||||||||
| Offsetting of Financial Assets (Liabilities) and Derivative Assets (Liabilities) |
Gross Assets Recognized |
Gross Liabilities Offset in the Statement of Financial Position |
Net Assets (Liabilities) Presented in the Statement of Financial Position |
Financial Instruments |
Cash Collateral Received |
Net Amount |
||||||||||||||||||
| Fair asset value of derivative instruments |
$ | 7,716 | $ | (3,729 | ) | $ | 3,987 | $ | — | $ | — | $ | 3,987 | |||||||||||
| Long-term derivative assets included in other long-term assets, net |
888 | (81 | ) | 807 | — | — | 807 | |||||||||||||||||
| Fair liability value of derivative instruments |
3,976 | (6,261 | ) | (2,285 | ) | — | — | (2,285 | ) | |||||||||||||||
| Long-term derivative liabilities included in other long-term liabilities, net |
481 | (484 | ) | (3 | ) | — | — | (3 | ) | |||||||||||||||
|
|
|
|
|
|
|
|
|
|
|
|
|
|||||||||||||
| Total at September 30, 2016 |
$ | 13,061 | $ | (10,555 | ) | $ | 2,506 | $ | — | $ | — | $ | 2,506 | |||||||||||
|
|
|
|
|
|
|
|
|
|
|
|
|
|||||||||||||
| Fair asset value of derivative instruments |
$ | 935 | $ | — | $ | 935 | $ | — | $ | — | $ | 935 | ||||||||||||
| Fair liability value of derivative instruments |
25,693 | (38,512 | ) | (12,819 | ) | — | — | (12,819 | ) | |||||||||||||||
| Long-term derivative liabilities included in other long-term liabilities, net |
4,975 | (5,977 | ) | (1,002 | ) | (1,002 | ) | |||||||||||||||||
|
|
|
|
|
|
|
|
|
|
|
|
|
|||||||||||||
| Total at September 30, 2015 |
$ | 31,603 | $ | (44,489 | ) | $ | (12,886 | ) | $ | — | $ | — | $ | (12,886 | ) | |||||||||
|
|
|
|
|
|
|
|
|
|
|
|
|
|||||||||||||
| (In thousands) | ||||||||||||||
| The Effect of Derivative Instruments on the Statement of Operations |
||||||||||||||
| Amount of (Gain) or Loss Recognized | ||||||||||||||
| Years Ended September 30, | ||||||||||||||
| Derivatives Not Designated as Hedging Instruments Under |
Location of (Gain) or Loss Recognized in |
2016 | 2015 | 2014 | ||||||||||
| Commodity contracts |
Cost of product (a) |
$ | 16,977 | $ | 13,368 | $ | 11,781 | |||||||
| Commodity contracts |
Cost of installations and service (a) |
$ | 949 | $ | 1,831 | $ | (202 | ) | ||||||
| Commodity contracts |
Delivery and branch expenses (a) |
$ | 2,405 | $ | 2,098 | $ | (104 | ) | ||||||
| Commodity contracts |
(Increase) / decrease in the fair value of derivative instruments (b) |
$ | (18,217 | ) | $ | 4,187 | $ | 6,566 | ||||||
| (a) | Represents realized closed positions and includes the cost of options as they expire. |
| (b) | Represents the change in value of unrealized open positions and expired options. |
6) Inventories
The Partnership’s product inventories are stated at the lower of cost or market computed on the weighted average cost method. All other inventories, representing parts and equipment are stated at the lower of cost or market using the FIFO method. The components of inventory were as follows (in thousands):
| September 30, | ||||||||
| 2016 | 2015 | |||||||
| Product |
$ | 25,419 | $ | 35,599 | ||||
| Parts and equipment |
20,475 | 20,072 | ||||||
|
|
|
|
|
|||||
| Total inventory |
$ | 45,894 | $ | 55,671 | ||||
|
|
|
|
|
|||||
Product inventories were comprised of 18.4 million gallons and 21.7 million gallons on September 30, 2016 and September 30, 2015, respectively. The Partnership has market price based product supply contracts for approximately 283.5 million gallons of home heating oil and propane, and 37.3 million gallons of diesel and gasoline, which it expects to fully utilize to meet its requirements over the next twelve months.
F-18
Table of Contents
During fiscal 2016, Global Companies LLC and NIC Holding Corp. provided approximately 13% and 8%, respectively, of our petroleum product purchases. No other single supplier provided more than 8% of our product supply during fiscal 2016. During fiscal 2015, Global Companies LLC and NIC Holding Corp. provided approximately 12% and 10%, respectively, of our petroleum product purchases.
7) Property and Equipment
The components of property and equipment were as follows (in thousands):
| September 30, | ||||||||
| 2016 | 2015 | |||||||
| Land and land improvements |
$ | 17,645 | $ | 17,054 | ||||
| Buildings and leasehold improvements |
32,203 | 31,288 | ||||||
| Fleet and other equipment |
57,601 | 56,845 | ||||||
| Tanks and equipment |
34,035 | 29,823 | ||||||
| Furniture, fixtures and office equipment |
42,595 | 44,621 | ||||||
|
|
|
|
|
|||||
| Total |
184,079 | 179,631 | ||||||
| Less accumulated depreciation |
113,669 | 111,508 | ||||||
|
|
|
|
|
|||||
| Property and equipment, net |
$ | 70,410 | $ | 68,123 | ||||
|
|
|
|
|
|||||
Depreciation and amortization expense was $11.1 million, $11.4 million, and $10.1 million, for the fiscal years ended September 30, 2016, 2015, and 2014, respectively.
8) Business Combinations
During fiscal 2016, the Partnership acquired a heating oil dealer, a motor fuel dealer, and two propane dealers for purchase prices aggregating approximately $9.8 million. The aggregate purchase price was allocated $5.7 million to intangible assets, $1.7 million to goodwill, $2.5 million to fixed assets, and reduced by $0.1 million for working capital credits. The acquired companies’ operating results are included in the Partnership’s consolidated financial statements starting on their respective acquisition date, and are not material to the Partnership’s financial condition, results of operations, or cash flows.
During fiscal 2015, the Partnership acquired two heating oil and propane dealers (with one dealer also having motor fuel accounts) for an aggregate purchase price of approximately $21.1 million. The final gross allocation of the purchase price of both heating oil and propane dealers was $20.7 million to intangible assets, $2.5 million to fixed assets and reduced by $2.1 million for working capital credits. Each acquired company’s operating results are included in the Partnership’s consolidated financial statements starting on its acquisition date. Customer lists, other intangibles and trade names are amortized on a straight-line basis over seven to twenty years.
During fiscal 2014, including the acquisition of Griffith Energy Services, Inc. (“Griffith”) discussed in more detail below, the Partnership acquired three heating oil dealers for an aggregate purchase price of approximately $98.5 million. The gross purchase price of all three heating oil dealers were allocated $53.7 million to intangible assets, $17.6 million to fixed assets and $27.2 million to working capital.
On March 4, 2014 (the “Acquisition Date”), the Partnership completed the acquisition of Griffith of Columbia, Maryland, from Central Hudson Enterprises Corporation. The Partnership purchased 100% of the stock of Griffith for $97.7 million, consisting of $69.9 million paid for the long term assets and $27.8 million paid for working capital (net of $4.2 million of cash acquired). There was no long-term debt assumed in the acquisition.
F-19
Table of Contents
The following table summarizes the final fair values and purchase price allocation at the acquisition date, of the assets acquired and liabilities assumed related to the Griffith acquisition as of the Acquisition Date.
| (in thousands) |
As of Acquisition Date | |||
| Trade accounts receivable |
$ | 49,010 | ||
| Inventories |
5,143 | |||
| Other current assets |
2,984 | |||
| Property and equipment |
17,263 | |||
| Customer lists, trade names and other intangibles |
44,400 | |||
| Other long term assets |
1,778 | |||
| Current liabilities |
(31,096 | ) | ||
|
|
|
|||
| Total net identifiable assets acquired |
$ | 89,482 | ||
|
|
|
|||
| Total consideration |
$ | 97,650 | ||
| Less: Total net identifiable assets acquired |
89,482 | |||
|
|
|
|||
| Goodwill |
$ | 8,168 | ||
|
|
|
|||
9) Goodwill and Other Intangible Assets
Goodwill
The Partnership performs a qualitative, and when necessary quantitative, impairment test on its goodwill annually on August 31st. This qualitative assessment includes reviewing factors such as macroeconomic conditions, industry and market considerations, cost factors, overall financial performance and other relevant entity-specific events. Under FASB ASC 350-10-05 Intangibles-Goodwill and Other, goodwill impairment if any, needs to be determined if the net book value of a reporting unit exceeds its estimated fair value. If goodwill of a reporting unit is determined to be impaired, the amount of impairment is measured based on the excess of the net book value of the goodwill over the implied fair value of the goodwill.
The Partnership performed its annual goodwill impairment valuation in each of the periods ending August 31, 2016, 2015, and 2014, and it was determined based on each year’s analysis that there was no goodwill impairment.
A summary of changes in the Partnership’s goodwill during the fiscal years ended September 30, 2016 and 2015 are as follows (in thousands):
| Balance as of September 30, 2014 |
$ | 209,331 | ||
| Fiscal year 2015 business combinations |
1,714 | |||
|
|
|
|||
| Balance as of September 30, 2015 |
211,045 | |||
| Fiscal year 2016 business combinations |
1,715 | |||
|
|
|
|||
| Balance as of September 30, 2016 |
$ | 212,760 | ||
|
|
|
F-20
Table of Contents
Intangibles, net
Intangible assets subject to amortization consist of the following (in thousands):
| September 30, | ||||||||||||||||||||||||
| 2016 | 2015 | |||||||||||||||||||||||
| Gross | Gross | |||||||||||||||||||||||
| Carrying | Accum. | Carrying | Accum. | |||||||||||||||||||||
| Amount | Amortization | Net | Amount | Amortization | Net | |||||||||||||||||||
| Customer lists |
$ | 327,388 | $ | 250,427 | $ | 76,961 | $ | 322,027 | $ | 236,438 | $ | 85,589 | ||||||||||||
| Trade names and other intangibles |
27,134 | 6,439 | 20,695 | 26,774 | 5,046 | 21,728 | ||||||||||||||||||
|
|
|
|
|
|
|
|
|
|
|
|
|
|||||||||||||
| Total |
$ | 354,522 | $ | 256,866 | $ | 97,656 | $ | 348,801 | $ | 241,484 | $ | 107,317 | ||||||||||||
|
|
|
|
|
|
|
|
|
|
|
|
|
|||||||||||||
Amortization expense for intangible assets was $15.4 million, $13.5 million, and $11.5 million, for the fiscal years ended September 30, 2016, 2015, and 2014, respectively. Total estimated annual amortization expense related to intangible assets subject to amortization, for the year ended September 30, 2017 and the four succeeding fiscal years ended September 30, is as follows (in thousands):
| Amount | ||||
| 2017 |
$ | 15,100 | ||
| 2018 |
$ | 14,261 | ||
| 2019 |
$ | 14,027 | ||
| 2020 |
$ | 12,418 | ||
| 2021 |
$ | 9,923 | ||
10) Accrued Expenses and Other Current Liabilities
The components of accrued expenses and other current liabilities were as follows (in thousands):
| September 30, | ||||||||
| 2016 | 2015 | |||||||
| Accrued wages and benefits |
$ | 22,237 | $ | 27,930 | ||||
| Accrued insurance and environmental costs |
70,037 | 67,101 | ||||||
| Other accrued expenses and other current liabilities |
11,581 | 12,714 | ||||||
|
|
|
|
|
|||||
| Total accrued expenses and other current liabilities |
$ | 103,855 | $ | 107,745 | ||||
|
|
|
|
|
|||||
11) Long-Term Debt and Bank Facility Borrowings
The Partnership’s debt is as follows
| September 30, | ||||||||||||||||
| (in thousands): | 2016 | 2015 | ||||||||||||||
| Carrying | Carrying | |||||||||||||||
| Amount | Fair Value | Amount | Fair Value | |||||||||||||
| Revolving Credit Facility Borrowings |
$ | — | $ | — | $ | — | $ | — | ||||||||
| Senior Secured Term Loan |
92,500 | 92,500 | 100,000 | 100,000 | ||||||||||||
|
|
|
|
|
|
|
|
|
|||||||||
| Total debt |
$ | 92,500 | $ | 92,500 | $ | 100,000 | $ | 100,000 | ||||||||
|
|
|
|
|
|
|
|
|
|||||||||
| Total short-term portion of debt |
$ | 16,200 | $ | 16,200 | $ | 10,000 | $ | 10,000 | ||||||||
|
|
|
|
|
|
|
|
|
|||||||||
| Total long-term portion of debt |
$ | 76,300 | $ | 76,300 | $ | 90,000 | $ | 90,000 | ||||||||
|
|
|
|
|
|
|
|
|
|||||||||
F-21
Table of Contents
The face amount of the Partnership’s variable rate long-term debt approximates fair value.
On July 30, 2015, the Partnership entered into a third amended and restated asset based credit agreement with a bank syndicate comprised of thirteen participants, which enables the Partnership to borrow up to $300 million ($450 million during the heating season of December through April of each year) on a revolving credit facility for working capital purposes (subject to certain borrowing base limitations and coverage ratios), provides for a $100 million five-year senior secured term loan (“Term Loan”), allows for the issuance of up to $100 million in letters of credit, and has a maturity date of July 30, 2020.
The Partnership can increase the revolving credit facility size by $100 million without the consent of the bank group. However, the bank group is not obligated to fund the $100 million increase. If the bank group elects not to fund the increase, the Partnership can add additional lenders to the group, with the consent of the Agent, which shall not be unreasonably withheld. Obligations under the third amended and restated credit facility are guaranteed by the Partnership and its subsidiaries and are secured by liens on substantially all of the Partnership’s assets including accounts receivable, inventory, general intangibles, real property, fixtures and equipment.
All amounts outstanding under the third amended and restated revolving credit facility become due and payable on the facility termination date of July 30, 2020. The Term Loan is repayable in quarterly payments of $2.5 million, plus an annual payment equal to 25% of the annual Excess Cash Flow as defined in the agreement (an amount not to exceed $15 million annually), less certain voluntary prepayments made during the year, with final payment at maturity. As of September 30, 2016 the Partnership expects to make approximately $6.2 million of additional term loan repayments due to Excess Cash Flow for the fiscal year ended September 30, 2016. The amount is included in the caption current maturities of long-term debt on our consolidated balance sheet.
The interest rate on the third amended and restated revolving credit facility and the term loan is based on a margin over LIBOR or a base rate. At September 30, 2016, the effective interest rate on the term loan was approximately 3.62%.
The Commitment Fee on the unused portion of the revolving credit facility is 0.30% from December through April, and 0.20% from May through November.
The third amended and restated credit agreement requires the Partnership to meet certain financial covenants, including a fixed charge coverage ratio (as defined in the credit agreement) of not less than 1.1 as long as the Term Loan is outstanding or revolving credit facility availability is less than 12.5% of the facility size. In addition, as long as the Term Loan is outstanding, a senior secured leverage ratio at any time cannot be more than 3.0 as calculated during the quarters ending June or September, and at any time no more than 4.5 as calculated during the quarters ending December or March.
Certain restrictions are also imposed by the agreement, including restrictions on the Partnership’s ability to incur additional indebtedness, to pay distributions to unitholders, to pay certain inter-company dividends or distributions, make investments, grant liens, sell assets, make acquisitions and engage in certain other activities.
At September 30, 2016, $92.5 million of the term loan was outstanding, no amount was outstanding under the revolving credit facility, $0.3 million of hedge positions were secured under the credit agreement, and $50.6 million of letters of credit were issued and outstanding. At September 30, 2015, $100 million of the term loan was outstanding, no amount was outstanding under the revolving credit facility, $15.3 million of hedge positions were secured, and $54.8 million of letters of credit were issued and outstanding.
At September 30, 2016, availability was $163.4 million, the Partnership was in compliance with the fixed charge coverage ratio and the senior secured leverage ratio, and the restricted net assets totaled approximately $291 million. Restricted net assets are assets in the Partnership’s subsidiaries the distribution or transfer of which to Star Gas Partners, L.P. are subject to limitations under its credit agreement. At September 30, 2015, availability was $176 million, the Partnership was in compliance with the fixed charge coverage ratio and the senior secured leverage ratio, and the restricted net assets totaled approximately $280 million.
F-22
Table of Contents
As of September 30, 2016, the maturities (including working capital borrowings and expected repayments due to Excess Cash Flow) during fiscal years ending September 30, are set forth in the following table (in thousands):
| 2017 |
$ | 16,200 | ||
| 2018 |
$ | 10,000 | ||
| 2019 |
$ | 10,000 | ||
| 2020 |
$ | 56,300 | ||
| Thereafter |
$ | — |
12) Employee Benefit Plans
Defined Contribution Plans
The Partnership has several 401(k) and other defined contribution plans that cover eligible non-union and union employees, and makes employer contributions to these plans, subject to IRS limitations. These plans provide for each participant to contribute from 0% to 60% of compensation, subject to IRS limitations. The Partnership’s aggregate contributions to the 401(k) plans during fiscal 2016, 2015, and 2014, were $6.0 million, $5.7 million, and $5.2 million, respectively. The Partnership’s aggregate contribution to the other defined contribution plans for fiscal years 2016, 2015, and 2014, were $0.7 million, $0.6 million and $0.5 million, respectively.
Management Incentive Compensation Plan
The Partnership has a Management Incentive Compensation Plan. The long-term compensation structure is intended to align the employee’s performance with the long-term performance of our unitholders. Under the Plan, certain named employees who participate shall be entitled to receive a pro rata share of an amount in cash equal to:
| • | 50% of the distributions (“Incentive Distributions”) of Available Cash in excess of the minimum quarterly distribution of $0.0675 per unit otherwise distributable to Kestrel Heat pursuant to the Partnership Agreement on account of its general partner units; and |
| • | 50% of the cash proceeds (the “Gains Interest”) which Kestrel Heat shall receive from the sale of its general partner units (as defined in the Partnership Agreement), less expenses and applicable taxes. |
The pro rata share payable to each participant under the Plan is based on the number of participation points as described under “Fiscal 2015 Compensation Decisions—Management Incentive Compensation Plan.” The amount paid in Incentive Distributions is governed by the Partnership Agreement and the calculation of Available Cash.
To fund the benefits under the Plan, Kestrel Heat has agreed to forego receipt of the amount of Incentive Distributions that are payable to plan participants. For accounting purposes, amounts payable to management under this Plan will be treated as compensation and will reduce net income. Kestrel Heat has also agreed to contribute to the Partnership, as a contribution to capital, an amount equal to the Gains Interest payable to participants in the Plan by the Partnership. The Partnership is not required to reimburse Kestrel Heat for amounts payable pursuant to the Plan.
The Plan is administered by the Partnership’s Chief Financial Officer under the direction of the Board or by such other officer as the Board may from time to time direct. In general, no payments will be made under the Plan if the Partnership is not distributing cash under the Incentive Distributions described above.
Effective as of July 19, 2012, the Board of Directors adopted certain amendments (the “Plan Amendments”) to the Plan. Under the Plan Amendments, the number and identity of the Plan participants and their participation interests in the Plan have been frozen at the current levels. In addition, under the Plan Amendments, the plan benefits (to the extent vested) may be transferred upon the death of a participant to his or her heirs. A participant’s vested percentage of his or her plan benefits will be 100% during the time a participant is an employee or consultant of the Partnership. Following the termination of such positions, a participant’s vested percentage shall be equal to 20% for each full or partial year of employment or consultation with the Partnership starting with the fiscal year ended September 30, 2012 (33 1/3% in the case of the Partnership’s chief executive officer at that time).
F-23
Table of Contents
The Partnership distributed to management and the general partner Incentive Distributions of approximately $795,000 during fiscal 2016, $605,000 during fiscal 2015, and $447,000 during fiscal 2014. Included in these amounts for fiscal 2016, 2015, and 2014, were distributions under the management incentive compensation plan of $397,000, $302,000, and $223,000, respectively, of which named executive officers received approximately $177,034 during fiscal 2016, $135,000 during fiscal 2015, and $100,000 during fiscal 2014. With regard to the Gains Interest, Kestrel Heat has not given any indication that it will sell its general partner units within the next twelve months. Thus the Plan’s value attributable to the Gains Interest currently cannot be determined.
Multiemployer Pension Plans
At September 30, 2016, approximately 41% of our employees were covered by collective bargaining agreements and approximately 17% of our employees are in collective bargaining agreements that are up for renewal within the next fiscal year. We contribute to various multiemployer union administered pension plans under the terms of collective bargaining agreements that provide for such plans for covered union-represented employees. The risks of participating in these multiemployer plans are different from single-employer plans in that assets contributed are pooled and may be used to provide benefits to employees of other participating employers. If a participating employer stops contributing to the plan, the remaining participating employers may be required to bear the unfunded obligations of the plan. If we choose to stop participating in a multiemployer plan, we may be required to pay a withdrawal liability in part based on the underfunded status of the plan.
The following table outlines our participation and contributions to multiemployer pension plans for the periods ended September 30, 2016, 2015 and 2014. The EIN/Pension Plan Number column provides the Employer Identification Number (“EIN”) and the three-digit plan number. The most recent Pension Protection Act Zone Status for 2016 and 2015 relates to the plans’ two most recent fiscal year-ends, based on information received from the plans as reported on their Form 5500 Schedule MB. Among other factors, plans in the red zone are generally less than 65 percent funded, plans in the yellow zone are less than 80 percent funded, and plans in the green zone are at least 80 percent funded. The FIP/RP Status Pending/Implemented column indicates plans for which a financial improvement plan (“FIP”) or a rehabilitation plan (“RP”) is either pending or has been implemented. Certain plans have been aggregated in the All Other Multiemployer Pension Plans line of the following table, as our participation in each of these individual plans is not significant.
For the Westchester Teamsters Pension Fund and Local 553 Pension Fund, we provided more than 5 percent of the total plan contributions from all employers for 2016, and for the Westchester Teamsters Pension Fund, Local 553 Pension Fund and Local 463 Pension Fund, we provided more than 5 percent of the total plan contributions from all employers for 2015 and 2014, as disclosed in the respective plan’s Form 5500. The collective bargaining agreements of these plans require contributions based on the hours worked and there are no minimum contributions required.
F-24
Table of Contents
| Pension Protection Act Zone Status |
FIP / RP Status |
Partnership Contributions (in thousands) |
||||||||||||||||||||||||||||||||||
| Pension Fund |
EIN / Pension Plan Number |
2016 | 2015 | Pending / Implemented |
2016 | 2015 | 2014 | Surcharge Imposed |
Expiration Date of Collective- Bargaining Agreements |
|||||||||||||||||||||||||||
| New England Teamsters and Trucking Industry Pension Fund |
|
04-6372430 / 001 |
|
Red | Red | |
Yes / Implemented |
|
$ | 2,507 | $ | 3,183 | $ | 2,868 | No | |
03/31/17 to 09/30/18 |
| ||||||||||||||||||
| Westchester Teamsters Pension Fund |
|
13-6123973 / 001 |
|
Green | Green | N/A | 865 | 877 | 855 | No | |
01/31/19 to 12/31/19 |
| |||||||||||||||||||||||
| Local 553 Pension Fund |
|
13-6637826 / 001 |
|
Green | Green | N/A | 2,645 | 2,838 | 2,649 | No | |
12/15/16 to 01/15/17 |
| |||||||||||||||||||||||
| Local 463 Pension Fund |
|
11-1800729 / 001 |
|
Green | Green | N/A | 148 | 171 | 156 | No | |
02/28/17 to 06/30/19 |
| |||||||||||||||||||||||
| All Other Multiemployer Pension Plans |
2,218 | 2,149 | 1,846 | |||||||||||||||||||||||||||||||||
|
|
|
|
|
|
|
|||||||||||||||||||||||||||||||
| Total Contributions | $ | 8,383 | $ | 9,218 | $ | 8,374 | ||||||||||||||||||||||||||||||
|
|
|
|
|
|
|
|||||||||||||||||||||||||||||||
Agreement with the New England Teamsters and Trucking Industry Pension Fund
In September 2015, the Teamsters ratified an agreement among certain subsidiaries of the Partnership and the New England Teamsters and Trucking Industry Pension Fund (“the NETTI Fund”), a multiemployer pension plan in which such subsidiaries participate, providing for the Partnership’s participating subsidiaries to withdraw from the NETTI Fund’s original employer pool and enter the NETTI Fund’s new employer pool. The withdrawal from the original employer pool triggered an undiscounted withdrawal obligation of $48.0 million that is to be paid in equal monthly installments over 30 years, or $1.6 million per year. The annual after tax cash impact of entering into this agreement is a reduction of approximately $0.9 million.
We recorded in the fourth quarter of fiscal 2015, a $17.8 million charge in order to establish a withdrawal liability on our consolidated balance sheet, which represents the present value of the $48.0 million future payment obligation at a discount rate of 8.22%. In addition we recorded a non-cash deferred tax benefit of approximately $7.0 million. The net result of these two non-cash items reduced our net income for fiscal 2015 by $10.8 million.
The NETTI Fund includes over two hundred of our current employees and has been classified as carrying “red zone” status, meaning that the value of NETTI Fund’s assets are less than 65% of the actuarial value of the NETTI Fund’s benefit obligations.
As of September 30, 2016, we had $0.2 million and $17.5 million balances included in the captions accrued expenses and other current liabilities and other long-term liabilities, respectively, on our consolidated balance sheet representing the remaining balance of the NETTI withdrawal liability. Based on the borrowing rates currently available to the Partnership for long-term financing of a similar maturity, the fair value of the NETTI withdrawal liability as of September 30, 2016 was $20.7 million. We utilized Level 2 inputs in the fair value hierarchy of valuation techniques to determine the fair value of this liability.
Our status in the newly-established pool of the NETTI Fund is accounted for as participation in a new multiemployer pension plan, and therefore we recognize expense based on the contractually-required contribution for each period, and we recognize a liability for any contributions due and unpaid at the end of a reporting period.
Defined Benefit Plans
The Partnership accounts for its two frozen defined benefit pension plans (“the Plan”) in accordance with FASB ASC 715-10-05 Compensation-Retirement Benefits. The Partnership has no post-retirement benefit plans.
Effective September 30, 2016, the Partnership adopted the Society of Actuaries 2016 Mortality Tables Report and Mortality Improvement Scale, which updated the mortality assumptions that private defined benefit retirement plans in the United States use in the actuarial valuations that determine a plan sponsor’s pension obligations. The updated mortality data reflects lower mortality improvement than assumed in the Society of Actuaries 2015 Mortality Table Report and Improvement Scale, and affected plans generally expect the value of the actuarial obligations to decrease, depending on the specific demographic characteristics of the plan participants and the types of benefits.
F-25
Table of Contents
The following table provides the net periodic benefit cost for the period, a reconciliation of the changes in the Plan assets, projected benefit obligations, and the amounts recognized in other comprehensive income and accumulated other comprehensive income at the dates indicated using a measurement date of September 30 (in thousands):
| Gross Pension | ||||||||||||||||||||||||
| Net Periodic | Fair | Related | ||||||||||||||||||||||
| Pension | Value of | Accumulated | ||||||||||||||||||||||
| Cost in | Pension | Projected | Other | Other | ||||||||||||||||||||
| Income | Plan | Benefit | Comprehensive | Comprehensive | ||||||||||||||||||||
| Debit / (Credit) |
Statement | Cash | Assets | Obligation | (Income) / Loss | Income | ||||||||||||||||||
| Fiscal Year 2014 |
||||||||||||||||||||||||
| Beginning balance |
$ | 60,028 | $ | (64,305 | ) | $ | 25,528 | |||||||||||||||||
|
|
|
|
|
|
|
|||||||||||||||||||
| Interest cost |
2,761 | (2,761 | ) | |||||||||||||||||||||
| Actual return on plan assets |
(7,614 | ) | 7,614 | |||||||||||||||||||||
| Employer contributions |
(2,014 | ) | 2,014 | |||||||||||||||||||||
| Benefit payments |
(4,277 | ) | 4,277 | |||||||||||||||||||||
| Investment and other expenses |
(262 | ) | 262 | |||||||||||||||||||||
| Difference between actual and expected return on plan assets |
4,472 | (4,472 | ) | |||||||||||||||||||||
| Anticipated expenses |
300 | (300 | ) | |||||||||||||||||||||
| Actuarial gain |
(7,655 | ) | 7,655 | |||||||||||||||||||||
| Amortization of unrecognized net actuarial loss |
2,113 | (2,113 | ) | |||||||||||||||||||||
|
|
|
|
|
|||||||||||||||||||||
| Annual cost/change |
$ | 1,770 | $ | (2,014 | ) | 5,351 | (6,177 | ) | $ | 1,070 | 1,070 | |||||||||||||
|
|
|
|
|
|
|
|
|
|
|
|
|
|||||||||||||
| Ending balance |
$ | 65,379 | $ | (70,482 | ) | $ | 26,598 | |||||||||||||||||
|
|
|
|
|
|
|
|||||||||||||||||||
| Funded status at the end of the year |
$ | (5,103 | ) | |||||||||||||||||||||
|
|
|
|||||||||||||||||||||||
| Fiscal Year 2015 |
||||||||||||||||||||||||
| Interest cost |
2,762 | (2,762 | ) | |||||||||||||||||||||
| Actual return on plan assets |
(679 | ) | 679 | |||||||||||||||||||||
| Employer contributions |
(1,743 | ) | 1,743 | |||||||||||||||||||||
| Benefit payments |
(4,013 | ) | 4,013 | |||||||||||||||||||||
| Investment and other expenses |
(577 | ) | 577 | |||||||||||||||||||||
| Difference between actual and expected return on plan assets |
(2,259 | ) | 2,259 | |||||||||||||||||||||
| Anticipated expenses |
327 | (327 | ) | |||||||||||||||||||||
| Actuarial loss |
1,860 | (1,860 | ) | |||||||||||||||||||||
| Amortization of unrecognized net actuarial loss |
2,226 | (2,226 | ) | |||||||||||||||||||||
|
|
|
|
|
|||||||||||||||||||||
| Annual cost/change |
$ | 1,800 | $ | (1,743 | ) | (1,591 | ) | 3,361 | $ | (1,827 | ) | (1,827 | ) | |||||||||||
|
|
|
|
|
|
|
|
|
|
|
|
|
|||||||||||||
| Ending balance |
$ | 63,788 | $ | (67,121 | ) | $ | 24,771 | |||||||||||||||||
|
|
|
|
|
|
|
|||||||||||||||||||
| Funded status at the end of the year |
$ | (3,333 | ) | |||||||||||||||||||||
|
|
|
|||||||||||||||||||||||
| Fiscal Year 2016 |
||||||||||||||||||||||||
| Interest cost |
2,622 | (2,622 | ) | |||||||||||||||||||||
| Actual return on plan assets |
(8,595 | ) | 8,595 | |||||||||||||||||||||
| Employer contributions |
(17 | ) | 17 | |||||||||||||||||||||
| Benefit payments |
(4,124 | ) | 4,124 | |||||||||||||||||||||
| Investment and other expenses |
(362 | ) | 362 | |||||||||||||||||||||
| Difference between actual and expected return on plan assets |
5,579 | (5,579 | ) | |||||||||||||||||||||
| Anticipated expenses |
319 | (319 | ) | |||||||||||||||||||||
| Actuarial loss |
(5,103 | ) | 5,103 | |||||||||||||||||||||
| Amortization of unrecognized net actuarial loss |
2,591 | (2,591 | ) | |||||||||||||||||||||
|
|
|
|
|
|||||||||||||||||||||
| Annual cost/change |
$ | 2,154 | $ | (17 | ) | 4,488 | (3,558 | ) | $ | (3,067 | ) | (3,067 | ) | |||||||||||
|
|
|
|
|
|
|
|
|
|
|
|
|
|||||||||||||
| Ending balance |
$ | 68,276 | $ | (70,679 | ) | $ | 21,704 | |||||||||||||||||
|
|
|
|
|
|
|
|||||||||||||||||||
| Funded status at the end of the year |
$ | (2,403 | ) | |||||||||||||||||||||
|
|
|
|||||||||||||||||||||||
F-26
Table of Contents
At September 30, 2016 and 2015, the amounts included on the balance sheet in other long-term liabilities were $2.4 million and $3.3 million, respectively.
The $21.7 million net actuarial loss balance at September 30, 2016 for the two frozen defined benefit pension plans in accumulated other comprehensive income will be recognized and amortized into net periodic pension costs as an actuarial loss in future years. The estimated amount that will be amortized from accumulated other comprehensive income into net periodic pension cost over the next fiscal year is $2.1 million.
| September 30, | ||||||||||||
| Weighted-Average Assumptions Used in the Measurement of the Partnership’s Benefit Obligation | 2016 | 2015 | 2014 | |||||||||
| Discount rate at year end date |
3.30 | % | 4.05 | % | 4.05 | % | ||||||
| Expected return on plan assets for the year ended |
5.50 | % | 5.50 | % | 5.75 | % | ||||||
| Rate of compensation increase |
N/A | N/A | N/A | |||||||||
The expected return on plan assets is determined based on the expected long-term rate of return on plan assets and the market-related value of plan assets determined using fair value.
The Partnership’s expected long-term rate of return on plan assets is updated at least annually, taking into consideration our asset allocation, historical returns on the types of assets held, and the current economic environment. For fiscal year 2017, the Partnership’s assumption for return on plan assets will be 4.80% per annum.
The discount rate used to determine net periodic pension expense for fiscal year 2016, 2015, and 2014 was 3.30%, 4.05%, and 4.45%, respectively. The discount rate used by the Partnership in determining pension expense and pension obligations reflects the yield of high quality (AA or better rating by a recognized rating agency) corporate bonds whose cash flows are expected to match the timing and amounts of projected future benefit payments.
The Plan’s objectives are to have the ability to pay benefit and expense obligations when due, to maintain the funded ratio of the Plan, to maximize return within reasonable and prudent levels of risk in order to minimize contributions and charges to the profit and loss statement, and to control costs of administering the Plan and managing the investments of the Plan. The target asset allocation of the Plan (currently 80% domestic fixed income, 15% domestic equities and 5% international equities) is based on a long-term perspective, and as the Plan gets closer to being fully funded, the allocations have been adjusted to lower volatility from equity holdings.
The Partnership had no Level 2 or Level 3 pension plan assets during the three years ended September 30, 2016. The fair values and percentage of the Partnership’s pension plan assets by asset category are as follows (in thousands):
| September 30, | ||||||||||||||||
| 2016 | 2015 | |||||||||||||||
| Concentration | Concentration | |||||||||||||||
| Asset Category |
Level 1 | Percentage | Level 1 | Percentage | ||||||||||||
| Corporate and U.S. government bond fund (1) |
$ | 54,267 | 79 | % | $ | 51,477 | 81 | % | ||||||||
| U.S. large-cap equity (1) |
10,207 | 15 | % | 8,932 | 14 | % | ||||||||||
| International equity (1) |
3,118 | 5 | % | 2,832 | 4 | % | ||||||||||
| Cash |
684 | 1 | % | 547 | 1 | % | ||||||||||
|
|
|
|
|
|
|
|
|
|||||||||
| Total |
$ | 68,276 | 100 | % | $ | 63,788 | 100 | % | ||||||||
|
|
|
|
|
|
|
|
|
|||||||||
(1) Represent investments in Vanguard funds that seek to replicate the asset category description.
The Partnership is not obligated to make a minimum required contribution in fiscal year 2017, but expects to make a $2.0 million optional pension contribution.
Expected benefit payments over each of the next five years will total approximately $4.6 million per year. Expected benefit payments for the five years thereafter will aggregate approximately $20.0 million.
F-27
Table of Contents
13) Income Taxes
Income tax expense is comprised of the following for the indicated periods (in thousands):
| Years Ended September 30, | ||||||||||||
| 2016 | 2015 | 2014 | ||||||||||
| Current: |
||||||||||||
| Federal |
$ | 18,724 | $ | 28,793 | $ | 19,747 | ||||||
| State |
5,344 | 8,143 | 4,909 | |||||||||
| Deferred |
||||||||||||
| Federal |
7,485 | (3,719 | ) | 596 | ||||||||
| State |
2,185 | (382 | ) | 63 | ||||||||
|
|
|
|
|
|
|
|||||||
| $ | 33,738 | $ | 32,835 | $ | 25,315 | |||||||
|
|
|
|
|
|
|
|||||||
The provision for income taxes differs from income taxes computed at the Federal statutory rate as a result of the following (in thousands):
| Years Ended September 30, | ||||||||||||
| 2016 | 2015 | 2014 | ||||||||||
| Income from continuing operations before taxes |
$ | 78,672 | $ | 70,391 | $ | 61,399 | ||||||
|
|
|
|
|
|
|
|||||||
| Provision for income taxes: |
||||||||||||
| Tax at Federal statutory rate |
$ | 27,535 | $ | 24,637 | $ | 21,490 | ||||||
| Impact of Partnership loss not subject to federal income taxes |
477 | 3,228 | 628 | |||||||||
| State taxes net of federal benefit |
5,672 | 4,922 | 3,310 | |||||||||
| Permanent differences |
80 | 78 | 57 | |||||||||
| Deferred tax benefit |
— | (3,179 | ) | — | ||||||||
| Change in valuation allowance |
26 | 3,027 | — | |||||||||
| Change in unrecognized tax benefit |
— | 81 | (113 | ) | ||||||||
| Other |
(52 | ) | 41 | (57 | ) | |||||||
|
|
|
|
|
|
|
|||||||
| $ | 33,738 | $ | 32,835 | $ | 25,315 | |||||||
|
|
|
|
|
|
|
|||||||
F-28
Table of Contents
The components of the net deferred taxes for the years ended September 30, 2016 and September 30, 2015 using current tax rates are as follows (in thousands):
| September 30, | ||||||||
| 2016 | 2015 | |||||||
| Deferred tax assets: |
||||||||
| Net operating loss carryforwards |
$ | 5,791 | $ | 7,367 | ||||
| Vacation accrual |
3,367 | 3,295 | ||||||
| Pension accrual |
8,549 | 9,244 | ||||||
| Allowance for bad debts |
1,728 | 2,654 | ||||||
| Fair value of derivative instruments |
— | 6,773 | ||||||
| Insurance accrual |
25,828 | 24,682 | ||||||
| Inventory capitalization |
1,128 | 1,038 | ||||||
| Alternative minimum tax credit carryforward |
266 | 266 | ||||||
| Other, net |
2,512 | 1,630 | ||||||
|
|
|
|
|
|||||
| Total deferred tax assets |
49,169 | 56,949 | ||||||
| Valuation allowance |
(3,053 | ) | (3,027 | ) | ||||
|
|
|
|
|
|||||
| Net deferred tax assets |
$ | 46,116 | $ | 53,922 | ||||
|
|
|
|
|
|||||
| Deferred tax liabilities: |
||||||||
| Property and equipment |
$ | 3,999 | $ | 2,831 | ||||
| Inventory costing method |
— | 497 | ||||||
| Fair value of derivative instruments |
788 | — | ||||||
| Intangibles |
35,976 | 34,286 | ||||||
|
|
|
|
|
|||||
| Total deferred tax liabilities |
$ | 40,763 | $ | 37,614 | ||||
|
|
|
|
|
|||||
| Net deferred taxes |
$ | 5,353 | $ | 16,308 | ||||
|
|
|
|
|
|||||
In order to fully realize the net deferred tax assets, the Partnership’s corporate subsidiaries will need to generate future taxable income. A valuation allowance is recognized if, based on the weight of available evidence including historical tax losses, it is more likely than not that some or all of deferred tax assets will not be realized. The net change in the total valuation allowance for the fiscal year ended September 30, 2016 was an increase of $26 thousand. The net change in the total valuation allowance for the fiscal year ended September 30, 2015 was an increase of $3.0 million. Based upon a review of a number of factors and all available evidence, including recent historical operating performance, the expectation of sustainable earnings, and the confidence that sufficient positive taxable income would continue in all tax jurisdictions for the foreseeable future, management concludes for the year ended September 30, 2016, it is more likely than not that the Partnership will realize the full benefit of its deferred tax assets, net of existing valuation allowance at September 30, 2016.
As of January 1, 2016, Star Acquisitions, a wholly-owned subsidiary of the Partnership, had a Federal net operating loss carry forward (“NOLs”) of approximately $3.9 million. The Federal NOLs, which will expire between 2018 and 2024, are generally available to offset any future taxable income but are also subject to annual limitations of between $1.0 million and $2.2 million.
FASB ASC 740-10-05-6 Income Taxes, Uncertain Tax Position, provides financial statement accounting guidance for uncertainty in income taxes and tax positions taken or expected to be taken in a tax return. At September 30, 2016, we did not have unrecognized income tax benefits.
Our continuing practice is to recognize interest and penalties related to income tax matters as a component of income tax expense. We file U.S. Federal income tax returns and various state and local returns. A number of years may elapse before an uncertain tax position is audited and finally resolved. For our Federal income tax returns we have four tax years subject to examination. In our major state tax jurisdictions of New York, Connecticut, and Pennsylvania we have four years that are subject to examination. In the state tax jurisdiction of New Jersey we have five tax years that are subject to examination. While it is often difficult to predict the final outcome or the timing of resolution of any particular uncertain tax position, based on our assessment of many factors including past experience and interpretation of tax law, we believe that our provision for income taxes reflect the most probable outcome. This assessment relies on estimates and assumptions and may involve a series of complex judgments about future events.
F-29
Table of Contents
14) Lease Commitments
The Partnership has entered into certain operating leases for office space, trucks and other equipment. The future minimum rental commitments at September 30, 2016 under operating leases having an initial or remaining non-cancelable term of one year or more are as follows (in thousands):
| 2017 |
$ | 17,671 | ||
| 2018 |
15,224 | |||
| 2019 |
14,766 | |||
| 2020 |
12,807 | |||
| 2021 |
10,068 | |||
| Thereafter |
46,912 | |||
|
|
|
|||
| Total future minimum lease payments |
$ | 117,448 | ||
|
|
|
Rent expense for the fiscal years ended September 30, 2016, 2015, and 2014, was $19.7 million, $18.4 million, and $15.9 million, respectively.
15) Supplemental Disclosure of Cash Flow Information
| Years Ended September 30, | ||||||||||||
| (in thousands) |
2016 | 2015 | 2014 | |||||||||
| Cash paid during the period for: |
||||||||||||
| Income taxes, net |
$ | 22,570 | $ | 38,265 | $ | 25,518 | ||||||
| Interest |
$ | 7,785 | $ | 16,950 | $ | 16,968 | ||||||
| Non-cash investing activities: |
||||||||||||
| Acquisition of NYC heating oil customer list |
$ | — | $ | 886 | $ | — | ||||||
| Non-cash financing activities: |
||||||||||||
| Increase in interest expense—amortization of debt discount on 8.875% Senior Notes |
$ | — | $ | 112 | $ | 112 | ||||||
16) Commitments and Contingencies
On February 18, 2016, a civil action was filed in the United States District Court, District of New Jersey, entitled M. Norman Donnenfeld v. Petro Home Services, Petro Holdings Inc. and Petro, Inc., Civil Action Number 2:16-cv-00882 JMV-JBC, against Petro Home Services which is a brand name, Petro Holdings Inc. and Petro, Inc. Plaintiff alleges he did not receive expected contractual benefits under his protected price plan contract when oil prices fell and asserts various claims for relief including breach of contract, violation of the New York General Business Law and fraud. The Plaintiff also seeks to have a class certified of all customers of the defendants in the United States who entered into protected price plan contracts and were denied the same contractual benefits and to be appointed to represent them. No class has yet been certified in this action. The Plaintiff seeks compensatory, punitive and other damages in unspecified amounts. On May 9, 2016, the Partnership filed a motion to dismiss the complaint for lack of personal jurisdiction and failure to state a claim for relief and to strike the class action allegations. The motion was fully briefed and submitted to the court on July 12, 2016 and no decision has been issued yet. The Partnership believes the allegations lack merit and intends to vigorously defend the action; at this time we cannot assess the potential outcome or materiality of this matter.
The Partnership’s operations are subject to the operating hazards and risks normally incidental to handling, storing and transporting and otherwise providing for use by consumers hazardous liquids such as home heating oil and propane. In the ordinary course of business, the Partnership is a defendant in various legal proceedings and litigation. The Partnership records a liability when it is probable that a loss has been incurred and the amount is reasonably estimable. We do not believe these matters, when considered individually or in the aggregate, could reasonably be expected to have a material adverse effect on the Partnership’s results of operations, financial position or liquidity.
The Partnership maintains insurance policies with insurers in amounts and with coverages and deductibles we believe are reasonable and prudent. However, the Partnership cannot assure that this insurance will be adequate to protect it from all material expenses related to current and potential future claims, legal proceedings and litigation. Certain types of claims may be excluded from our insurance coverage. If we were to incur substantial liability and the damages are not covered by insurance or are in excess of policy limits, or if we incur liability at a time when we are not able to obtain liability insurance, then our business, results of operations and financial condition could be materially adversely affected.
F-30
Table of Contents
17) Earnings Per Limited Partner Units
The following table presents the net income allocation and per unit data in accordance with FASB ASC 260-10-45-60 Earnings per Share, Master Limited Partnerships (EITF 03-06):
| Basic and Diluted Earnings Per Limited Partner: | Years Ended September 30, | |||||||||||
| (in thousands, except per unit data) |
2016 | 2015 | 2014 | |||||||||
| Net income |
$ | 44,934 | $ | 37,556 | $ | 36,084 | ||||||
| Less General Partners’ interest in net income |
252 | 212 | 203 | |||||||||
|
|
|
|
|
|
|
|||||||
| Net income available to limited partners |
44,682 | 37,344 | 35,881 | |||||||||
| Less dilutive impact of theoretical distribution of earnings under FASB ASC 260-10-45-60 * |
4,534 | 3,318 | 3,195 | |||||||||
|
|
|
|
|
|
|
|||||||
| Limited Partner’s interest in net income under FASB ASC 260-10-45-60 |
$ | 40,148 | $ | 34,026 | $ | 32,686 | ||||||
|
|
|
|
|
|
|
|||||||
| Per unit data: |
||||||||||||
| Basic and diluted net income available to limited partners |
$ | 0.78 | $ | 0.65 | $ | 0.62 | ||||||
| Less dilutive impact of theoretical distribution of earnings under FASB ASC 260-10-45-60 * |
0.08 | 0.06 | 0.05 | |||||||||
|
|
|
|
|
|
|
|||||||
| Limited Partner’s interest in net income under FASB ASC 260-10-45-60 |
$ | 0.70 | $ | 0.59 | $ | 0.57 | ||||||
|
|
|
|
|
|
|
|||||||
| Weighted average number of Limited Partner units outstanding |
57,022 | 57,285 | 57,476 | |||||||||
|
|
|
|
|
|
|
|||||||
| * | In any accounting period where the Partnership’s aggregate net income exceeds its aggregate distribution for such period, the Partnership is required as per FASB ASC 260-10-45-60 to present net income per limited partner unit as if all of the earnings for the period were distributed, based on the terms of the Partnership agreement, regardless of whether those earnings would actually be distributed during a particular period from an economic or practical perspective. This allocation does not impact the Partnership’s overall net income or other financial results. |
F-31
Table of Contents
18) Selected Quarterly Financial Data (unaudited)
| Three Months Ended | ||||||||||||||||||||
| Dec. 31, | Mar. 31, | Jun. 30, | Sep. 30, | |||||||||||||||||
| (in thousands - except per unit data) |
2015 | 2016 | 2016 | 2016 | Total | |||||||||||||||
| Sales |
$ | 319,055 | $ | 462,025 | $ | 218,194 | $ | 162,064 | $ | 1,161,338 | ||||||||||
| Gross profit for product, installation and service |
106,041 | 183,303 | 61,354 | $ | 41,799 | 392,497 | ||||||||||||||
| Operating income (loss) |
23,646 | 96,319 | (2,955 | ) | $ | (29,606 | ) | 87,404 | ||||||||||||
| Income (loss) before income taxes |
21,475 | 94,113 | (4,993 | ) | $ | (31,923 | ) | 78,672 | ||||||||||||
| Net income (loss) |
12,058 | 55,209 | (3,238 | ) | $ | (19,095 | ) | 44,934 | ||||||||||||
| Limited Partner interest in net income (loss) |
11,990 | 54,896 | (3,219 | ) | $ | (18,985 | ) | 44,682 | ||||||||||||
| Net income (loss) per Limited Partner unit: |
||||||||||||||||||||
| Basic and diluted (a) |
$ | 0.19 | $ | 0.79 | $ | (0.06 | ) | $ | (0.34 | ) | $ | 0.70 | ||||||||
| Three Months Ended | ||||||||||||||||||||
| Dec. 31, | Mar. 31, | Jun. 30, | Sep. 30, | |||||||||||||||||
| (in thousands - except per unit data) |
2014 | 2015 | 2015 | 2015 | Total | |||||||||||||||
| Sales |
$ | 499,217 | $ | 762,309 | $ | 245,604 | $ | 167,161 | $ | 1,674,291 | ||||||||||
| Gross profit for product, installation and service |
129,285 | 239,132 | 59,765 | 42,521 | 470,703 | |||||||||||||||
| Operating income (loss) |
30,773 | 134,095 | (10,073 | ) | (61,182 | ) | 93,613 | |||||||||||||
| Income (loss) before income taxes |
26,913 | 129,876 | (13,970 | ) | (72,428 | ) | 70,391 | |||||||||||||
| Net income (loss) |
15,554 | 75,687 | (8,359 | ) | (45,326 | ) | 37,556 | |||||||||||||
| Limited Partner interest in net income (loss) |
15,466 | 75,259 | (8,312 | ) | (45,069 | ) | 37,344 | |||||||||||||
| Net income (loss) per Limited Partner unit: |
||||||||||||||||||||
| Basic and diluted (a) |
$ | 0.24 | $ | 1.08 | $ | (0.15 | ) | $ | (0.79 | ) | $ | 0.59 | ||||||||
| (a) | The sum of the quarters do not add-up to the total due to the weighting of Limited Partner Units outstanding, rounding or the theoretical effects of FASB ASC 260-10-45-60 to Master Limited Partners earnings per unit. |
19) Subsequent Events
Acquisition
In December 2016 the Partnership purchased for cash a Michigan based propane dealer for an aggregate amount of approximately $5.2 million.
Quarterly Distribution Declared
In October 2016, we declared a quarterly distribution of $0.1025 per unit, or $0.41 per unit on an annualized basis, on all Common Units with respect to the fourth quarter of fiscal 2016, payable on November 9, 2016, to holders of record on October 31, 2016. In accordance with our Partnership Agreement, the amount of distributions in excess of the minimum quarterly distribution of $0.0675, are distributed 90% to Common Unit holders and 10% to the General Partner unit holders (until certain distribution levels are met), subject to the management incentive compensation plan. As a result, $5.9 million will be paid to the Common Unit holders, $0.1 million to the General Partner unit holders (including $0.1 million of incentive distribution as provided in our Partnership Agreement) and $0.1 million to management pursuant to the management incentive compensation plan which provides for certain members of management to receive incentive distributions that would otherwise be payable to the General Partner.
F-32
Table of Contents
Schedule I
STAR GAS PARTNERS, L.P. (PARENT COMPANY)
CONDENSED FINANCIAL INFORMATION OF REGISTRANT
| September 30, | ||||||||
| (in thousands) |
2016 | 2015 | ||||||
| Balance Sheets |
||||||||
| ASSETS |
||||||||
| Current assets |
||||||||
| Cash and cash equivalents |
$ | 324 | $ | 324 | ||||
| Prepaid expenses and other current assets |
199 | 210 | ||||||
|
|
|
|
|
|||||
| Total current assets |
523 | 534 | ||||||
|
|
|
|
|
|||||
| Investment in subsidiaries (a) |
301,368 | 289,744 | ||||||
| Deferred charges and other assets, net |
— | — | ||||||
|
|
|
|
|
|||||
| Total Assets |
$ | 301,891 | $ | 290,278 | ||||
|
|
|
|
|
|||||
| LIABILITIES AND PARTNERS’ CAPITAL |
||||||||
| Current liabilities |
||||||||
| Accrued expenses |
$ | 398 | $ | 392 | ||||
|
|
|
|
|
|||||
| Total current liabilities |
398 | 392 | ||||||
|
|
|
|
|
|||||
| Long-term debt |
— | — | ||||||
| Partners’ capital |
301,493 | 289,886 | ||||||
|
|
|
|
|
|||||
| Total Liabilities and Partners’ Capital |
$ | 301,891 | $ | 290,278 | ||||
|
|
|
|
|
|||||
| (a) | Investments in Star Acquisitions, Inc. and subsidiaries are recorded in accordance with the equity method of accounting. |
F-33
Table of Contents
Schedule I
STAR GAS PARTNERS, L.P. (PARENT COMPANY)
CONDENSED FINANCIAL INFORMATION OF REGISTRANT
| Years Ended September 30, | ||||||||||||
| (in thousands) |
2016 | 2015 | 2014 | |||||||||
| Statements of Operations |
||||||||||||
| Revenues |
$ | — | $ | — | $ | — | ||||||
| General and administrative expenses |
1,363 | 1,314 | 1,420 | |||||||||
|
|
|
|
|
|
|
|||||||
| Operating loss |
(1,363 | ) | (1,314 | ) | (1,420 | ) | ||||||
| Net interest expense |
— | (10,342 | ) | (11,206 | ) | |||||||
| Amortization of debt issuance costs |
— | (521 | ) | (520 | ) | |||||||
| Loss on redemption of debt |
— | (7,345 | ) | — | ||||||||
|
|
|
|
|
|
|
|||||||
| Net loss before equity income |
(1,363 | ) | (19,522 | ) | (13,146 | ) | ||||||
| Equity income of Star Petro Inc. and subs |
46,297 | 57,078 | 49,230 | |||||||||
|
|
|
|
|
|
|
|||||||
| Net income |
$ | 44,934 | $ | 37,556 | $ | 36,084 | ||||||
|
|
|
|
|
|
|
|||||||
F-34
Table of Contents
Schedule I
STAR GAS PARTNERS, L.P. (PARENT COMPANY)
CONDENSED FINANCIAL INFORMATION OF REGISTRANT
| Years Ended September 30, | ||||||||||||
| (in thousands) |
2016 | 2015 | 2014 | |||||||||
| Statements of Cash Flows |
||||||||||||
| Cash flows provided by (used in) operating activities: |
||||||||||||
| Net cash provided by operating activities (a) |
$ | 35,109 | $ | 152,537 | $ | 21,513 | ||||||
|
|
|
|
|
|
|
|||||||
| Cash flows provided by (used in) investing activities: |
||||||||||||
| Net cash provided by (used in) investing activities |
— | — | — | |||||||||
|
|
|
|
|
|
|
|||||||
| Cash flows provided by (used in) financing activities: |
||||||||||||
| Distributions |
(23,092 | ) | (21,298 | ) | (19,850 | ) | ||||||
| Redemption of debt |
— | (130,548 | ) | — | ||||||||
| Unit repurchase |
(12,017 | ) | (691 | ) | (1,663 | ) | ||||||
|
|
|
|
|
|
|
|||||||
| Net cash used in financing activities |
(35,109 | ) | (152,537 | ) | (21,513 | ) | ||||||
|
|
|
|
|
|
|
|||||||
| Net increase in cash |
— | — | — | |||||||||
| Cash and cash equivalents at beginning of period |
324 | 324 | 324 | |||||||||
|
|
|
|
|
|
|
|||||||
| Cash and cash equivalents at end of period |
$ | 324 | $ | 324 | $ | 324 | ||||||
|
|
|
|
|
|
|
|||||||
| (a) Includes distributions from subsidiaries |
$ | 35,109 | $ | 152,537 | $ | 21,513 | ||||||
|
|
|
|
|
|
|
|||||||
F-35
Table of Contents
STAR GAS PARTNERS, L.P. AND SUBSIDIARIES
Schedule II
VALUATION AND QUALIFYING ACCOUNTS
Years Ended September 30, 2016, 2015 and 2014
(in thousands)
| Year |
Description | Balance at Beginning of Year |
Charged to Costs & Expenses |
Other Changes Add (Deduct) |
Balance at End of Year |
|||||||||||
| 2016 | Allowance for doubtful accounts |
$ | 6,713 | $ | (639 | ) | $(1,655)(a) | $ | 4,419 | |||||||
| 2015 | Allowance for doubtful accounts |
$ | 9,220 | $ | 3,738 | $(6,245)(a) | $ | 6,713 | ||||||||
| 2014 | Allowance for doubtful accounts |
$ | 7,928 | $ | 7,514 | $(6,222)(a) | $ | 9,220 | ||||||||
| (a) | Bad debts written off (net of recoveries). |
F-36