Attached files
| file | filename |
|---|---|
| EX-99.1 - EX-99.1 - HD Supply Holdings, Inc. | a16-18206_3ex99d1.htm |
| 8-K - 8-K - HD Supply Holdings, Inc. | a16-18206_38k.htm |
Exhibit 99.2
2016 Third-Quarter Performance December 6, 2016 Financial Results and Company Highlights

Disclaimers Forward-Looking Statements and Preliminary Results This presentation includes “forward-looking statements” within the meaning of Section 27A of the Securities Act and Section 21E of the Exchange Act. Forward-looking statements are based on management’s beliefs and assumptions and information currently available to management and are subject to known and unknown risks and uncertainties, many of which may be beyond our control. We caution you that the forward-looking information presented in this presentation is not a guarantee of future results, and that actual results may differ materially from those made in or suggested by the forward-looking information contained in this presentation. In addition, forward-looking statements generally can be identified by the use of forward-looking terminology such as “may,” “plan,” “seek,” “comfortable with,” “will,” “expect,” “intend,” “estimate,” “anticipate,” “believe” or “continue” or the negative thereof or variations thereon or similar terminology. A number of important factors could cause actual events to differ materially from those contained in or implied by the forward-looking statements, including those “Risk factors” in our annual report on Form 10-K, for the fiscal year ended January 31, 2016, filed on March 18, 2016 and those described from time to time in our, and HD Supply, Inc.’s, other filings with the U.S. Securities and Exchange Commission, which can be found at the SEC’s website www.sec.gov. Any forward-looking information presented herein is made only as of the date of this presentation, and we do not undertake any obligation to update or revise any forward-looking information to reflect changes in assumptions, the occurrence of unanticipated events, or otherwise. Estimates for Net sales, Adjusted EBITDA and Adjusted Net income per diluted share are preliminary estimates and are subject to risks and uncertainties, including, among others, changes in connection with quarter-end adjustments. Any variation between HD Supply’s actual results and the preliminary financial data set forth herein may be material. Non-GAAP Financial Measures HD Supply supplements its financial results that are determined in accordance with accounting principles generally accepted in the United States of America (“GAAP”) with non-GAAP measurements, including Adjusted EBITDA, Adjusted net income (loss), Adjusted net income (loss) per diluted share, Net Debt and Free Cash Flow. This supplemental information should not be considered in isolation or as a substitute for the GAAP measurements. Additional information regarding Adjusted EBITDA, Adjusted net income (loss) and Adjusted net income (loss) per share referred to in this presentation is included at the end of this presentation under “Reconciliation of Non-GAAP Measures.”
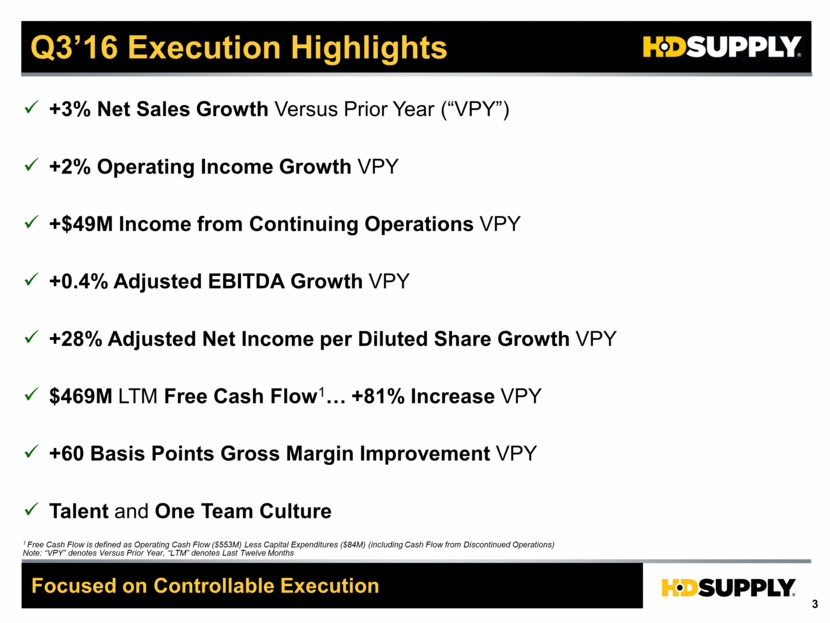
Q3’16 Execution Highlights Focused on Controllable Execution 1 Free Cash Flow is defined as Operating Cash Flow ($553M) Less Capital Expenditures ($84M) (including Cash Flow from Discontinued Operations) Note: “VPY” denotes Versus Prior Year, “LTM” denotes Last Twelve Months +3% Net Sales Growth Versus Prior Year (“VPY”) +2% Operating Income Growth VPY +$49M Income from Continuing Operations VPY +0.4% Adjusted EBITDA Growth VPY +28% Adjusted Net Income per Diluted Share Growth VPY $469M LTM Free Cash Flow1 +81% Increase VPY +60 Basis Points Gross Margin Improvement VPY Talent and One Team Culture
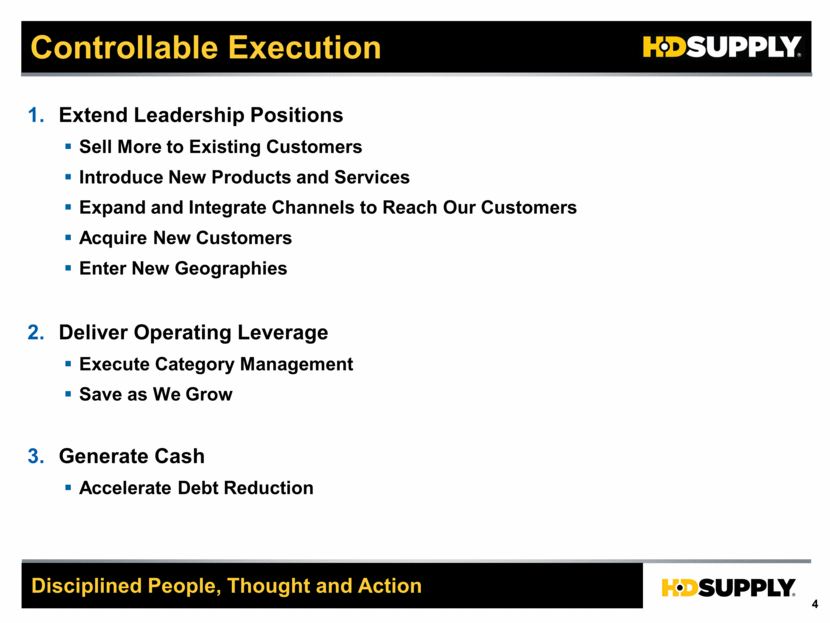
Controllable Execution Extend Leadership Positions Sell More to Existing Customers Introduce New Products and Services Expand and Integrate Channels to Reach Our Customers Acquire New Customers Enter New Geographies Deliver Operating Leverage Execute Category Management Save as We Grow Generate Cash Accelerate Debt Reduction Disciplined People, Thought and Action
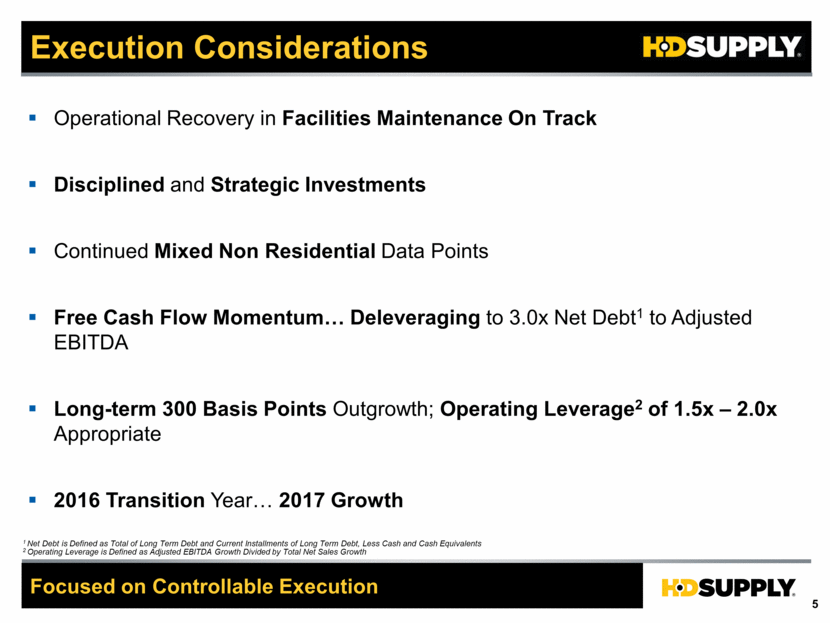
Execution Considerations Focused on Controllable Execution Operational Recovery in Facilities Maintenance On Track Disciplined and Strategic Investments Continued Mixed Non Residential Data Points Free Cash Flow Momentum Deleveraging to 3.0x Net Debt1 to Adjusted EBITDA Long-term 300 Basis Points Outgrowth; Operating Leverage2 of 1.5x – 2.0x Appropriate 2016 Transition Year 2017 Growth 1 Net Debt is Defined as Total of Long Term Debt and Current Installments of Long Term Debt, Less Cash and Cash Equivalents 2 Operating Leverage is Defined as Adjusted EBITDA Growth Divided by Total Net Sales Growth
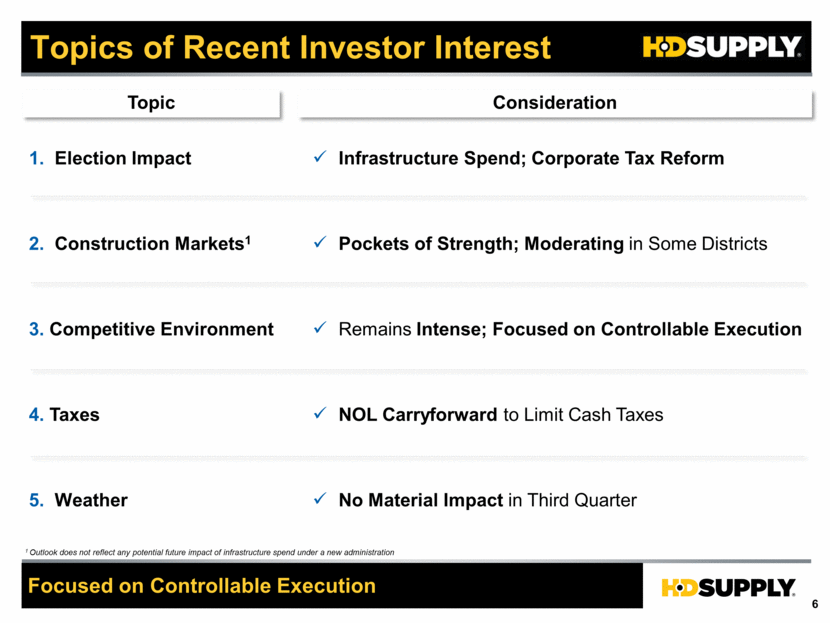
Infrastructure Spend; Corporate Tax Reform Pockets of Strength; Moderating in Some Districts NOL Carryforward to Limit Cash Taxes No Material Impact in Third Quarter Topics of Recent Investor Interest Free Cash Flow is defined as Operating Cash Flow – Capital Expenditures (including Cash Flow from Discontinued Operations) Topic Consideration 3. Competitive Environment 1. Election Impact 4. Taxes 2. Construction Markets1 Remains Intense; Focused on Controllable Execution 5. Weather 1 Outlook does not reflect any potential future impact of infrastructure spend under a new administration Focused on Controllable Execution
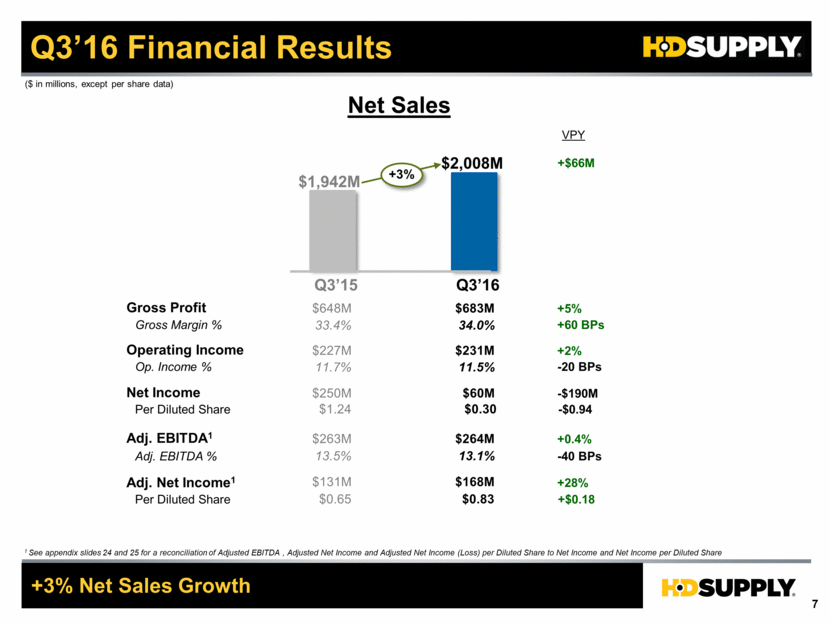
Q3’16 Financial Results $1,942M $2,008M +3% Gross Profit Gross Margin % Operating Income Adj. EBITDA % Op. Income % $648M $683M 33.4% 34.0% $263M $264M $227M $231M 13.5% 13.1% 11.5% +5% +60 BPs -40 BPs +0.4% ($ in millions, except per share data) $131M $168M +2% Net Sales 1 See appendix slides 24 and 25 for a reconciliation of Adjusted EBITDA , Adjusted Net Income and Adjusted Net Income (Loss) per Diluted Share to Net Income and Net Income per Diluted Share Q3’15 Adj. EBITDA1 VPY Adj. Net Income1 11.7% -20 BPs Q3’16 $0.65 $0.83 +$0.18 Per Diluted Share +$66M +3% Net Sales Growth +28% Net Income $250M $60M -$190M $1.24 $0.30 -$0.94 Per Diluted Share
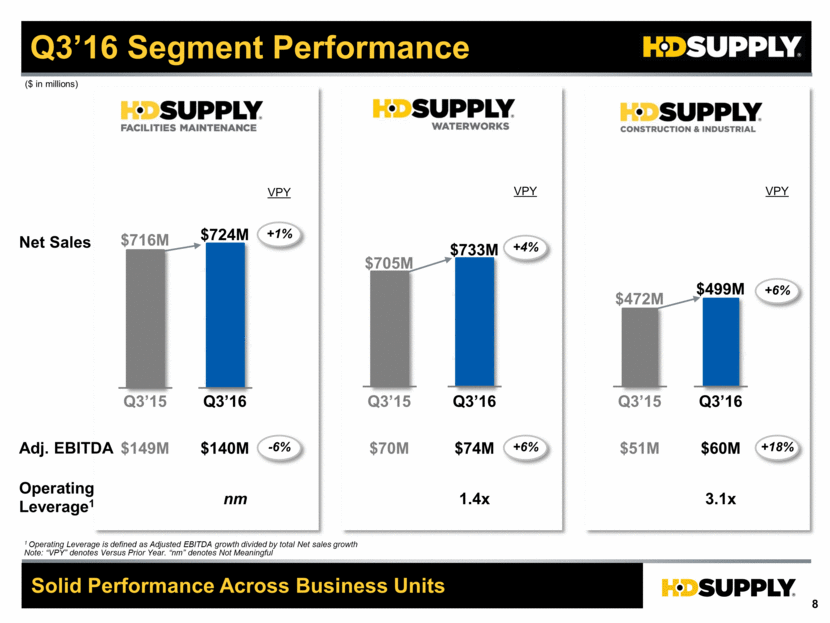
Q3’16 Segment Performance Q3’16 $724M $733M $499M Adj. EBITDA $140M $74M $60M Operating Leverage1 nm 1.4x 3.1x Net Sales ($ in millions) Solid Performance Across Business Units Q3’15 $716M $705M $472M $149M $70M +4% VPY +1% -6% VPY VPY +6% +6% +18% $51M 1 Operating Leverage is defined as Adjusted EBITDA growth divided by total Net sales growth Note: “VPY” denotes Versus Prior Year. “nm” denotes Not Meaningful Q3’16 Q3’15 Q3’16 Q3’15
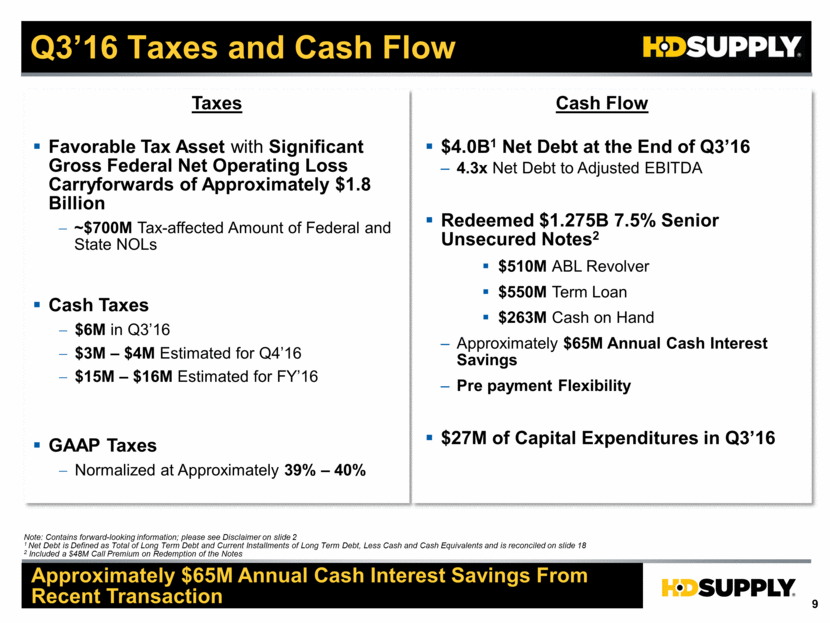
Q3’16 Taxes and Cash Flow Taxes Cash Flow Favorable Tax Asset with Significant Gross Federal Net Operating Loss Carryforwards of Approximately $1.8 Billion ~$700M Tax-affected Amount of Federal and State NOLs Cash Taxes $6M in Q3’16 $3M – $4M Estimated for Q4’16 $15M – $16M Estimated for FY’16 GAAP Taxes Normalized at Approximately 39% – 40% $4.0B1 Net Debt at the End of Q3’16 4.3x Net Debt to Adjusted EBITDA Redeemed $1.275B 7.5% Senior Unsecured Notes2 $510M ABL Revolver $550M Term Loan $263M Cash on Hand Approximately $65M Annual Cash Interest Savings Pre payment Flexibility $27M of Capital Expenditures in Q3’16 Approximately $65M Annual Cash Interest Savings From Recent Transaction Note: Contains forward-looking information; please see Disclaimer on slide 2 1 Net Debt is Defined as Total of Long Term Debt and Current Installments of Long Term Debt, Less Cash and Cash Equivalents and is reconciled on slide 18 2 Included a $48M Call Premium on Redemption of the Notes
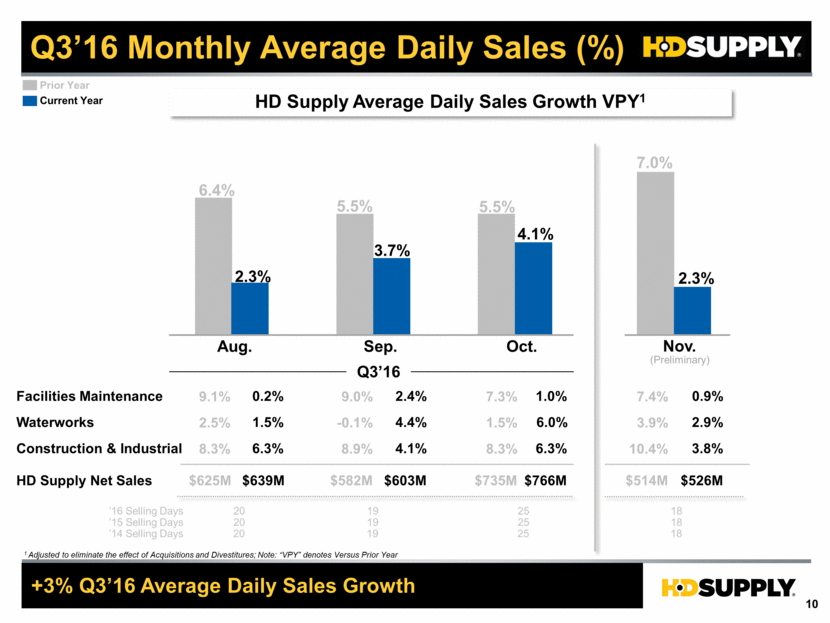
Q3’16 Monthly Average Daily Sales (%) +3% Q3’16 Average Daily Sales Growth 1 Adjusted to eliminate the effect of Acquisitions and Divestitures; Note: “VPY” denotes Versus Prior Year 1.0% 6.0% 6.3% 2.3% Nov. 0.9% 2.9% 3.8% 2.4% ’15 Selling Days 25 18 19 4.4% 4.1% Facilities Maintenance Waterworks Construction & Industrial (Preliminary) 2.3% 3.7% 4.1% 0.2% 1.5% 6.3% 20 6.4% 7.0% Aug. Sep. Oct. Prior Year $766M $526M $603M HD Supply Net Sales $639M 5.5% 5.5% ’14 Selling Days Q3’16 7.4% 3.9% 10.4% $514M 7.3% 1.5% 8.3% $735M 9.0% -0.1% 8.9% $582M 9.1% 2.5% 8.3% $625M HD Supply Average Daily Sales Growth VPY1 ’16 Selling Days 25 18 19 20 Current Year 25 18 19 20
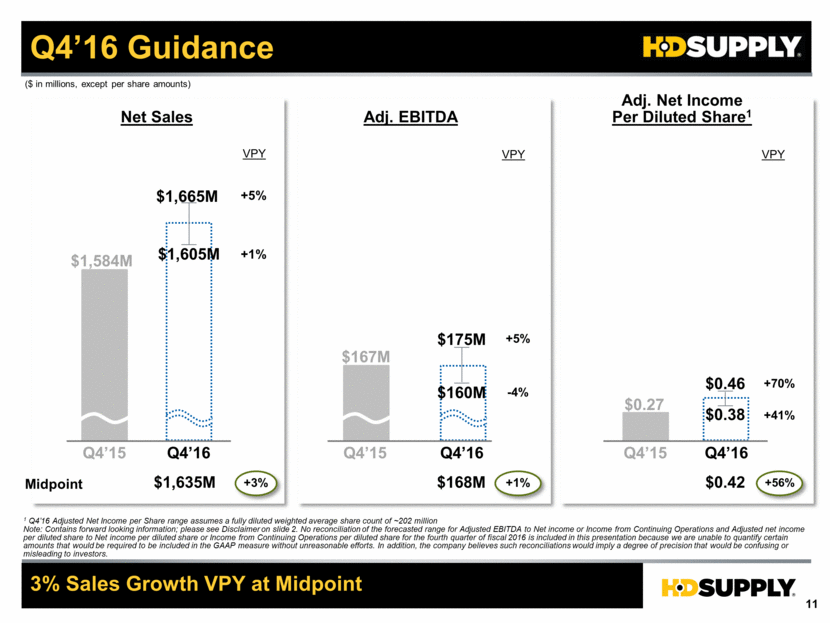
+5% -4% +5% +1% Q4’16 Guidance 3% Sales Growth VPY at Midpoint $1,665M $1,605M $167M $1,584M $175M $160M VPY Q4’15 Q4’16 Q4’15 Q4’16 Q4’16 Net Sales Adj. EBITDA Adj. Net Income Per Diluted Share1 VPY 1 Q4’16 Adjusted Net Income per Share range assumes a fully diluted weighted average share count of ~202 million Note: Contains forward looking information; please see Disclaimer on slide 2. No reconciliation of the forecasted range for Adjusted EBITDA to Net income or Income from Continuing Operations and Adjusted net income per diluted share to Net income per diluted share or Income from Continuing Operations per diluted share for the fourth quarter of fiscal 2016 is included in this presentation because we are unable to quantify certain amounts that would be required to be included in the GAAP measure without unreasonable efforts. In addition, the company believes such reconciliations would imply a degree of precision that would be confusing or misleading to investors. $0.46 $0.38 VPY ($ in millions, except per share amounts) $0.27 . . . . Q4’15 +70% +41% Midpoint $1,635M +3% $168M +1% $0.42 +56%
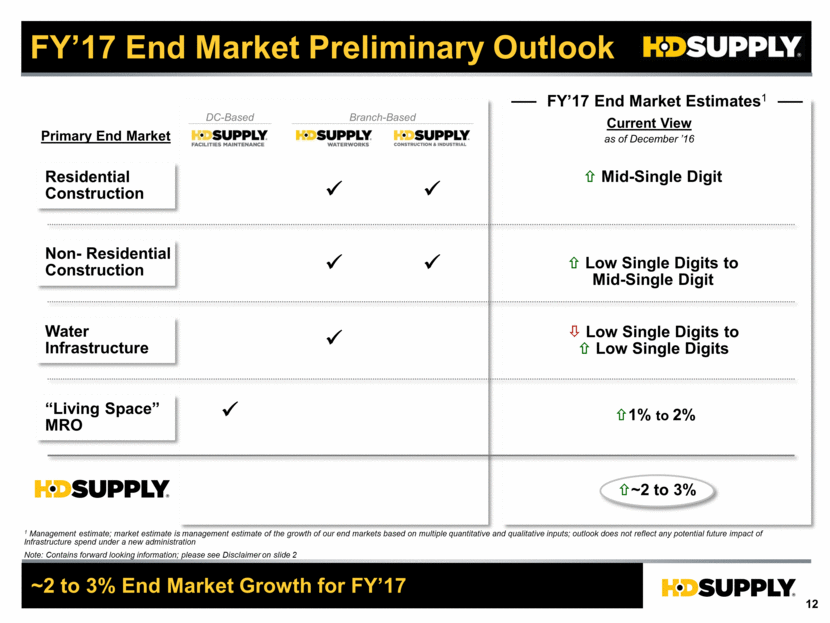
FY’17 End Market Preliminary Outlook ~2 to 3% End Market Growth for FY’17 Residential Construction Water Infrastructure “Living Space” MRO Primary End Market Non- Residential Construction ~2 to 3% FY’17 End Market Estimates1 1% to 2% Current View as of December ’16 Mid-Single Digit Low Single Digits to Low Single Digits 1 Management estimate; market estimate is management estimate of the growth of our end markets based on multiple quantitative and qualitative inputs; outlook does not reflect any potential future impact of Infrastructure spend under a new administration Note: Contains forward looking information; please see Disclaimer on slide 2 Low Single Digits to Mid-Single Digit DC-Based Branch-Based
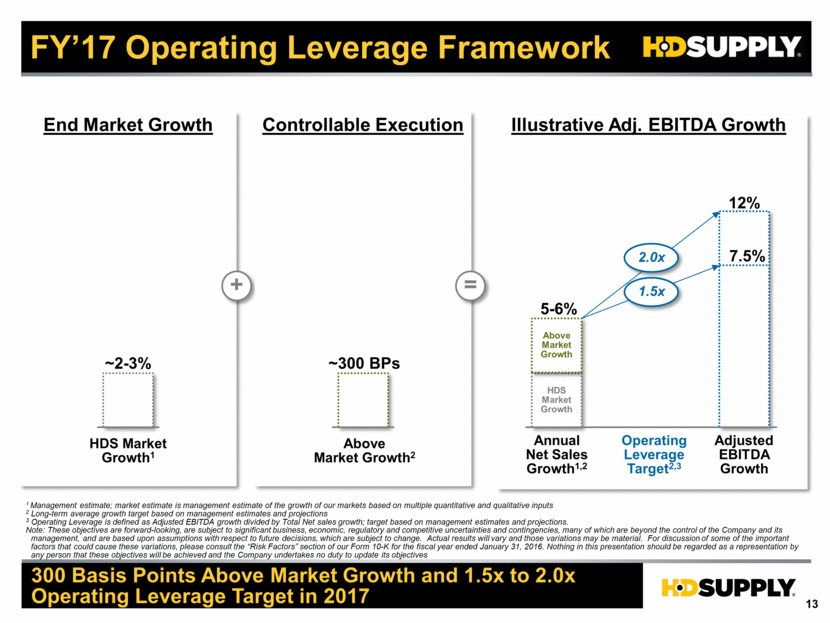
FY’17 Operating Leverage Framework HDS Market Growth1 ~2-3% + Above Market Growth2 ~300 BPs = End Market Growth Controllable Execution Annual Net Sales Growth1,2 Illustrative Adj. EBITDA Growth Adjusted EBITDA Growth 12% HDS Market Growth 7.5% 5-6% 2.0x 1.5x Operating Leverage Target2,3 1 Management estimate; market estimate is management estimate of the growth of our markets based on multiple quantitative and qualitative inputs 2 Long-term average growth target based on management estimates and projections 3 Operating Leverage is defined as Adjusted EBITDA growth divided by Total Net sales growth; target based on management estimates and projections. Note: These objectives are forward-looking, are subject to significant business, economic, regulatory and competitive uncertainties and contingencies, many of which are beyond the control of the Company and its management, and are based upon assumptions with respect to future decisions, which are subject to change. Actual results will vary and those variations may be material. For discussion of some of the important factors that could cause these variations, please consult the “Risk Factors” section of our Form 10-K for the fiscal year ended January 31, 2016. Nothing in this presentation should be regarded as a representation by any person that these objectives will be achieved and the Company undertakes no duty to update its objectives Above Market Growth 300 Basis Points Above Market Growth and 1.5x to 2.0x Operating Leverage Target in 2017
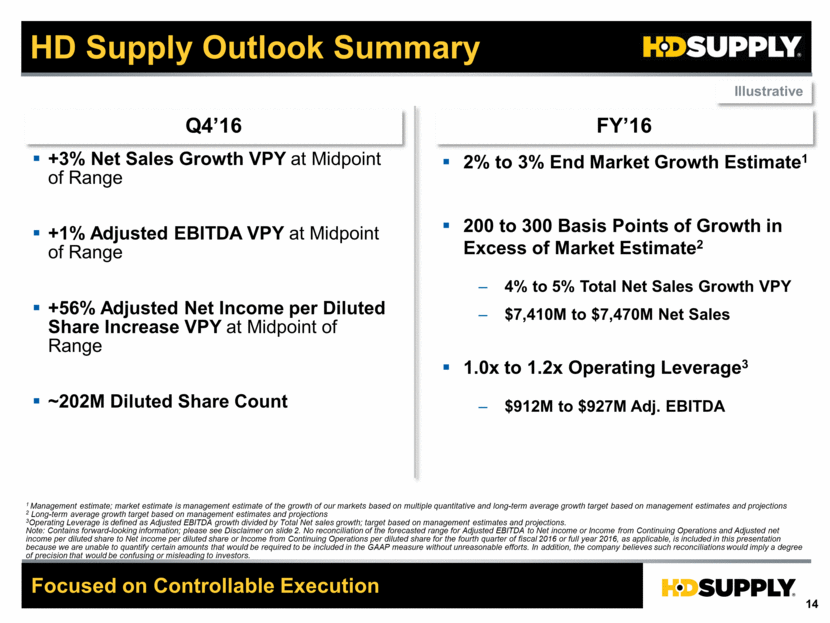
HD Supply Outlook Summary Focused on Controllable Execution Q4’16 FY’16 +3% Net Sales Growth VPY at Midpoint of Range +1% Adjusted EBITDA VPY at Midpoint of Range +56% Adjusted Net Income per Diluted Share Increase VPY at Midpoint of Range ~202M Diluted Share Count Illustrative 1 Management estimate; market estimate is management estimate of the growth of our markets based on multiple quantitative and long-term average growth target based on management estimates and projections 2 Long-term average growth target based on management estimates and projections 3Operating Leverage is defined as Adjusted EBITDA growth divided by Total Net sales growth; target based on management estimates and projections. Note: Contains forward-looking information; please see Disclaimer on slide 2. No reconciliation of the forecasted range for Adjusted EBITDA to Net income or Income from Continuing Operations and Adjusted net income per diluted share to Net income per diluted share or Income from Continuing Operations per diluted share for the fourth quarter of fiscal 2016 or full year 2016, as applicable, is included in this presentation because we are unable to quantify certain amounts that would be required to be included in the GAAP measure without unreasonable efforts. In addition, the company believes such reconciliations would imply a degree of precision that would be confusing or misleading to investors. 2% to 3% End Market Growth Estimate1 200 to 300 Basis Points of Growth in Excess of Market Estimate2 4% to 5% Total Net Sales Growth VPY $7,410M to $7,470M Net Sales 1.0x to 1.2x Operating Leverage3 $912M to $927M Adj. EBITDA
Q&A

Concluding Remarks Solid Continual Improvement +3% Net Sales Growth VPY +28% Adjusted Net Income per Diluted Share Growth VPY +81% LTM Free Cash Flow VPY Focus on 2017 Investment in Long-term Capabilities to Achieve Full Potential Disciplined People, Thought and Action Earned with Hard Work and One Team Execution Disciplined People, Thought and Action Note: “VPY” Denotes Versus Prior Year
Appendix
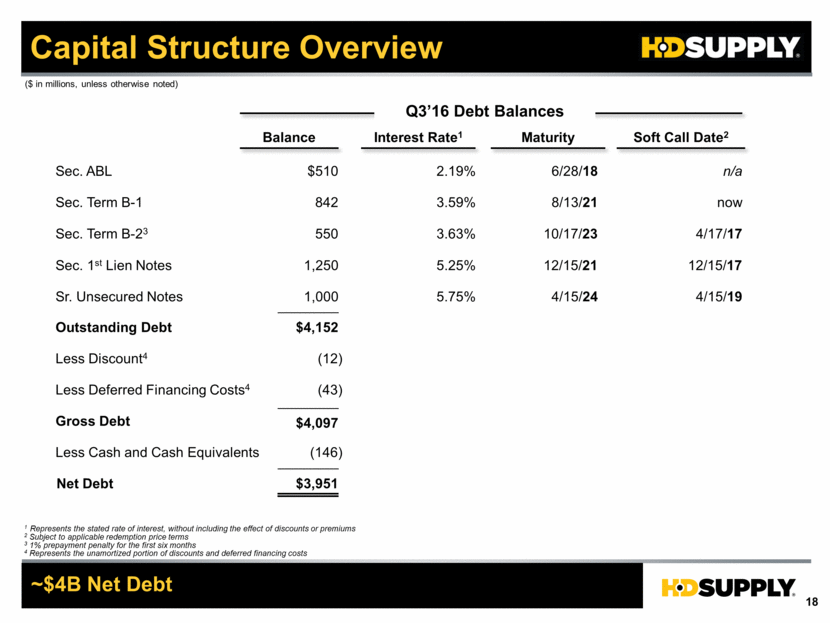
Capital Structure Overview Q3’16 Debt Balances Sec. ABL Sec. Term B-1 Sec. 1st Lien Notes Sr. Unsecured Notes $510 1,250 1,000 6/28/18 8/13/21 12/15/21 Outstanding Debt Less Cash and Cash Equivalents Net Debt $3,951 (146) $4,152 Balance Maturity 1 Represents the stated rate of interest, without including the effect of discounts or premiums 2 Subject to applicable redemption price terms 3 1% prepayment penalty for the first six months 4 Represents the unamortized portion of discounts and deferred financing costs ~$4B Net Debt ($ in millions, unless otherwise noted) 2.19% 3.59% 5.25% Interest Rate1 842 n/a now 12/15/17 Soft Call Date2 5.75% 4/15/24 4/15/19 Less Discount4 (12) Less Deferred Financing Costs4 (43) Gross Debt $4,097 Sec. Term B-23 10/17/23 3.63% 550 4/17/17
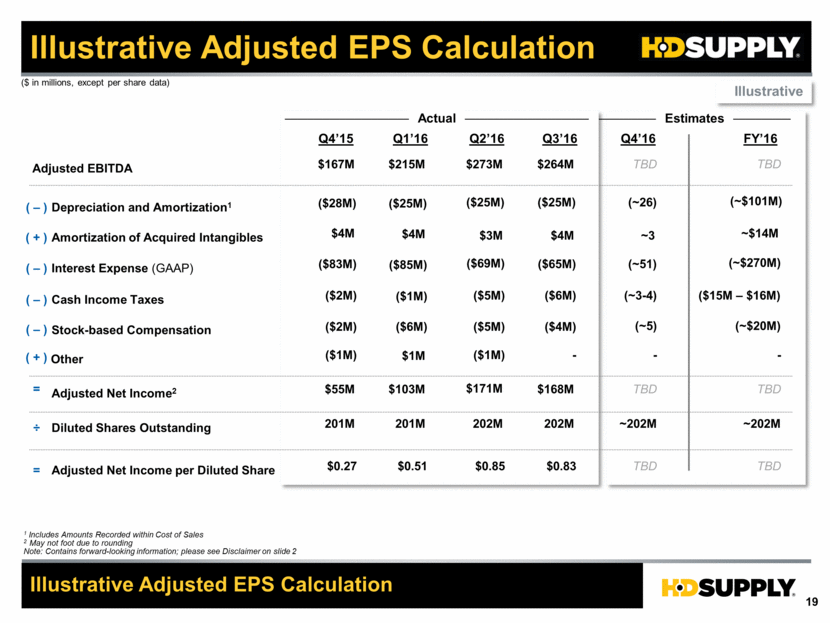
Illustrative Adjusted EPS Calculation Adjusted EBITDA Adjusted Net Income per Diluted Share Illustrative Adjusted EPS Calculation Adjusted Net Income2 = = Diluted Shares Outstanding ÷ TBD TBD TBD ~202M FY’16 $167M $0.27 $55M 201M Q4’15 ($ in millions, except per share data) Q1’16 TBD TBD TBD ~202M Q4’16 Estimates 202M Q2’16 $264M $0.83 $168M 202M Q3’16 Depreciation and Amortization1 ( – ) ($28M) (~26) (~$101M) ($25M) Amortization of Acquired Intangibles ( + ) ~$14M $4M ~3 $3M $4M Interest Expense (GAAP) ( – ) ($83M) (~$270M) Cash Income Taxes ( – ) ($15M – $16M) ($2M) Stock-based Compensation ( – ) ($2M) (~51) ($65M) (~3-4) ($6M) 1 Includes Amounts Recorded within Cost of Sales 2 May not foot due to rounding Note: Contains forward-looking information; please see Disclaimer on slide 2 Actual (~5) ($5M) ($4M) (~$20M) $273M ($25M) ($69M) $171M $0.85 ($5M) $215M ($25M) $4M ($85M) ($1M) ($6M) $0.51 $103M 201M Illustrative Other ($1M) - ($1M) - - $1M ( + )
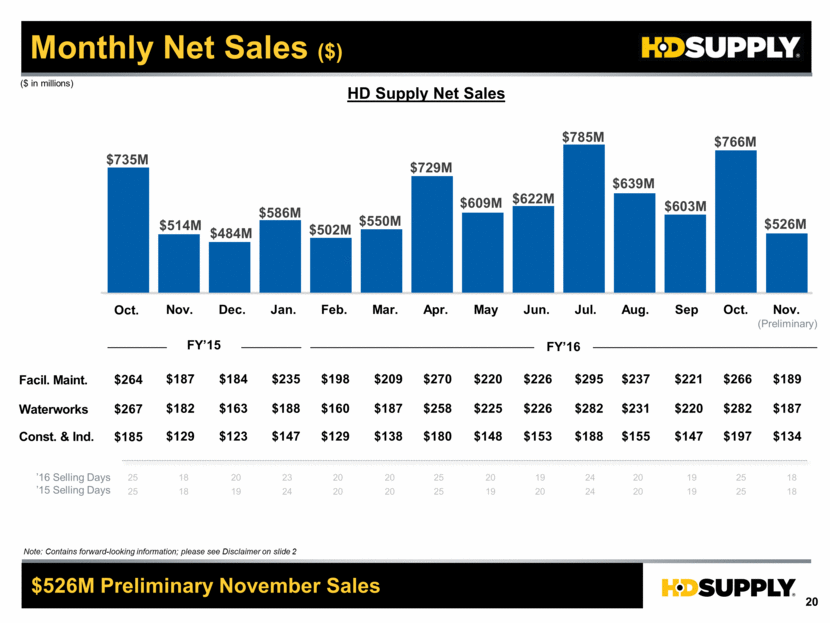
Monthly Net Sales ($) $526M Preliminary November Sales FY’15 Facil. Maint. Waterworks Const. & Ind. ’16 Selling Days ’15 Selling Days ($ in millions) HD Supply Net Sales (Preliminary) FY’16 Nov. Dec. Jan. Feb. Mar. Apr. May Jun. Jul. Aug. Sep Oct. Nov. Oct. $735M $514M $484M $586M $502M $550M $729M $609M $622M $785M $639M $603M $766M $526M $187 $184 $235 $198 $209 $270 $220 $226 $295 $237 $221 $266 $182 $163 $188 $160 $187 $258 $225 $226 $282 $231 $220 $282 $129 $123 $147 $129 $138 $180 $148 $153 $188 $155 $147 $197 $264 $267 $185 $189 $187 $134 25 18 20 23 20 20 25 20 19 24 20 19 25 25 18 19 24 20 20 25 19 20 24 20 19 25 18 18 Note: Contains forward-looking information; please see Disclaimer on slide 2
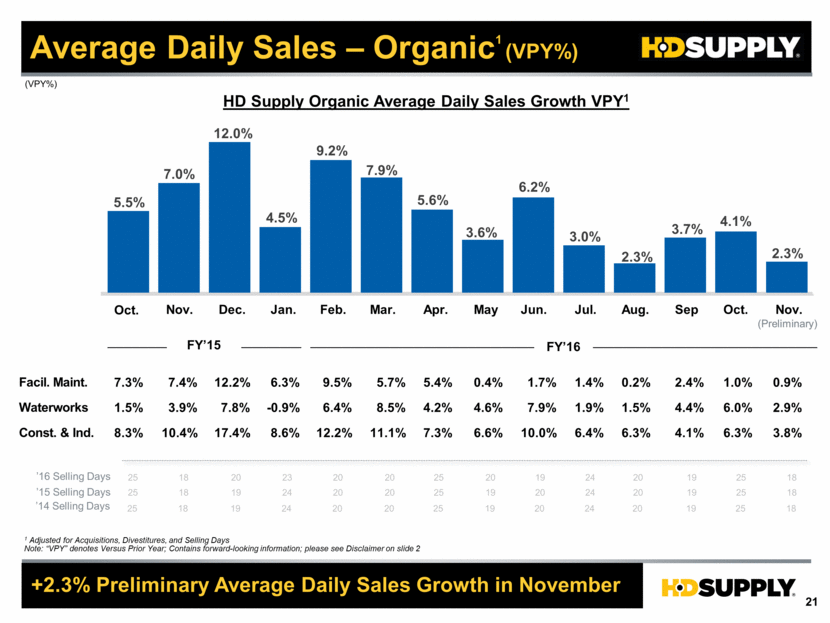
HD Supply Organic Average Daily Sales Growth VPY1 +2.3% Preliminary Average Daily Sales Growth in November (VPY%) 1 Adjusted for Acquisitions, Divestitures, and Selling Days Note: “VPY” denotes Versus Prior Year; Contains forward-looking information; please see Disclaimer on slide 2 Facil. Maint. Waterworks Const. & Ind. 5.5% 7.0% 12.0% 4.5% 9.2% 7.9% 5.6% 3.6% 6.2% 3.0% 2.3% 3.7% 4.1% 2.3% Average Daily Sales – Organic1 (VPY%) ’16 Selling Days ’15 Selling Days (Preliminary) Nov. Dec. Jan. Feb. Mar. Apr. May Jun. Jul. Aug. Sep Oct. Nov. Oct. 25 18 20 23 20 20 25 20 19 24 20 19 25 25 18 19 24 20 20 25 19 20 24 20 19 25 18 18 FY’15 (Preliminary) FY’16 7.3% 7.4% 12.2% 6.3% 9.5% 5.7% 5.4% 0.4% 1.7% 1.4% 0.2% 2.4% 1.0% 1.5% 3.9% 7.8% -0.9% 6.4% 8.5% 4.2% 4.6% 7.9% 1.9% 1.5% 4.4% 6.0% 8.3% 10.4% 17.4% 8.6% 12.2% 11.1% 7.3% 6.6% 10.0% 6.4% 6.3% 4.1% 6.3% 0.9% 2.9% 3.8% ’14 Selling Days 25 18 19 24 20 20 25 19 20 24 20 19 25 18
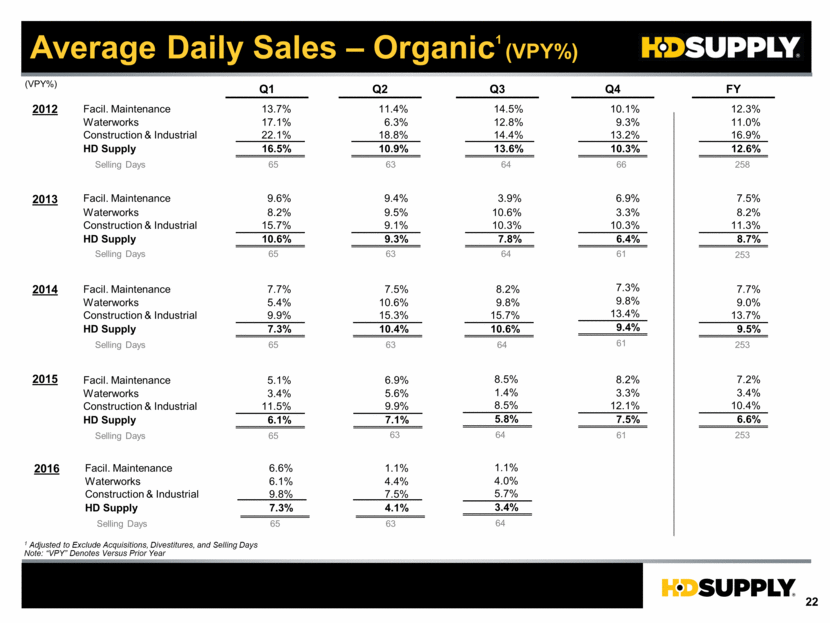
Average Daily Sales – Organic1 (VPY%) 1 Adjusted to Exclude Acquisitions, Divestitures, and Selling Days Note: “VPY” Denotes Versus Prior Year (VPY%) Selling Days Facil. Maintenance Waterworks Construction & Industrial HD Supply 65 6.6% 6.1% 9.8% 7.3% Facil. Maintenance Waterworks Construction & Industrial HD Supply Selling Days 12.3% 11.0% 16.9% 12.6% 258 13.7% 17.1% 22.1% 16.5% 65 11.4% 6.3% 18.8% 10.9% 63 14.5% 12.8% 14.4% 13.6% 64 10.1% 9.3% 13.2% 10.3% 66 Facil. Maintenance Waterworks HD Supply Selling Days 7.5% 8.2% 11.3% 8.7% 253 Construction & Industrial 9.6% 8.2% 15.7% 10.6% 65 9.4% 9.5% 9.1% 9.3% 63 64 3.9% 10.6% 10.3% 7.8% 6.9% 3.3% 10.3% 6.4% 61 Facil. Maintenance Waterworks HD Supply Selling Days 7.7% 5.4% 9.9% 7.3% 65 Construction & Industrial 7.5% 10.6% 15.3% 10.4% 63 8.2% 9.8% 15.7% 10.6% 64 7.3% 9.8% 13.4% 9.4% 61 7.7% 9.0% 13.7% 9.5% 253 FY Q1 Q2 Q3 Q4 Facil. Maintenance Waterworks HD Supply Selling Days 5.1% 3.4% 11.5% 6.1% 65 Construction & Industrial 2016 2012 2013 2014 2015 6.9% 5.6% 9.9% 7.1% 63 8.5% 1.4% 8.5% 5.8% 64 8.2% 3.3% 12.1% 7.5% 61 7.2% 3.4% 10.4% 6.6% 253 63 1.1% 4.4% 7.5% 4.1% 1.1% 4.0% 5.7% 3.4% 64
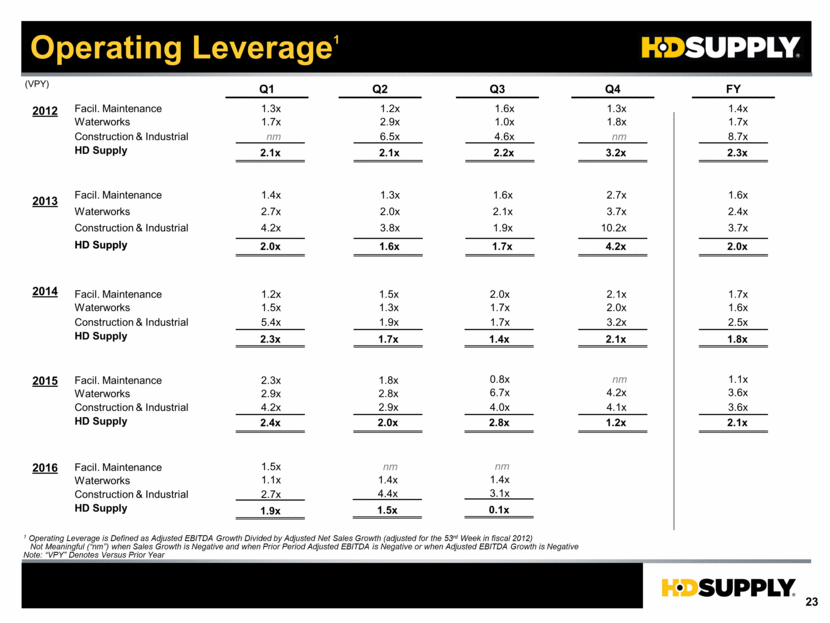
Operating Leverage1 (VPY) 1 Operating Leverage is Defined as Adjusted EBITDA Growth Divided by Adjusted Net Sales Growth (adjusted for the 53rd Week in fiscal 2012) Not Meaningful (“nm”) when Sales Growth is Negative and when Prior Period Adjusted EBITDA is Negative or when Adjusted EBITDA Growth is Negative Note: “VPY” Denotes Versus Prior Year 1.5x 1.1x 2.7x 1.9x Facil. Maintenance Waterworks Construction & Industrial HD Supply 1.4x 1.7x 8.7x 2.3x 1.3x 1.8x nm 3.2x 1.3x 1.7x nm 2.1x 1.2x 2.9x 6.5x 2.1x Facil. Maintenance Waterworks Construction & Industrial HD Supply 1.6x 1.0x 4.6x 2.2x 2.7x 3.7x 10.2x 4.2x 1.6x 2.4x 3.7x 2.0x 1.4x 2.7x 4.2x 2.0x 1.3x 2.0x 3.8x 1.6x Facil. Maintenance Waterworks HD Supply Construction & Industrial HD Supply 1.6x 2.1x 1.9x 1.7x 1.2x 1.5x 5.4x 2.3x 1.5x 1.3x 1.9x 1.7x Facil. Maintenance Waterworks HD Supply Construction & Industrial 2.0x 1.7x 1.7x 1.4x 2.1x 2.0x 3.2x 2.1x 1.7x 1.6x 2.5x 1.8x FY Q1 Q2 Q3 Q4 2016 2012 2013 2014 2015 2.3x 2.9x 4.2x 2.4x Facil. Maintenance Waterworks HD Supply Construction & Industrial 1.8x 2.8x 2.9x 2.0x 0.8x 6.7x 4.0x 2.8x nm 4.2x 4.1x 1.2x 1.1x 3.6x 3.6x 2.1x nm 1.4x 4.4x 1.5x nm 1.4x 3.1x 0.1x
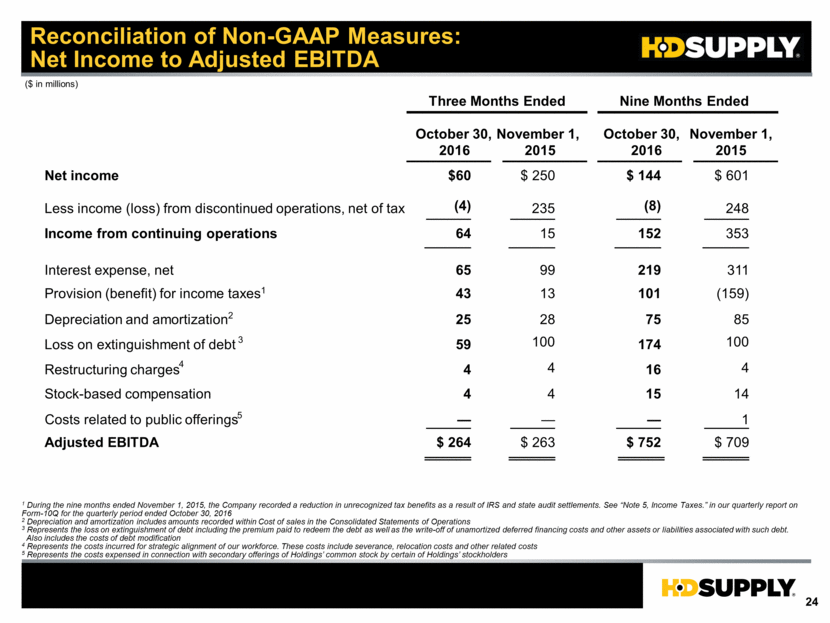
Reconciliation of Non-GAAP Measures: Net Income to Adjusted EBITDA ($ in millions) 1 During the nine months ended November 1, 2015, the Company recorded a reduction in unrecognized tax benefits as a result of IRS and state audit settlements. See “Note 5, Income Taxes.” in our quarterly report on Form-10Q for the quarterly period ended October 30, 2016 2 Depreciation and amortization includes amounts recorded within Cost of sales in the Consolidated Statements of Operations 3 Represents the loss on extinguishment of debt including the premium paid to redeem the debt as well as the write-off of unamortized deferred financing costs and other assets or liabilities associated with such debt. Also includes the costs of debt modification 4 Represents the costs incurred for strategic alignment of our workforce. These costs include severance, relocation costs and other related costs 5 Represents the costs expensed in connection with secondary offerings of Holdings’ common stock by certain of Holdings’ stockholders Three Months Ended October 30, 2016 November 1, 2015 Net income $60 $ 250 Less income (loss) from discontinued operations, net of tax (4) 235 Income from continuing operations 64 15 Interest expense, net 65 99 Provision (benefit) for income taxes 1 13 Depreciation and amortization 2 25 28 Loss on extinguishment of debt 59 Restructuring charges 3 4 4 Stock-based compensation 4 4 4 Adjusted EBITDA $ 264 $ 263 43 100 Nine Months Ended October 30, 2016 November 1, 2015 $ 144 $ 601 (8) 248 152 353 219 311 (159) 75 85 174 16 4 15 14 $ 752 $ 709 101 100 Costs related to public offerings — — — 1 5
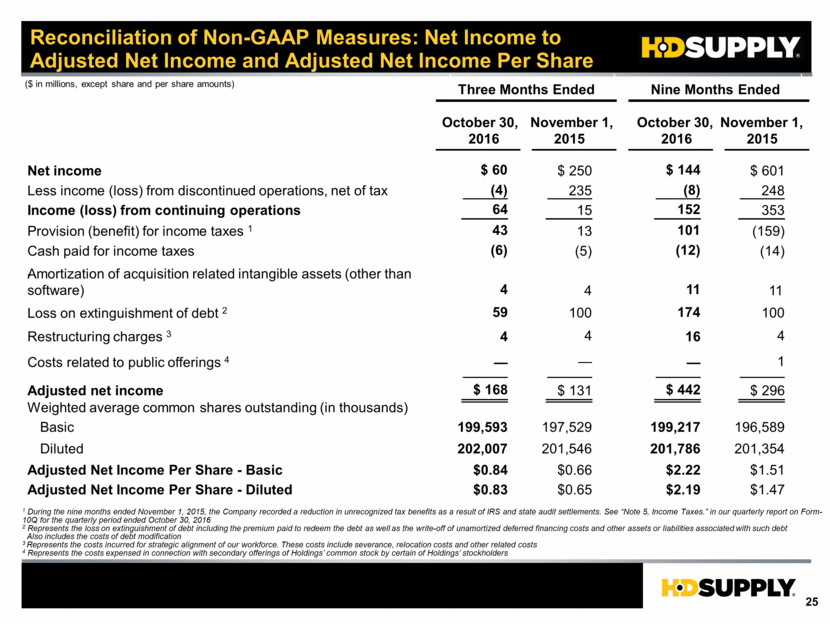
Reconciliation of Non-GAAP Measures: Net Income to Adjusted Net Income and Adjusted Net Income Per Share ($ in millions, except share and per share amounts) 1 During the nine months ended November 1, 2015, the Company recorded a reduction in unrecognized tax benefits as a result of IRS and state audit settlements. See “Note 5, Income Taxes.” in our quarterly report on Form-10Q for the quarterly period ended October 30, 2016 2 Represents the loss on extinguishment of debt including the premium paid to redeem the debt as well as the write-off of unamortized deferred financing costs and other assets or liabilities associated with such debt Also includes the costs of debt modification 3 Represents the costs incurred for strategic alignment of our workforce. These costs include severance, relocation costs and other related costs 4 Represents the costs expensed in connection with secondary offerings of Holdings’ common stock by certain of Holdings’ stockholders Weighted average common shares outstanding (in thousands) Basic Diluted Adjusted Net Income Per Share - Basic Adjusted Net Income Per Share - Diluted Net income $ 60 $ 250 Less income (loss) from discontinued operations, net of tax 235 Income (loss) from continuing operations 64 15 Provision (benefit) for income taxes 1 43 13 Cash paid for income taxes (6) (5) Amortization of acquisition related intangible assets (other than - software) Restructuring charges 3 4 4 Loss on extinguishment of debt 2 59 Adjusted net income $ 168 $ 131 Three Months Ended October 30, 2016 November 1, 2015 199,593 197,529 202,007 201,546 $0.84 $0.66 $0.83 $0.65 (4) 100 4 4 $ 144 $ 601 248 152 353 101 (159) (12) (14) 4 16 174 $ 442 $ 296 Nine Months Ended October 30, 2016 November 1, 2015 199,217 196,589 201,786 201,354 $2.22 $1.51 $2.19 $1.47 (8) 100 11 11 Costs related to public offerings 4 — — 1 —