Attached files
| file | filename |
|---|---|
| EX-32.2 - EX-32.2 - SURMODICS INC | srdx-ex322_12.htm |
| EX-32.1 - EX-32.1 - SURMODICS INC | srdx-ex321_8.htm |
| EX-31.2 - EX-31.2 - SURMODICS INC | srdx-ex312_6.htm |
| EX-31.1 - EX-31.1 - SURMODICS INC | srdx-ex311_7.htm |
| EX-23 - EX-23 - SURMODICS INC | srdx-ex23_11.htm |
| EX-21 - EX-21 - SURMODICS INC | srdx-ex21_10.htm |
| EX-12 - EX-12 - SURMODICS INC | srdx-ex12_9.htm |
| EX-10.18 - EX-10.18 - SURMODICS INC | srdx-ex1018_389.htm |
UNITED STATES
SECURITIES AND EXCHANGE COMMISSION
Washington, DC 20549
Form 10-K
ANNUAL REPORT PURSUANT TO SECTION 13 OR 15(d)
OF THE SECURITIES EXCHANGE ACT OF 1934
For the fiscal year ended September 30, 2016
Commission file number 0-23837
SURMODICS, INC.
(Exact Name of Registrant as Specified in Its Charter)
|
Minnesota |
41-1356149 |
|
(State or other jurisdiction of incorporation or organization) |
(IRS Employer Identification No.) |
|
|
|
|
9924 West 74th Street |
55344 |
|
(Address of Principal Executive Offices) |
(Zip Code) |
(Registrant’s Telephone Number, Including Area Code)
(952) 500-7000
Securities registered pursuant to Section 12(b) of the Act:
|
Title of Each Class |
Name of Exchange on Which Registered |
|
Common Stock, $0.05 par value |
NASDAQ Global Select Market |
Securities registered pursuant to Section 12(g) of the Act:
None
Indicate by check mark if the registrant is a well-known seasoned issuer, as defined in Rule 405 of the Securities Act. Yes ☐ No ☒
Indicate by check mark if the registrant is not required to file reports pursuant to Section 13 or Section 15(d) of the Act. Yes ☐ No ☒
Indicate by check mark whether the registrant: (1) has filed all reports required to be filed by Section 13 or 15(d) of the Securities Exchange Act of 1934 during the preceding 12 months (or for such shorter period that the registrant was required to file such reports), and (2) has been subject to such filing requirements for the past 90 days. Yes ☒ No ☐
Indicate by check mark whether the registrant has submitted electronically and posted on its corporate Web site, if any, every Interactive Data File required to be submitted and posted pursuant to Rule 405 of Regulation S-T (§ 232.405 of this chapter) during the preceding 12 months (or for such shorter period that the registrant was required to submit and post such files). Yes ☒ No ☐
Indicate by check mark if disclosure of delinquent filers pursuant to Item 405 of Regulation S-K is not contained herein, and will not be contained, to the best of registrant’s knowledge, in definitive proxy or information statements incorporated by reference in Part III of this Form 10-K or any amendment to this Form 10-K. ☐
Indicate by check mark whether the registrant is a large accelerated filer, an accelerated filer, a non-accelerated filer, or a smaller reporting company. See the definitions of “large accelerated filer,” “accelerated filer” and “smaller reporting company” in Rule 12b-2 of the Exchange Act. (Check one):
|
Large accelerated filer |
☐ |
Accelerated filer |
☒ |
|
|
|
|
|
|
Non-accelerated filer |
☐ (Do not check if a smaller reporting company) |
Smaller reporting company |
☐ |
Indicate by check mark whether the registrant is a shell company (as defined in Rule 12b-2 of the Exchange Act). Yes ☐ No ☒
The aggregate market value of the Common Stock held by shareholders other than officers, directors or holders of more than 5% of the outstanding stock of the registrant as of March 31, 2016 was approximately $182 million (based upon the closing sale price of the registrant’s Common Stock on such date).
The number of shares of the registrant’s Common Stock outstanding as of November 25, 2016 was 13,207,541.
DOCUMENTS INCORPORATED BY REFERENCE
Portions of the Registrant’s Proxy Statement for the Registrant’s 2017 Annual Meeting of Shareholders are incorporated by reference into Part III.
Table of Contents
|
|
|
Page |
|
|
2 |
|
|
|
|
|
|
Part I |
||
|
|
||
|
Item 1. |
3 |
|
|
|
13 |
|
|
Item 1A. |
15 |
|
|
Item 1B. |
23 |
|
|
Item 2. |
23 |
|
|
Item 3. |
24 |
|
|
Item 4. |
24 |
|
|
|
|
|
|
Part II |
||
|
|
||
|
Item 5. |
25 |
|
|
Item 6. |
27 |
|
|
Item 7. |
Management’s Discussion and Analysis of Financial Condition and Results of Operations |
27 |
|
Item 7A. |
41 |
|
|
Item 8. |
42 |
|
|
Item 9. |
Changes in and Disagreements with Accountants on Accounting and Financial Disclosure |
42 |
|
Item 9A. |
42 |
|
|
Item 9B. |
45 |
|
|
|
|
|
|
Part III |
||
|
|
||
|
Item 10. |
46 |
|
|
Item 11. |
46 |
|
|
Item 12. |
Security Ownership of Certain Beneficial Owners and Management and Related Stockholder Matters |
46 |
|
Item 13. |
Certain Relationships and Related Transactions, and Director Independence |
46 |
|
Item 14. |
46 |
|
|
|
|
|
|
Part IV |
||
|
|
||
|
Item 15. |
47 |
|
|
|
48 |
|
Forward-Looking Statements
Certain statements contained in this Form 10-K, or in other reports of the Company and other written and oral statements made from time to time by the Company, do not relate strictly to historical or current facts. As such, they are considered “forward-looking statements” that provide current expectations or forecasts of future events. These forward-looking statements are made pursuant to the safe harbor provisions of the Private Securities Litigation Reform Act of 1995. Such statements can be identified by the use of terminology such as “anticipate,” “believe,” “could,” “estimate,” “expect,” “forecast,” “intend,” “may,” “plan,” “possible,” “project,” “will” and similar words or expressions. Any statement that is not a historical fact, including estimates, projections, future trends and the outcome of events that have not yet occurred, is a forward-looking statement. The Company’s forward-looking statements generally relate to its growth and transformation strategy, including our whole-product solutions strategy, financial prospects, product development programs including development of the SurVeil® drug-coated balloon (“SurVeil DCB”), sales efforts, the impact of significant customer agreements, including its agreements with Medtronic plc (“Medtronic”) and the impact of acquisitions. You should carefully consider forward-looking statements and understand that such statements involve a variety of risks and uncertainties, known and unknown, and may be affected by inaccurate assumptions. Consequently, no forward-looking statement can be guaranteed and actual results may vary materially. The Company undertakes no obligation to update any forward-looking statement. Investors are advised not to place undue reliance upon the Company’s forward-looking statements and to consult any further disclosures by the Company on such topics in this and other filings with the Securities and Exchange Commission (“SEC”). Factors that could cause our actual results to differ from those discussed in the forward-looking statements include, but are not limited to, those described in Item 1A “Risk Factors” below.
2
Overview – General
Surmodics, Inc. and subsidiaries (referred to as “Surmodics,” the “Company,” “we,” “us,” “our” and other like terms) is a leading provider of medical device and in vitro diagnostic technologies to the healthcare industry. In fiscal 2016, our business performance continued to be driven by growth in our core Medical Device and In Vitro Diagnostics (“IVD”) businesses as well as the acquisitions of Creagh Medical Ltd. (“Creagh Medical”) and NorMedix, Inc. (“NorMedix”) in our Medical Device segment. Our mission is to improve the treatment and detection of disease by using our technology to provide solutions to difficult medical device and diagnostic challenges. Our business segments partner with many of the world’s leading and emerging medical device, diagnostic and life science companies to develop and commercialize innovative products designed to improve patient diagnosis and treatment.
The Company was organized as a Minnesota corporation in June 1979. We make available, free of charge, copies of our annual report on Form 10-K, quarterly reports on Form 10-Q, current reports on Form 8-K and amendments to those reports filed or furnished pursuant to Section 13(a) or 15(d) of the Securities Exchange Act of 1934 (the “Exchange Act”) on our website, www.surmodics.com, as soon as reasonably practicable after filing such material electronically or otherwise furnishing it to the SEC. We are not including the information on our website as a part of, or incorporating it by reference into, our Form 10-K.
The information below provides an overview of the principal products and services and principal markets for each of our two business units. For more information regarding domestic and foreign revenue and revenue by our business units, also known as our operating segments, for each of our last three fiscal years, see Note 12 to the consolidated financial statements in “Item 8. Financial Statements and Supplementary Data” in this Annual Report on Form 10-K. The discussion of other aspects of our business including research and development (“R&D,”), intellectual property, marketing and sales, future acquisition strategy, significant customers, competition, manufacturing, government regulation and our employees applies to our business in general and we describe material segment information within these sections where relevant.
Medical Device Segment
Advances in medical device technology have helped drive improved device efficacy and patient outcomes. The convergence of the pharmaceutical, biotechnology and medical device industries, often made possible by surface modification and device drug delivery technologies, presents an opportunity for major advancements in the healthcare industry. We believe the benefits of combining drugs and biologics with implantable and minimally invasive devices are becoming increasingly valuable in applications in cardiology, peripheral artery disease, ophthalmology, orthopedics and other large markets.
Stents, particularly drug-eluting stents, have significantly reduced the need for repeat intravascular procedures, and they have diminished the need for more invasive cardiac bypass surgery. Drug-coated balloons have further transformed intravascular therapies by enhancing patient outcomes while not leaving stents in the vascular system. Transcatheter heart valve repair or replacement via a minimally invasive catheter-based system has enabled the treatment of patients suffering from heart valve disease who are too ill to undergo open-heart surgery. Positive clinical outcomes and acceptance of these and other similar innovations by patients, physicians and insurance companies has helped certain segments of the United States (“U.S.”) medical device industry grow at a faster pace than the economy as a whole. The attractiveness of the industry has drawn intense competition among the companies participating in this area. In an effort to improve their existing products or develop entirely new devices, a growing number of medical device manufacturers are exploring or using surface modification and device drug delivery technologies as product differentiators or device enablers. In addition, the continuing trend toward minimally invasive surgical procedures, which often employ catheter-based delivery technologies, has increased the demand for hydrophilic (i.e., lubricious or slippery) coatings and other coating technologies.
Our Medical Device segment provides surface modification coating technologies that impart lubricity, prohealing or biocompatibility characteristics, or drug delivery capabilities, as well as vascular device, catheter and balloon design, development and manufacturing capabilities. Historically, we have provided surface modification technologies to enhance our customers’ medical devices and delivery systems. Since fiscal 2013, with our investment in our drug-coated balloon (“DCB”) platform, we have been focused on a strategy to develop and manufacture proprietary medical device products that combine our surface modification coatings with medical devices or delivery systems (“whole-product solutions”). Our aim is to provide customers earlier access to highly differentiated whole-product solutions that address unmet clinical needs, and partner with them on successful commercialization. During fiscal 2016, we made significant progress on our whole-product solutions strategy with the acquisitions of Creagh Medical and NorMedix, and initiated a first in-human early feasibility study of the Surmodics SurVeil DCB. This strategy does not change our focus
3
on our core surface modification technologies but we believe it will greatly increase our relevance in the industry, and is key to our future growth and profitability, given the prospect of capturing more revenue with whole-product solutions.
Overview of Interventional Peripheral Market and Surmodics’ Technologies
Peripheral artery disease (“PAD”) is a condition that causes a narrowing of the blood vessels supplying the extremities, most often due to plaque buildup in the arterial walls. Left untreated, PAD may lead to symptoms such as large non-healing ulcers, infections, or gangrene, and may require limb amputation or, in extreme cases, result in death.
The American Heart Association has reported that an estimated 8.5 million Americans and 202 million people worldwide are living with PAD. The number of people affected by PAD is expected to increase as a result of an aging population, coupled with increasing prevalence of conditions linked to PAD, such as diabetes and obesity. Awareness of PAD in the general population as well as among physicians, in conjunction with emphasis on PAD education, has resulted in more diagnoses and earlier detection. PAD is often treated through recommended lifestyle changes, such as diet and exercise, and by prescribing prescription drugs. However, these responses, along with being difficult and costly to maintain, do not treat the underlying obstructions. As a result, procedural intervention is often necessary to prevent or correct symptoms as they become more severe. The interventional PAD market utilizes a variety of access and therapy catheters to treat PAD. These technologies are delivered through a number of access points into the vascular system including femoral (leg), radial (wrist or arm) and pedal (foot).
A key aspect of our strategy is the acquisition of state-of-the-art medical device design, development and manufacturing capabilities to complement our leadership in surface modification coating technologies for the purpose of developing whole-product solutions for the PAD and other vascular disease markets. The Creagh Medical acquisition brings a state-of-the-art R&D and manufacturing facility offering robust extrusion, balloon-forming, top-assembly, packaging and regulatory capabilities focused on balloon catheters. The NorMedix acquisition provides ultra-thin-walled, minimally invasive catheter technologies. With these acquisitions, we now engage in contract R&D, as well as manufacturing access and therapy catheters, integrating our catheter, balloon, and surface modification technologies to design and develop proprietary products. We plan to enter into agreements with third party medical device companies who will sell our products to end users. We expect our first product to receive regulatory approval in late fiscal 2017.
Surmodics is focused on the development of drug coated balloons to treat PAD. In the first quarter of fiscal 2016, we received Investigational Device Exemption (“IDE”) approval from the U.S. Food and Drug Administration (“FDA”) to move forward with our first in-human early feasibility study using the SurVeil DCB. That study was initiated in the third quarter of fiscal 2016. The SurVeil DCB is not approved for commercial sale and treats PAD in the leg above the knee. The development of the SurVeil DCB is a major step forward in our strategy to offer whole-product solutions for the medical device industry. This approval allowed us to take the steps required to start an early feasibility clinical trial. We continue to enroll patients in the study and expect results early in calendar 2017.
Overview of Surmodics’ Surface Modification and Device Drug Delivery Technologies
We believe Surmodics is positioned to take advantage of the continuing trend of incorporating surface modification and device drug delivery technologies into the design of combination products, potentially leading to more efficient and effective products as well as new product applications. We have a growing portfolio of proprietary technologies, market expertise and insight, and unique collaborative research, development and manufacturing capabilities —key ingredients to bring innovation together for the benefit of patients, us, and the healthcare industry.
Coatings for Surface Modification and Device Drug Delivery
Key differentiating characteristics of our coating platforms are their flexibility, durability and ease of use. In terms of flexibility, coatings can be applied to many different kinds of surfaces and can immobilize a variety of chemical, pharmaceutical and biological agents. Additionally, the surface modification process can be tailored to provide customers with the ability to improve the performance of their devices by choosing the specific coating properties desired for particular applications. Our surface modification technologies also can be combined to deliver multiple surface-enhancing characteristics on the same device.
Our proprietary PhotoLink® coating technology is a versatile, easily applied, coating technology that modifies medical device surfaces by creating covalent bonds between device surfaces and a variety of chemical agents. PhotoLink coatings can impart many performance enhancing characteristics, such as advanced lubricity (slippery) and hemocompatibility (preventing blood clot formation),
4
when bound onto surfaces of medical devices or other biological materials without materially changing the dimensions or other physical properties of devices.
PhotoLink reagents can be applied to a variety of substrates. The coating formulations are easily applied to the material surface by a variety of methods including, but not limited to, dipping, spraying, roll-coating or ink-jetting. We continue to expand our portfolio of proprietary reagents for use by our customers. These reagents enable our customers to develop novel surface features for their devices, satisfying the expanding requirements of the healthcare industry. We are also continually working to expand the list of materials that are compatible with our surface modification and device drug delivery reagents. Additionally, we develop coating processes and coating equipment to meet the device quality, manufacturing throughput and cost requirements of our customers.
In terms of ease of use, the PhotoLink coating process is relatively simple and is easily integrated into the customer’s manufacturing process. In addition, the process does not subject the coated products to harsh chemical or temperature conditions, produces no hazardous byproducts, and does not require lengthy processing or curing time. Further, our PhotoLink coatings are generally compatible with accepted sterilization processes, so the surface attributes are not lost when the medical device is sterilized.
A long-standing challenge for the medical device industry has been the availability of device coatings that offer excellent lubricity without compromising durability. The properties that make coatings more lubricious—absorbing and exuding water—also can make them more susceptible to mechanical degradation. In August 2015, the FDA issued a position paper that identifies a list of characteristics that should be considered when evaluating the durability of coatings on vascular and neurological devices. Prior to the FDA communication, we launched our Serene® hydrophilic coating platform which optimizes lubricity and durability while significantly reducing particulates generation. This next-generation coating has demonstrated excellent lubricity on a wide range of substrates, and has been used on FDA-cleared coronary, peripheral and structural heart devices. Serene coatings are applied using our PhotoLink process.
Our device drug delivery coating technologies allow therapeutic drugs to be incorporated within our proprietary polymer matrices to provide controlled, site-specific release of the drug into the surrounding environment. The release of the drug can be tuned to elute quickly (within minutes to a few days) or slowly (from several months to over a year), illustrating the wide range of release profiles that can be achieved with our coating systems. On a wide range of devices, drug-eluting coatings can help improve device performance, increase patient safety and enable innovative new treatments. Examples of short term use drug delivery devices would include drug coated balloons and examples of longer term drug delivery devices would include drug eluting stents. We work with companies in the medical device and biotechnology industries to develop specialized coatings that allow for the controlled release of drugs from device surfaces. We see at least three primary areas with strong future potential: (1) improving the function of a device which itself is necessary to treat the medical condition; (2) enabling site-specific drug delivery while limiting systemic exposure; and (3) enhancing the biocompatibility of a medical device to ensure that it continues to function over a long period of time.
Clinical Benefits
|
|
• |
Device Drug Delivery. We provide drug delivery polymer technology to enable controlled, site-specific or systemic delivery of therapeutic agents. As an example, a DCB is used during angioplasty to deliver drug(s) to the vessel wall to inhibit unwanted tissue growth which could lead to re-closure of the artery, restenosis. |
|
|
• |
Lubricity. Low friction or lubricious coatings reduce the force and time required for insertion, navigation and removal of devices in a variety of minimally invasive applications. Based on internal and customer evaluations, when compared with uncoated surfaces, our PhotoLink coatings have reduced the friction on surfaces by more than 90%, depending on the surface being coated. Lubricity also reduces tissue irritation and damage caused by products such as catheters, guidewires and endoscopy devices. Further, lubricious coatings can improve deliverability of a medical device, which can enhance the physician’s ability to place a medical device in the intended site within the patient’s body. |
|
|
• |
Prohealing. Biologically based extracellular matrix (“ECM”) protein coatings for use in various applications are designed to improve and accelerate the healing of the tissue at or near the implant site through nature’s own healing mechanisms following procedures involving implantable medical devices. Certain ECM proteins, such as collagen and laminin, specifically stimulate the migration and proliferation of endothelial cells (cells that line blood vessels) to promote healing. By covalently attaching the appropriate ECM proteins to device surfaces utilizing the PhotoLink coating process, the biomimetic surface can signal endothelial cells in the blood and vascular wall to form a stable endothelial lining over the implant. We believe these prohealing coatings could help prevent late stent thrombosis (the formation of a clot on the stent 30 days to one year after implant). |
5
|
|
thereby inhibiting blood clotting on the device surface, minimizing patient risk and enhancing the performance of the device. We have also developed synthetic, non-biological coatings that provide medical device surfaces with improved blood compatibility without the use of heparin. These coatings prevent undesirable cells and proteins that lead to clot formation from adhering to the device surface. These coatings may also reduce fibrous encapsulation. |
Licensing Arrangements
We commercialize our surface modification and device drug delivery technologies primarily through licensing arrangements with medical device manufacturers. We believe this approach allows us to focus our resources on further developing new technologies and expanding our licensing activities. Many of our technologies have been designed to allow manufacturers to implement them easily into their own manufacturing processes so customers can control production and quality internally without the need to send their products to a contract manufacturer.
We generate the largest portion of our revenue through licensing arrangements. Royalties and license fees represented 46.5%, 51.3% and 52.7% of our total revenue in fiscal 2016, 2015 and 2014, respectively. Greater than 96% of our royalties and license fees revenue in this three-year period were generated from hydrophilic coating licenses. Revenue from these licensing arrangements typically includes license fees and milestone payments, minimum royalties, and royalties based on a percentage of licensees’ product sales. We also generate revenue from sales of reagent chemicals to licensees for use in their coating processes.
The licensing process begins with the customer specifying a desired product feature to be created such as lubricity or drug delivery. Because each device and coating application is unique, we routinely conduct a feasibility study to qualify each new potential product application, often generating commercial development revenue. Feasibility studies can range in duration from several months to a year. After we complete a feasibility study, our customers cannot market their product until they receive regulatory approval. As further described under the caption “Government Regulation,” the regulatory approval process varies in each country and ranges from several months to four or more years. At any time prior to a customer’s commercial launch, a license agreement may be executed granting the licensee rights to use our technology. We often support our customers by providing coating assistance for parts required in animal tests and human clinical trials. Typically, we complete a technology transfer to most customers which enables those customers to apply the coating at their own facilities.
The term of a license agreement is generally for a specified number of years or the life of our patents, whichever is longer, although a license generally may be terminated by the licensee for any reason upon 90 days’ advance written notice. In cases where the royalty obligation extends beyond the life of the applicable patent, it is because the license also includes rights to our know-how or other proprietary rights. Under these circumstances, the royalty obligation typically continues at a reduced royalty rate for a specified number of years generally following the date on which the customer’s product was first sold. We actively seek to upgrade our customers to advanced generations of our hydrophilic coating technology although there can be no assurance that we will be successful in doing so.
Our license agreements may include certain license fees and/or milestone payments. The license can be either exclusive or nonexclusive, but substantially all of our licensed applications are nonexclusive, allowing us to license technology to multiple customers. Moreover, even exclusive licenses generally are limited to a specific “field of use,” allowing us the opportunity to further license technology to other customers. The royalty rate on a substantial number of the agreements has traditionally been in the 2% to 3% range, but there are certain contracts with lower or higher rates. In certain agreements, our royalty is based on an agreed-upon amount per unit. The amount of the license fees, milestone payments, and the royalty rate are based on various factors, including the stage of development of the product or technology being licensed, whether the arrangement is exclusive or nonexclusive, the perceived value of our technology to the customer’s product, and size of the potential market. Most of our agreements also incorporate a minimum royalty to be paid by the licensee. Royalty payments generally commence one quarter after the customer’s actual product sales occur because of the delay in reporting sales by our licensees.
We have over 150 licensed product classes (customer products utilizing Surmodics technology) already in the market generating royalties and greater than 100 customer product classes incorporating our technology in various stages of pre-commercialization. We signed 18, 22 and 16 new licenses in fiscal 2016, 2015 and 2014, respectively.
Under our agreements with our customers, the responsibility for securing regulatory approval for and ultimately commercializing these products rests with our customers. Our reliance on our customers in this regard and the potential risks to our operations as a result are discussed in Item 1A “Risk Factors” of this Form 10-K. Moreover, we are often contractually obligated to keep the details concerning our customers’ R&D efforts (including the timing of expected regulatory filings, approvals and market introductions) confidential. As a result of the significant uncertainty inherent in product development and regulatory approval
6
processes, the expected timing for regulatory approval and commercialization for the product classes pending regulatory approval is can vary greatly.
Under most of our licensing agreements, we are required to keep the identity of our customers confidential unless they approve of such disclosure. Some of our licensed customers who allow the use of their name are: Abbott Laboratories (“Abbott”), Boston Scientific Corporation (“Boston Scientific”), Cook Medical, Cordis Corporation (a subsidiary of Cardinal Health, Inc.) (“Cordis”), Covidien PLC (a subsidiary of Medtronic), Edwards Lifesciences Corporation, Evalve, Inc. (a subsidiary of Abbott), ev3 Inc. (a subsidiary of Medtronic), Medtronic, OrbusNeich Medical, Inc., Spectranetics Corporation and St. Jude Medical, Inc.
In Vitro Diagnostics Segment
Our In Vitro Diagnostics (“IVD”) business unit generates revenue from sales of stabilization products, substrates, antigens and surface coatings to diagnostics customers. We manufacture or sell components for in vitro diagnostic immunoassay and molecular tests and we manufacture and sell surface coatings to the diagnostic, biomedical research, and life science markets.
Immunoassay Diagnostics. An immunoassay is a biochemical test that measures the presence or concentration of a target molecule, or “analyte”, in a biological fluid or sample. Analyte levels are correlated to the disease state or medical condition of a patient to diagnose the presence, absence or severity of disease. Analytes are typically proteins or small molecules such as hormones. Immunoassays are developed and produced using multiple components. The selection and optimization of those components confer the quality and performance of the assay in terms of sensitivity and specificity. IVD companies select these critical biochemical and reagent components to meet the clinical specifications of the assay. We develop, manufacture and sell high-performing, consistent-quality and stable immunoassay component products to enable our customers’ diagnostic tests to detect the absence or presence of disease accurately.
Molecular Diagnostics - DNA and Protein Immobilization. Both DNA and protein microarrays are useful tools for the pharmaceutical, diagnostic and research industries. During a DNA gene analysis, typically thousands of different probes need to be placed in a pattern on a surface, called a DNA microarray. These microarrays are used by the pharmaceutical industry to screen for new drugs, by genome mappers to sequence human, animal or plant genomes, or by diagnostic companies to search a patient sample for disease causing bacteria or viruses. However, DNA does not readily adhere to most surfaces. We have developed various surface chemistries for both DNA and protein immobilization. Protein microarrays are used as diagnostic and research tools to determine the presence and/or quantity of proteins in a biological sample. The most common type of protein microarray is the antibody microarray, where antibodies are spotted onto a surface and used as capture molecules for protein detection.
The sales cycle for our IVD products generally begins when an IVD company initiates the process to develop a new, or improve a current, diagnostic test. During product development, these companies will look to source the critical components of the test with reagents it produces internally or with reagents from a supplier, such as Surmodics.
As IVD tests are developed and various reagents are tested, companies will generally seek to optimize the sensitivity (reduction of false negatives), specificity (reduction of false positives), speed (time from sample to results), convenience (ideally as few steps as possible) and cost effectiveness of the test.
The time from when a company initiates the development of a test to achieving regulatory approval (e.g., PMA) or clearance of the test (e.g., 510k) can vary greatly, and depends on several factors. These factors include the disease state of the test, the relative complexity of the test, whether the test is being used as a companion diagnostic, among other factors. Upon regulatory approval or clearance, the test can be sold in the marketplace. It may take several years for the test to achieve peak market share. As such, revenue for Surmodics reagents will vary based on the commercial success of the newly launched IVD test.
Overview of In Vitro Diagnostics Products
Protein Stabilizers. We offer a full line of stabilization products for the in vitro diagnostics market. These products increase sensitivity and extend the shelf life of diagnostic tests, thereby producing more consistent assay results. Our stabilization products are ready-to-use, eliminating the preparation time and cost of producing stabilization and blocking reagents by manufacturing in-house.
Substrates. We also provide colorimetric and chemiluminescent substrates to the in vitro diagnostics market under our BioFX trademark. A substrate is the component of a diagnostic test kit that detects and signals that a reaction has taken place so that a result can be recorded. Colorimetric substrates signal a positive diagnostic result through a color change. Chemiluminescent substrates signal a positive diagnostic result by emitting light. We believe that our substrates offer a high level of stability, sensitivity and consistency.
7
Antigens. We are the exclusive distributor in the United States, Canada and Puerto Rico (and non-exclusive distributor in Japan) of DIARECT AG’s line of antigens. Because of the lack of high-quality antigens from natural sources, DIARECT produces the majority of these antigens and other components using recombinant technology.
Surface Coatings for Molecular Diagnostic Applications. We offer custom coatings for molecular diagnostic applications, including DNA, RNA and protein microarrays. Our TRIDIA™ surface coatings bind molecules to a variety of surfaces and geometries and may be customized for selectivity using passivating polymers and reactive groups. This proprietary technology immobilizes DNA and protein to adhere to testing surfaces. We offer other surface coatings that improve flow characteristics through membranes and microfluidic channels on diagnostic devices including point-of-care components.
Research and Development
Our R&D personnel work to enhance and expand our technology and product offerings in the area of drug delivery, surface modification, whole-product solutions, and in vitro diagnostics through internal scientific investigation. These scientists and engineers also evaluate external technologies in support of our corporate development activities. All of these efforts are guided by the needs of the markets in which we do business. Additionally, the R&D staff support the business development staff and business units in performing feasibility studies, providing technical assistance to potential customers, optimizing the relevant technologies for specific customer applications, supporting clinical trials, training customers, integrating our technologies and know-how into customer manufacturing operations and developing whole-product solutions that meet customers’ needs by integrating our coating, medical device and medical device delivery technologies.
In fiscal 2016, 2015 and 2014, our R&D expenses were $18.5 million, $16.2 million and $15.6 million, respectively. We intend to continue investing in R&D to advance our surface modification coatings, device drug delivery, whole-product solutions and in vitro diagnostic technologies and to expand uses for our technology platforms. We anticipate an increase in R&D expenses in fiscal 2017 primarily related to whole-product solutions product development, including our DCB activities. In addition, we continue to pursue access to products and technologies developed outside the Company, as appropriate, to complement our internal R&D efforts.
Medical Device Segment
As treatment technologies become more sophisticated and increasingly leverage minimally invasive techniques, we believe the need for improved medical devices that benefit from surface modification and device drug delivery will continue to grow. We intend to continue our development efforts to expand our capabilities in surface modification, device drug delivery and whole-product solutions to better meet these needs across multiple medical markets and to capture more of the final product value. We are doing this by developing or acquiring technologies and funding development activities which may include pre-clinical and human clinical studies.
With the acquisitions of Creagh Medical and NorMedix, we have strengthened our capabilities and broadened our capacity for R&D activities. Our state-of-the-art facility in Ballinasloe, Ireland is fully equipped for R&D and manufacturing and is focused on value-driven design and manufacture of high-quality balloon catheters. The suite of capabilities available include balloon forming, extrusion, coating and final finished product. The facility was purposefully built and equipped for medical device R&D and manufacturing with space for future growth. In the first quarter of fiscal 2017, we completed an expansion of R&D and manufacturing clean rooms as well as an analytical lab to support our whole-product solutions strategy. With the acquisition of NorMedix, we obtained a differentiated catheter-technology platform and additional design and development expertise that will enhance the value we offer our medical device customers. We plan to continue to develop surface modification coating and DCB chemistry technologies in our facilities in Eden Prairie, Minnesota. Proprietary whole-product solutions will integrate our surface modification coatings, catheter and balloon technologies and will be developed with a combined team from our U.S. and Irish facilities. Other than DCB, we plan to develop 12-15 whole-product solutions products over the next 5 years. Additional planned activities include initiation of surface modification experiments that improve medical device performance.
In fiscal 2016, we launched a single-coat formulation of our Serene hydrophilic coating. Specifically formulated for individual medical device applications, Serene Single-Coat solutions allow customers to leverage their legacy coating process to apply this surface treatment.
In fiscal 2014, we froze the design of our SurVeil DCB. We received FDA approval to commence an early feasibility study of this product in the first quarter of fiscal 2016 and are continuing enrollment in a first-in-human clinical study using the SurVeil DCB. Additional clinical trials and subsequent regulatory approvals will need to be obtained prior to commercialization of this product.
We work together with our customers to integrate the best possible surface modification and device drug delivery technologies with their products, not only to meet their performance requirements, but also to perform services quickly so that the product may reach the market ahead of the competition. To quickly solve problems that might arise during the development and optimization
8
process, we have developed extensive capabilities in analytical chemistry and surface characterization within our R&D organization. Our state-of-the-art instrumentation and extensive experience allow us to test the purity of coating reagents, to monitor the elution rate of drug from coatings, to measure coating thickness and smoothness, and to map the distribution of chemicals throughout coatings. We believe our capabilities far exceed those of our direct competitors, and sometimes even exceed those of our large-company customers.
In Vitro Diagnostics Segment
Our R&D efforts to grow our IVD business unit include identifying and addressing unmet needs that exist in the global IVD market place. Our pipeline of IVD products includes components for immunoassay and molecular diagnostic applications, such as, new protein stabilizers, detection technologies, accessory reagents and surface coatings that have the potential to add greater sensitivity, specificity, speed, convenience and lower cost for IVD test manufacturers. In fiscal 2016 we launched StabilBlock® Immunoassay Stabilizer, our most advanced stabilizer product.
Clinical Trials
In fiscal 2016, we initiated a first in-human early feasibility study of the SurVeil DCB. In connection with our whole-product solutions strategy, we plan to continue to sponsor and support clinical investigations to evaluate patient safety and clinical efficacy in support of regulatory approval or clearance for new product initiatives. We will generate the clinical data necessary to receive regulatory approval or clearance for our existing and emerging products. Clinical trials provide information about the performance and safety of a device in a controlled setting.
Patents and Proprietary Rights
Patents and other forms of proprietary rights are an essential part of Surmodics’ business. The Company aggressively pursues patent protection covering the proprietary technologies that we consider strategically important to our business. In addition to seeking patent protection in the U.S., we also generally file patent applications in European countries and, on a selective basis, other foreign countries. We strategically manage our patent portfolio so as to ensure that we have valid and enforceable patent rights protecting our technological innovations.
We protect our extensive portfolio of technologies through filing and maintaining patent rights covering a variety of coatings, drug delivery methods, reagents, and formulations, as well as particular clinical device applications. During fiscal 2016, Surmodics filed 16 original U.S. patent applications, as well as 21 international patent applications. As of September 30, 2016, Surmodics owned or had exclusive rights to 54 pending U.S. patent applications and 106 foreign patent applications. Likewise, as of the same date, Surmodics owned or had exclusive rights to 148 issued U.S. patents, and 187 international patents.
We have licensed our PhotoLink hydrophilic technology on a non-exclusive basis to a number of our customers for use in a variety of medical device surface applications, including those described above. In particular, we have 24 issued U.S. patents, 14 pending U.S. patent applications, 29 issued international patents, and 36 pending international patent applications protecting various aspects of these technologies, including compositions, methods of manufacture and methods of coating devices. The expiration dates for these patents and anticipated expiration dates of the patent applications range from 2016 to 2033. Moreover, these patents and patent applications represent distinct families, with each family generally covering a successive generation of the technology, including improvements that enhance coating performance, manufacturability, or other important features desired by our customers. Among these, the third generation of our PhotoLink technology is protected by a family of patents that expired in November 2015 (in the U.S.) and October 2016 (in certain other countries). In addition, the fourth generation of our PhotoLink technology is protected by a family of patents that is expected to expire in early fiscal 2020. As noted above in “Licensing Arrangements,” the royalty obligation in our typical license agreement is generally for a specified number of years or the life of our patents, whichever is longer. In cases where the royalty obligation extends beyond the life of the applicable patent, it is because the license also includes rights to our know-how or other proprietary rights. Under these circumstances, the royalty obligation will continue at a reduced royalty rate for a specified number of years, as determined based on the specific terms and conditions of the applicable customer agreement, the date on which the customer’s product was first sold, and other factors. In recent years, we have successfully converted a number of our customer’s products utilizing this early generation technology to one of our advanced generation technologies.
The royalty revenue associated with our third generation technology which has not yet converted, or is not in the process of converting, to one of our advanced generation technologies was approximately 17% of our fiscal 2016 revenue.
9
Approximately 24% of our total revenue in fiscal 2016 was generated from the fourth generation of our PhotoLink technology, which are protected by a family of patents that will begin to expire in fiscal 2020. Of the license agreements using our early generation technologies, most will continue to generate royalty revenue at a reduced royalty rate beyond patent expiration.
While we are actively seeking to convert our customers to one of our advanced generations of our hydrophilic coating technology, there can be no assurance that we will be successful in doing so, or that those customers that have converted, will sell products utilizing our technology which will generate earned royalty revenue for us.
We also rely upon trade secrets, trademarks and other unpatented proprietary technologies. We seek to maintain the confidentiality of such information by requiring employees, consultants and other parties to sign confidentiality agreements and by limiting access by parties outside the Company to such information. There can be no assurance, however, that these measures will prevent the unauthorized disclosure or use of this information, or that others will not be able to develop independently such information. Additionally, there can be no assurance that any agreements regarding confidentiality and non-disclosure will not be breached, or, in the event of any breach, that adequate remedies would be available to us.
Marketing and Sales
We market our technologies and products throughout the world using a team of dedicated business development professionals who focus on specific markets and target companies. These sales professionals working within our Medical Device business work in concert with business unit personnel to coordinate customer activities. The specialization of our sales professionals fosters an in-depth knowledge of the issues faced by our customers within these markets such as industry trends, technology changes, biomaterial changes and the regulatory environment. With respect to our diagnostics products, we enter into sales and marketing relationships with third parties to distribute those products around the world. We also offer those products for sale through our website. See Note 12 to the consolidated financial statements in “Item 8. Financial Statements and Supplementary Data” in this Annual Report on Form 10-K for information regarding domestic and foreign revenue.
To support our marketing and sales activities, we publish technical literature on our various surface modification, drug delivery, and in vitro diagnostics technologies and products. In addition, we exhibit at major trade shows and technical meetings, advertise in selected trade journals and through our website, and conduct direct mailings to appropriate target markets.
We also offer ongoing customer service and technical support to our customers. This service and support may begin with a feasibility study, and also may include additional services such as assistance in the transfer of the technology to the customer, further optimization, process control and troubleshooting, preparation of product for clinical studies, and assistance with regulatory submissions for product approval. Some of these services are billable to customers, mainly feasibility and optimization activities.
While our recent acquisitions of Creagh Medical and NorMedix have strengthened our development and manufacturing capability and capacity, it does not change our business model of working with medical device customers. Our offerings are expanding as we now have the capabilities to support our customers from design and development through manufacturing and commercialization. Our aim is to provide our customers earlier access to highly differentiated products that address important unmet clinical needs, and partner with them on successful commercialization of these products.
Acquisitions
To further our strategic objectives and strengthen our existing businesses, we intend to continue to explore acquisitions and strategic collaborations to diversify and grow our business. As a result, we expect to make future acquisitions where we believe that we can broaden or enhance our technology offerings and expand our sources of revenue and the number of markets in which we participate. Mergers and acquisitions of medical and diagnostic technology companies are inherently risky, and no assurance can be given that any of our previous or future acquisitions will be successful or will not materially adversely affect our consolidated results of operations, financial condition, or cash flows.
Significant Customers
Revenue from Medtronic represented approximately 25% of our total revenue for the year ended September 30, 2016 and was generated from multiple products and fields of use. The percentage of revenue from Medtronic decreased in fiscal 2016 as our customer base was diversified with the acquisitions of Creagh Medical and NorMedix. No other customer provided more than 6% of our consolidated revenue in fiscal 2016.
10
Medical Device Segment
We believe that the intense competition within the medical device market creates opportunities for our technologies as medical device manufacturers seek to differentiate their products through new enhancements or to remain competitive with enhancements offered by other manufacturers. Following our recent acquisitions of Creagh Medical and NorMedix, we plan to market our whole-product solutions to medical device companies that will leverage their existing sales force. Our core balloon and catheter capabilities compete with larger original equipment manufacturer (OEM) suppliers, as well as some of our largest medical device partners that have in-house resources to produce balloons and catheters. We seek to provide differentiated whole-product solutions that integrate our surface modification, catheter, balloon and other proprietary technologies.
Because a significant portion of our revenue depends on the receipt of royalties based on sales of medical devices incorporating our technologies, we are also affected by competition within the markets for such devices. As we typically seek to license our surface modification coating technologies on a non-exclusive basis, we benefit by offering our technologies to multiple competing manufacturers of a device. However, competition in the medical device market could also have an adverse effect on us. While we seek to license our products to established manufacturers, in certain cases, our surface modification licensees may compete directly with larger, dominant manufacturers with extensive product lines and greater sales, marketing and distribution capabilities. We also are unable to control other factors that may impact commercialization of our whole-product solutions and licensees with medical devices that utilize our surface modification coatings, such as regulatory approval, marketing and sales efforts of our customers and licensees or competitive pricing pressures within the particular market. There can be no assurance that products employing our technologies will be successfully commercialized by our licensees and whole-product solutions customers or that they will otherwise be able to compete effectively. Many of our existing and potential competitors have greater financial, technical and marketing resources than we have.
The ability for surface modification and device drug delivery technologies to improve the performance of medical devices and drugs and to enable new product categories has resulted in increased competition in these markets. Some of our competitors offer device drug delivery technologies, while others specialize in lubricious or hemocompatible coating technology. Some of these companies target cardiovascular, peripheral or other medical device applications. In addition, because of the many product possibilities afforded by surface modification technologies, many of the large medical device manufacturers have developed, or are engaged in efforts to develop, internal competency in the area of surface modification and device drug delivery.
We attempt to differentiate ourselves from our competitors by providing what we believe is a high value-added approach to drug delivery and surface modification technology. We believe that the primary factors customers consider in choosing a particular technology include performance (e.g., flexibility, ability to fine tune drug elution profiles, biocompatibility, etc.), ease of manufacturing, time-to-market, intellectual property protection, ability to produce multiple products from a single process, compliance with manufacturing regulations, ability to manufacture clinical and commercial products, customer service and total cost of goods (including manufacturing process labor). We believe our technologies deliver exceptional performance in these areas, allowing us to compete favorably with respect to these factors. We believe that the cost and time required to obtain the necessary regulatory approvals significantly reduces the likelihood of a customer changing the manufacturing process it uses once a device or drug has been approved for sale.
In Vitro Diagnostics Segment
Competition in the diagnostics market is highly fragmented. In the product lines in which we compete (protein stabilization reagents, substrates, recombinant autoimmune antigens and surface chemistry technologies), we face an array of competitors ranging from large manufacturers with multiple business lines to small manufacturers that offer a limited selection of products. Some of our competitors have substantially more capital resources, marketing experience, R&D resources and production facilities than we do. We believe that our products compete on performance, stability (shelf life), sensitivity (lower levels detected, faster results), consistency and price. We believe that our continued competitive success will depend on our ability to gain market share, to develop or acquire new proprietary products, obtain patent or other protection for our products and successfully market our products directly or through partners.
Manufacturing
We manufacture our surface modification and drug delivery reagents, and our IVD products in our Eden Prairie, Minnesota facility. In certain limited circumstances, we also provide contract manufacturing services for our customers, including, for example, coating their medical devices that are intended for pre-clinical and clinical development (including human clinical trials), and products
11
that are sold for commercial use by our customers. Our state-of-the-art facility in Ballinasloe, Ireland is fully equipped for value-driven design and manufacture of high-quality balloon catheters and offers a suite of capabilities, including balloon forming, extrusion, coating and top assembly. In the first quarter of fiscal 2017, we completed an expansion of R&D and manufacturing clean rooms as well as analytical labs to support our whole-product solutions strategy. The facility was purposefully built and equipped for medical device R&D and manufacturing with space for future growth.
We attempt to maintain multiple sources of supply for the key raw materials used to manufacture our products. We do, however, purchase some raw materials from single sources, but we believe that additional sources of supply are readily available. Further, to the extent additional sources of supply are not readily available, we believe that we could manufacture such raw materials.
We follow quality management procedures in accordance with applicable regulations and guidance for the development and manufacture of materials and device, biotechnology or combination products that support clinical trials and commercialization. In an effort to better meet our customers’ needs in this area, our Eden Prairie, Minnesota facility is certified to ISO 13485 and ISO 9001. Our facility in Ballinasloe, Ireland is certified to ISO 13485. Each of these facilities is registered with the U.S. FDA as a “Contract Manufacturer.”
Government Regulation
The medical devices, IVD and biotechnology products incorporating our technologies are required to undergo long, expensive and uncertain regulatory review processes that are governed by the U.S. FDA and other international regulatory authorities. New medical devices utilizing our surface modification coating technologies can only be marketed in the U.S. after a 510(k) application has been cleared or a pre-market approval application (“PMA”) has been approved by the FDA. This process can take anywhere from several months (e.g., for medical device products seeking regulatory approval under the 510(k) approval process) to several years (e.g., for medical device products seeking regulatory approval under the PMA approval process). With respect to our customers’ products that incorporate our technologies, the burden of securing regulatory approval typically rests with our customers as the medical device manufacturers. During fiscal 2016 and 2015, Surmodics had multiple customers obtain regulatory clearance on medical devices incorporating our Serene coating platform. With respect to our whole-product solutions, including the SurVeil DCB, the burden of securing regulatory approval will rest on us unless we partner with other organizations to pursue such approval.
In support of our customers’ regulatory filings, we maintain various confidential Device Master Files with the FDA and provide technical information to other regulatory agencies outside the U.S. regarding the nature, chemical structure and biocompatibility of our reagents. Our licensees generally do not have direct access to these files. However, they may, with our permission, reference these files in their various regulatory submissions to these agencies. This approach allows regulatory agencies to understand in confidence the details of our technologies without us having to share this highly confidential information with our customers.
U.S. legislation allows companies, prior to obtaining FDA clearance or approval to market a medical product in the U.S., to manufacture medical products in the U.S. and export them for sale in international markets. This generally allows us to realize earned royalties sooner. However, sales of medical products outside the U.S. are subject to international requirements that vary from country to country. The time required to obtain approval for sale internationally may be longer or shorter than that required by the FDA.
Employees
As of November, 2016, we had 219 employees. Of these employees we employ 72 outside the U.S., primarily in R&D and manufacturing operations functions. We are not a party to any collective bargaining agreements.
We believe that our future success will depend in part on our ability to attract and retain qualified technical, management and marketing personnel. We are committed to developing and providing our employees opportunities to contribute to our growth and success.
12
EXECUTIVE OFFICERS OF THE REGISTRANT
As of December 2, 2016, the names, ages and positions of the Company’s executive officers are as follows:
|
Name |
|
Age |
|
Position |
|
Gary R. Maharaj |
|
53 |
|
President and Chief Executive Officer |
|
Timothy J. Arens |
|
49 |
|
Vice President of Corporate Development and Strategy |
|
Thomas A. Greaney |
|
50 |
|
Executive Vice President of Medical Devices |
|
Andrew D. C. LaFrence |
|
53 |
|
Vice President of Finance and Information Systems and Chief Financial Officer |
|
Charles W. Olson |
|
52 |
|
Senior Vice President of Commercial and Business Development, Medical Devices |
|
Bryan K. Phillips |
|
45 |
|
Senior Vice President, Legal and Human Resources, General Counsel and Secretary |
|
Joseph J. Stich |
|
51 |
|
Vice President and General Manager, In Vitro Diagnostics |
|
Gregg S. Sutton |
|
57 |
|
Vice President of Research and Development |
Gary R. Maharaj joined the Company in December 2010 as President and Chief Executive Officer and was also appointed to the Surmodics Board of Directors at such time. Prior to joining Surmodics, Mr. Maharaj served as President and Chief Executive Officer of Arizant Inc., a provider of patient temperature management systems in hospital operating rooms, from 2006 to 2010. Previously, Mr. Maharaj served in several senior level management positions for Augustine Medical, Inc. (predecessor to Arizant Inc.) from 1996 to 2006, including Vice President of Marketing, and Vice President of Research and Development. During his approximately 30 years in the medical device industry, Mr. Maharaj has also served in various management and research positions for the orthopedic implant and rehabilitation divisions of Smith & Nephew, PLC. Mr. Maharaj holds an M.B.A. from the University of Minnesota’s Carlson School of Management, an M.S. in biomedical engineering from the University of Texas at Arlington and the University of Texas Southwestern Medical Center at Dallas, and a B.Sc. in Physics from the University of the West Indies.
Timothy J. Arens joined the Company in February 2007 as Director, Business Development and became Senior Director of Financial Planning and Analysis and General Manager, In Vitro Diagnostics in October 2010. He was promoted to Vice President of Finance and Interim Chief Financial Officer in August 2011 and in February 2013 became Vice President Corporate Development and Strategy. Prior to joining Surmodics, Mr. Arens was employed at St. Jude Medical, Inc., a medical technology company, from 2003 to 2007, in positions of increasing responsibility related to business development and strategic planning functions. Mr. Arens received a B.S. degree in Finance from the University of Wisconsin Eau Claire in 1989 and an M.B.A. degree from the University of Minnesota’s Carlson School of Management in 1996.
Thomas A. Greaney joined the Company in November 2015 as Vice President of Operations and General Manager of Creagh Medical, after we acquired it. In August 2016 Mr. Greaney was promoted to Executive Vice President of Medical Devices. Prior to joining Surmodics he served as Chief Executive Officer for Creagh Medical, from September 2005 to November 2015. Prior to his tenure in Creagh Medical, Mr. Greaney served in a variety of roles with Boston Scientific for 10 years including the world-wide operations responsibility for the Taxus Stent commercialization. From 1989 to 1995 he worked for a number of Electronics companies in a variety of engineering and management roles. Mr. Greaney received a B.E in Industrial Engineering in 1988 and a post grad Diploma in Quality Assurance in 1989 both from the National University of Ireland Galway.
Andrew D. C. LaFrence joined the Company in February 2013 as Vice President of Finance and Chief Financial Officer and was also named Vice President of Information Systems in August 2016. Prior to joining Surmodics, he served as Chief Financial Officer for CNS Therapeutics, which developed and marketed pharmaceuticals for site-specific drug delivery to the central nervous system, from January 2011 to January 2013. Prior to joining CNS, Mr. LaFrence served as interim Chief Financial Officer of International Green Power from July 2010 to January 2011. Mr. LaFrence has over 30 years of financial and management experience including 26 years at KPMG LLP where, from 1996 to 2010, he was an audit partner focusing on supporting venture-backed, high-growth medical technology, pharmaceutical, biotech and clean tech private and public companies. Mr. LaFrence is a certified public accountant and received a bachelor's degree in accounting and a minor in business administration from Illinois State University in 1984.
Charles W. Olson joined the Company in July 2001 as Market Development Manager, was promoted in December 2002 to Director, Business Development, named General Manager of the Hydrophilic Technologies business unit in April 2004, and promoted to Vice President and General Manager, Hydrophilic Technologies in October 2004. In April 2005, the position of Vice President, Sales was added to his responsibilities. In November 2008, Mr. Olson was named Vice President of our Cardiovascular business unit, in October 2010, he was named Senior Vice President and General Manager, Medical Device, and in August 2016 he was named Senior
13
Vice President of Commercial and Business Development, Medical Devices. Prior to joining Surmodics, Mr. Olson was employed as General Manager at Minnesota Extrusion from 1998 to 2001 and at Lake Region Manufacturing in project management and technical sales from 1993 to 1998. Mr. Olson received a B.S. degree in Marketing from Winona State University in 1987.
Bryan K. Phillips joined the Company in July 2005 as Patent Counsel and Assistant General Counsel. In January 2006, Mr. Phillips was appointed Corporate Secretary, and he was promoted to Deputy General Counsel in October 2007. He was promoted to Vice President, General Counsel and Corporate Secretary in September 2008 and was promoted to Senior Vice President in October 2010. In August 2011, he became Senior Vice President, Legal and Human Resources, General Counsel and Secretary. Prior to joining Surmodics, Mr. Phillips served as patent counsel at Guidant Corporation’s Cardiac Rhythm Management Group where he was responsible for developing and implementing intellectual property strategies and also for supporting the company’s business development function. He also practiced law at the Minneapolis-based law firm of Merchant & Gould P.C. Mr. Phillips received a B.S. degree in Mechanical Engineering from the University of Kansas in 1993 and a law degree from the University of Minnesota Law School in 1999. He is admitted to the Minnesota bar and is registered to practice before the U.S. Patent and Trademark Office.
Joseph J. Stich joined the Company in March 2010 as Vice President of Marketing, Corporate Development and Strategy. In August 2011, he became Vice President, Business Operations and General Manager, In Vitro Diagnostics and in September 2013 his role was adjusted to Vice President and General Manager, In Vitro Diagnostics. Before joining Surmodics, Mr. Stich was Vice President of Corporate Development for Abraxis BioScience, LLC, a biotechnology company focused on oncology therapeutics, from 2009 to 2010. Prior to joining Abraxis, he was a Vice President for MGI Pharma, Inc., a biopharmaceutical company, from 2005 to 2009. Mr. Stich’s prior experience also includes serving as President/COO of Pharmaceutical Corp. of America (a subsidiary of Publicis Healthcare Specialty Group), and positions of increasing responsibility in sales and marketing at Sanofi-Aventis Pharmaceuticals. He received a B.B.A. degree from the University of Wisconsin — Whitewater in 1988, and an M.B.A. degree from Rockhurst University in Kansas City, Missouri in 1996.
Gregg S. Sutton joined the Company in January 2016 as Vice President of Research and Development. Prior to joining Surmodics, he served as President and CEO of NorMedix, Inc., which we acquired in fiscal 2016, since June 2009. Mr. Sutton is a veteran medical device designer and developer with over 25 years of engineering experience in the medical device industry. He co-founded and held executive positions at several highly successful, early-stage development device companies, including Atritech, Angioguard, Vascular Solutions, and Navarre Biomedical, leading teams in development and launch of high-profile, first-of-their-kind devices. With a degree in mechanical engineering and over 50 patents granted, he has substantial experience in all aspects of medical device development, including intellectual property, design, product development, and manufacturing.
The executive officers of the Company are elected by and serve at the discretion of the Board of Directors. None of our executive officers are related to any other executive officer or any of our directors.
14
RISKS RELATING TO OUR BUSINESS, STRATEGY AND INDUSTRY
The loss of, or significant reduction in business from, one or more of our major customers could significantly reduce our revenue, earnings or other operating results.
A significant portion of our revenue is derived from a relatively small number of customers. We have one customer that provided more than 10% of our revenue in fiscal 2016. Revenue from Medtronic represented approximately 25% of our total revenue for the fiscal year ended September 30, 2016 and was generated from multiple products and fields of use. The loss of Medtronic or any of our largest customers, or reductions in business from them, could have a material adverse effect on our business, financial condition, results of operations, and cash flow. There can be no assurance that revenue from any customer will continue at their historical levels. If we cannot broaden our customer base, we will continue to depend on a small number of customers for a significant portion of our revenue.
The long-term success of our business may suffer if we are unable to expand our licensing base.
We intend to continue pursuing a strategy of licensing our technologies to a diversified base of medical device and other customers, thereby expanding the commercialization opportunities for our technologies. A significant portion of our revenue is derived from customer devices used in connection with procedures in cardiovascular, peripheral vascular and other applications. As a result, our business is susceptible to adverse trends in procedures. Further, we may also be subject to adverse trends in specific markets such as the cardiovascular industry, including declines in procedures using our customers’ products as well as declines in average selling prices from which we earn royalties. Our success will depend, in part, on our ability to attract new licensees, to enter into agreements for additional applications with existing licensees and to develop technologies for use in applications outside of cardiovascular. There can be no assurance that we will be able to identify, develop and adapt our technologies for new applications in a timely and cost-effective manner; that new license agreements will be executed on terms favorable to us; that new applications will be accepted by customers in our target markets; or that products incorporating newly licensed technology, including new applications, will gain regulatory approval, be commercialized or gain market acceptance. Delays or failures in these efforts could have an adverse effect on our business, financial condition and results of operations.
Surface modification, device drug delivery and medical device products are competitive markets and carry the risk of technological obsolescence and we face increased competition in our In Vitro Diagnostics segment.
We operate in a competitive and evolving field, and new developments are expected to continue at a rapid pace. Our success depends, in part, upon our ability to maintain a competitive position in the development of technologies and products in the field of surface modification and device drug delivery. Our surface modification and device drug delivery technologies compete with technologies developed by a number of other companies. In addition, many medical device manufacturers have developed, or are engaged in efforts to develop, drug delivery or surface modification technologies for use on their own products. With respect to commercialization of our whole-product solutions, we expect to face competitive pricing pressures from larger OEM suppliers, as well as some of our largest medical device partners that have in-house resources that produce similar products. Some of our existing and potential competitors (especially medical device manufacturers pursuing coating solutions through their own R&D efforts) have greater financial and technical resources and production and marketing capabilities than us. Competitors may succeed in developing competing technologies or obtaining governmental approval for products before us. Products incorporating our competitors’ technologies may gain market acceptance more rapidly than products using ours. Developments by competitors may render our existing and potential products uncompetitive or obsolete. Furthermore, there can be no assurance that new products or technologies developed by others, or the emergence of new industry standards, will not render our products or technologies or licensees’ products incorporating our technologies uncompetitive or obsolete. Any new technologies that make our drug delivery, surface modification or In Vitro Diagnostics technologies less competitive or obsolete would have a material adverse effect on our business, financial condition and results of operations.
We may not be successful in implementing our whole-products solutions strategy and related important strategic initiatives
Since fiscal 2013, with our investment in our DCB platform, we have been focused on a key growth strategy for our medical device business by expanding to offer whole-product solutions to our medical device customers. Our aim is to provide customers earlier access to highly differentiated whole-product solutions that address unmet clinical needs, and partner with them on successful commercialization. Pursuing our growth strategies has resulted in, and will continue to result in, substantial demands on our resources and management’s time.
15
Successfully implementing our whole-products solutions strategy and related strategic initiatives will require, among other things:
|
|
• |
continued enhancement of our medical device R&D capabilities, including those needed to support the clinical evaluation and regulatory approval for our whole-product solutions; |
|
|
• |
effective coordination and integration of our research facilities and teams, particularly those located in different facilities; |
|
|
• |
successful hiring and training of personnel; |
|
|
• |
effective management of a business geographically distributed both in the United States and Ireland; |
|
|
• |
development of customer relationships with third party medical device distributors that will sell our products to end users; |
|
|
• |
sufficient liquidity; and |
|
|
• |
increased marketing and sales-support activities. |
There is no assurance that we will be able to successfully implement our transformation strategy and related strategic initiatives in accordance with our expectations, which may result in an adverse impact on our business and financial results.
Failure to identify acquisition opportunities or to integrate acquired businesses into our operations successfully may limit our growth.
An important part of our growth in the future may involve the acquisition of complementary businesses or technologies. Our identification of suitable acquisition candidates involves risks inherent in assessing the technology, value, strengths, weaknesses, overall risks and profitability, if any, of acquisition candidates. We may not be able to identify suitable acquisition candidates, or we may be unable to execute acquisitions due to competition from buyers with more resources. If we do not make suitable investments and acquisitions, we may find it more difficult to realize our growth objectives.
The process of integrating acquired businesses into our operations, including those acquired during our fiscal 2016, poses numerous risks, including:
|
|
• |
an inability to assimilate acquired operations, personnel, technology, information systems, and internal control systems and products; |
|
|
• |
a lack of understanding of tax, legal and cultural differences; |
|
|
• |
diversion of management’s attention, including the need to manage several remote locations with a limited management team; |
|
|
• |
difficulties and uncertainties in transitioning the customers or other business relationships from the acquired entity to us; and |
|
|
• |
the loss of key employees of acquired companies. |
In addition, future acquisitions by us may be dilutive to our shareholders, and cause large one-time expenses or create goodwill or other intangible assets that could result in significant asset impairment charges in the future. In addition, if we acquire entities that have not yet commercialized products but rather are developing technologies for future commercialization, our earnings per share may fluctuate as we expend significant funds for continued R&D efforts necessary to commercialize such acquired technology. We cannot guarantee that we will be able to successfully complete any acquisitions or that we will realize any anticipated benefits from acquisitions that we complete.
16
Our failure to expand our management systems and controls to support anticipated growth or integrate acquisitions could seriously harm our operating results and business.
Our operations are expanding, and we expect this trend to continue as we execute our business strategy. Executing our business strategy has placed significant demands on management and our administrative, development, operational, information technology, manufacturing, financial and personnel resources. Accordingly, our future operating results will depend on the ability of our officers and other key employees to continue to implement and improve our operational, development, customer support and financial control systems, and effectively expand, train and manage our employee base. Otherwise, we may not be able to manage our growth successfully.
Goodwill or other assets on our balance sheet may become impaired, which could have a material adverse effect on our operating results.
We have a significant amount of goodwill and intangible assets on our balance sheet in connection with our acquisitions. As of September 30, 2016, we had $26.6 million of goodwill and an indefinite-lived trademark intangible asset on our consolidated balance sheet related to our Medical Device and IVD segments, of which $18.5 million related to our fiscal 2016 acquisitions. As required by the accounting guidance for non-amortizing intangible assets, we evaluate at least annually the potential impairment of the goodwill and trademark. Testing for impairment of non-amortizing intangible assets involves the determination of the fair value of our reporting units. The estimation of fair values involves a high degree of judgment and subjectivity in the assumptions used. We also evaluate other assets on our balance sheet, including strategic investments and intangible assets, whenever events or changes in circumstances indicate that their carrying value may not be recoverable. Our estimate of the fair value of the assets may be based on fair value appraisals or discounted cash flow models using various inputs. Future impairment of the goodwill or other assets on our balance sheet could materially adversely affect our results of operations.
Research and development costs may adversely affect our operating results.
The success of our business depends on a number of factors, including our continued research and development of new technologies for future commercialization. In recent years, we have expended considerable resources researching and developing our DCB platform. In fiscal 2017, we expect to continue the clinical evaluation of the SurVeil DCB which may result in significant costs to us. In researching and developing such new technologies, we may incur significant expenses that may adversely affect our operating results, including our profitability. Additionally, these activities are subject to risks of failure that are inherent in the development of new medical technologies or products. There can be no assurance that we will be successful in developing new technologies or products, or that any such technology will be commercialized.
We recognize revenue in accordance with various complex accounting standards, and changes in circumstances or interpretations may lead to accounting adjustments.
Our revenue recognition policies involve application of various complex accounting standards, including accounting guidance associated with revenue arrangements with multiple deliverables. Our compliance with such accounting standards often involves management’s judgment regarding whether the criteria set forth in the standards have been met such that we can recognize as revenue the amounts that we receive as payment for our products or services. We base our judgments on assumptions that we believe to be reasonable under the circumstances. However, these judgments, or the assumptions underlying them, may change over time. In addition, the SEC or the Financial Accounting Standards Board (“FASB”) may issue new positions or revised guidance on the treatment of complex accounting matters. Changes in circumstances or third-party guidance could cause our judgments to change with respect to our interpretations of these complex standards, and transactions recorded, including revenue recognized, for one or more prior reporting periods, could be adversely affected.
As described below in “Part II, Item 7 Management’s Discussion and Analysis of Financial Condition and Results of Operations.”, the FASB issued new revenue recognition guidance for recognizing revenue from contracts with customers in May 2014. We are currently evaluating the impact that the adoption of this standard will have on our business model and consolidated results of operations, cash flows and financial position. We currently believe the impact may be material due to the potential acceleration of minimum license fees and a one quarter acceleration of royalty revenue pursuant to our hydrophilic license agreements.
We have identified a material weakness in our internal control over financial reporting. If we do not maintain effective internal control over financial reporting, our operating results could require material modification and our financial reports may not be reliable.
17
As described below in “Part II, Item 9A. Controls and Procedures.”, a material weakness related to the design and operating effectiveness of our transactional and review controls related to recognition of royalty revenue existed as of September 30, 2015. This material weakness was not remediated as of September 30, 2016, given that the additional controls have not operated for an appropriate amount of time to determine their operational effectiveness. The Company conducted an evaluation under the supervision and with the participation of the Company’s management, including the Company’s Chief Executive Officer and Chief Financial Officer regarding the effectiveness of the design and operation of the Company’s disclosure controls and procedures pursuant to Rule 13a-15(b) of the Exchange Act. Based upon that evaluation and because of the material weakness noted above, the Chief Executive Officer and Chief Financial Officer concluded that the Company’s disclosure controls and procedures were not effective as of September 30, 2016.
Although we are committed to continuing to improve our internal control processes to ensure the adequacy of the internal controls over financial reporting, any control system, regardless of how well designed, operated and evaluated, can provide only reasonable, not absolute, assurance that its objectives will be met. Therefore, we cannot be certain that, in the future, additional material weaknesses or significant deficiencies will not exist or otherwise be discovered. If our efforts to address the material weakness identified are not successful, or if other deficiencies occur, these weaknesses or deficiencies could result in misstatements of our results of operations, a restatement of our financial statements for one or more prior periods, a decline in our stock price and investor confidence or other material effects on our business, reputation, results of operations, financial condition or liquidity.
With our acquisition of Creagh Medical, we have expanded our business to include foreign operations which exposes us to certain risks related to fluctuations in currency exchange rates.
In a period where the U.S. dollar is strengthening or weakening as compared to the Euro, our revenue and expenses denominated in the Euro are translated into U.S. dollars at a lower or higher value than they would be in an otherwise constant currency exchange rate environment. In addition, we have Euro-denominated contingent consideration liabilities that are subject to exchange rate fluctuations, which are scheduled to be paid in the first quarter of our fiscal 2019. We do not believe the effects of exchange rate fluctuations will be material to our fiscal 2017 operating results, but as our foreign operations expand, the effects may become material.
RISKS RELATING TO OUR OPERATIONS AND RELIANCE ON THIRD PARTIES
We rely on third parties to market, distribute and sell most products incorporating our technologies.
A principal element of our business strategy is to enter into licensing arrangements with medical device and other companies that manufacture products incorporating our technologies. For the fiscal years ended September 30, 2016, 2015 and 2014, we have derived 47%, 51%, and 53%, respectively, from royalties and license fees. Although we do market certain diagnostic products and reagents, we do not currently market, distribute or sell our own medical devices or diagnostic immunoassay or molecular tests to end users, nor do we intend to do so in the foreseeable future. Thus, our prospects are greatly dependent on the receipt of royalties from licensees of our technologies. The amount and timing of such royalties are, in turn, dependent on the ability of our licensees to gain successful regulatory approval for, market and sell products incorporating our technologies. Failure of certain licensees to gain regulatory approval or market acceptance for such products, or failure of third parties to sell whole-products solutions to third parties all of which are outside of our control, could have a material adverse effect on our business, financial condition and results of operations.
Our customers market and sell (and most manufacture) the products incorporating our licensed technologies. If one or more of our licensees fail to pursue the development or marketing of these products as planned, or if they modify their products in a way such that the products no longer incorporate our technology, our revenue and profits may not reach our expectations, or may decline. Additionally, our ability to generate positive operating results in connection with the achievement of development or commercialization milestones may also suffer. We do not control the timing and other aspects of the development or commercialization of products incorporating our licensed technologies because our customers may have priorities that differ from ours or their development or marketing efforts may be unsuccessful, resulting in delayed or discontinued products. Hence, the amount and timing of revenue we derive from our customers’ R&D as well as royalty payments received by us will fluctuate, and such fluctuations could have a material adverse effect on our business, financial condition and results of operations.
Under our standard license agreements, licensees can terminate the license for any reason upon 90 days’ prior written notice. Existing and potential licensees have no obligation to deal exclusively with us in obtaining drug delivery or surface modification technologies and may pursue parallel development or licensing of competing technological solutions on their own or with third parties.
18
A decision by a licensee to terminate its relationship with us could materially adversely affect our business, financial condition and results of operations.
A portion of our IVD business relies on distribution agreements and relationships with various third parties and any adverse change in those relationships could result in a loss of revenue and harm that business.
We sell many of our IVD products outside of the United States through distributors. Some of our distributors also sell our competitors’ products, and if they favor our competitors’ products for any reason, they may fail to market our products as effectively or to devote resources necessary to provide effective sales, which would cause our results to suffer. Additionally, we serve as the exclusive distributor in the United States, Canada and Puerto Rico for DIARECT AG for its recombinant and native antigens. The success of these arrangements with these third parties depends, in part, on the continued adherence to the terms of our agreements with them. Any disruption in these arrangements will adversely affect our financial condition and results of operations.
We rely on our customers to accurately report and make payments under our agreements with them.
We rely on our customers to determine whether the products that they sell are royalty-bearing and, if so, report and pay the amount of royalties owed to us under our agreements with them. The majority of our license agreements with our customers give us the right to audit their records to verify the accuracy of their reports to us. However, these audits can be expensive, time-consuming and possibly detrimental to our ongoing business relationships with our customers. While we have undertaken audits of certain of our customers in the past, we generally rely on the accuracy of the reports that they provide to us.
Inaccuracies in these reports has resulted in and could result in another overpayment or underpayment of royalties, which could have a material adverse effect on our business, financial condition and results of operations.
We have limited or no redundancy in our manufacturing facilities, and we may lose revenue and be unable to maintain our customer relationships if we lose our production capacity.
We manufacture all of our Medical Device coating reagents (and provide coating manufacturing services for certain customers) and our IVD products at our Eden Prairie, Minnesota facility. As a result of our acquisition of Creagh Medical we also manufacture balloon catheter products at our facility in Ballinasloe, Ireland. Similarly, as a result of our acquisition of NorMedix we now manufacture catheter-based medical devices in limited quantities in Plymouth, Minnesota. If our existing production facilities becomes incapable of manufacturing products for any reason, we may be unable to meet production requirements, we may lose revenue and we may not be able to maintain our relationships with our customers, including certain of our licensees. In particular, because most of our customers use our coating reagents to manufacture their own products that generate royalty revenue for us, failure by us to supply these reagents could result in decreased royalty revenue, as well as decreased revenue from the sale of products. Without our existing production facilities, we would have no other means of manufacturing products until we were able to restore the manufacturing capability at these facilities or develop one or more alternative manufacturing facilities. Although we carry business interruption insurance to cover lost revenue and profits in an amount we consider adequate, this insurance does not cover all possible situations. In addition, our business interruption insurance would not compensate us for the loss of opportunity and potential adverse impact on relations with our existing customers resulting from our inability to produce products for them.
We may face product liability claims related to participation in clinical trials or the use or misuse of our products.
The development and sale of medical devices and component products involves an inherent risk of product liability claims. In most cases our customer license agreements provide indemnification against such claims arising from the sale of medical device products that utilize our coatings. However, there can be no guarantee that product liability claims will not be filed against us for such products, or for medical device products that we manufacture as part of our whole-product solutions strategy, that parties indemnifying us will have the financial ability to honor their indemnification obligations or that such manufacturers will not seek indemnification or other relief from us for any such claims. Any product liability claims, with or without merit, could result in costly litigation, reduced sales, significant liabilities and diversion of our management’s time, attention and resources. We have obtained a level of liability insurance coverage that we believe is appropriate to our activities, however, we cannot be sure that our product liability insurance coverage is adequate or that it will continue to be available to us on acceptable terms, if at all. Furthermore, we do not expect to be able to obtain insurance covering our costs and losses as a result of any recall of products or devices incorporating our technologies because of alleged defects, whether such recall is instituted by us, by a customer, or is required by a regulatory agency. A product liability claim, recall or other claim with respect to uninsured liabilities or for amounts in excess of insured liabilities could have a material adverse effect on our business, financial condition and results of operations.
19
Our revenue will be harmed if we cannot purchase sufficient reagent components we use in our manufacture of reagents.
We currently purchase some of the components we use to manufacture reagents from sole suppliers. If any of our sole suppliers becomes unwilling to supply components to us, experiences an interruption in its production or is otherwise unable to provide us with sufficient material to manufacture our reagents, we will experience production interruptions. If we lose our sole supplier of any particular reagent component or are otherwise unable to procure all components required for our reagent manufacturing for an extended period of time, we may lose the ability to manufacture the reagents our customers require to commercialize products incorporating our technology. This could result in lost royalties and product sales, which would harm our financial results. Adding suppliers to our approved vendor list may require significant time and resources. We routinely attempt to maintain multiple suppliers of each of our significant materials, so we have alternative suppliers, if necessary. However, if the number of suppliers of a material is reduced, or if we are otherwise unable to obtain our material requirements on a timely basis and on favorable terms, our operations may be harmed.
We are dependent upon key personnel and may not be able to attract qualified personnel in the future.
Our success is dependent upon our ability to retain and attract highly qualified management and technical personnel. We face intense competition for such qualified personnel. We do not maintain key person insurance, and we generally do not enter into employment agreements, except with certain executive officers. Although we have non-compete agreements with most employees, there can be no assurance that such agreements will be enforceable. The loss of the services of one or more key employees or the failure to attract and retain additional qualified personnel could have a material adverse effect on our business, financial condition and results of operations.
Security breaches and other disruptions could compromise our information and expose us to liability, which would cause our business and reputation to suffer.
We collect and store sensitive data, including intellectual property, our proprietary business information and that of our customers, suppliers and business partners, and personally identifiable information of our customers and employees, on our networks. The secure maintenance of this information is critical to our operations and business strategy. Despite our security measures, our information technology and infrastructure may be vulnerable to attacks by hackers resulting from employee error, malfeasance or other disruptions. Any such breach could compromise our networks and the information stored there could be accessed, publicly disclosed, lost or stolen. Any such access, disclosure or other loss of information could result in legal claims or proceedings, and regulatory penalties, disrupt our operations and the services that we provide to our customers, damage our reputation and cause a loss of confidence in our products and services, any of which could adversely affect our business and competitive position.
RISKS RELATING TO OUR INTELLECTUAL PROPERTY
We may not be able to obtain, maintain or protect proprietary rights necessary for the commercialization of our technologies.
Our success depends, in large part, on our ability to obtain and maintain patents, maintain trade secret protection, operate without infringing on the proprietary rights of third parties and protect our proprietary rights against infringement by third parties. We have been granted U.S. and foreign patents and have U.S. and foreign patent applications pending related to our proprietary technologies. There can be no assurance that any pending patent application will be approved, that we will develop additional proprietary technologies that are patentable, that any patents issued will provide us with competitive advantages or will not be challenged or invalidated by third parties, that the patents of others will not prevent the commercialization of products incorporating our technologies, or that others will not independently develop similar technologies or design around our patents. Furthermore, because we generate a significant amount of our revenue through licensing arrangements, the loss or expiration of patent protection for our licensed technologies will result in a reduction of the revenue derived from these arrangements which may have a material adverse effect on our business, cash flow, results of operations, financial position and prospects.
We may become involved in expensive and unpredictable patent litigation or other intellectual property proceedings which could result in liability for damages, or impair our development and commercialization efforts.
Our commercial success also will depend, in part, on our ability to avoid infringing patent or other intellectual property rights of third parties. There has been substantial litigation regarding patent and other intellectual property rights in the medical device and pharmaceutical industries, and intellectual property litigation may be used against us as a means of gaining a competitive advantage. Intellectual property litigation is complex, time consuming and expensive, and the outcome of such litigation is difficult to predict. If we were found to be infringing any third-party patent or other intellectual property right, we could be required to pay significant
20
damages, alter our products or processes, obtain licenses from others, which we may not be able to do on commercially reasonable terms, if at all, or cease commercialization of our products and processes. Any of these outcomes could have a material adverse effect on our business, financial condition and results of operations.
Patent litigation or certain other administrative proceedings may also be necessary to enforce our patents or to determine the scope and validity of third-party proprietary rights. These activities could result in substantial cost to us, even if the eventual outcome is favorable to us. An adverse outcome of any such litigation or interference proceeding could subject us to significant liabilities to third parties, require disputed rights to be licensed from third parties or require us to cease using our technology. Any action to defend or prosecute intellectual property would be costly and result in significant diversion of the efforts of our management and technical personnel, regardless of outcome, and could have a material adverse effect on our business, financial condition and results of operations.
If we are unable to keep our trade secrets confidential, our technology and proprietary information may be used by others to compete against us.
We rely significantly upon proprietary technology, information, processes and know-how that are not subject to patent protection. We seek to protect this information through trade secret or confidentiality agreements with our employees, consultants, potential licensees, or other parties as well as through other security measures. There can be no assurance that these agreements or any security measure will provide meaningful protection for our unpatented proprietary information. In addition, our trade secrets may otherwise become known or be independently developed by competitors. If we determine that our proprietary rights have been misappropriated, we may seek to enforce our rights which would draw upon our financial resources and divert the time and efforts of our management, and could have a material adverse effect on our business, financial condition and results of operations.
If we are unable to convert our customers to our advanced generation of hydrophilic coating technology, our royalty revenue may decrease.
In our Medical Device business unit, we have licensed our PhotoLink hydrophilic technology to a number of our customers for use in a variety of medical device surface applications. We have several U.S. and international issued patents and pending international patent applications protecting various aspects of these technologies, including compositions, methods of manufacture and methods of coating devices. The expiration dates for these patents and the anticipated expiration dates of the patent applications range from calendar 2016 to 2033. These patents and patent applications represent distinct families, with each family generally covering a successive generation of the technology, including improvements that enhance coating performance, manufacturability, or other important features desired by our customers. Among these, our third generation of PhotoLink hydrophilic technology is protected by a family of patents that expired in November 2015 (in the U.S.) and October 2016 (in certain other countries). The royalty revenue associated with our third generation technology was approximately 17% of our fiscal 2016 revenue.
Approximately 24% of our total revenue in fiscal 2016 was generated from the fourth generation of our PhotoLink technology, which are protected by a family of patents that will begin to expire in fiscal 2020. Of the license agreements using our early generation technologies, most will continue to generate royalty revenue at a reduced royalty rate beyond patent expiration.
In recent years, we have successfully converted a number of our customers’ products utilizing these early generation technologies to one of our advanced generation technologies. While we are actively seeking to convert our customers to one of our advanced generations of our hydrophilic coating technology, there can be no assurance that we will be successful in doing so, or that those customers that have converted, or will convert, will sell products utilizing our technology which will generate earned royalty revenue for us.
If we or any of our licensees breach any of the agreements under which we have in-licensed intellectual property from others, we could be deprived of important intellectual property rights and future revenue.
We are a party to various agreements through which we have in-licensed or otherwise acquired from third parties rights to certain technologies that are important to our business. In exchange for the rights granted to us under these agreements, we have agreed to meet certain research, development, commercialization, sublicensing, royalty, indemnification, insurance or other obligations. If we or one of our licensees fails to comply with these obligations set forth in the relevant agreement through which we have acquired rights, we may be unable to effectively use, license, or otherwise exploit the relevant intellectual property rights and may be deprived of current or future revenue that is associated with such intellectual property.
21
RISKS RELATING TO CLINICAL AND REGULATORY MATTERS
We may need to invest in human clinical trials involving our DCB platform.
During fiscal 2016, we commenced a first in-human clinical early feasibility study and continued preclinical evaluation of other potential applications of our DCB platform. In fiscal 2017, we expect to continue the clinical evaluation of the SurVeil DCB. The results of the data from the clinical evaluation of our SurVeil DCB may prevent or delay us from obtaining the regulatory approvals required to continue the development of the product. Additionally, our ability to monetize successfully our SurVeil DCB and other applications of the platform may depend on the success of preclinical evaluations and any clinical trial that we may initiate. Ultimately, we may not be successful in finding the right strategic partner with which to enter into arrangements to commercialize the SurVeil DCB which could impact our ability to realize an acceptable return, if any, on the investments we are making in this product and the platform.
The development of new products and enhancement of existing products requires significant research and development, clinical trials and regulatory approvals, all of which may be very expensive and time-consuming and may not result in commercially viable products.
The development of new products and enhancement of existing products requires significant investment in research and development, clinical trials and regulatory approvals. There can be no assurance that any products now in development or that we may seek to develop in the future will achieve technological feasibility, obtain regulatory approval or gain market acceptance. If we are unable to develop and launch new products and enhanced products, our ability to maintain or expand our market position in the markets in which we participate may be materially adversely impacted. A delay in the development or approval of new products and technologies may also adversely impact the contribution of these technologies to our future growth.
Healthcare policy changes, including new legislation intended to reform the U.S. healthcare system, may have a material adverse effect on us.
Healthcare costs have risen significantly during the past decade. There have been and continue to be proposals by legislators, regulators and third-party payers to keep these costs down. Certain proposals, if implemented, would impose limitations on the prices our customers will be able to charge for our products, or the amounts of reimbursement available for their products from governmental agencies or third-party payers. Because a significant portion of our revenue is currently derived from royalties on products which constitute a percentage of the selling price, these limitations could have an adverse effect on our revenue.
The Patient Protection and Affordable Care Act imposes significant new taxes on medical device makers who make up a significant portion of our customers. Although significant components of these taxes have been suspended for calendar 2016 and 2017, their status is unclear for 2018 and subsequent years. The legislation has resulted in a significant total cost increase to the medical device and diagnostic industries, which could have a material, negative impact on both the financial condition of our customers as well as on our customers’ ability to attract financing, their willingness to commit capital to development projects or their ability to commercialize their products utilizing our technology, any of which could have a material adverse effect on our business, financial condition and results of operations. There continues to be substantial risk to our customers, and therefore us, from the uncertainty which continues to surround the future of health care delivery and reimbursement both in the U.S. and abroad.
Whole-product solutions medical devices and other products incorporating our technologies are subject to continuing regulations and extensive approval or clearance processes. If we or our licensees are unable to obtain or maintain the necessary regulatory approvals or clearances for such products, then to the products may not be commercialized on a timely basis, if at all.
Medical devices and biotechnology products incorporating our technologies are subject to regulation by the FDA and other regulatory authorities. To obtain regulatory approval for products incorporating our technologies, extensive preclinical studies as well as clinical trials in humans may be required. Clinical development, including preclinical testing, is a long, expensive and uncertain process. The burden of securing regulatory approval for these products typically rests with our licensees. However, we have prepared Drug Master Files and Device Master Files which may be accessed by the FDA and other regulatory authorities to assist them in their review of the applications filed by our licensees.
The process of obtaining FDA and other required regulatory approvals is expensive and time-consuming. Historically, most medical devices incorporating our technologies have been subject to the FDA’s 510(k) marketing approval process, which typically lasts from three to nine months. Supplemental or full pre-market approval reviews require a significantly longer period, delaying commercialization. In addition, sales of medical devices outside the U.S. are subject to international regulatory requirements that vary
22
from country to country. The time required to obtain approval for sale internationally may be longer or shorter than that required for FDA approval.
There can be no assurance that we or our licensees will be able to obtain regulatory approval for products on a timely basis, if at all. Regulatory approvals, if granted, may include significant limitations on the indicated uses for which the product may be marketed. In addition, product approval could be withdrawn for failure to comply with regulatory standards or the occurrence of unforeseen problems following initial marketing. In addition, we are often contractually obligated to keep the details concerning our licensees’ research and development efforts (including the timing of expected regulatory filings, approvals and market introductions) confidential. Changes in existing regulations or adoption of new governmental regulations or policies could prevent or delay regulatory approval of products incorporating our technologies or subject us to additional regulation. Failure or delay by us or our licensees in obtaining FDA and other necessary regulatory approval or clearance, or the loss of previously obtained approvals, could have a material adverse effect on our business, financial condition and results of operations.
We may face liability if we mishandle or improperly dispose of the hazardous materials used in some of our research, development and manufacturing processes.
Our research, development and manufacturing activities sometimes involve the controlled use of various hazardous materials. Although we believe that our safety procedures for handling and disposing of such materials comply with the standards prescribed by state and federal regulations, the risk of accidental contamination or injury from these materials cannot be completely eliminated. While we currently maintain insurance in amounts that we believe are appropriate, we could be held liable for any damages that might result from any such event. Any such liability could exceed our insurance and available resources and could have a material adverse effect on our business, financial condition and results of operations.
Additionally, certain of our activities are regulated by federal and state agencies in addition to the FDA. For example, activities in connection with disposal of certain chemical waste are subject to regulation by the U.S. Environmental Protection Agency. We could be held liable in the event of improper disposal of such materials, even if these acts were done by third parties. Some of our reagent chemicals must be registered with the agency, with basic information filed related to toxicity during the manufacturing process as well as the toxicity of the final product. Failure to comply with existing or future regulatory requirements could have a material adverse effect on our business, financial condition and results of operations.
RISKS RELATING TO OUR SECURITIES
Our stock price has been volatile and may continue to be volatile.
The trading price of our common stock has been, and is likely to continue to be, highly volatile, in large part attributable to developments and circumstances related to factors identified in “Forward-Looking Statements” and “Risk Factors.” The market value of shares of our common stock may rise or fall sharply at any time because of this volatility, as a result of sales executed by significant holders of our stock, and also because of short positions taken by investors from time to time in our stock. In the fiscal year ended September 30, 2016, the sale price for our common stock ranged from $17.45 to $30.28 per share. The market prices for securities of medical technology, drug delivery and biotechnology companies historically have been highly volatile, and the market has experienced significant price and volume fluctuations that may be unrelated to the operating performance of particular companies.
ITEM 1B. UNRESOLVED STAFF COMMENTS.
None.
Our principal operations are located in Eden Prairie, a suburb of Minneapolis, Minnesota, where we own a building that has approximately 64,000 square feet of space and Ballinasloe, Ireland, where we own a building that has approximately 30,000 square feet of space. We lease a warehouse near our Eden Prairie facility and a R&D-focused facility in Plymouth, Minnesota. We also own an undeveloped parcel of land adjacent to our principal facility, which we intend to use to accommodate our growth needs.
23
See the discussion of “Litigation” in Note 11 to the consolidated financial statements in “Item 8. Financial Statements and Supplementary Data” in this Annual Report on Form 10-K.
ITEM 4. MINE SAFETY DISCLOSURES.
Not Applicable.
24
ITEM 5. MARKET FOR REGISTRANT’S COMMON EQUITY, RELATED STOCKHOLDER MATTERS AND ISSUER PURCHASES OF EQUITY SECURITIES.
Our stock is traded on the NASDAQ Global Select Market under the symbol “SRDX.” The table below sets forth the range of high and low sale prices, by quarter, for our Common Stock, as reported by NASDAQ, in each of the last two fiscal years.
|
Fiscal Quarter Ended: |
|
High |
|
|
Low |
|
||
|
September 30, 2016 |
|
$ |
30.28 |
|
|
$ |
22.58 |
|
|
June 30, 2016 |
|
|
24.23 |
|
|
|
18.45 |
|
|
March 31, 2016 |
|
|
21.45 |
|
|
|
17.45 |
|
|
December 31, 2015 |
|
|
24.98 |
|
|
|
19.64 |
|
|
September 30, 2015 |
|
|
27.68 |
|
|
|
21.36 |
|
|
June 30, 2015 |
|
|
27.36 |
|
|
|
23.09 |
|
|
March 31, 2015 |
|
|
26.99 |
|
|
|
21.15 |
|
|
December 31, 2014 |
|
|
22.94 |
|
|
|
18.00 |
|
Our transfer agent is:
American Stock Transfer & Trust Company
59 Maiden Lane, Plaza Level
New York, New York 10038
(800) 937-5449
According to the records of our transfer agent, as of November 25, 2016, there were 159 holders of record of our common stock.
To date, Surmodics has not paid or declared any cash dividends on its common stock. The declaration and payment by Surmodics of future dividends, if any, on its common stock will be at the sole discretion of the Board of Directors and will depend on Surmodics’ continued earnings, financial condition, capital requirements and other factors that the Board of Directors deems relevant.
There were no purchases of common stock of the Company made during the three months ended September 30, 2016, by the Company or on behalf of the Company or any “affiliated purchaser” of the Company, as defined in Rule 10b-18(a)(3) under the Exchange Act.
On November 6, 2015, the Company’s Board of Directors authorized it to repurchase up to an additional $20.0 million (“fiscal 2016 authorization”) of the Company’s outstanding common stock in open-market purchases, privately negotiated transactions, block trades, accelerated share repurchase (“ASR”) transactions, tender offers or by any combination of such methods. The share repurchase program does not have a fixed expiration date.
On November 5, 2014, the Company’s Board of Directors authorized it to repurchase up to $30.0 million (“fiscal 2015 authorization”) of the Company’s outstanding common stock in open-market purchases, privately negotiated transactions, block trades, accelerated share repurchase ASR transactions, tender offers or by any combination of such methods. An aggregate of $20.0 million of the fiscal 2015 authorization was utilized in fiscal 2015, leaving $10.0 million available for future repurchases. The share repurchase program does not have a fixed expiration date.
As of December 2, 2016, the Company has an aggregate of $30 million available for future common stock repurchases under the fiscal 2015 authorization and the fiscal 2016 authorization.
25
The following chart compares the cumulative total shareholder return on the Company’s Common Stock with the cumulative total return on the NASDAQ US Benchmark Total Return (our broad equity market index) and the NASDAQ Medical Supplies Index (our published industry index). The comparisons assume $100 was invested on September 30, 2011 and assume reinvestment of dividends.
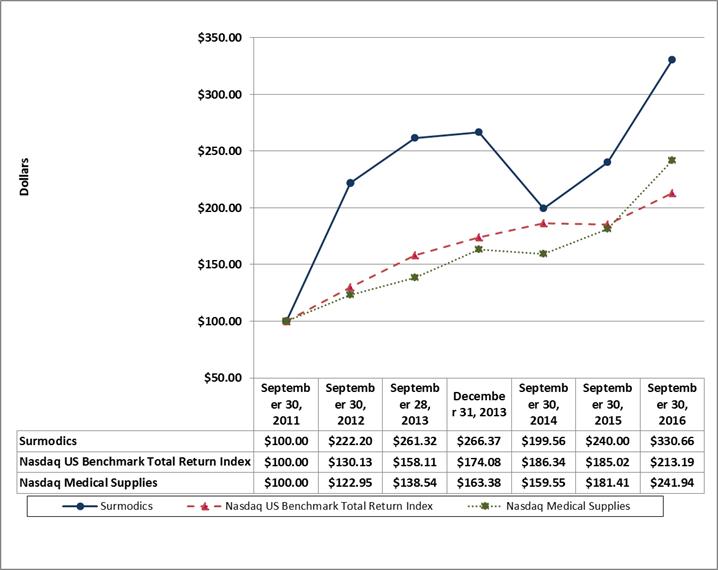
26
ITEM 6. SELECTED FINANCIAL DATA.
The data presented below as of September 30, 2016 and 2015 and for the fiscal years ended September 30, 2016, 2015 and 2014 is derived from our audited consolidated financial statements included elsewhere in this report. The data as of September 30, 2014, 2013 and 2012 and for the years ended September 30, 2013 and 2012 is derived from audited consolidated financial statements not included in this report. The information set forth below should be read in conjunction with the Company’s “Management’s Discussion and Analysis of Financial Condition and Results of Operations” contained in Item 7 of this report and our consolidated financial statements and related notes beginning on page F-1 and other financial information included in this report.
|
|
|
Fiscal Year |
|
|||||||||||||||||
|
|
|
2016 |
|
|
2015 |
|
|
2014 |
|
|
2013 |
|
|
2012 |
|
|||||
|
|
|
(Dollars in thousands, except per share data) |
|
|||||||||||||||||
|
Statement of Operations Data: |
|
|
|
|
|
|
|
|
|
|
|
|
|
|
|
|
|
|
|
|
|
Total revenue |
|
$ |
71,366 |
|
|
$ |
61,898 |
|
|
$ |
57,439 |
|
|
$ |
56,132 |
|
|
$ |
51,928 |
|
|
Operating income from continuing operations |
|
|
16,859 |
|
|
|
19,089 |
|
|
|
18,576 |
|
|
|
18,820 |
|
|
|
16,342 |
|
|
Income from continuing operations |
|
|
9,985 |
|
|
|
11,947 |
|
|
|
12,207 |
|
|
|
14,579 |
|
|
|
10,129 |
|
|
(Loss) income from discontinued operations |
|
|
— |
|
|
|
— |
|
|
|
(176 |
) |
|
|
588 |
|
|
|
102 |
|
|
Net income |
|
|
9,985 |
|
|
|
11,947 |
|
|
|
12,031 |
|
|
|
15,167 |
|
|
|
10,231 |
|
|
Diluted income (loss) per share: |
|
|
|
|
|
|
|
|
|
|
|
|
|
|
|
|
|
|
|
|
|
Continuing operations |
|
$ |
0.76 |
|
|
$ |
0.90 |
|
|
$ |
0.88 |
|
|
$ |
0.99 |
|
|
$ |
0.58 |
|
|
Discontinued operations |
|
|
— |
|
|
|
— |
|
|
|
(0.01 |
) |
|
|
0.04 |
|
|
|
0.01 |
|
|
Net income |
|
|
0.76 |
|
|
|
0.90 |
|
|
|
0.87 |
|
|
|
1.03 |
|
|
|
0.59 |
|
|
Balance Sheet Data: |
|
|
|
|
|
|
|
|
|
|
|
|
|
|
|
|
|
|
|
|
|
Cash, short-term and long-term investments |
|
$ |
46,941 |
|
|
$ |
55,588 |
|
|
$ |
63,374 |
|
|
$ |
58,104 |
|
|
$ |
58,090 |
|
|
Total assets |
|
|
132,894 |
|
|
|
98,710 |
|
|
|
104,889 |
|
|
|
101,923 |
|
|
|
104,319 |
|
|
Retained earnings |
|
|
98,146 |
|
|
|
88,161 |
|
|
|
93,881 |
|
|
|
91,036 |
|
|
|
75,869 |
|
|
Total stockholders’ equity |
|
|
106,833 |
|
|
|
91,873 |
|
|
|
98,751 |
|
|
|
93,817 |
|
|
|
94,988 |
|
|
Statement of Cash Flows Data: |
|
|
|
|
|
|
|
|
|
|
|
|
|
|
|
|
|
|
|
|
|
Net cash provided by operating activities from continuing operations |
|
$ |
25,166 |
|
|
$ |
15,066 |
|
|
$ |
18,537 |
|
|
$ |
17,781 |
|
|
$ |
17,626 |
|
Note: Fiscal 2016 figures include the effects of our acquisitions of Creagh Medical and NorMedix, as further discussed below.
ITEM 7. MANAGEMENT’S DISCUSSION AND ANALYSIS OF FINANCIAL CONDITION AND RESULTS OF OPERATIONS.
The following discussion and analysis of our financial condition and results of operations should be read together with “Selected Financial Data” and our audited consolidated financial statements and related notes appearing elsewhere in this report. Any discussion and analysis regarding our future financial condition and results of operations are forward-looking statements that involve risks, uncertainties and assumptions, as more fully identified in “Forward-Looking Statements” and “Risk Factors.” Our actual future financial condition and results of operations may differ materially from those anticipated in the forward-looking statements.
Overview
Surmodics is a leading provider of medical device and in vitro diagnostic technologies to the healthcare industry. In fiscal 2016, our business performance continued to be driven by growth from our core Medical Device and IVD businesses as well as the acquisitions of Creagh Medical and NorMedix in our Medical Device segment (collectively, “Fiscal 2016 Acquisitions”). Revenue in the Medical Device business consists of hydrophilic coatings royalty revenue and product sales as well as contract coating. Following the Fiscal 2016 Acquisitions, our Medical Device business now offers whole-product solutions including medical device product sales, as well as device design and development services. Our In Vitro Diagnostics business is driven by product sales of diagnostic technology.
Operating segments are defined as components of an enterprise about which separate financial information is available that is evaluated regularly by the chief operating decision maker, or decision making group, in deciding how to allocate resources and in assessing performance. For financial accounting and reporting purposes, we report our results for the two reportable segments as follows: (1) the Medical Device unit, which is comprised of manufacturing balloons and catheters used for a variety of interventional cardiology, peripheral and other applications, surface modification coating technologies to improve access, deliverability, and predictable deployment of medical devices, as well as drug delivery coating technologies to provide site-specific drug delivery from the surface of a medical device, with end markets that include coronary, peripheral, and neurovascular, and urology, among others,
27
and (2) the In Vitro Diagnostics unit, which consists of component products and technologies for diagnostic immunoassay as well as molecular tests and biomedical research applications, with products that include protein stabilization reagents, substrates, antigens and surface coatings. We made this determination based on how we manage our operations and the information provided to our chief operating decision maker who is our Chief Executive Officer.
We derive our revenue from three primary sources: (1) royalties and license fees from licensing our proprietary surface modification and device drug delivery technologies to customers; the vast majority (typically in excess of 90%) of revenue in the “royalties and license fees” category is in the form of royalties; (2) product revenues from the sale of reagent chemicals to licensees, the sale of stabilization products, antigens, substrates and surface coatings to the diagnostic and biomedical research markets as well as the sale of medical devices and related products (such as balloons and catheters) to original equipment manufacturer (OEM) suppliers and distributors; and (3) research and commercial development fees generated on customer projects. Revenue fluctuates from quarter to quarter depending on, among other factors: our customers’ success in selling products incorporating our technologies; the timing of introductions of licensed products by our customers; the timing of introductions of products that compete with our customers’ products; the number and activity level associated with customer development projects; the number and terms of new license agreements that are finalized; and the value of reagent chemicals and other products sold to our customers.
Greater than 96% of our royalty and license fee revenue in fiscal 2016, 2015 and 2014 is associated with the licensing of our hydrophilic coating technologies. We have an extensive portfolio of U.S. and international patents and patent applications protecting various aspects of these technologies, including compositions, methods of manufacture and methods of coating devices. The expiration dates for these patents and the anticipated expiration dates of the patent applications range from 2016 to 2033. Among these, our third generation of PhotoLink hydrophilic technology is protected by a family of patents that expired in November 2015 (in the U.S.) and October 2016 (in certain other countries). The royalty revenue associated with our third generation technology was approximately 17% of our fiscal 2016 revenue. Approximately 24% of our total revenue in fiscal 2016 was generated from fourth generation hydrophilic coating technologies, which are protected by a family of patents that begin to expire in fiscal 2020. Of the license agreements using our early generation technologies, most will continue to generate royalty revenue at a reduced royalty rate beyond patent expiration. The remainder of our royalty revenues are derived from other Surmodics coatings that are protected by a number of patents that extend to at least fiscal 2032.
On November 1, 2011, we entered into a purchase agreement to sell substantially all of the assets of a former subsidiary SurModics Pharmaceuticals, Inc. (“SurModics Pharmaceuticals”) to Evonik Degussa Corporation (“Evonik”). Accordingly, all results of operations, cash flows, assets and liabilities of SurModics Pharmaceuticals for all periods presented are classified as discontinued operations. All information in this “Management’s Discussion and Analysis of Financial Condition and Results of Operations” and elsewhere in this Form 10-K includes only results from continuing operations (excluding SurModics Pharmaceuticals) for all periods presented, unless otherwise noted.
Critical Accounting Policies
The discussion and analysis of our financial condition and results of operations is based upon our consolidated financial statements, which have been prepared in accordance with accounting principles generally accepted in the U.S. (“GAAP”). The preparation of these consolidated financial statements is based in part on the application of significant accounting policies, many of which require management to make estimates and assumptions (see Note 2 to the consolidated financial statements in “Item 8. Financial Statements and Supplementary Data” in this Annual Report on Form 10-K). Actual results may differ from these estimates under different assumptions or conditions and could materially impact our results of operations. Critical accounting policies are those policies that require the application of management’s most challenging subjective or complex judgment, often as a result of the need to make estimates about the effect of matters that are inherently uncertain and may change in subsequent periods. Critical accounting policies involve judgments and uncertainties that are sufficiently likely to result in materially different results under different assumptions and conditions. We believe the following are critical areas in the application of our accounting policies that currently affect our financial condition and results of operations.
Revenue recognition. Revenue is recognized when all of the following criteria are met: (1) persuasive evidence of an arrangement exists; (2) shipment has occurred or delivery has occurred if the terms specify destination; (3) the sales price is fixed or determinable; and (4) collectability is reasonably assured. When there are additional performance requirements, revenue is recognized when all such requirements have been satisfied. Under revenue arrangements with multiple deliverables, we recognize each separable deliverable as it is earned. We license technology to third parties and collect royalties. Royalty revenue is generated when a customer sells products incorporating our licensed technologies. Royalty revenue is recognized as our licensees report it to us, and payment is typically submitted concurrently with their reporting. For stand-alone license agreements, up-front license fees are recognized over the term of the related licensing agreement. Minimum royalty fees are recognized in the period earned.
28
Revenue related to a performance milestone is recognized upon the achievement of the milestone and meeting specific revenue recognition criteria. Product sales to third parties, which consist of direct and distributor sales, are recognized at the time of shipment, provided that an order has been received, the price is fixed or determinable, collectability of the resulting receivable is reasonably assured and returns can be reasonably estimated. Our sales terms provide no right of return outside of our standard warranty policy. Payment terms are generally set at 30-45 days. Generally, revenue for R&D is recorded as performance progresses under the applicable contract.
Multiple deliverable revenue arrangements require us to:
(i) disclose whether multiple deliverables exist, how the deliverables in an arrangement should be separated, and how the consideration should be allocated;
(ii) allocate revenue in an arrangement using estimated selling prices (“ESP”) of deliverables if a vendor does not have vendor-specific objective evidence of selling price (“VSOE”) or third-party evidence of selling price (“TPE”); and
(iii) eliminate the use of the residual method and require an entity to allocate revenue using the relative selling price method.
We account for revenue using a multiple attribution model in which consideration allocated to R&D activities is recognized as performed, and milestone payments are recognized when the milestone events are achieved, when such activities and milestones are deemed substantive. Accordingly, in situations where a unit of accounting includes both a license and R&D activities, and when a license does not have stand-alone value, we apply a multiple attribution model in which consideration allocated to the license is recognized ratably, consideration allocated to R&D activities is recognized as performed and milestone payments are recognized when the milestone events are achieved, when such activities and milestones are deemed substantive.
We enter into license and development arrangements that may consist of multiple deliverables which could include a license(s) to our technology, R&D activities, manufacturing services, and product sales based on the customer needs. For example, a customer may enter into an arrangement to obtain a license to our intellectual property which may also include R&D activities, and supply of products manufactured by us. For these services provided, we could receive upfront license fees upon signing of an agreement and granting the license, fees for R&D activities as such activities are performed, milestone payments contingent upon advancement of the product through development and clinical stages to successful commercialization, fees for manufacturing services and supply of product, and royalty payments based on customer sales of product incorporating our technology. Our license and development arrangements generally do not have refund provisions if the customer cancels or terminates the agreement. Typically all payments made are non-refundable.
We are required to evaluate each deliverable in a multiple element arrangement for separability. We are then required to allocate revenue to each separate deliverable using a hierarchy of VSOE, TPE, or ESP. In many instances, we are not able to establish VSOE for all deliverables in an arrangement with multiple elements. This may be a result of us infrequently selling each element separately or having a limited history with multiple element arrangements. When VSOE cannot be established, we attempt to establish a selling price of each element based on TPE. TPE is determined based on competitor prices for similar deliverables when sold separately.
When we are unable to establish a selling price using VSOE or TPE, we use ESP in our allocation of arrangement consideration. The objective of ESP is to determine the price at which Surmodics would transact a sale if the product or service were sold on a stand-alone basis. ESP is generally used for highly customized offerings.
We determine ESP for undelivered elements by considering multiple factors including, but not limited to, market conditions, competitive landscape and past pricing arrangements with similar features. The determination of ESP is made through consultation with management, taking into consideration the marketing strategies for each business unit.
Customer advances are accounted for as a liability until all criteria for revenue recognition have been met.
Valuation of long-lived assets. Accounting guidance requires us to evaluate periodically whether events and circumstances have occurred that may affect the estimated useful life or the recoverability of the remaining balance of long-lived assets, such as property and equipment and definite-lived intangible assets. If such events or circumstances were to indicate that the carrying amount of these assets may not be recoverable, we would estimate the future cash flows expected to result from the use of the assets and their eventual disposition. If the sum of the expected future cash flows (undiscounted and without interest charges) were less than the carrying amount of the assets, we would recognize an impairment charge to reduce such assets to their fair value.
29
In fiscal 2016, 2015 and 2014, there were no impairment charges relating to our long-lived assets as there were no events or circumstances that occurred that affected the recoverability of such assets.
Goodwill. We record all assets and liabilities acquired in purchase acquisitions, including goodwill, at fair value as required by accounting guidance for business combinations. The initial recognition of goodwill requires management to make subjective judgments concerning estimates of how the acquired assets will perform in the future using valuation methods including discounted cash flow analysis.
Goodwill is not amortized but is subject, at a minimum, to annual tests for impairment in accordance with accounting guidance for goodwill. Under certain situations, interim impairment tests may be required if events occur or circumstances change that would more likely than not reduce the fair value of a reporting unit below its carrying amount.
Goodwill is evaluated for impairment based on an assessment of qualitative factors to determine whether the existence of events or circumstances leads to a determination that it is more likely than not that the fair value of a reporting unit is less than its carrying amount (Step 0). If, after assessing the totality of events or circumstances, an entity determines it is not more likely than not that the fair value of a reporting unit is less than its carrying amount, then performing the two-step impairment test becomes unnecessary.
The two-step impairment test requires us to compare the fair value of the reporting units to which goodwill was assigned to their respective carrying values (Step 1 of the impairment test). In calculating fair value, we would use the income approach as our primary indicator of fair value, with the market approach used as a test of reasonableness. The income approach is a valuation technique under which we would estimate future cash flows using the reporting units’ financial forecasts. Future estimated cash flows are discounted to their present value to calculate fair value. The market approach establishes fair value by comparing us to other publicly traded guideline companies or by analysis of actual transactions of similar businesses or assets sold. The income approach would be tailored to the circumstances of our business, and the market approach would be completed as a secondary test to ensure that the results of the income approach are reasonable and in line with comparable companies in the industry. The summation of our reporting units’ fair values would be compared and reconciled to our market capitalization as of the date of our impairment test.
In the situation where a reporting unit’s carrying amount exceeds its fair value, the amount of the impairment loss must be measured. The measurement of the impairment (Step 2 of the impairment test) is calculated by determining the implied fair value of a reporting unit’s goodwill. In calculating the implied fair value of goodwill, the fair value of the reporting unit is allocated to all other assets and liabilities of that unit based on their fair values. The excess of the fair value of a reporting unit over the amount assigned to its other assets and liabilities is the implied fair value of goodwill. The goodwill impairment is measured as the excess of the carrying amount of goodwill over its implied fair value.
Evaluating goodwill for impairment involves the determination of the fair value of our reporting units in which we have recorded goodwill. A reporting unit is a component of an operating segment for which discrete financial information is available and reviewed by management on a regular basis.
We have determined that our reporting units are our In Vitro Diagnostics operations known as our In Vitro Diagnostics unit, which contains our BioFX branded products, and our whole-product solutions, device drug delivery and hydrophilic coatings operations known as our Medical Device unit. As of September 30, 2016 and 2015, $8.0 million of goodwill was related to the In Vitro Diagnostics reporting unit and represents the gross value from our acquisition of BioFX in 2007. As of September 30, 2016, $18.5 million of goodwill was related to the Medical Device unit and represented the gross value from our fiscal 2016 acquisitions of Creagh Medical ($14.1 million) and NorMedix ($4.4 million). Inherent in the determination of fair value of our reporting units are certain estimates and judgments, including the interpretation of current economic indicators and market valuations as well as our strategic plans with regard to our operations.
We performed our annual impairment test of goodwill as of August 31, 2016. Due to the acquisitions discussed above, we elected to perform the two-step impairment test to determine if impairment exists and to provide for a baseline against which qualitative factors can be compared going forward. Based on the results of the Step 1 fair value assessment, we determined that each of the reporting units’ fair values were greater than their carrying values and thus we did not record any goodwill impairment charges during fiscal 2016 and did not need to proceed to Step 2. We also did not record any goodwill impairment charges related to the In Vitro Diagnostics reporting unit during fiscal 2015 or 2014 based on our Step 0 analysis.
Income tax accruals and valuation allowances. When preparing the consolidated financial statements, we are required to estimate the income tax obligations in each of the jurisdictions in which we operate. This process involves estimating the actual current
30
tax obligations based on expected income, statutory tax rates and tax planning opportunities in the various jurisdictions. In the event there is a significant unusual or one-time item recognized in the results of operations, the tax attributable to that item would be separately calculated and recorded in the period the unusual or one-time item occurred. Tax law requires certain items to be included in our tax return at different times than the items are reflected in our results of operations. As a result, the annual effective tax rate reflected in our results of operations is different than that reported on our tax return (i.e., our cash tax rate). Some of these differences are permanent, such as expenses that are not deductible in our tax return, and some are temporary differences that will reverse over time, such as depreciation expense on capital assets. These temporary differences result in deferred tax assets and liabilities, which are included in our consolidated balance sheets. Deferred tax assets generally represent items that can be used as a tax deduction or credit in our tax returns in future years, for which we have already recorded the expense in our consolidated statements of income. We must assess the likelihood that our deferred tax assets will be recovered from future taxable income, and to the extent we believe that recovery is not likely, we must establish a valuation allowance against those deferred tax assets. Deferred tax liabilities generally represent items for which we have already taken a deduction in our tax return, but we have not yet recognized the items as expense in our results of operations.
Significant judgment is required in evaluating our tax positions, and in determining our provision for income taxes, our deferred tax assets and liabilities and any valuation allowance recorded against our deferred tax assets. We had total deferred tax assets in excess of total deferred tax liabilities of $5.0 million as of September 30, 2016 and $7.3 million as of September 30, 2015, including valuation allowances of $3.8 million as of September 30, 2016 and $5.7 million as of September 30, 2015. As of September 30, 2016 the valuation allowances related to two items: first, losses on strategic investments, including other-than-temporary losses that were unrealized for tax purposes, were recorded and we did not foresee future capital gain to offset the future capital loss associated with the reversal of the book versus tax basis difference. As such, no tax benefit was recorded in the consolidated statements of income for these items. Therefore, as of September 30, 2016, a valuation allowance has been recorded for other-than-temporary impairment losses as realized tax capital losses from sales of the underlying strategic assets have not occurred. Second, deferred tax assets related to net operating losses of Creagh Medical, including those incurred prior to the acquisition and in fiscal 2016, have been offset by a valuation allowance as it is not more likely than not that the tax assets will be realized in future periods, due to Creagh Medical’s history of taxable losses. Accordingly, the allocation of the purchase price of Creagh Medical to the acquired deferred tax assets related to the net operating loss carryforwards was also offset by a valuation allowance. As of September 30, 2015 the valuation allowances related to losses on strategic investments that were unrealized for tax purposes, for which we did not foresee future capital gain to offset the future capital loss associated with the reversal of the book versus tax basis difference.
During the fourth quarter of fiscal 2016, we monetized $7.5 million of realized capital losses by accelerating built-in gain in our IVD subsidiary. This resulted in an increase in our tax basis in IVD and a $2.6 million reduction in both deferred tax assets and the valuation allowance as of September 30, 2016.
We applied the accounting guidance associated with uncertain tax positions which defines standards for recognizing the benefits of tax return positions in the consolidated financial statements as “more-likely-than-not” to be sustained by the taxing authorities based solely on the technical merits of the position. If the recognition threshold is met, the tax benefit is measured and recognized as the largest amount of tax benefit that, in our judgment, is greater than 50% likely to be realized. The total gross amount of unrecognized tax benefits as of September 30, 2016, 2015 and 2014 was $1.5 million, $1.2 million and $1.2 million, respectively, excluding accrued interest and penalties. Of these unrecognized tax benefits, $1.2 million, $0.9 million and $0.9 million would affect our effective tax rate for fiscal 2016, 2015 and 2014, respectively. Interest and penalties recorded for uncertain tax positions are included in our income tax provision. As of September 30, 2016, 2015 and 2014, $0.6 million of interest and penalties were accrued at each fiscal year-end, excluding the tax benefits of deductible interest. The Internal Revenue Service (“IRS”) completed an examination of the Company’s U.S. income tax return for fiscal 2012 in fiscal 2014. U.S. income tax returns for years prior to fiscal 2013 are no longer subject to examination by federal tax authorities. For tax returns for state and local jurisdictions, the Company is no longer subject to examination for tax years generally before fiscal 2006. For tax returns for non-U.S. jurisdictions, the Company is no longer subject to income tax examination for years prior to 2011. Additionally, the Company has been indemnified of liability for any taxes relating to Creagh Medical and NorMedix for periods prior to the respective acquisition dates, pursuant to the terms of the related purchase agreements.
In the event that we have determined not to file tax returns with a particular state or local jurisdiction, all years remain subject to examination by the tax authorities. The ultimate outcome of tax matters may differ from our estimates and assumptions. Unfavorable settlement of any particular issue would require the use of cash and could result in increased income tax expense. Favorable resolution could result in reduced income tax expense. Within the next 12 months, we do not expect that our unrecognized tax benefits will change significantly. See Note 8 to the consolidated financial statements in “Item 8. Financial Statements and Supplementary Data” in this Annual Report on Form 10-K for further information regarding changes in unrecognized tax benefits during fiscal 2016, 2015 and 2014.
31
Valuation of business combinations. The fair value of consideration, including contingent consideration, transferred in acquisitions accounted for as business combinations is first allocated to the identifiable tangible and intangible assets acquired and liabilities assumed based on their estimated fair values at the date of acquisition. Any excess purchase consideration is allocated to goodwill. Further, for those arrangements that involve liability classified contingent consideration, we record on the date of acquisition a liability equal to the discounted fair value of the estimated additional consideration we may be obligated to make in the future. Liability classified contingent consideration is adjusted to its fair value each reporting period through earnings. Acquisition transaction costs are expensed as incurred.
The fair value of identifiable intangible assets requires management estimates and judgments based on market participant assumptions. Using alternative valuation assumptions, including estimated revenue projections, growth rates, cash flows, discount rates, estimated useful lives, and probabilities surrounding the achievement of milestones could result in different fair value estimates of our net tangible and intangible assets and related amortization expense in current and future periods.
Contingent consideration liabilities are remeasured to fair value each reporting period using projected revenues, discount rates, probabilities of payment, and projected payment dates. Increases or decreases in the fair value of the contingent consideration liability can result from changes in the timing and amount of revenue estimates or in the timing or likelihood of achieving value-enhancing milestones, and changes in discount periods and rates. Projected contingent payment amounts are discounted back to the current period using a discounted cash flow model. See further discussion of contingent payments to Creagh Medical and NorMedix above under “Future Investments and Contingent Consideration Related to Acquisitions” in this Item 2 and in Note 3, “Business Combinations,” to the consolidated financial statements in “Item 8. Financial Statements and Supplementary Data” in this Annual Report on Form 10-K.
Results of Operations
Years Ended September 30, 2016, 2015 and 2014
Revenue. Fiscal 2016 revenue was $71.4 million, a $9.5 million, or 15% increase from fiscal 2015 revenue of $61.9 million. Fiscal 2015 revenue increased $4.5 million, or 8%, from fiscal 2014. Fiscal 2016 revenue includes $4.1 million from acquisitions consummated in the first two quarters of fiscal 2016. The table below provides a summary of each operating segment’s annual revenue for the three-year period ended September 30, 2016.
|
|
|
For the Year Ended September 30, |
|
|
Increase/(Decrease) |
|
|
Increase/(Decrease) |
|
|||||||||||||||||||
|
(dollars in thousands) |
|
2016 |
|
|
2015 |
|
|
2014 |
|
|
2016 vs. 2015 |
|
|
2015 vs. 2014 |
|
|||||||||||||
|
Revenue |
|
|
|
|
|
|
|
|
|
|
|
|
|
|
|
|
|
|
|
|
|
|
|
|
|
|
|
|
|
Medical Device |
|
$ |
53,202 |
|
|
$ |
45,944 |
|
|
$ |
43,068 |
|
|
$ |
7,258 |
|
|
|
16 |
% |
|
$ |
2,876 |
|
|
|
7 |
% |
|
In Vitro Diagnostics |
|
|
18,164 |
|
|
|
15,954 |
|
|
|
14,371 |
|
|
|
2,210 |
|
|
|
14 |
% |
|
|
1,583 |
|
|
|
11 |
% |
|
Total Revenue |
|
$ |
71,366 |
|
|
$ |
61,898 |
|
|
$ |
57,439 |
|
|
$ |
9,468 |
|
|
|
15 |
% |
|
$ |
4,459 |
|
|
|
8 |
% |
Medical Device. Revenue in Medical Device was $53.2 million in fiscal 2016, a 16% increase from $45.9 million in fiscal 2015. The increase in fiscal 2016 revenue was a result of growth in each of our revenue categories, driven primarily by increased demand for reagents as well as incremental product and research, development and other revenue from our Fiscal 2016 Acquisitions. Product revenue increased by $1.5 million from reagents sales and $2.4 million from our Fiscal 2016 Acquisitions. Royalty and licensing revenue improved by $1.4 million, of which $2.9 million was from a catch-up payment for previously unreported royalties owed to the Company by one customer for the period from fiscal 2009 through fiscal 2016. This was offset by a revenue adjustment to correct a cumulative overstatement of royalty revenue related to a settlement agreement entered into with a customer pursuant to which we agreed to pay the customer $1.4 million to refund overpaid royalties, of which $1.0 million was out-of-period and related to years prior to fiscal 2016. The overstatement was not material to any prior periods. Further, we realized a $3.1 million increase in other hydrophilic royalties which was offset by $2.1 million decline in hydrophilic royalties as a result of the expiration of patents protecting the third generation of our PhotoLink hydrophilic technology. The increase in research, development and other revenue of $1.9 million was primarily due to incremental revenue from the Fiscal 2016 Acquisitions.
During fiscal 2016 and 2015, $12.1 million and $11.0 million, respectively, of Medical Device royalty revenue was generated from our third generation of our PhotoLink technology. As discussed above, the family of patents that protects this technology expired in November 2015 (in the U.S.) and October 2016 (in certain other countries). While we believe we will retain a majority of this royalty revenue, there is a royalty rate step down for licensed customers at the time these patents expire. We are actively seeking to convert
32
customers using this generation of PhotoLink coatings to our Serene® coating technologies. We expect overall declines of $5.0 million to $6.0 million in hydrophilic coating royalties in fiscal 2017 as the result of these patent expirations.
Revenue in Medical Device was $45.9 million in fiscal 2015, a 7% increase from $43.1 million in 2014. The increase in fiscal 2015 revenue was generated by each of our revenue categories with increased royalty and licensing revenue of $1.5 million, of which $0.6 million was from a one-time catch up payment related to periods prior to fiscal 2015, as well as increased customer demand resulting in increased R&D revenue of $0.8 million and increased reagent product sales of $0.5 million.
In Vitro Diagnostics. In Vitro Diagnostics revenue was $18.2 million in fiscal 2016, a 14% increase from $16.0 million in fiscal 2015. The increase in 2016 revenue was the result of unit volume increases in substantially all product lines.
In Vitro Diagnostics revenue was $16.0 million in fiscal 2015, an 11% increase from $14.4 million in fiscal 2014. The increase in fiscal 2015 revenue was attributable to a $1.6 million increase in product sales. Fiscal 2015 benefited from a lower prior-year comparison as the In Vitro Diagnostic revenue declined as a result of customer inventory rebalancing activities in the second quarter fiscal 2014, which resulted in lower comparable sales. There were limited product price increases in fiscal 2016 and fiscal 2015.
The following is a summary of major costs and expenses as a percentage of total revenue:
|
|
|
For the Year Ended September 30, |
|
|||||||||||||||||||||
|
|
|
2016 |
|
|
2015 |
|
|
2014 |
|
|||||||||||||||
|
(dollars in thousands) |
|
Amount |
|
|
% Total Revenue |
|
|
Amount |
|
|
% Total Revenue |
|
|
Amount |
|
|
% Total Revenue |
|
||||||
|
Product costs |
|
$ |
10,908 |
|
|
|
15 |
% |
|
$ |
8,619 |
|
|
|
14 |
% |
|
$ |
8,016 |
|
|
|
14 |
% |
|
Research and development |
|
|
18,498 |
|
|
|
26 |
% |
|
|
16,165 |
|
|
|
26 |
% |
|
|
15,550 |
|
|
|
27 |
% |
|
Selling, general and administrative |
|
|
18,000 |
|
|
|
25 |
% |
|
|
14,906 |
|
|
|
24 |
% |
|
|
14,691 |
|
|
|
26 |
% |
|
Acquisition transaction, integration and other costs |
|
|
3,187 |
|
|
|
4 |
% |
|
|
— |
|
|
|
— |
|
|
|
— |
|
|
|
— |
|
|
Acquired intangible asset amortization |
|
|
2,422 |
|
|
|
3 |
% |
|
|
619 |
|
|
|
1 |
% |
|
|
606 |
|
|
|
1 |
% |
|
Contingent consideration accretion expense |
|
|
1,492 |
|
|
|
2 |
% |
|
|
— |
|
|
|
— |
|
|
|
— |
|
|
|
— |
|
|
Claim settlement |
|
|
— |
|
|
|
— |
|
|
|
2,500 |
|
|
|
4 |
% |
|
|
— |
|
|
|
— |
|
Product costs. Product costs were $10.9 million, $8.6 million, and $8.0 million in fiscal 2016, 2015 and 2014, respectively, or 15%, 14% and 14% of total revenue in each respective year. Product gross margins (defined as product sales less related product costs) were 65% of product sales in fiscal 2016, 2015 and 2014. The increase in product costs was largely the result of increased product sales, driven by our Fiscal 2016 Acquisitions. We expect product gross margins to decrease slightly in fiscal 2017 as we prepare for larger-scale manufacturing in our Irish facility. It may take one-to-two years to optimize the manufacturing and supply chain infrastructure at this facility as we execute our whole-product solutions strategy.
Research and development expenses. R&D expenses were $18.5 million, $16.2 million, and $15.6 million for fiscal 2016, 2015 and 2014, respectively, or 26%, 26% and 27% of total revenue in each respective fiscal year. The fiscal 2016 increase from fiscal 2015 of $2.3 million, or 14%, was primarily the result of $1.8 million from our Fiscal 2016 Acquisitions, and the remainder from our DCB development activities. The fiscal 2015 increase from fiscal 2014 of $0.6 million, or 4%, was primarily the result of increased spending for our DCB development activities. We anticipate up to a 50% increase in R&D expenses in fiscal 2017 primarily related to development of proprietary products, including our DCB activities.
Selling, general and administrative expenses. Selling, general and administrative (“SG&A”) expenses were $18.0 million, $14.9 million and $14.7 million for fiscal 2016, 2015 and 2014, respectively, or 25%, 24% and 26% of total revenue in each respective fiscal year. The fiscal 2016 increase of $3.1 million or 21%, compared with fiscal 2015 was primarily the result of $1.4 million of higher stock-based compensation expense as the result of favorable trends in revenue, including the impact of the Fiscal 2016 Acquisitions, and earnings before income tax, depreciation and amortization (”EBITDA”), which is a non-GAAP measure used by management to determine incentive compensation, from the historical Medical Device and In Vitro Diagnostics businesses. Additionally, $1.7 million of additional SG&A expenses were attributable to fiscal 2016 acquisitions. The fiscal 2015 increase of $0.2 million or 1%, compared with fiscal 2014 was primarily related to increased compensation and legal fee expenses.
Acquisition transaction, integration and other costs. In fiscal 2016, we incurred $3.2 million in acquisition transaction, integration and other costs related to the Fiscal 2016 Acquisitions.
33
Acquisition related intangible asset amortization. As a result of our Fiscal 2016 Acquisitions, we acquired certain intangible assets which are being amortized over periods ranging from four to 14 years. In addition, for comparison purposes, we have reclassified amortization expense of $0.6 million, from fiscal 2015, to the acquisition-related intangible asset amortization expense line, which was originally reported in SG&A expense. The amortization that was reclassified was related to the fiscal 2007 BioFx acquisition. The increase in amortization expense of $1.8 million in fiscal 2016 is the result of the intangible assets acquired with the Fiscal 2016 Acquisitions.
Contingent consideration accretion expense. In fiscal 2016, we recorded $1.5 million of contingent consideration expense related to our contingent consideration liabilities from the Fiscal 2016 Acquisitions, due to the passage of time (i.e. accretion) as well as a revaluation adjustment of $0.1 million recorded in the third quarter of fiscal 2016. In future years, if there are changes in the amount, probability or timing of achievement of contingent consideration milestones, there may be material adjustments in the consolidated statements of income to reflect changes in the fair value of contingent consideration liabilities.
Other (loss) income. Major classifications of other (loss) income are as follows:
|
|
|
Year Ended September 30, |
|
|||||||||
|
(dollars in thousands) |
|
2016 |
|
|
2015 |
|
|
2014 |
|
|||
|
Investment income, net |
|
$ |
63 |
|
|
$ |
156 |
|
|
$ |
238 |
|
|
Gains on sales of strategic investments, contingent consideration milestone payments and other |
|
|
507 |
|
|
|
496 |
|
|
|
842 |
|
|
Foreign exchange loss |
|
|
(481 |
) |
|
|
— |
|
|
|
— |
|
|
Impairment losses on strategic investments |
|
|
— |
|
|
|
(1,500 |
) |
|
|
(1,184 |
) |
|
Other income (loss) |
|
$ |
89 |
|
|
$ |
(848 |
) |
|
$ |
(104 |
) |
Other (loss) income was income of $0.1 million in fiscal 2016 compared with a loss of $0.8 million in fiscal 2015 and a loss of $0.1 million in fiscal 2014. Other (loss) income has fluctuated between the fiscal years as a result of gains from available-for-sale securities and strategic investments as well as other-than-temporary impairment losses from strategic investments. Fiscal 2016 included $0.5 million of foreign currency losses related to Euro-denominated contingent consideration liabilities arising from the Creagh Medical acquisition, offset by consideration received from the sale of our ownership interest in a strategic investment of $0.5 million. Fiscal 2015 included an other-than-temporary impairment loss of $1.5 million related to our investment in CeloNova, partially offset by a gain of $0.5 million associated with the sale of our investment in Intersect ENT. Fiscal 2014 included an other-than-temporary loss of $1.2 million associated with our investment in ThermopeutiX partially offset by $0.7 million of contingent consideration milestone payments received from the sale of our ownership interest in Vessix Vascular which occurred in fiscal 2013. Income from investments was $0.1 million, $0.2 million and $0.2 million for fiscal 2016, 2015 and 2014, respectively. The decrease in investment net income from year to year primarily reflects investment balances as a result of liquidating our longer term investments in fiscal 2015 which generated higher income and allowed us to move toward a liquid short-term portfolio to meet strategic objectives. In addition, we recognized and realized investment losses of less than $0.1 million in fiscal 2016 and investment gains of $0.1 million in both fiscal 2015 and 2014.
Income tax provision. The reconciliation of the statutory U.S. federal tax rate of 35% and our effective tax rate from continuing operations is as follows:
|
|
|
Year Ended September 30, |
|
|||||||||
|
|
|
2016 |
|
|
2015 |
|
|
2014 |
|
|||
|
Statutory U.S. federal income tax rate |
|
|
35.0 |
% |
|
|
35.0 |
% |
|
|
35.0 |
% |
|
State income taxes, net of federal benefit |
|
|
0.8 |
|
|
|
0.4 |
|
|
|
0.6 |
|
|
Subsidiary capital gain |
|
|
15.5 |
|
|
|
— |
|
|
|
— |
|
|
Foreign rate differential |
|
|
3.7 |
|
|
|
— |
|
|
|
— |
|
|
Valuation allowance change |
|
|
(14.8 |
) |
|
|
1.9 |
|
|
|
(1.6 |
) |
|
Federal research and development tax credit |
|
|
(3.4 |
) |
|
|
(0.4 |
) |
|
|
(0.4 |
) |
|
Stock based compensation - excess benefit |
|
|
(3.6 |
) |
|
|
— |
|
|
|
— |
|
|
Manufacturing deduction |
|
|
(1.6 |
) |
|
|
— |
|
|
|
— |
|
|
Transaction costs |
|
|
4.5 |
|
|
|
— |
|
|
|
— |
|
|
Contingent consideration accretion |
|
|
3.1 |
|
|
|
— |
|
|
|
— |
|
|
Other |
|
|
1.9 |
|
|
|
(2.4 |
) |
|
|
0.3 |
|
|
Effective tax rate |
|
|
41.1 |
% |
|
|
34.5 |
% |
|
|
33.9 |
% |
34
The difference between the U.S. federal statutory tax rate of 35.0% and our effective tax rate reflects the impact of state income taxes, permanent tax items, non-deductible acquisition items, valuation allowance changes for capital gains and losses, capital gains recognized upon restructuring a subsidiary, differences between U.S. and foreign income tax rates, stock based compensation, and other tax items. The income tax provision was $7.0 million, $6.3 million and $6.3 million, respectively, for fiscal 2016, 2015 and 2014 resulting in effective tax rates of 41.1%, 34.5% and 33.9%, respectively. The variability in our effective tax rate is primarily the result of changes in deferred tax asset valuation allowances resulting from both other-than-temporary impairment losses and gains on the sales of certain strategic investments, as well as non-deductible transaction costs, contingent consideration accretion expense and foreign currency losses associated with the Fiscal 2016 Acquisitions. Further, deferred tax assets related to net operating losses of Creagh Medical, including those incurred prior to the acquisition and those incurred in fiscal 2016, have been offset by a valuation allowance as it is not more likely than not that the tax assets will be realized in future periods, due to Creagh Medical’s history of taxable losses. We have historically recorded other-than-temporary impairment losses with no income tax effect as it has not been more likely than not that we would generate sufficient capital gains to realize these benefits. Consequently, other-than-temporary impairments and capital gains, which are both discussed in detail under the caption Other (loss) income, are recorded without any income tax expense or benefit. Additionally, new guidance related to accounting for excess tax benefits (ASU No. 2016-09, Compensation – Stock Compensation (ASC Topic 718): Improvements to Employee Share-Based Payment Accounting) has been adopted prospectively, effective October 1, 2015, resulting in recognition of a tax benefit from the excess tax benefits realized from share options vested or exercised of $0.6 million for the fiscal year ended September 30, 2016. Previously, excess tax benefits have been recorded within additional paid-in capital on the consolidated balance sheets. The adoption of this accounting standard could create volatility in the Company's effective tax rate in future periods.
We recorded $0.2 million of retroactive 2015 U.S. research and development tax credit discrete benefits for the period from January 1, 2015 to September 30, 2015 in fiscal 2016 resulting from the December 2015 signing of the Protecting Americans from Tax Hikes Act (“PATH Act”) of 2015. This reduced our fiscal 2016 effective rate by 1.3% in fiscal 2016. The PATH Act made the research and development tax credit permanent. Accordingly, the tax benefits associated with the credit for the period from October 1, 2015 to September 30, 2016 have also been included as a benefit and have reduced the effective rate by 2.1% in fiscal 2016.
We recorded $0.2 million of retroactive 2014 U.S. research and development tax credit discrete benefits for the period from January 1, 2014 to September 30, 2014 in fiscal 2015 resulting from the December 2014 signing of the Tax Increase Protection Act of 2014. This reduced our fiscal 2015 effective rate by 1.0% in fiscal 2015. We also recorded a federal research and development credit in fiscal 2015 generated for the period from October 1, 2014 to December 31, 2014 prior to the expiration of the benefit on December 31, 2014.
Discontinued Operations. We recorded a loss from discontinued operations in fiscal 2014 of $0.2 million associated with the resolution of a litigation matter and less than $0.1 million related to our indemnification obligations to Evonik related to a contingent consideration matter associated with the PR Pharma intellectual property purchased by Evonik in the Pharma Sale. Our discontinued operations losses are recorded net of the income tax impact of these transactions. There was no discontinued operations activity in fiscal 2016 and no loss from discontinued operations in fiscal 2015.
Segment Operating Results
Operating income for each of our reportable segments was as follows:
|
|
|
For the Year Ended September 30, |
|
|
Increase/(Decrease) |
|
|
Increase/(Decrease) |
|
|||||||||||||||||||
|
(dollars in thousands) |
|
2016 |
|
|
2015 |
|
|
2014 |
|
|
2016 vs. 2015 |
|
|
2015 vs. 2014 |
|
|||||||||||||
|
Operating income (loss) |
|
|
|
|
|
|
|
|
|
|
|
|
|
|
|
|
|
|
|
|
|
|
|
|
|
|
|
|
|
Medical Device |
|
$ |
16,975 |
|
|
$ |
21,192 |
|
|
$ |
22,636 |
|
|
$ |
(4,217 |
) |
|
|
(20 |
)% |
|
$ |
(1,444 |
) |
|
|
(6 |
)% |
|
In Vitro Diagnostics |
|
|
7,115 |
|
|
|
4,484 |
|
|
|
3,459 |
|
|
|
2,631 |
|
|
|
59 |
% |
|
|
1,025 |
|
|
|
30 |
% |
|
Total segment operating income |
|
|
24,090 |
|
|
|
25,676 |
|
|
|
26,095 |
|
|
|
(1,586 |
) |
|
|
(6 |
)% |
|
|
(419 |
) |
|
|
(2 |
)% |
|
Corporate |
|
|
(7,231 |
) |
|
|
(6,587 |
) |
|
|
(7,519 |
) |
|
|
(644 |
) |
|
|
10 |
% |
|
|
932 |
|
|
|
(12 |
)% |
|
Total operating income from continuing operations |
|
$ |
16,859 |
|
|
$ |
19,089 |
|
|
$ |
18,576 |
|
|
$ |
(2,230 |
) |
|
|
(12 |
)% |
|
$ |
513 |
|
|
|
3 |
% |
Medical Device. Operating income was $17.0 million, $21.2 million and $22.6 million in fiscal 2016, 2015 and 2014, respectively. Operating income decreased by 20% in fiscal 2016 from fiscal 2015. The decrease was primarily the result of $10.0 million in higher
35
non-product operating expenses, partially offset by $2.2 million of incremental product gross margin stemming from a $7.3 million increase in revenue. Revenue for fiscal 2016 includes increased royalty and licensing revenue of $1.4 million. This increase included the previously discussed increase from a catch-up payment of $2.9 million which was partially offset by a $1.4 million revenue settlement to correct a cumulative overstatement of royalty revenue, of which $1.0 million was out-of-period and related to periods prior to fiscal 2016. Royalty revenue also reflected a decline of $2.1 million as the result of expiration patents protecting the third generation of our Photolink hydrophilic technology. The remaining increase in revenue in fiscal 2016 was generated by increased product sales of $3.9 million and research, development and other revenue of $1.9 million. Our Fiscal 2016 Acquisitions accounted for $4.1 million of the increases in these two revenue categories. Operating expenses, excluding product costs, increased as a result of transaction, integration, amortization, and contingent consideration accretion expenses totaling $6.5 million in fiscal 2016 associated with the Fiscal 2016 Acquisitions. Additionally, the Medical Device segment incurred $3.5 million in higher SG&A and R&D expenses as a result of our Fiscal 2016 Acquisitions.
Operating income decreased by 6% in fiscal 2015 from fiscal 2014. The decrease was primarily the result of $4.2 million in higher expenses, partially offset by a $2.9 million increase in revenue. The largest increases to expenses in fiscal 2015 compared to fiscal 2014 resulted from a $2.5 million claim settlement (for further information refer to Note 11 of the Consolidated Financial Statements), $0.6 million in higher compensation costs, $0.6 million in higher planned spending on R&D primarily related to drug-coated balloon activities and a $0.4 million higher cost of sales as a result of increased revenue. The increase in revenue in fiscal 2015 was generated by each of our revenue categories with increased royalty and licensing revenue of $1.5 million, of which $0.6 million was from a one-time catch up payment related to periods prior to fiscal 2015, as well as increased customer demand resulting in increases in R&D revenue of $0.8 million and reagent product sales of $0.5 million.
In Vitro Diagnostics. Operating income was $7.1 million, $4.5 million and $3.5 million in fiscal 2016, 2015 and 2014, respectively. Operating income increased by 59% in fiscal 2016 compared with fiscal 2015 resulting from higher revenue of $2.2 million, partially offset by a related product cost increase of $0.7 million, as well as lower SG&A costs. Fiscal 2016 operating income benefited from increased demand across all product categories. Product gross margins were steady at 64% in both fiscal 2016 and 2015. Direct SG&A expenses decreased by $0.7 million in fiscal 2016 compared with fiscal 2015 as a result of lower legal expenses from the settlement of a legal matter in the fourth quarter of fiscal 2015.
Operating income increased by 30% in fiscal 2015 compared with fiscal 2014 resulting from higher revenue of $1.6 million and a related product costs increase of $0.2 million. Fiscal 2015 operating margin was positively impacted by product mix which included higher stabilization and lower antigen sales. Fiscal 2015 benefited from a lower prior-year comparison as the In Vitro Diagnostic revenue declined as a result of customer inventory rebalancing activities in the second quarter of fiscal 2014 which resulted in lower comparable prior-year revenue. Product gross margins improved to 64% in fiscal 2015, which is up from 61% in fiscal 2014.The improvement in gross margins is primarily driven by favorable product mix shifts to stabilization sales and improved operating leverage. Direct operating expenses increased by $0.4 million in fiscal 2015 compared with fiscal 2014 principally from higher legal expenses associated with the above noted litigation matter that was settled in the fourth quarter of fiscal 2015.
Corporate. The Corporate category includes expenses for administrative corporate functions, such as executive, corporate accounting, legal, human resources and Board of Directors related fees and expenses that have not been fully allocated to the Medical Device and In Vitro Diagnostics segments. Corporate also may include expenses, such as litigation, which if not specific to a segment are not allocated to our operating segments. The unallocated Corporate expense operating loss was $7.2 million, $6.6 million and $7.5 million in fiscal 2016, 2015 and 2014, respectively. The $0.6 million, or 10% increase in corporate expenses in fiscal 2016 compared to fiscal 2015 was due to a $0.9 million increase in stock-based compensation expense, offset by reductions in other corporate expenses. The $0.9 million, or 12%, decrease in corporate expense in fiscal 2015 compared to fiscal 2014 was primarily a result of higher comparable expenses in fiscal 2014 resulting from a $0.9 million expense associated with accelerated vesting of Board of Director stock awards and the granting of an equity award to the former Chairman of the Company’s Board in recognition of his contributions to the Company during his years of service on the Board of Directors.
Liquidity and Capital Resources
As of September 30, 2016, we had working capital of $48.4 million, a decrease of $14.7 million from September 30, 2015. Working capital is defined by us as current assets minus current liabilities. The decrease from the prior-year end is a result of several factors including an increase in investing activities, partially offset by cash provided by operating activities. Our cash and cash equivalents and available-for-sale investments totaled $46.9 million as of September 30, 2016, a decrease of $8.7 million from $55.6 million as of September 30, 2015, principally associated with cash flow from operating activities of $25.2 million offset by the $25.9 million net cash payments related to our Fiscal 2016 Acquisitions and $8.2 million of plant and equipment expenditures.
36
The Company’s investment policy excludes ownership of collateralized mortgage obligations, mortgage-backed derivatives and other derivative securities without prior written approval of the Board of Directors. During the second quarter of fiscal 2015, the Company liquidated its investment portfolio to support corporate initiatives. As a result, the ending balance of available-for-sale investments as of September 30, 2015 was zero. During 2016, as a result of cash on hand in excess of operating needs, the Company made several investments in available for sale securities, resulting in an ending balance as of September 30, 2016 of $22.0 million. Our investment policy requires that for investments with a duration of greater than one year, no more than 5% of investments be held in any one credit or issue, excluding U.S. government and government agency obligations. The primary investment objective of the portfolio is to provide for the safety of principal and appropriate liquidity. Management plans to continue to direct its investment advisors to manage the Company’s securities investments primarily for the safety of principal for the foreseeable future as it continues to assess other investment opportunities and uses of its cash and securities investments, including those described below.
In the fourth quarter of fiscal 2014, Intersect ENT, which was previously recorded as a strategic investment of the Company, completed its initial public offering. We reclassified our investment in Intersect ENT from other assets to an available-for-sale security as of September 30, 2014. In the second quarter of fiscal 2015, our shares were liquidated and a gain of $0.5 million recognized and realized in the consolidated statement of income.
On November 4, 2013, we entered into a three-year $20.0 million secured revolving credit facility. On November 2, 2016, we amended and restated the secured revolving credit facility pursuant to an Amended and Restated Credit Agreement (the "Credit Agreement") with Wells Fargo Bank, National Association (the "Bank"). The Credit Agreement increases availability under the secured revolving line of credit from $20.0 million to $30.0 million and extends the maturity of the previous facility by three years. The Company's obligations under the Credit Agreement are secured by substantially all of its and its subsidiaries' assets, other than intellectual property and real estate. The Company has also pledged the majority of the stock of its subsidiaries to secure such obligations. Interest expense under the Credit Agreement is reduced as compared to the Company's prior secured revolving credit facility and accrues at a benchmark rate, plus an applicable margin ranging from 1.00% to 1.75%. A facility fee is payable quarterly on unused commitments at a rate of 0.15% per annum. The interest rate margins are determined based on the Company's ratio of total funded debt to EBITDA (as defined in the Credit Agreement).
The Credit Agreement contains affirmative and negative covenants customary for a transaction of this type which, among other things, require the Company to meet certain financial tests. The Credit Agreement also contains covenants which, among other things, limit the Company's ability to: incur unfinanced capital expenditures in an amount greater than $10.0 million in the aggregate during any fiscal year; incur additional debt; make certain investments; create or permit certain liens; create or permit restrictions on the ability of subsidiaries to pay dividends or make other distributions; consolidate or merge; and engage in other activities customarily restricted in such agreements, in each case subject to exceptions permitted by the Credit Agreement. The Credit Agreement also contains customary events of default, the occurrence of which would permit the Bank to terminate its commitment and accelerate the loans.
Concurrent with the signing of the new credit agreement in November 2016, we entered into a three-year $5.0 million multicurrency overdraft facility in Ireland.
On July 31, 2014, we filed a registration statement with the Securities and Exchange Commission, using a “shelf” registration process. Under this shelf process we may sell, either separately or together, debt securities, preferred stock, depositary shares, common stock and security warrants in one or more offerings up to an aggregate initial offering price of $175.0 million. As of September 30, 2016, we have not completed any securities offerings associated with the registration statement.
We believe that our existing cash, cash equivalents and investments, together with our $30.0 million credit facility and $175.0 million shelf registration statement, will provide liquidity sufficient to fund our operations and planned capital expenditures in the next twelve months. There can be no assurance, however, that our business will continue to generate cash flows at current levels, and disruptions in financial markets or an increase in interest rates may negatively impact our ability to access capital in a timely manner and on attractive terms. In the event Creagh Medical begins to generate taxable income in future years, repatriation of its earnings may result in substantial U.S. tax cost. Our current plans do not foresee a need to repatriate funds that are designated as permanently reinvested in order to fund our operations or meet currently anticipated liquidity and capital investment needs.
37
The following table depicts our cash flows provided by operating activities from continuing operations for fiscal 2016, 2015 and 2014:
|
|
|
For the Years Ended September 30, |
|
|||||||||
|
|
|
2016 |
|
|
2015 |
|
|
2014 |
|
|||
|
(dollars in thousands) |
|
|
|
|
|
|
|
|
|
|
|
|
|
Net income |
|
$ |
9,985 |
|
|
$ |
11,947 |
|
|
$ |
12,031 |
|
|
Loss from discontinued operations |
|
|
— |
|
|
|
— |
|
|
|
176 |
|
|
Depreciation and amortization |
|
|
4,873 |
|
|
|
2,805 |
|
|
|
2,715 |
|
|
Stock-based compensation |
|
|
3,844 |
|
|
|
2,381 |
|
|
|
3,337 |
|
|
Contingent consideration accretion and unrealized foreign exchange loss |
|
|
1,936 |
|
|
|
— |
|
|
|
— |
|
|
Impairment losses on strategic investments |
|
|
— |
|
|
|
1,500 |
|
|
|
1,184 |
|
|
Deferred taxes |
|
|
261 |
|
|
|
93 |
|
|
|
(352 |
) |
|
Net other operating activities |
|
|
(567 |
) |
|
|
(963 |
) |
|
|
(1,076 |
) |
|
Net change in other operating assets and liabilities |
|
|
4,834 |
|
|
|
(2,697 |
) |
|
|
522 |
|
|
Net cash provided by operating activities from continuing operations |
|
$ |
25,166 |
|
|
$ |
15,066 |
|
|
$ |
18,537 |
|
Operating Activities. We generated cash flows from operating activities from continuing operations of $25.2 million, $15.1 million and $18.5 million in fiscal 2016, 2015 and 2014, respectively. The fiscal 2016 increase compared with fiscal year 2015, relates primarily to increases in non-cash depreciation, amortization, stock-based compensation and contingent consideration accretion expenses, due primarily to the Fiscal 2016 Acquisitions. Additionally, changes in working capital including accelerated collection of customer receivables, which reduced accounts receivable $0.6 million, and increased amounts due to customers of $0.8 million, as well as a $2.6 million increase in accrued compensation expenses including payroll taxes and a $0.4 million increase in other accrued expenses.
The fiscal 2015 decrease compared with fiscal year 2014, relates primarily to a $3.3 million increase in use of cash in accounts receivable related to timing of customer payments and higher product revenue generation, in addition to $0.7 million increased use of cash for inventory to support safety stock requirements, partially offset by $1.1 million of lower use in account payable and accruals primarily resulting from higher incentive compensation accruals.
Investing Activities. While we used cash in investing activities from continuing operations of $55.5 million in fiscal 2016, we generated cash flows from investing activities from continuing operations of $16.7 million and $22.4 million in fiscal 2015 and 2014, respectively. We invested $8.2 million, $1.9 million and $2.3 million in property and equipment in fiscal 2016, 2015 and 2014, respectively. The increase in fiscal 2016 property and equipment additions was the result of purchasing the Creagh Medical facility for $2.8 million and other investments in our whole-products strategy. We acquired Creagh Medical and NorMedix in fiscal 2016 for $25.9 million of net cash. We also purchased available-for-sale securities for $22.0 million, net of sales proceeds, in fiscal 2016. In addition, we received $0.5 million of sales proceeds from the sale of a strategic investment. In fiscal 2015, we received cash proceeds aggregating $18.8 million net, from sales of available-for-sale securities as we adjusted our investment portfolio, moving toward a liquid short-term portfolio to meet strategic objectives. In addition, we received cash proceeds of $0.5 million from our sale of Intersect ENT shares in fiscal 2015, $0.7 million from contingent consideration milestone events related to the sale of our Vessix strategic investment in fiscal 2014, and $2.3 million from the sale of our Vessix and OctoPlus strategic investments in fiscal 2013.
Financing Activities. We used cash flows from financing activities from continuing operations of $(0.2) million, $(19.7) million and $(12.9) million in fiscal 2016, 2015 and 2014, respectively. The primary financing activities in fiscal 2016 related to the payment of contingent consideration required by the terms of a prior-year acquisition in our IVD segment and payments of $0.4 million to purchase common stock to pay employee taxes resulting primarily from the issuance of common shares associated with our fiscal 2013-2015 performance share program. The primary financing activity in fiscal 2015 and 2014 was related to the repurchase of common stock of $20.0 million and $12.5 million, respectively. We also generated $0.5 million, $0.7 million and $0.5 million in fiscal 2016, 2015 and 2014, respectively, from the sale of common stock pursuant to our stock-based compensation arrangements.
On November 6, 2015, the Company’s Board of Directors authorized it to repurchase up to an additional $20.0 million (“fiscal 2016 authorization”) of the Company’s outstanding common stock in open-market purchases, privately negotiated transactions, block trades, accelerated share repurchase (“ASR”) transactions, tender offers or by any combination of such methods. This share repurchase program does not have a fixed expiration date.
38
On November 5, 2014, the Company’s Board of Directors authorized it to repurchase up to $30.0 million (“fiscal 2015 authorization”) of the Company’s outstanding common stock in open-market purchases, privately negotiated transactions, block trades, accelerated share repurchase transactions, tender offers or by any combination of such methods. This share repurchase program does not have a fixed expiration date.
On November 11, 2014, the Company entered into an accelerated share repurchase program with Wells Fargo Bank, National Association. In connection with the agreement, the Company made an initial $20.0 million payment to the bank and immediately received an initial delivery of 758,143 shares of its common stock with a fair value of $16.0 million as of the purchase date. Effective as of the date of the initial share purchase in fiscal 2015, the transaction was accounted for as a share retirement, resulting in a reduction of common stock of less than $0.1 million, additional paid-in capital of $2.5 million and retained earnings of $13.5 million. The remaining $4.0 million of the Company’s payment was also reported as a reduction in retained earnings. The specific number of shares that the Company ultimately purchased under the ASR agreement was based on the volume weighted average price (“VWAP”) of the Company’s common stock during the purchase period, less an agreed upon discount. In the aggregate, the Company purchased 847,864 shares under the ASR program for an average price of $23.59 per share. Based on the facts associated with the agreement, the forward contract was indexed to the Company’s common stock and met the U.S. GAAP requirements to be classified as permanent equity. The contract was completed July 8, 2015.
As of December 2, 2016, the Company has an aggregate of $30.0 million available for future common stock purchases under the fiscal 2015 authorization and fiscal 2016 authorization.
During fiscal 2014, we repurchased 485,577 shares of common stock for an aggregate amount of $12.5 million, including $1.1 million in open market repurchases which existed as of September 30, 2013, at an average price of $23.77 per share.
Discontinued Operations. Our Pharmaceuticals discontinued operations used operating cash of less than $0.1 million and $0.4 million in fiscal 2015 and 2014, respectively. Cash generated from financing activities of less than $0.1 million in fiscal 2015 related to transfers of cash from continuing operations of Surmodics and consisted of cash used to make payments on accrual balances. Cash used in discontinued operations in fiscal 2015 related to payments of certain accounts payable balances. Cash used in discontinued operations in fiscal 2014 related to payments made in connection with the resolution of the SRI litigation matter as well as the Evonik indemnification matter both discussed in Note 12 to the consolidated financial statements included in “Item 8. Financial Statements and Supplementary Data” in this Annual Report on Form 10-K, and payments of certain accounts payable balances.
Customer Concentrations. Our licensed technologies provide royalty revenue, which represents the largest revenue stream to us. We have licenses with a diverse base of customers and certain customers have multiple products using our technology. Medtronic is our largest customer at approximately 25% of total consolidated revenue for fiscal 2016. Medtronic has several separately licensed products that generate royalty revenue for Surmodics, none of which represented more than 4% of our total revenue. No other individual customer using licensed technology constitutes more than 6% of our total revenue.
Our licensing agreements with many of our customers, including most of our significant customers, cover many licensed products that each separately generates royalty revenue. This structure reduces the potential risk to our operations that may result from reduced sales (or the termination of a license) of a single product for any specific customer.
Off-Balance Sheet Arrangements and Contractual Obligations. As of September 30, 2016, we did not have any off-balance sheet arrangements.
Presented below is a summary of contractual obligations and payments due by period (in thousands). See Note 11 to the consolidated financial statements in “Item 8. Financial Statements and Supplementary Data” in this Annual Report on Form 10-K for additional information regarding the below obligations.
|
(dollars in thousands) |
|
Total |
|
|
Less than 1 Year |
|
|
1-3 Years |
|
|
4-5 Years |
|
|
More than 5 Years |
|
|||||
|
Operating leases |
|
$ |
407 |
|
|
$ |
135 |
|
|
$ |
186 |
|
|
$ |
86 |
|
|
$ |
— |
|
|
Contingent consideration (1) |
|
|
14,517 |
|
|
|
925 |
|
|
|
13,592 |
|
|
|
— |
|
|
|
— |
|
|
Minimum annual royalty obligation (2) |
|
|
2,453 |
|
|
|
223 |
|
|
|
446 |
|
|
|
446 |
|
|
|
1,338 |
|
|
Total |
|
$ |
17,377 |
|
|
$ |
1,283 |
|
|
$ |
14,224 |
|
|
$ |
532 |
|
|
$ |
1,338 |
|
39
|
contingent consideration related to the Creagh Medical acquisition is denominated in Euros and not hedged. In connection with the acquisition of NorMedix, we are contingently liable for milestone payments aggregating up to $7.0 million, which are payable as earned. While it is not certain if and/or when these payments will be made, the maturity dates included in this table reflect our best estimates. See Note 3 to the consolidated financial statements in “Item 8. Financial Statements and Supplementary Data” in this Annual Report on Form 10-K for additional information regarding the Fiscal 2016 Acquisitions and the related contingent consideration liabilities. |
(2) Minimum annual royalty obligation relates to payments associated with an in-bound license agreement whereby we pay, at a minimum, €200,000 euros (equivalent to approximately $223,000 as of September 30, 2016) to gain access to polymer technology which is utilized in a drug delivery customer license. The agreement includes an early termination clause. However, the future obligations above are presented through September 2027, the remaining term of the agreement, as it is not currently more likely than not that the agreement would be terminated early.
As of September 30, 2016, our gross liability including interest and penalties for uncertain tax positions was $1.5 million. We are not able to reasonably estimate the amount by which the liability will increase or decrease over an extended period of time or whether a cash settlement of the liability will be required. Therefore, these amounts have been excluded from the schedule of contractual obligations above.
In addition, we may be required to pay stock consideration of up to 480,059 of our common shares related to another business acquisition, contingent on future achievement of certain development objectives of the acquired business. The timing and amount is uncertain, thus we are not able to reasonably estimate whether settlement of the contingent liability will be required. Therefore, this amount has been excluded from the schedule of contractual obligations above.
New Accounting Pronouncements
Accounting Standards to be Adopted
In May 2014, the Financial Accounting Standards Board (“FASB”) issued Accounting Standards Update (“ASU”) No. 2014-09, Revenue from Contracts with Customers (ASC Topic 606). Principles of this guidance require entities to recognize revenue in a manner that depicts the transfer of goods or services to customers in amounts that reflect the consideration an entity expects to be entitled to in exchange for those goods or services. The guidance also requires expanded disclosures relating to the nature, amount, timing, and uncertainty of revenue and cash flows arising from contracts with customers. Additionally, qualitative and quantitative disclosures are required about customer contracts, significant judgments and changes in judgments, and assets recognized from the costs to obtain or fulfill a contract. This accounting standard will be effective for the Company beginning in the first quarter of fiscal year 2019 (October 1, 2018) using one of two prescribed retrospective methods. The Company is currently evaluating the impact that the adoption of this standard will have on the Company’s business model and consolidated results of operations, cash flows and financial position. We currently believe the impact may be material due to the potential acceleration of minimum license fees and a one quarter acceleration of royalty revenue pursuant to our hydrophilic license agreements.
In February 2016, the FASB issued ASU No. 2016-02, Leases (ASC Topic 842). The new guidance primarily affects lessee accounting, while accounting by lessors will not be significantly impacted by the update. The update maintains two classifications of leases: finance leases, which replace capital leases, and operating leases. Lessees will need to recognize a right-of-use asset and a lease liability on the statement of financial position for those leases previously classified as operating leases under the old guidance. The liability will be equal to the present value of lease payments. The asset will be based on the liability, subject to adjustment, such as for direct costs. The accounting standard will be effective for the Company beginning the first quarter of fiscal year 2020 (October 1, 2019) using a modified retrospective approach. The Company is currently evaluating the impact that the adoption of this standard will have on the Company’s results of operations, cash flows and financial position.
In June 2016, the FASB issued ASU No. 2016-13, Financial Instruments – Credit Losses (ASU Topic 326), Measurement of Credit Losses on Financial Statements. This accounting standard requires a financial asset (or a group of financial assets) measured at an amortized cost basis to be presented at the net amount expected to be collected. The allowance for credit losses is a valuation account that is deducted from the amortized cost basis of the financial asset(s) to present the net carrying value at the amount expected to be collected on the financial asset. The accounting standard will be effective for the Company beginning in the first quarter of fiscal 2020 (October 1, 2019), and early adoption is permitted. We currently are evaluating the impact that the adoption of this standard will have on the Company’s results of operations, cash flows and financial position.
40
In August 2016, the FASB issued ASU No. 2016-15, Statement of Cash Flows (Topic 230): Classification of Certain Cash Receipts and Cash Payments. The new guidance clarifies requirements for presentation and classification of the following items within the statement of cash flows: debt prepayments, settlement of zero coupon debt instruments, contingent consideration payments, insurance proceeds, securitization transactions and distributions from equity method investees. The update also addresses classification of transactions that have characteristics of more than one class of cash flows. The accounting standard will be effective for the Company beginning in the first quarter of fiscal 2018. Early adoption is permitted, including adoption in an interim period. We currently are evaluating the impact that the adoption of this standard will have on the Company’s consolidated statements of cash flows.
Accounting Standards Adopted
In September 2015, the FASB issued ASU No. 2015-16, Business Combinations (ASC Topic 805): Simplifying the Accounting for Measurement-Period Adjustments. The update requires an acquirer to recognize adjustments to provisional amounts that are identified during the measurement period in the reporting period in which the adjustment amounts are determined, including the cumulative effect of the change in provisional amounts as if the accounting had been completed at the acquisition date. The adjustments related to previous reporting periods since the acquisition date must be disclosed by income statement line item either on the face of the income statement or in the notes. The accounting standard is effective for fiscal years beginning after December 15, 2015, including interim periods within those fiscal years, with early adoption permitted. The Company adopted this accounting standard in the first quarter of fiscal 2016 without any material impact on the Company’s financial position or financial results.
In November 2015, the FASB issued ASU No. 2015-17, Balance Sheet Classification of Deferred Taxes, which eliminates the current requirement to present deferred tax liabilities and assets as current and noncurrent in a classified balance sheet. Instead, entities will be required to classify all deferred tax assets and liabilities as noncurrent. This accounting standard is effective for the Company beginning in its first quarter of fiscal year 2018 and early implementation is permitted using either the prospectively or retroactive adoption method. The Company prospectively adopted this accounting standard in the first quarter of fiscal 2016.
In March 2016, the FASB issued ASU No. 2016-09, Compensation – Stock Compensation (ASC Topic 718): Improvements to Employee Share-Based Payment Accounting. The accounting standard intends to simplify several areas of accounting for share-based compensation arrangements, including the income tax impact, classification of awards as either equity or liabilities, and classification on the statement of cash flows. The accounting standard will be effective for the Company beginning in the first quarter of fiscal 2018 (October 1, 2017), and early adoption is permitted. The Company adopted this accounting standard in the fourth quarter of fiscal 2016, with application being applied prospectively from the beginning of fiscal 2016. The impact of the adoption of this ASU is discussed further in Notes 2, 6 and 8 to the consolidated financial statements.
No other new accounting pronouncement issued or effective has had, or is expected to have, a material impact on our consolidated financial statements.
ITEM 7A. QUANTITATIVE AND QUALITATIVE DISCLOSURES ABOUT MARKET RISK.
Our investment policy requires investments with high credit quality issuers and limits the amount of credit exposure to any one issuer. Our investments consist principally of commercial paper instruments and corporate bonds with varying maturity dates, all of which are less than one year. Because of the credit criteria of our investment policies, the primary market risk associated with these investments is interest rate risk. Surmodics does not use derivative financial instruments to manage interest rate risk or to speculate on future changes in interest rates. As of September 30, 2016, the Company did not have any outstanding borrowings on its credit facility and owned no interest-bearing securities with more than six months remaining till maturity, and therefore a one percentage point increase in interest rates would not have a material impact on the results of operations or cash flows. Our policy also allows the Company to hold a substantial portion of funds in cash and cash equivalents, which are defined as financial instruments with original maturities of three months or less and may include money market instruments, certificates of deposit, repurchase agreements, corporate bonds and commercial paper instruments.
Management believes that a change in raw material prices would not have a material impact on future earnings or cash flows because our inventory exposure is not material.
With the Creagh Medical acquisition in November 2015, we are exposed to increasing Euro currency risk with respect to our manufacturing operations in Ireland. In a period where the U.S. dollar is strengthening or weakening as compared to the Euro, our revenues and expenses denominated in Euro’s are translated into U.S. dollars at a lower or higher value than they would be in an otherwise constant currency exchange rate environment. Prior to this acquisition, our international operations consisted primarily of
41
sales of reagent and stabilization chemicals and changes in foreign currencies relative to the U.S. Dollar did not have a significant effect on our operations. All sales transactions are denominated in U.S. dollars or Euros. We generate royalty revenue from the sale of customer products in foreign jurisdictions. Royalties generated in foreign jurisdictions by customers are converted and paid in U.S. dollars per contractual terms. Substantially all of our purchasing transactions are denominated in U.S. Dollars or Euros. To date, we have not entered into any foreign currency forward exchange contracts or other derivative financial instruments to hedge the effects of adverse fluctuations in foreign currency exchange.
ITEM 8. FINANCIAL STATEMENTS AND SUPPLEMENTARY DATA.
The consolidated balance sheets as of September 30, 2016 and 2015 and the consolidated statements of income, comprehensive income, stockholders’ equity and cash flows for each of the three years in the period ended September 30, 2016, together with Report of Independent Registered Public Accounting Firm and related notes (including selected unaudited quarterly financial data) begin on page F-1 of this Form 10-K.
ITEM 9. CHANGES IN AND DISAGREEMENTS WITH ACCOUNTANTS ON ACCOUNTING AND FINANCIAL DISCLOSURE.
None.
ITEM 9A. CONTROLS AND PROCEDURES.
|
1. |
Disclosure Controls and Procedures. |
The Company maintains disclosure controls and procedures as defined in Rules 13a-15(e) and 15d-15(e) of the Securities Exchange Act of 1934, as amended (the “Exchange Act”) that are designed to ensure that information required to be disclosed in our reports filed under the Exchange Act, is recorded, processed, summarized and reported within the time periods specified in the SEC’s rules and forms, and that such information is accumulated and communicated to our management, including our Chief Executive Officer and Chief Financial Officer, as appropriate, to allow timely decisions regarding required disclosure.
In designing and evaluating the disclosure controls and procedures, management recognizes that any controls and procedures, no matter how well designed and operated, can provide only reasonable assurance of achieving the desired control objectives, and no evaluation can provide absolute assurance that all control issues and instances of fraud, if any, within the company have been detected.
Management, with the participation of the Chief Executive Officer (“CEO”) and Chief Financial Officer (“CFO”), carried out an evaluation of the effectiveness of the design and operation of the Company’s disclosure controls and procedures pursuant to Rule 13a-15(e) and 15d–15(e) of the Exchange Act as of September 30, 2016, the end of the period covered by this Annual Report on form 10-K. Based on such evaluation, the CEO and CFO concluded that our disclosure controls and procedures were not effective due to the material weakness in internal control over financial reporting described below.
|
2. |
Internal Control over Financial Reporting. |
a. Management’s Report on Internal Control Over Financial Reporting. Our management is responsible for establishing and maintaining adequate internal control over financial reporting, as defined in Exchange Act Rules 13a-15(f) and 15d-15(f). The Company’s internal control over financial reporting is a process designed to provide reasonable assurance regarding the reliability of financial reporting and the preparation of financial statements for external purposes in accordance with U.S. generally accepted accounting principles (“U.S. GAAP”). Our internal control over financial reporting includes those policies and procedures that: (i) pertain to the maintenance of records that, in reasonable detail, accurately and fairly reflect the transactions and dispositions of our assets; (ii) provide reasonable assurance that transactions are recorded as necessary to permit preparation of financial statements in accordance with U.S. GAAP, and that our receipts and expenditures are being made only in accordance with authorization of our management and directors; and (iii) provide reasonable assurance regarding prevention or timely detection of unauthorized acquisition, use or disposition of assets that could have a material effect on our consolidated financial statements.
All internal control systems, no matter how well designed, have inherent limitations. Therefore, even those systems determined to be effective can provide only reasonable assurance with respect to financial statement preparation and presentation. Also, projections of any evaluation of effectiveness to future periods are subject to the risk that controls may become inadequate because of changes in conditions, or that the degree of compliance with the policies or procedures may deteriorate.
Management evaluated the design and operating effectiveness of the Company’s internal control over financial reporting based on the criteria established in Internal Control — Integrated Framework (2013) issued by the Committee of Sponsoring Organizations
42
of the Treadway Commission. Based on the evaluation, management concluded that internal control over financial reporting was not effective as of September 30, 2016.
A material weakness (as defined in Rule 12b-2 under the Exchange Act) is a deficiency, or combination of deficiencies, in internal control over financial reporting such that there is reasonable possibility that a material misstatement of the Company’s annual or interim financial statements will not be prevented or detected on a timely basis.
In April 2016, the Company concluded its internal control over financial reporting as of September 30, 2015 was not effective due to a material weakness in the design and operating effectiveness of its transactional and review controls related to the recognition of royalty revenue. The ineffectiveness of these internal controls did not result in a restatement of previously issued interim or annual consolidated financial statements. This material weakness has not been remediated as of September 30, 2016, and could result in a misstatement of royalty revenue and related accounts and disclosures that could be material to the consolidated financial statements. Accordingly, management concluded that the Company’s internal control over financial reporting and our internal control over financial reporting was not effective as of September 30, 2016. Although the Company has already made progress in remediation of this issue, as indicated below, sufficient time needs to pass before management can conclude that newly implemented controls are operating effectively and that the material weaknesses has been adequately remediated.
In light of the material weakness in our internal control over financial reporting, based on the additional analyses and procedures performed, we believe the consolidated financial statements and other financial information included in our Annual Report on Form 10-K, are fairly presented in all material respects, in conformity with accounting principles generally accepted in the United States of America.
The Company’s independent registered public accounting firm, Deloitte & Touche LLP, who audited the consolidated financial statements included in this Annual Report on Form 10-K, has issued an attestation report on the effectiveness of management’s internal control over financial reporting as of September 30, 2016. This report states that internal control over financial reporting was not effective and appears on page 44 of this Annual Report on Form 10-K.
b. Attestation Report of the Independent Registered Public Accounting Firm.
43
REPORT OF INDEPENDENT REGISTERED PUBLIC ACCOUNTING FIRM
To the Board of Directors and Stockholders of
Surmodics, Inc.
Eden Prairie, Minnesota
We have audited Surmodics, Inc. and subsidiaries (the "Company's") internal control over financial reporting as of September 30, 2016 based on criteria established in Internal Control — Integrated Framework (2013) issued by the Committee of Sponsoring Organizations of the Treadway Commission. The Company's management is responsible for maintaining effective internal control over financial reporting and for its assessment of the effectiveness of internal control over financial reporting, included in the accompanying Management’s Report on Internal Control over Financial Reporting. Our responsibility is to express an opinion on the Company's internal control over financial reporting based on our audit.
We conducted our audit in accordance with the standards of the Public Company Accounting Oversight Board (United States). Those standards require that we plan and perform the audit to obtain reasonable assurance about whether effective internal control over financial reporting was maintained in all material respects. Our audit included obtaining an understanding of internal control over financial reporting, assessing the risk that a material weakness exists, testing and evaluating the design and operating effectiveness of internal control based on that risk, and performing such other procedures as we considered necessary in the circumstances. We believe that our audit provides a reasonable basis for our opinion.
A company's internal control over financial reporting is a process designed by, or under the supervision of, the company's principal executive and principal financial officers, or persons performing similar functions, and effected by the company's board of directors, management, and other personnel to provide reasonable assurance regarding the reliability of financial reporting and the preparation of financial statements for external purposes in accordance with generally accepted accounting principles. A company's internal control over financial reporting includes those policies and procedures that (1) pertain to the maintenance of records that, in reasonable detail, accurately and fairly reflect the transactions and dispositions of the assets of the company; (2) provide reasonable assurance that transactions are recorded as necessary to permit preparation of financial statements in accordance with generally accepted accounting principles, and that receipts and expenditures of the company are being made only in accordance with authorizations of management and directors of the company; and (3) provide reasonable assurance regarding prevention or timely detection of unauthorized acquisition, use, or disposition of the company's assets that could have a material effect on the financial statements.
Because of the inherent limitations of internal control over financial reporting, including the possibility of collusion or improper management override of controls, material misstatements due to error or fraud may not be prevented or detected on a timely basis. Also, projections of any evaluation of the effectiveness of the internal control over financial reporting to future periods are subject to the risk that the controls may become inadequate because of changes in conditions, or that the degree of compliance with the policies or procedures may deteriorate.
A material weakness is a deficiency, or a combination of deficiencies, in internal control over financial reporting, such that there is a reasonable possibility that a material misstatement of the company’s annual or interim financial statements will not be prevented or detected on a timely basis. The following material weakness has been identified and included in management's assessment:
A material weakness existed in the design and operating effectiveness of the transactional and review controls related to recognition of royalty revenue.
This material weakness was considered in determining the nature, timing, and extent of audit tests applied in our audit of the consolidated financial statements and financial statement schedule as of and for the year ended September 30, 2016, of the Company and this report does not affect our report on such consolidated financial statements and financial statement schedule.
In our opinion, because of the effect of the material weakness identified above on the achievement of the objectives of the control criteria, the Company has not maintained effective internal control over financial reporting as of September 30, 2016, based on the criteria established in Internal Control — Integrated Framework (2013) issued by the Committee of Sponsoring Organizations of the Treadway Commission.
We have also audited, in accordance with the standards of the Public Company Accounting Oversight Board (United States), the consolidated financial statements and financial statement schedule as of and for the year ended September 30, 2016, of the Company and our report dated December 2, 2016 expressed an unqualified opinion on those consolidated financial statements and financial statement schedule.
/s/ DELOITTE & TOUCHE LLP
Minneapolis, Minnesota
December 2, 2016
44
c. Changes in Internal Controls Over Financial Reporting.
Except for the changes described below there were no changes in our internal control over financial reporting identified in management’s evaluation pursuant to Rules 13a-15(d) or 15d-15(d) of the Exchange Act during the quarter ended September 30, 2016 that materially affected, or are reasonable likely to materially affect, our internal control over financial reporting.
Status of Material Weakness Remediation
With oversight from the Audit Committee, the Company’s management has designed and implemented certain changes in processes and controls for the purpose of remediating the material weakness described above and to enhance the Company’s internal control over financial reporting as follows:
|
|
• |
Enhanced the evaluation and analysis of royalties reported and/or paid by customers to determine the proper amount of revenue to be recognized based on terms of the relevant license agreement, including comparison of amounts reported by customers to management’s expectations. |
|
|
• |
Established quarterly meetings of a cross-functional team from our Medical Device business development, accounting and legal departments to review and evaluate license agreements and royalty revenue in order to identify circumstances that could impact recognition of royalty revenue with an emphasis on the review of the analysis generated from the preceding control, new or amended licenses, licenses impacted by expired or expiring patents, non-routine royalty revenue as well as the status of current customer inquiries related to reported and unpaid royalty revenue. |
|
|
• |
Augmented proactive communications with customers and internal departments related to patent expirations, license terms and license utilization. |
|
|
• |
Established a process for ongoing monitoring, review and conclusion of customer investigations or inquiries. These matters are identified from a review of customer license agreements, customer utilization of the Company’s technology, royalty revenue reporting and discussions with customers, among other things. |
We believe these remediation measures will strengthen our internal control over financial reporting and remediate the material weakness identified. These additional controls were designed and implemented in the third and fourth quarters of fiscal 2016, but have not operated for an appropriate amount of time for management to determine their operational effectiveness. Accordingly, management has determined that the material weakness has not been remediated as of September 30, 2016. During fiscal 2017, management will test and evaluate the effectiveness of these new processes and procedures to ascertain whether they are designed and operating effectively to provide reasonable assurance that they will prevent or detect a material error in the financial statements. Management may deem it necessary to enhance other existing controls and/or implement additional controls as the evaluation progresses.
None.
45
ITEM 10. DIRECTORS, EXECUTIVE OFFICERS AND CORPORATE GOVERNANCE.
The information required by Item 10 relating to directors, our audit committee, the nature of changes, if any, to procedures by which our shareholders may recommend nominees for directors, our code of ethics and compliance with Section 16(a) of the Exchange Act is incorporated herein by reference to the sections entitled “Election of Directors,” “Section 16(a) Beneficial Ownership Reporting Compliance,” “Corporate Governance — Code of Ethics and Business Conduct,” “Corporate Governance — Corporate Governance and Nominating Committee; Procedures and Policy” and “Audit Committee Report,” which appear in the Company’s Proxy Statement for its 2017 Annual Meeting of Shareholders. The information required by Item 10 relating to executive officers appears in Part I of this Form 10-K.
ITEM 11. EXECUTIVE COMPENSATION.
The information required by Item 11 is incorporated herein by reference to the sections entitled “Executive Compensation and Other Information,” “Compensation Discussion and Analysis,” “Director Compensation During Fiscal 2016” and “Organization and Compensation Committee Report,” which appear in the Company’s Proxy Statement for its 2017 Annual Meeting of Shareholders.
ITEM 12. SECURITY OWNERSHIP OF CERTAIN BENEFICIAL OWNERS AND MANAGEMENT AND RELATED STOCKHOLDER MATTERS.
The information required by Item 12 is incorporated herein by reference to the sections entitled “Principal Shareholders,” and “Management Shareholdings” which appear in the Company’s Proxy Statement for its 2017 Annual Meeting of Shareholders.
Equity Compensation Plan Information
The following table provides information related to the Company’s equity compensation plans in effect as of September 30, 2016:
|
Plan Category |
|
(a) Number of Securities to be Issued Upon Exercise of Outstanding Options, Warrants and Rights |
|
|
|
(b) Weighted-Average Exercise Price of Outstanding Options, Warrants and Rights |
|
|
|
(c) Number of Securities Remaining Available for Future Issuance Under Equity Compensation Plans (Excluding Securities Reflected in Column (a)) |
|
|
|||
|
Equity compensation plans approved by shareholders |
|
|
1,064,565 |
|
(1) |
|
$ |
16.57 |
|
(1) |
|
|
1,159,754 |
|
(2) |
|
Equity compensation plans not approved by shareholders |
|
|
— |
|
|
|
N/A |
|
|
|
|
— |
|
|
|
|
Total |
|
|
1,064,565 |
|
|
|
$ |
16.57 |
|
|
|
|
1,159,754 |
|
|
|
(1) |
Excludes shares that may be issued under the Company’s amended and restated 1999 Employee Stock Purchase Plan, but includes amounts reserved for previously-granted restricted stock and performance share awards under the 2009 Equity Incentive Plan. |
|
(2) |
Includes 1,159,754 shares available for future issuance under the 2009 Equity Incentive Plan. Excludes 222,005 shares available under the amended and restated 1999 Employee Stock Purchase Plan. |
ITEM 13. CERTAIN RELATIONSHIPS AND RELATED TRANSACTIONS, AND DIRECTOR INDEPENDENCE.
The information required by Item 13 is incorporated herein by reference to the sections entitled “Corporate Governance — Related Person Transaction Approval Policy” and “Corporate Governance — Majority of Independent Directors; Committees of Independent Directors,” which appear in the Company’s Proxy Statement for its 2017 Annual Meeting of Shareholders.
ITEM 14. PRINCIPAL ACCOUNTANT FEES AND SERVICES.
The information required by Item 14 is incorporated herein by reference to the section entitled “Audit Committee Report,” which appears in the Company’s Proxy Statement for its 2017 Annual Meeting of Shareholders.
46
ITEM 15. EXHIBITS AND FINANCIAL STATEMENT SCHEDULES.
(a) 1. Financial Statements
The following statements are included in this report on the pages indicated:
|
|
Page (s) |
|
F-1 |
|
|
F-2 |
|
|
F-3 |
|
|
F-4 |
|
|
F-5 |
|
|
F-6 to F-7 |
|
|
F-8 to F-33 |
2. Financial Statement Schedule. See Schedule II — “Valuation and Qualifying Accounts” in this section of this Form 10-K. All other schedules are omitted because they are inapplicable, not required, or the information is in the consolidated financial statements or related notes.
3. Listing of Exhibits. The exhibits which are filed with this report or which are incorporated herein by reference are set forth in the Exhibit Index following the signature page.
Surmodics, Inc.
Valuation and Qualifying Accounts
(In thousands)
|
Description(1) |
|
Balance at Beginning of Period(2) |
|
|
Additions Charged (Credited) to Expenses |
|
|
Deductions From Reserves |
|
|
|
Balance at End of Period |
|
||||
|
Year Ended September 30, 2014: |
|
|
|
|
|
|
|
|
|
|
|
|
|
|
|
|
|
|
Allowance for doubtful accounts |
|
$ |
26 |
|
|
$ |
24 |
|
|
$ |
8 |
|
(a) |
|
$ |
42 |
|
|
Restructuring accrual |
|
$ |
416 |
|
|
$ |
— |
|
|
$ |
416 |
|
(b) |
|
$ |
— |
|
|
Year Ended September 30, 2015: |
|
|
|
|
|
|
|
|
|
|
|
|
|
|
|
|
|
|
Allowance for doubtful accounts |
|
$ |
42 |
|
|
$ |
— |
|
|
$ |
32 |
|
(a) |
|
$ |
10 |
|
|
Restructuring accrual |
|
$ |
— |
|
|
$ |
— |
|
|
$ |
— |
|
(b) |
|
$ |
— |
|
|
Year Ended September 30, 2016: |
|
|
|
|
|
|
|
|
|
|
|
|
|
|
|
|
|
|
Allowance for doubtful accounts |
|
$ |
10 |
|
|
$ |
9 |
|
|
$ |
— |
|
(a) |
|
$ |
19 |
|
|
Restructuring accrual |
|
$ |
— |
|
|
$ |
— |
|
|
$ |
— |
|
(b) |
|
$ |
— |
|
|
(1) |
Includes accounts associated with continuing operations. |
(a)Uncollectible accounts written off and adjustments to the allowance.
|
(b) |
Adjustments to the accrual account reflect payments or non-cash charges associated with the accrual. |
47
Pursuant to the requirements of Section 13 or 15(d) of the Securities Exchange Act of 1934, the Registrant has duly caused this Report to be signed on its behalf by the undersigned, thereunto duly authorized.
|
SURMODICS, INC. |
||
|
|
|
|
|
By: |
|
/s/ Gary R. Maharaj |
|
|
|
Gary R. Maharaj |
|
|
|
President and Chief Executive Officer |
Dated: December 2, 2016
Pursuant to the requirements of the Securities Exchange Act of 1934, this Report has been signed below by the following persons on behalf of the Registrant, in the capacities, and on the dates indicated.
(Power of Attorney)
Each person whose signature appears below authorizes GARY R. MAHARAJ or ANDREW D. C. LAFRENCE, and constitutes and appoints said persons as his or her true and lawful attorneys-in-fact and agents, with full power of substitution and resubstitution, for him or her and in his or her name, place and stead, in any and all capacities, to sign any or all amendments to this Annual Report on Form 10-K and to file the same, with all exhibits thereto, and other documents in connection therewith, with the Securities and Exchange Commission, authorizing said persons and granting unto said attorneys-in-fact and agents, full power and authority to do and perform each and every act and thing requisite and necessary to be done in and about the premises, as fully to all intents and purposes as he or she might or could do in person, hereby ratifying and confirming all said attorneys-in-fact and agents, or his substitute or substitutes, may lawfully do or cause to be done by virtue thereof.
|
Signature |
|
Title |
|
Date |
|
|
|
|
|
|
|
/s/ Gary R. Maharaj Gary R. Maharaj |
|
President and Chief Executive Officer (principal executive officer) and Director |
|
December 2, 2016 |
|
|
|
|
|
|
|
/s/ Andrew D.C. LaFrence Andrew D.C. LaFrence |
|
Vice President of Finance and Information Systems and Chief Financial Officer (principal financial officer and principal accounting officer) |
|
December 2, 2016 |
|
|
|
|
|
|
|
/s/ Susan E. Knight Susan E. Knight |
|
Chairman of the Board of Directors |
|
December 2, 2016 |
|
|
|
|
|
|
|
/s/ José H. Bedoya José H. Bedoya |
|
Director |
|
December 2, 2016 |
|
|
|
|
|
|
|
/s/ David R. Dantzker, M.D. David R. Dantzker, M.D. |
|
Director |
|
December 2, 2016 |
|
|
|
|
|
|
|
/s/ Ronald B. Kalich Ronald B. Kalich |
|
Director |
|
December 2, 2016 |
|
|
|
|
|
|
|
/s/ Shawn T McCormick Shawn T McCormick |
|
Director |
|
December 2, 2016 |
|
|
|
|
|
|
48
SECURITIES AND EXCHANGE COMMISSION
WASHINGTON, D.C. 20549
EXHIBIT INDEX TO FORM 10-K
For the Fiscal Year Ended September 30, 2016
SURMODICS, INC.
|
Exhibit |
|
|
|
|
|
|
|
2.1 |
|
Agreement of Merger, dated January 18, 2005, with InnoRx, Inc. — incorporated by reference to Exhibit 2.1 to the Company’s Current Report on Form 8-K dated January 18, 2005, SEC File No. 0-23837. |
|
|
|
|
|
2.2 |
|
Stock Purchase Agreement, dated July 31, 2007, between Surmodics, Inc. and Southern Research Institute — incorporated by reference to Exhibit 2.1 to the Company’s Current Report on Form 8-K dated July 31, 2007, SEC File No. 0-23837. |
|
|
|
|
|
2.3 |
|
Asset Purchase Agreement by and among Surmodics, Inc., SurModics Pharmaceuticals, Inc., and Evonik Degussa Corporation dated as of November 1, 2011 — incorporated by reference to Exhibit 2.1 to the Company’s 8-K dated November 7, 2011, SEC File No. 0-23837.
|
|
2.4 |
|
Share Purchase Agreement by and among Surmodics, Inc. and the shareholders of Creagh Medical Ltd. dated as of November 20, 2015 — incorporated by reference to Exhibit 2.1 to the Company’s 8-K dated November 27, 2015, SEC File No. 0-23837. |
|
2.5 |
|
Put and Call Option Agreement by and among Surmodics, Inc. and the shareholders of Creagh Medical Ltd. dated as of November 20, 2015 — incorporated by reference to Exhibit 2.1 to the Company’s 8-K dated November 27, 2015, SEC File No. 0-23837. |
|
3.1 |
|
Restated Articles of Incorporation, as amended — incorporated by reference to Exhibit 4.1 of the Company’s Registration Statement on Form S-3 filed on July 31, 2014, SEC File No. 333-197757. |
|
|
|
|
|
3.2 |
|
Restated Bylaws of Surmodics, Inc., as amended November 30, 2009 — incorporated by reference to Exhibit 3.2 to the Company’s Quarterly Report on Form 10-Q for the quarter ended December 31, 2009, SEC File No. 0-23837. |
|
|
|
|
|
4.1 |
|
Form of Senior Indenture — incorporated by reference to Exhibit 4.3 to the Company’s Registration Statement on Form S-3 filed on July 31, 2014, SEC File No. 333-197757. |
|
|
|
|
|
4.2 |
|
Form of Subordinated Indenture — incorporated by reference to Exhibit 4.4 to the Company’s Registration Statement on Form S-3 filed on July 31, 2014, SEC File No. 333-197757. |
|
|
|
|
|
10.1* |
|
Form of officer acceptance regarding employment/compensation — incorporated by reference to Exhibit 10.9 to the Company’s Annual Report on Form 10-K for the fiscal year ended September 30, 2005, SEC File No. 0-23837. |
|
|
|
|
|
10.2* |
|
2003 Equity Incentive Plan (as amended and restated December 13, 2005) (adopted December 13, 2005 by the board of directors and approved by the shareholders on January 30, 2006) — incorporated by reference to Exhibit 10.1 to the Company’s Form 8-K filed February 3, 2006, SEC File No. 0-23837. |
|
|
|
|
|
10.3* |
|
Form of Surmodics, Inc. 2003 Equity Incentive Plan Non-qualified Stock Option Agreement — incorporated by reference to Exhibit 99.1 to the Company’s 8-K filed March 20, 2006, SEC File No. 0-23837. |
|
|
|
|
|
10.4* |
|
Form of Surmodics, Inc. 2003 Equity Incentive Plan Incentive Stock Option Agreement — incorporated by reference to Exhibit 99.2 to the Company’s 8-K filed March 20, 2006, SEC File No. 0-23837. |
|
|
|
|
|
10.5* |
|
Form of Surmodics, Inc. 2003 Equity Incentive Plan Restricted Stock Agreement — incorporated by reference to Exhibit 99.3 to the Company’s 8-K filed March 20, 2006, SEC File No. 0-23837. |
49
|
|
|
|
|
10.6* |
|
Form of Surmodics, Inc. 2003 Equity Incentive Plan Performance Share Award Agreement — incorporated by reference to Exhibit 99.4 to the Company’s 8-K filed March 20, 2006, SEC File No. 0-23837. |
|
|
|
|
|
10.7* |
|
Form of Surmodics, Inc. 2003 Equity Incentive Plan Performance Unit Award (cash settled) Agreement — incorporated by reference to Exhibit 99.5 to the Company’s 8-K filed March 20, 2006, SEC File No. 0-23837. |
|
|
|
|
|
10.8* |
|
Form of Surmodics, Inc. 2003 Equity Incentive Plan Restricted Stock Unit Agreement — incorporated by reference to Exhibit 99.6 to the Company’s 8-K filed March 20, 2006, SEC File No. 0-23837. |
|
|
|
|
|
10.9* |
|
Form of Surmodics, Inc. 2003 Equity Incentive Plan Stock Appreciation Rights (cash settled) Agreement — incorporated by reference to Exhibit 99.7 to the Company’s 8-K filed March 20, 2006, SEC File No. 0-23837. |
|
|
|
|
|
10.10* |
|
Form of Surmodics, Inc. 2003 Equity Incentive Plan Stock Appreciation Rights (stock settled) Agreement — incorporated by reference to Exhibit 99.8 to the Company’s 8-K filed March 20, 2006, SEC File No. 0-23837. |
|
|
|
|
|
10.11* |
|
Form of Incentive Stock Option Agreement for the Surmodics, Inc. 2009 Equity Incentive Plan — incorporated by reference to Exhibit 10.2 to the Company’s 8-K filed February 12, 2010, SEC File No. 0- 23837. |
|
|
|
|
|
10.12* |
|
Form of Non-Statutory Stock Option Agreement for the Surmodics, Inc. 2009 Equity Incentive Plan — incorporated by reference to Exhibit 10.3 to the Company’s 8-K filed February 12, 2010, SEC File No. 0-23837. |
|
|
|
|
|
10.13* |
|
Form of Performance Share Agreement for the Surmodics, Inc. 2009 Equity Incentive Plan — incorporated by reference to Exhibit 10.4 to the Company’s 8-K filed February 12, 2010, SEC File No. 0-23837. |
|
|
|
|
|
10.14* |
|
Form of Restricted Stock Agreement for the Surmodics, Inc. 2009 Equity Incentive Plan — incorporated by reference to Exhibit 10.5 to the Company’s 8-K filed February 12, 2010, SEC File No. 0-23837. |
|
10.15* |
|
Form of Restricted Stock Agreement for the Surmodics, Inc. 2009 Equity Incentive Plan — incorporated by reference to Exhibit 10.5 to the Company’s 8-K filed February 4, 2015, SEC File No. 0-23837.
|
|
10.16* |
|
Surmodics, Inc. 2009 Equity Incentive Plan — incorporated by reference to Exhibit 10.1 to the Company’s Form 10-Q filed May 7, 2010, SEC File No. 0-23837. |
|
|
|
|
|
10.17* |
|
Surmodics, Inc. 1999 Employee Stock Purchase Plan (as amended and restated November 30, 2009) — incorporated by reference to Exhibit 10.2 to the Company’s Form 10-Q filed May 7, 2010, SEC File No. 0-23837. |
|
|
|
|
|
10.18* ** |
|
The Company’s Board Compensation Policy, Amended and Restated as of April 26, 2016. |
|
|
|
|
|
10.19* |
|
Offer Letter dated as of December 14, 2010 (in favor of Gary R. Maharaj executed by Surmodics, Inc.) – incorporated by reference to Exhibit 10.1 to the Company’s Form 10-Q filed on February 4, 2011, SEC File No. 0-23837. |
|
|
|
|
|
10.20* |
|
Severance Agreement by and between Gary R. Maharaj and Surmodics, Inc. dated as of December 14, 2010 – incorporated by reference to Exhibit 10.2 to the Company’s Form 10-Q filed on February 4, 2011, SEC File No. 0-23837. |
|
|
|
|
|
10.22* |
|
Change of Control Agreement with Charles W. Olson dated February 9, 2012 — incorporated by reference to Exhibit 10.2 to the Company’s Form 8‑K filed on February 10, 2012, SEC File No. 0‑23837. |
|
10.23* |
|
Amendment to Change of Control Agreement with Charles W. Olson dated February 9, 2012 — incorporated by reference to Exhibit 10.1 to the Company’s Form 8‑K filed on February 13, 2015, SEC File No. 0‑23837.
|
|
10.24* |
|
Change of Control Agreement with Bryan K. Phillips dated February 9, 2012 — incorporated by reference to Exhibit 10.3 to the Company’s Form 8‑K filed on February 10, 2012, SEC File No. 0‑23837. |
50
|
10.25* |
|
Amendment to Change of Control Agreement with Bryan K. Phillips dated February 9, 2015 — incorporated by reference to Exhibit 10.3 to the Company’s Form 8‑K filed on February 13, 2015, SEC File No. 0‑23837.
|
|
|
Change of Control Agreement with Joseph J. Stich dated February 9, 2012 — incorporated by reference to Exhibit 10.4 to the Company’s Form 8‑K filed on February 10, 2012, SEC File No. 0‑23837. |
|
|
10.27* |
|
Amendment to Change of Control Agreement with Joseph J. Stich dated February 9, 2015 — incorporated by reference to Exhibit 10.4 to the Company’s Form 8‑K filed on February 13, 2015, SEC File No. 0‑23837.
|
|
10.28* |
|
Offer Letter dated as of December 17, 2012 (in favor of Andrew D.C. LaFrence executed by Surmodics, Inc.) — incorporated by reference to Exhibit 10.1 to the Company’s Current Report on Form 8‑K filed on December 21, 2012, SEC File No. 0‑23837. |
|
|
|
|
|
10.29* |
|
Change of Control Agreement by and between Andrew D.C. LaFrence and Surmodics, Inc. dated as of December 17, 2012 — incorporated by reference to Exhibit 10.2 to the Company’s Current Report on Form 8‑K filed on December 21, 2012, SEC File No. 0‑23837. |
|
10.30* |
|
Amendment to Change of Control Agreement by and between Andrew D.C. LaFrence and Surmodics, Inc. dated as of February 9, 2015 — incorporated by reference to Exhibit 10.2 to the Company’s Current Report on Form 8‑K filed on February 13, 2015, SEC File No. 0‑23837.
|
|
10.31*
10.32* |
|
Form of Restricted Stock Unit Award Agreement (Non-Employee Director) for the Surmodics, Inc. 2009 Equity Incentive Plan — incorporated by reference to Exhibit 10.2 to the Company’s Quarterly Report on Form 10-Q filed on May 8, 2014, SEC File No. 0‑23837.
Form of Restricted Stock Unit Award Agreement (Non-Employee Director) for the Surmodics, Inc. 2009 Equity Incentive Plan — incorporated by reference to Exhibit 10.3 to the Company’s Quarterly Report on Form 10-Q filed on February 4, 2015, SEC File No. 0‑23837. |
|
|
|
|
|
10.33*
10.34* |
|
Form of Deferred Stock Unit Master Agreement (Quarterly Awards) for the Surmodics, Inc. 2009 Equity Incentive Plan — incorporated by reference to Exhibit 10.4 to the Company’s Quarterly Report on Form 10-Q filed on February 8, 2013, SEC File No. 0‑23837.
Form of Deferred Stock Unit Master Agreement (Quarterly Awards) for the Surmodics, Inc. 2009 Equity Incentive Plan — incorporated by reference to Exhibit 10.4 to the Company’s Quarterly Report on Form 10-Q filed on February 4, 2015, SEC File No. 0‑23837. |
|
|
|
|
|
10.35 |
|
Credit Agreement dated November 4, 2013, by and between Surmodics, Inc., and Wells Fargo Bank, National Association — incorporated by reference to Exhibit 10.1 to the Company’s Current Report on Form 8-K filed on November 5, 2013, SEC File No. 0‑23837. |
|
|
|
|
|
10.36 |
|
First Amendment to Credit Agreement dated November 5, 2014, by and between Surmodics, Inc. and Wells Fargo Bank, National Association — incorporated by reference to Exhibit 10.1 to the Company’s Current Report on Form 8-K filed on November 6, 2014, SEC File No. 0‑23837.
|
|
10.37 |
|
Second Amendment to Credit Agreement dated November 20, 2015, by and between Surmodics, Inc. and Wells Fargo Bank, National Association — incorporated by reference to Exhibit 10.1 to the Company’s Current Report on Form 8-K filed on November [25], 2015, SEC File No. 0‑23837. |
|
|
|
|
|
10.38* |
|
Omnibus Amendment to Certain Equity Agreements with Non-Employee Directors under the Surmodics, Inc. 2009 Equity Incentive Plan — incorporated by reference to Exhibit 10.1 to the Company’s Quarterly Report on Form 10-Q filed on May 8, 2014, SEC File No. 0‑23837. |
|
|
|
|
|
10.39* |
|
Form of Non-Statutory Stock Option Agreement (Non-Employee Director) for the Surmodics, Inc. 2009 Equity Incentive Plan — incorporated by reference to Exhibit 10.3 to the Company’s Quarterly Report on Form 10-Q filed on May 8, 2014, SEC File No. 0‑23837. |
|
|
|
|
|
12 |
|
Computation of Ratio of Earnings to Fixed Charges.** |
51
|
|
|
|
|
21 |
|
Subsidiaries of the Registrant.** |
|
|
|
|
|
23 |
|
Consent of Deloitte & Touche LLP.** |
|
|
|
|
|
24 |
|
Power of Attorney (included on signature page of this Form 10-K).** |
|
|
|
|
|
31.1 |
|
Certification of Chief Executive Officer Pursuant to Section 302 of the Sarbanes-Oxley Act of 2002.** |
|
|
|
|
|
31.2 |
|
Certification of Chief Financial Officer Pursuant to Section 302 of the Sarbanes-Oxley Act of 2002.** |
|
|
|
|
|
32.1 |
|
Certification of Chief Executive Officer Pursuant to Section 906 of the Sarbanes-Oxley Act of 2002.** |
|
|
|
|
|
32.2 |
|
Certification of Chief Financial Officer Pursuant to Section 906 of the Sarbanes-Oxley Act of 2002.** |
|
|
|
|
|
101.INS** |
|
XBRL Instance Document |
|
|
|
|
|
101.SCH** |
|
XBRL Taxonomy Extension Schema Document |
|
|
|
|
|
101.CAL** |
|
XBRL Taxonomy Extension Calculation Linkbase Document |
|
|
|
|
|
101.DEF** |
|
XBRL Taxonomy Extension Definition Linkbase Document |
|
|
|
|
|
101.LAB** |
|
XBRL Taxonomy Extension Label Linkbase Document |
|
|
|
|
|
101.PRE** |
|
XBRL Taxonomy Extension Presentation Linkbase Document |
*Management contract or compensatory plan or arrangement
** Filed herewith
|
|
|
|
|
|
|
|
|
|
|
|
52
REPORT OF INDEPENDENT REGISTERED PUBLIC ACCOUNTING FIRM
To the Board of Directors and Stockholders of
Surmodics, Inc.
Eden Prairie, Minnesota
We have audited the accompanying consolidated balance sheets of Surmodics, Inc. and subsidiaries (the "Company") as of September 30, 2016 and 2015, and the related consolidated statements of income, comprehensive income, stockholders' equity, and cash flows for each of the three years in the period ended September 30, 2016. Our audits also included the financial statement schedule listed in the Index at Item 15. These consolidated financial statements and financial statement schedule are the responsibility of the Company's management. Our responsibility is to express an opinion on the consolidated financial statements and financial statement schedule based on our audits.
We conducted our audits in accordance with the standards of the Public Company Accounting Oversight Board (United States). Those standards require that we plan and perform the audit to obtain reasonable assurance about whether the financial statements are free of material misstatement. An audit includes examining, on a test basis, evidence supporting the amounts and disclosures in the financial statements. An audit also includes assessing the accounting principles used and significant estimates made by management, as well as evaluating the overall financial statement presentation. We believe that our audits provide a reasonable basis for our opinion.
In our opinion, such consolidated financial statements present fairly, in all material respects, the financial position of Surmodics, Inc. and subsidiaries as of September 30, 2016 and 2015, and the results of their operations and their cash flows for each of the three years in the period ended September 30, 2016, in conformity with accounting principles generally accepted in the United States of America. Also, in our opinion, such financial statement schedule, when considered in relation to the basic consolidated financial statements taken as a whole, presents fairly, in all material respects, the information set forth therein.
We have also audited, in accordance with the standards of the Public Company Accounting Oversight Board (United States), the Company's internal control over financial reporting as of September 30, 2016, based on the criteria established in Internal Control — Integrated Framework (2013) issued by the Committee of Sponsoring Organizations of the Treadway Commission and our report dated December 2, 2016 expressed an adverse opinion on the Company's internal control over financial reporting because of a material weakness.
/s/ DELOITTE & TOUCHE LLP
Minneapolis, Minnesota
December 2, 2016
F-1
Surmodics, Inc. and Subsidiaries
As of September 30
|
|
|
2016 |
|
|
2015 |
|
||
|
|
|
(In thousands, except share and per share data) |
|
|||||
|
ASSETS |
|
|
|
|
|
|
|
|
|
Current Assets: |
|
|
|
|
|
|
|
|
|
Cash and cash equivalents |
|
$ |
24,987 |
|
|
$ |
55,588 |
|
|
Available-for-sale securities |
|
|
21,954 |
|
|
|
— |
|
|
Accounts receivable, net of allowance for doubtful accounts of $19 and $10 as of September 30, 2016 and 2015, respectively |
|
|
6,869 |
|
|
|
7,478 |
|
|
Inventories |
|
|
3,579 |
|
|
|
2,979 |
|
|
Deferred tax assets |
|
|
— |
|
|
|
546 |
|
|
Income tax receivable |
|
|
697 |
|
|
|
— |
|
|
Prepaids and other |
|
|
472 |
|
|
|
1,198 |
|
|
Total Current Assets |
|
|
58,558 |
|
|
|
67,789 |
|
|
Property and equipment, net |
|
|
19,601 |
|
|
|
12,968 |
|
|
Deferred tax assets |
|
|
5,027 |
|
|
|
6,704 |
|
|
Intangible assets, net |
|
|
22,525 |
|
|
|
2,760 |
|
|
Goodwill |
|
|
26,555 |
|
|
|
8,010 |
|
|
Other assets |
|
|
628 |
|
|
|
479 |
|
|
Total Assets |
|
$ |
132,894 |
|
|
$ |
98,710 |
|
|
LIABILITIES AND STOCKHOLDERS’ EQUITY |
|
|
|
|
|
|
|
|
|
Current Liabilities: |
|
|
|
|
|
|
|
|
|
Accounts payable |
|
$ |
1,622 |
|
|
$ |
781 |
|
|
Accrued liabilities: |
|
|
|
|
|
|
|
|
|
Compensation |
|
|
5,418 |
|
|
|
2,772 |
|
|
Due to customers |
|
|
881 |
|
|
|
79 |
|
|
Accrued other |
|
|
1,109 |
|
|
|
715 |
|
|
Business combination and contingent consideration |
|
|
925 |
|
|
|
305 |
|
|
Deferred revenue |
|
|
180 |
|
|
|
48 |
|
|
Total Current Liabilities |
|
|
10,135 |
|
|
|
4,700 |
|
|
Contingent consideration, less current portion |
|
|
13,592 |
|
|
|
— |
|
|
Deferred revenue, less current portion |
|
|
188 |
|
|
|
217 |
|
|
Other long-term liabilities |
|
|
2,146 |
|
|
|
1,920 |
|
|
Total Liabilities |
|
|
26,061 |
|
|
|
6,837 |
|
|
Commitments and Contingencies (Note 11) |
|
|
|
|
|
|
|
|
|
Stockholders’ Equity: |
|
|
|
|
|
|
|
|
|
Series A preferred stock — $.05 par value, 450,000 shares authorized; no shares issued and outstanding |
|
|
— |
|
|
|
— |
|
|
Common stock — $.05 par value, 45,000,000 shares authorized; 13,208,443 and 12,945,157 shares issued and outstanding, in 2016 and 2015 respectively |
|
|
660 |
|
|
|
647 |
|
|
Additional paid-in capital |
|
|
6,754 |
|
|
|
3,060 |
|
|
Accumulated other comprehensive income |
|
|
1,273 |
|
|
|
5 |
|
|
Retained earnings |
|
|
98,146 |
|
|
|
88,161 |
|
|
Total Stockholders’ Equity |
|
|
106,833 |
|
|
|
91,873 |
|
|
Total Liabilities and Stockholders’ Equity |
|
$ |
132,894 |
|
|
$ |
98,710 |
|
The accompanying notes are an integral part of these consolidated financial statements.
F-2
Surmodics, Inc. and Subsidiaries
Consolidated Statements of Income
For the Years Ended September 30
|
|
|
2016 |
|
|
2015 |
|
|
2014 |
|
|||
|
|
|
(In thousands, except per share data) |
|
|||||||||
|
Revenue: |
|
|
|
|
|
|
|
|
|
|
|
|
|
Royalties and license fees |
|
$ |
33,203 |
|
|
$ |
31,763 |
|
|
$ |
30,277 |
|
|
Product sales |
|
|
30,999 |
|
|
|
24,925 |
|
|
|
22,798 |
|
|
Research, development and other |
|
|
7,164 |
|
|
|
5,210 |
|
|
|
4,364 |
|
|
Total revenue |
|
|
71,366 |
|
|
|
61,898 |
|
|
|
57,439 |
|
|
Operating costs and expenses: |
|
|
|
|
|
|
|
|
|
|
|
|
|
Product costs |
|
|
10,908 |
|
|
|
8,619 |
|
|
|
8,016 |
|
|
Research and development |
|
|
18,498 |
|
|
|
16,165 |
|
|
|
15,550 |
|
|
Selling, general and administrative |
|
|
18,000 |
|
|
|
14,906 |
|
|
|
14,691 |
|
|
Acquisition transaction, integration and other costs |
|
|
3,187 |
|
|
|
— |
|
|
|
— |
|
|
Acquired intangible asset amortization |
|
|
2,422 |
|
|
|
619 |
|
|
|
606 |
|
|
Contingent consideration accretion expense |
|
|
1,492 |
|
|
|
— |
|
|
|
— |
|
|
Claim settlement |
|
|
— |
|
|
|
2,500 |
|
|
|
— |
|
|
Total operating costs and expenses |
|
|
54,507 |
|
|
|
42,809 |
|
|
|
38,863 |
|
|
Operating income from continuing operations |
|
|
16,859 |
|
|
|
19,089 |
|
|
|
18,576 |
|
|
Other income (loss): |
|
|
|
|
|
|
|
|
|
|
|
|
|
Investment income, net |
|
|
63 |
|
|
|
156 |
|
|
|
238 |
|
|
Foreign exchange loss |
|
|
(481 |
) |
|
|
— |
|
|
|
— |
|
|
Impairment losses on strategic investments |
|
|
— |
|
|
|
(1,500 |
) |
|
|
(1,184 |
) |
|
Gains on strategic investments and other |
|
|
507 |
|
|
|
496 |
|
|
|
842 |
|
|
Other income (loss) |
|
|
89 |
|
|
|
(848 |
) |
|
|
(104 |
) |
|
Income from continuing operations before income taxes |
|
|
16,948 |
|
|
|
18,241 |
|
|
|
18,472 |
|
|
Income tax provision |
|
|
(6,963 |
) |
|
|
(6,294 |
) |
|
|
(6,265 |
) |
|
Income from continuing operations |
|
|
9,985 |
|
|
|
11,947 |
|
|
|
12,207 |
|
|
Discontinued operations: |
|
|
|
|
|
|
|
|
|
|
|
|
|
Loss from discontinued operations, net of income taxes |
|
|
— |
|
|
|
— |
|
|
|
(176 |
) |
|
Loss from discontinued operations |
|
|
— |
|
|
|
— |
|
|
|
(176 |
) |
|
Net income |
|
$ |
9,985 |
|
|
$ |
11,947 |
|
|
$ |
12,031 |
|
|
Basic income (loss) per share: |
|
|
|
|
|
|
|
|
|
|
|
|
|
Continuing operations |
|
$ |
0.77 |
|
|
$ |
0.92 |
|
|
$ |
0.90 |
|
|
Discontinued operations |
|
|
— |
|
|
|
— |
|
|
|
(0.01 |
) |
|
Net income |
|
$ |
0.77 |
|
|
$ |
0.92 |
|
|
$ |
0.88 |
|
|
Diluted income (loss) per share: |
|
|
|
|
|
|
|
|
|
|
|
|
|
Continuing operations |
|
$ |
0.76 |
|
|
$ |
0.90 |
|
|
$ |
0.88 |
|
|
Discontinued operations |
|
|
— |
|
|
|
— |
|
|
|
(0.01 |
) |
|
Net income |
|
$ |
0.76 |
|
|
$ |
0.90 |
|
|
$ |
0.87 |
|
|
Weighted average number of shares outstanding: |
|
|
|
|
|
|
|
|
|
|
|
|
|
Basic |
|
|
12,998 |
|
|
|
13,029 |
|
|
|
13,632 |
|
|
Diluted |
|
|
13,219 |
|
|
|
13,289 |
|
|
|
13,876 |
|
The accompanying notes are an integral part of these consolidated financial statements.
F-3
Surmodics, Inc. and Subsidiaries
Consolidated Statements of Comprehensive Income
For the Years Ended September 30
|
|
|
2016 |
|
|
2015 |
|
|
2014 |
|
|||
|
|
|
(In thousands) |
|
|||||||||
|
Net income |
|
$ |
9,985 |
|
|
$ |
11,947 |
|
|
$ |
12,031 |
|
|
Other comprehensive income (loss): |
|
|
|
|
|
|
|
|
|
|
|
|
|
Unrealized holding (losses) gains on available-for-sale securities, net of tax |
|
|
(68 |
) |
|
|
(1,208 |
) |
|
|
1,559 |
|
|
Reclassification adjustment for realized gains included in net income, net of tax |
|
|
— |
|
|
|
(315 |
) |
|
|
(89 |
) |
|
Foreign currency translation adjustments |
|
|
1,336 |
|
|
|
— |
|
|
|
— |
|
|
Other comprehensive income (loss) |
|
|
1,268 |
|
|
|
(1,523 |
) |
|
|
1,470 |
|
|
Comprehensive income |
|
$ |
11,253 |
|
|
$ |
10,424 |
|
|
$ |
13,501 |
|
The accompanying notes are an integral part of these consolidated financial statements.
F-4
Surmodics, Inc. and Subsidiaries
Consolidated Statements of Stockholders’ Equity
For the Years Ended September 30
|
|
|
|
|
|
|
|
|
|
|
|
|
|
|
Accumulated |
|
|
|
|
|
|
|
|
|
|
|
|
|
|
|
|
|
|
|
|
|
Additional |
|
|
Other |
|
|
|
|
|
|
Total |
|
|||
|
|
|
Common Stock |
|
|
Paid-In |
|
|
Comprehensive |
|
|
Retained |
|
|
Stockholders’ |
|
|||||||||
|
|
|
Shares |
|
|
Amount |
|
|
Capital |
|
|
Income |
|
|
Earnings |
|
|
Equity |
|
||||||
|
|
|
(In thousands) |
|
|||||||||||||||||||||
|
Balance at September 30, 2013 |
|
|
13,891 |
|
|
$ |
695 |
|
|
$ |
2,028 |
|
|
$ |
58 |
|
|
$ |
91,036 |
|
|
$ |
93,817 |
|
|
|
|
|
|
|
|
|
|
|
|
|
|
|
|
|
|
|
|
|
|
|
|
|
|
|
|
Net income |
|
|
— |
|
|
|
— |
|
|
|
— |
|
|
|
— |
|
|
|
12,031 |
|
|
|
12,031 |
|
|
Other comprehensive income, net of tax |
|
|
— |
|
|
|
— |
|
|
|
— |
|
|
|
1,470 |
|
|
|
— |
|
|
|
1,470 |
|
|
Issuance of common stock |
|
|
163 |
|
|
|
8 |
|
|
|
261 |
|
|
|
— |
|
|
|
— |
|
|
|
269 |
|
|
Common stock repurchased |
|
|
(485 |
) |
|
|
(25 |
) |
|
|
(2,330 |
) |
|
|
— |
|
|
|
(9,186 |
) |
|
|
(11,541 |
) |
|
Common stock options exercised, net |
|
|
38 |
|
|
|
2 |
|
|
|
241 |
|
|
|
— |
|
|
|
— |
|
|
|
243 |
|
|
Purchase of common stock to pay employee taxes |
|
|
— |
|
|
|
— |
|
|
|
(1,111 |
) |
|
|
— |
|
|
|
— |
|
|
|
(1,111 |
) |
|
Excess tax benefit from stock-based compensation plans |
|
|
— |
|
|
|
— |
|
|
|
236 |
|
|
|
— |
|
|
|
— |
|
|
|
236 |
|
|
Stock-based compensation |
|
|
— |
|
|
|
— |
|
|
|
3,337 |
|
|
|
— |
|
|
|
— |
|
|
|
3,337 |
|
|
Balance at September 30, 2014 |
|
|
13,607 |
|
|
|
680 |
|
|
|
2,662 |
|
|
|
1,528 |
|
|
|
93,881 |
|
|
|
98,751 |
|
|
|
|
|
|
|
|
|
|
|
|
|
|
|
|
|
|
|
|
|
|
|
|
|
|
|
|
Net income |
|
|
— |
|
|
|
— |
|
|
|
— |
|
|
|
— |
|
|
|
11,947 |
|
|
|
11,947 |
|
|
Other comprehensive loss, net of tax |
|
|
— |
|
|
|
— |
|
|
|
— |
|
|
|
(1,523 |
) |
|
|
— |
|
|
|
(1,523 |
) |
|
Issuance of common stock |
|
|
139 |
|
|
|
7 |
|
|
|
272 |
|
|
|
— |
|
|
|
— |
|
|
|
279 |
|
|
Common stock repurchased |
|
|
(848 |
) |
|
|
(42 |
) |
|
|
(2,485 |
) |
|
|
— |
|
|
|
(17,473 |
) |
|
|
(20,000 |
) |
|
Common stock options exercised, net |
|
|
47 |
|
|
|
2 |
|
|
|
429 |
|
|
|
— |
|
|
|
— |
|
|
|
431 |
|
|
Purchase of common stock to pay employee taxes |
|
|
— |
|
|
|
— |
|
|
|
(631 |
) |
|
|
— |
|
|
|
(194 |
) |
|
|
(825 |
) |
|
Excess tax benefit from stock-based compensation plans |
|
|
— |
|
|
|
— |
|
|
|
432 |
|
|
|
— |
|
|
|
— |
|
|
|
432 |
|
|
Stock-based compensation |
|
|
— |
|
|
|
— |
|
|
|
2,381 |
|
|
|
— |
|
|
|
— |
|
|
|
2,381 |
|
|
Balance at September 30, 2015 |
|
|
12,945 |
|
|
|
647 |
|
|
|
3,060 |
|
|
|
5 |
|
|
|
88,161 |
|
|
|
91,873 |
|
|
|
|
|
|
|
|
|
|
|
|
|
|
|
|
|
|
|
|
|
|
|
|
|
|
|
|
Net income |
|
|
— |
|
|
|
— |
|
|
|
— |
|
|
|
— |
|
|
|
9,985 |
|
|
|
9,985 |
|
|
Other comprehensive income, net of tax |
|
|
— |
|
|
|
— |
|
|
|
— |
|
|
|
1,268 |
|
|
|
— |
|
|
|
1,268 |
|
|
Issuance of common stock |
|
|
74 |
|
|
|
4 |
|
|
|
266 |
|
|
|
— |
|
|
|
— |
|
|
|
270 |
|
|
Common stock options exercised, net |
|
|
196 |
|
|
|
10 |
|
|
|
1,536 |
|
|
|
— |
|
|
|
— |
|
|
|
1,546 |
|
|
Purchase of common stock to pay employee taxes |
|
|
(7 |
) |
|
|
(1 |
) |
|
|
(1,952 |
) |
|
|
— |
|
|
|
— |
|
|
|
(1,953 |
) |
|
Stock-based compensation |
|
|
— |
|
|
|
— |
|
|
|
3,844 |
|
|
|
— |
|
|
|
— |
|
|
|
3,844 |
|
|
Balance at September 30, 2016 |
|
|
13,208 |
|
|
$ |
660 |
|
|
$ |
6,754 |
|
|
$ |
1,273 |
|
|
$ |
98,146 |
|
|
$ |
106,833 |
|
The accompanying notes are an integral part of these consolidated financial statements.
F-5
Surmodics, Inc. and Subsidiaries
Consolidated Statements of Cash Flows
For the Years Ended September 30
|
|
|
2016 |
|
|
2015 |
|
|
2014 |
|
|||
|
|
|
(In thousands) |
|
|||||||||
|
Operating Activities: |
|
|
|
|
|
|
|
|
|
|
|
|
|
Net income |
|
$ |
9,985 |
|
|
$ |
11,947 |
|
|
$ |
12,031 |
|
|
Adjustments to reconcile net income to net cash provided by operating activities from continuing operations: |
|
|
|
|
|
|
|
|
|
|
|
|
|
Depreciation and amortization |
|
|
4,873 |
|
|
|
2,805 |
|
|
|
2,715 |
|
|
Gains on sales of available-for-sale securities, net and strategic investments |
|
|
(514 |
) |
|
|
(492 |
) |
|
|
(842 |
) |
|
Impairment losses on strategic investments |
|
|
— |
|
|
|
1,500 |
|
|
|
1,184 |
|
|
Stock-based compensation |
|
|
3,844 |
|
|
|
2,381 |
|
|
|
3,337 |
|
|
Contingent consideration accretion and unrealized foreign exchange loss |
|
|
1,936 |
|
|
|
— |
|
|
|
— |
|
|
Deferred taxes |
|
|
261 |
|
|
|
93 |
|
|
|
(352 |
) |
|
Excess tax benefit from stock-based compensation plans |
|
|
— |
|
|
|
(432 |
) |
|
|
(236 |
) |
|
(Gain) loss on disposals of property and equipment |
|
|
(66 |
) |
|
|
(39 |
) |
|
|
2 |
|
|
Loss from discontinued operations |
|
|
— |
|
|
|
— |
|
|
|
176 |
|
|
Other, net |
|
|
13 |
|
|
|
— |
|
|
|
— |
|
|
Change in operating assets and liabilities, net of acquisitions and excluding the impact of discontinued operations: |
|
|
|
|
|
|
|
|
|
|
|
|
|
Accounts receivable |
|
|
911 |
|
|
|
(2,727 |
) |
|
|
581 |
|
|
Inventories |
|
|
(143 |
) |
|
|
(162 |
) |
|
|
511 |
|
|
Prepaids and other |
|
|
409 |
|
|
|
141 |
|
|
|
(23 |
) |
|
Accounts payable and accrued liabilities |
|
|
3,710 |
|
|
|
373 |
|
|
|
(738 |
) |
|
Income taxes |
|
|
76 |
|
|
|
(309 |
) |
|
|
116 |
|
|
Deferred revenue |
|
|
(129 |
) |
|
|
(13 |
) |
|
|
75 |
|
|
Net cash provided by operating activities from continuing operations |
|
|
25,166 |
|
|
|
15,066 |
|
|
|
18,537 |
|
|
Investing Activities: |
|
|
|
|
|
|
|
|
|
|
|
|
|
Payments for acquisition, net of cash acquired |
|
|
(25,859 |
) |
|
|
(270 |
) |
|
|
— |
|
|
Purchases of property and equipment |
|
|
(8,192 |
) |
|
|
(1,877 |
) |
|
|
(2,278 |
) |
|
Cash proceeds from sale of property and equipment |
|
|
89 |
|
|
|
42 |
|
|
|
— |
|
|
Purchases of available-for-sale securities |
|
|
(24,517 |
) |
|
|
(3,376 |
) |
|
|
(138,363 |
) |
|
Sales and maturities of available-for-sale securities |
|
|
2,498 |
|
|
|
22,199 |
|
|
|
162,673 |
|
|
Cash received from strategic investments |
|
|
513 |
|
|
|
21 |
|
|
|
709 |
|
|
Cash transferred to discontinued operations |
|
|
— |
|
|
|
(45 |
) |
|
|
(354 |
) |
|
Net cash (used in) provided by investing activities from continuing operations |
|
|
(55,468 |
) |
|
|
16,694 |
|
|
|
22,387 |
|
|
Financing Activities: |
|
|
|
|
|
|
|
|
|
|
|
|
|
Excess tax benefit from stock-based compensation plans |
|
|
— |
|
|
|
432 |
|
|
|
236 |
|
|
Issuance of common stock |
|
|
494 |
|
|
|
710 |
|
|
|
512 |
|
|
Repurchase of common stock |
|
|
— |
|
|
|
(20,000 |
) |
|
|
(12,545 |
) |
|
Purchases of common stock to pay employee taxes |
|
|
(388 |
) |
|
|
(825 |
) |
|
|
(1,111 |
) |
|
Payment of contingent consideration |
|
|
(305 |
) |
|
|
— |
|
|
|
— |
|
|
Net cash used in financing activities from continuing operations |
|
|
(199 |
) |
|
|
(19,683 |
) |
|
|
(12,908 |
) |
|
Net cash (used in) provided by continuing operations |
|
|
(30,501 |
) |
|
|
12,077 |
|
|
|
28,016 |
|
|
Discontinued Operations: |
|
|
|
|
|
|
|
|
|
|
|
|
|
Net cash used in operating activities |
|
|
— |
|
|
|
(45 |
) |
|
|
(354 |
) |
|
Net cash provided by financing activities |
|
|
— |
|
|
|
45 |
|
|
|
354 |
|
|
Net cash provided by discontinued operations |
|
|
— |
|
|
|
— |
|
|
|
— |
|
|
Effect of exchange rate changes on cash |
|
|
(100 |
) |
|
|
— |
|
|
|
— |
|
|
Net change in cash and cash equivalents |
|
|
(30,601 |
) |
|
|
12,077 |
|
|
|
28,016 |
|
|
Cash and Cash Equivalents: |
|
|
|
|
|
|
|
|
|
|
|
|
|
Beginning of year |
|
|
55,588 |
|
|
|
43,511 |
|
|
|
15,495 |
|
|
End of year |
|
$ |
24,987 |
|
|
$ |
55,588 |
|
|
$ |
43,511 |
|
The accompanying notes are an integral part of these consolidated financial statements.
F-6
Surmodics, Inc. and Subsidiaries
Consolidated Statements of Cash Flows - Continued
For the Years Ended September 30
|
|
|
2016 |
|
|
2015 |
|
|
2014 |
|
|||
|
|
|
(In thousands) |
|
|||||||||
|
Supplemental Information: |
|
|
|
|
|
|
|
|
|
|
|
|
|
Cash paid for income taxes |
|
$ |
6,710 |
|
|
$ |
6,510 |
|
|
$ |
6,295 |
|
|
Noncash financing and investing activities: |
|
|
|
|
|
|
|
|
|
|
|
|
|
Acquisition of property and equipment on account |
|
$ |
50 |
|
|
$ |
22 |
|
|
$ |
11 |
|
|
Contingent consideration and debt assumed in acquisitions |
|
$ |
12,584 |
|
|
$ |
— |
|
|
$ |
0 |
|
|
Issuance of performance shares, restricted and deferred stock units |
|
$ |
1,472 |
|
|
$ |
2,250 |
|
|
$ |
3,007 |
|
|
Accrual of business combination contingent consideration |
|
$ |
— |
|
|
$ |
305 |
|
|
$ |
— |
|
The accompanying notes are an integral part of these consolidated financial statements.
F-7
Surmodics, Inc. and Subsidiaries
Notes to Consolidated Financial Statements
1. Description
Surmodics, Inc. and subsidiaries (“Surmodics” or the “Company”) is a leading provider of medical device and in vitro diagnostic technologies to the healthcare industry. The Company derives its revenue from three primary sources: (1) royalties and license fees from licensing our proprietary surface modification and device drug delivery technologies to customers; the vast majority (typically in excess of 90%) of revenue in the “royalties and license fees” category is in the form of royalties; (2) product revenues from the sale of reagent chemicals to licensees, the sale of stabilization products, antigens, substrates and surface coatings to the diagnostic and biomedical research markets as well as the sale of medical devices and related products (such as balloons and catheters) to original equipment manufacturer (OEM) suppliers and distributors; and (3) research and commercial development fees generated on customer projects.
Basis of Presentation
The consolidated financial statements include all accounts and wholly-owned subsidiaries, and have been prepared in accordance with accounting principles generally accepted in the United States of America (“U.S.”) (“GAAP”). All inter-company transactions have been eliminated.
2. Summary of Significant Accounting Policies and Select Balance Sheet Information
Cash and Cash Equivalents
Cash and cash equivalents consist of financial instruments with maturities of three months or less at the Company’s acquisition date of the security and are stated at cost which approximates fair value and may include money market instruments, certificates of deposit, repurchase agreements and commercial paper instruments.
Investments
Investments consisted principally of commercial paper securities and are classified as available-for-sale as of September 30, 2016. Available-for-sale securities are reported at fair value with unrealized gains and losses, net of tax, excluded from the consolidated statements of income and reported in the consolidated statements of comprehensive income as well as a separate component of stockholders’ equity in the consolidated balance sheets, except for other-than-temporary impairments, which are reported as a charge to current earnings. A loss would be recognized when there is an other-than-temporary impairment in the fair value of any individual security classified as available-for-sale, with the associated net unrealized loss reclassified out of accumulated other comprehensive income with a corresponding adjustment to other income (loss). This adjustment results in a new cost basis for the investment. Interest earned on debt securities, including amortization of premiums and accretion of discounts, is included in other income. Realized gains and losses from the sales of debt securities, which are included in other income, are determined using the specific identification method.
The amortized cost, unrealized holding gains and losses, and fair value of available-for-sale securities as of September 30, 2016 were as follows:
|
|
|
September 30, 2016 |
|
|||||||||||||
|
(Dollars in thousands) |
|
Amortized Cost |
|
|
Unrealized Gains |
|
|
Unrealized Losses |
|
|
Fair Value |
|
||||
|
Commercial paper and corporate bonds |
|
$ |
22,019 |
|
|
$ |
— |
|
|
$ |
(65 |
) |
|
$ |
21,954 |
|
|
Total |
|
$ |
22,019 |
|
|
$ |
— |
|
|
$ |
(65 |
) |
|
$ |
21,954 |
|
During the year ended September 30, 2015, the Company liquidated its investment portfolio to support corporate initiatives, as a result the ending balance of available-for-sale investments as of September 30, 2015 was zero.
F-8
The following table summarizes sales of available-for-sale securities for the years ended September 30, 2016, 2015 and 2014 (in thousands):
|
|
|
2016 |
|
|
2015 |
|
|
2014 |
|
|||
|
Proceeds from sales |
|
$ |
2,498 |
|
|
$ |
22,199 |
|
|
$ |
162,673 |
|
|
Gross realized gains |
|
$ |
— |
|
|
$ |
548 |
|
|
$ |
134 |
|
|
Gross realized losses |
|
$ |
(2 |
) |
|
$ |
(73 |
) |
|
$ |
(1 |
) |
There were no held-to-maturity debt securities as of September 30, 2016 or 2015.
Inventories
Inventories are principally stated at the lower of cost or market using the specific identification method and include direct labor, materials and overhead. Inventories consisted of the following components as of September 30 (in thousands):
|
|
|
2016 |
|
|
2015 |
|
||
|
Raw materials |
|
$ |
1,766 |
|
|
$ |
1,264 |
|
|
Work in-process |
|
|
492 |
|
|
|
213 |
|
|
Finished products |
|
|
1,321 |
|
|
|
1,502 |
|
|
Total |
|
$ |
3,579 |
|
|
$ |
2,979 |
|
Property and Equipment
Property and equipment are stated at cost, less any impairment, and are depreciated using the straight-line method over the estimated useful lives of the assets. The Company recorded depreciation expense of $2.3 million, $2.0 million and $2.0 million for the years ended September 30, 2016, 2015 and 2014, respectively.
The September 30, 2016 and 2015 balances in construction-in-progress include the cost of enhancing the capabilities of the Company’s Ballinasloe, Ireland and Eden Prairie, Minnesota facilities. As assets are placed in service, construction-in-progress is transferred to the specific property and equipment categories and depreciated over the estimated useful lives of the assets.
Property and equipment consisted of the following components as of September 30 (in thousands):
|
|
|
Useful Life |
|
2016 |
|
|
2015 |
|
||
|
|
|
(In years) |
|
|
|
|
|
|
|
|
|
Land |
|
N/A |
|
$ |
4,359 |
|
|
$ |
4,359 |
|
|
Laboratory fixtures and equipment |
|
3 to 10 |
|
|
15,243 |
|
|
|
12,941 |
|
|
Buildings and improvements |
|
3 to 20 |
|
|
19,589 |
|
|
|
16,444 |
|
|
Office furniture and equipment |
|
3 to 10 |
|
|
3,948 |
|
|
|
3,473 |
|
|
Construction-in-progress |
|
|
|
|
3,441 |
|
|
|
1,168 |
|
|
Less accumulated depreciation |
|
|
|
|
(26,979 |
) |
|
|
(25,417 |
) |
|
Property and equipment, net |
|
|
|
$ |
19,601 |
|
|
$ |
12,968 |
|
Other Assets
Other assets consist principally of the following as of September 30 (in thousands):
|
|
|
2016 |
|
|
2015 |
|
||
|
ViaCyte, Inc. |
|
$ |
479 |
|
|
$ |
479 |
|
|
Other noncurrent assets |
|
|
149 |
|
|
|
— |
|
|
Other assets, net |
|
$ |
628 |
|
|
$ |
479 |
|
F-9
In February 2011, the stent technology of Nexeon MedSystems, Inc. (“Nexeon”) was acquired by CeloNova BioSciences, Inc. (“CeloNova”). Prior to the acquisition by CeloNova, Nexeon created a wholly-owned subsidiary, Nexeon Stent, to hold the company’s stent-related assets. Nexeon distributed to its stockholders the Nexeon Stent stock which was exchanged for Series B-1 preferred shares of CeloNova. CeloNova is a privately-held Texas-based medical technology company that is marketing a variety of medical products. The Company’s investment in CeloNova, which was accounted for under the cost method, represented less than a 2% ownership interest. The Company does not exert significant influence over CeloNova’s operating or financial activities.
On November 10, 2015 Boston Scientific Corporation announced its intent to acquire CeloNova’s interventional radiology portfolio for $70 million plus potential milestone payments. The Company recognized an other-than-temporary impairment loss of $1.5 million related to its investment in CeloNova in the fourth quarter fiscal 2015 based on the indicated value of this transaction.
The Company has invested a total of $1.2 million in ThermopeutiX, Inc. (“ThermopeutiX”), a California-based early stage company developing novel medical devices for the treatment of vascular and neurovascular diseases. In addition to the investment, Surmodics has licensed its hydrophilic and hemocompatible coating technologies to ThermopeutiX for use with its devices. The Company’s investment in ThermopeutiX, which is accounted for under the cost method, represents an ownership interest of less than 20%. The Company does not exert significant influence over ThermopeutiX’s operating or financial activities. In the fourth quarter of fiscal 2014, the Company recognized an other-than-temporary impairment loss of $1.2 million based on capital funding initiatives and current operating conditions of ThermopeutiX.
The Company has invested a total of $5.3 million in ViaCyte, Inc. (“ViaCyte”), a privately-held California-based biotechnology firm that is developing a unique treatment for diabetes using coated islet cells, the cells that produce insulin in the human body. In fiscal 2006, the Company determined that its investment in ViaCyte was impaired and that the impairment was other-than-temporary. Accordingly, the Company recorded an impairment loss of $4.7 million. In the second quarter of fiscal 2013, the Company recorded an additional other-than-temporary impairment loss on this investment totaling $0.1 million based on a financing round and market valuations. The balance of the investment of $0.5 million, which is accounted for under the cost method, represents less than a 1% ownership interest. The Company does not exert significant influence over ViaCyte’s operating or financial activities.
The Company had invested a total of $2.5 million in Vessix Vascular, Inc. (“Vessix”) and recognized an other-than-temporary impairment loss on this investment totaling $2.4 million in fiscal 2010, based on market valuations and a pending financing round for Vessix. Vessix was purchased by Boston Scientific Corporation in November 2012. The Company recorded a gain of approximately $1.2 million in the consolidated statements of income gains on sale of strategic investments line, on the sale of this investment in the first quarter of fiscal 2013. In fiscal 2014, the Company recorded a $0.7 million gain upon achievement by Vessix of a clinical milestone and a sales milestone for calendar 2013. Total potential maximum additional proceeds of $3.3 million may be received in fiscal 2017, depending on Vessix’s achievement of future sales milestones. No amounts have been recorded associated with these future milestones given the level of uncertainty that exists. Any potential additional income will be recognized once the milestones are achieved.
The Company transferred its original investment of $2,000 in Intersect ENT, Inc. (“Intersect ENT”) out of other assets to short-term available-for-sale investments upon completion of Intersect ENT’s initial public offering (“IPO”) in July 2014. The Company recognized a gain on this investment in other income of $0.5 million during the year ended September 30, 2015 as the investment was sold.
The total carrying value of cost method investments is reviewed quarterly for changes in circumstances or the occurrence of events that suggest the Company’s investment may not be recoverable. The fair value of cost method investments is not adjusted if there are no identified events or changes in circumstances that may have a material adverse effect on the fair value of the investment.
In the fiscal years ended September 30, 2016, 2015 and 2014, the Company recognized revenue of less than $0.1 million in each period from activity with companies in which it had a strategic investment.
Intangible Assets
Intangible assets consist principally of acquired patents and technology, customer lists and relationships, licenses and trademarks. The Company recorded amortization expense of $2.4 million, $0.8 million and $0.7 million for the years ended September 30, 2016, 2015 and 2014, respectively. During the year ended September 30, 2016, the Company acquired 100% of the shares of both Creagh Medical Ltd. (“Creagh Medical”) and NorMedix, Inc. (“NorMedix”). These acquisitions (collectively, “Fiscal 2016 Acquisitions”) resulted in an increase in customer lists and relationships, developed technology and in-process research and
F-10
development (“IPR&D”) of $12.6 million, $8.7 million and $1.0 million, respectively. During the year ended September 30, 2015, the Company acquired certain assets from ImmunO4, LLC resulting in an increase in customer lists, non-compete and other intangible assets of $0.3 million, $0.2 million and $0.1 million, respectively.
Intangible assets consisted of the following as of September 30 (in thousands):
|
|
|
2016 |
|
|||||||||||||
|
|
|
Weighted Average Original Life (Years) |
|
|
Gross Carrying Amount |
|
|
Accumulated Amortization |
|
|
Net |
|
||||
|
Definite-lived intangible assets: |
|
|
|
|
|
|
|
|
|
|
|
|
|
|
|
|
|
Customer lists and relationships |
|
|
8.9 |
|
|
$ |
17,692 |
|
|
$ |
(6,123 |
) |
|
$ |
11,569 |
|
|
Core technology |
|
|
8.0 |
|
|
|
530 |
|
|
|
(530 |
) |
|
|
— |
|
|
Developed technology |
|
|
11.8 |
|
|
|
8,724 |
|
|
|
(618 |
) |
|
|
8,106 |
|
|
Non-compete |
|
|
5.0 |
|
|
|
230 |
|
|
|
(58 |
) |
|
|
172 |
|
|
Patents and other |
|
|
16.5 |
|
|
|
2,321 |
|
|
|
(1,275 |
) |
|
|
1,046 |
|
|
Subtotal |
|
|
|
|
|
|
29,497 |
|
|
|
(8,604 |
) |
|
|
20,893 |
|
|
Unamortized intangible assets: |
|
|
|
|
|
|
|
|
|
|
|
|
|
|
|
|
|
In-process research and development |
|
|
|
|
|
|
987 |
|
|
|
— |
|
|
|
987 |
|
|
Trademarks and trade names |
|
|
|
|
|
|
645 |
|
|
|
— |
|
|
|
645 |
|
|
Total |
|
|
|
|
|
$ |
31,129 |
|
|
$ |
(8,604 |
) |
|
$ |
22,525 |
|
|
|
|
2015 |
|
|||||||||||||
|
|
|
Weighted Average Original Life (Years) |
|
|
Gross Carrying Amount |
|
|
Accumulated Amortization |
|
|
Net |
|
||||
|
Definite-lived intangible assets: |
|
|
|
|
|
|
|
|
|
|
|
|
|
|
|
|
|
Customer lists |
|
|
9.0 |
|
|
$ |
5,132 |
|
|
$ |
(4,363 |
) |
|
$ |
769 |
|
|
Core technology |
|
|
8.0 |
|
|
|
530 |
|
|
|
(530 |
) |
|
|
— |
|
|
Non-compete |
|
|
5.0 |
|
|
|
230 |
|
|
|
(12 |
) |
|
|
218 |
|
|
Patents and other |
|
16.8 |
|
|
|
2,321 |
|
|
|
(1,128 |
) |
|
|
1,193 |
|
|
|
Subtotal |
|
|
|
|
|
|
8,213 |
|
|
|
(6,033 |
) |
|
|
2,180 |
|
|
Unamortized intangible assets: |
|
|
|
|
|
|
|
|
|
|
|
|
|
|
|
|
|
Trademarks |
|
|
|
|
|
|
580 |
|
|
|
— |
|
|
|
580 |
|
|
Total |
|
|
|
|
|
$ |
8,793 |
|
|
$ |
(6,033 |
) |
|
$ |
2,760 |
|
Based on the intangible assets in service, excluding any possible future amortization associated with acquired IPR&D, which has not met technological feasibility as of September 30, 2016, estimated amortization expense for each of the next five fiscal years is as follows (in thousands):
|
2017 |
|
$ |
2,580 |
|
|
2018 |
|
|
2,534 |
|
|
2019 |
|
|
2,534 |
|
|
2020 |
|
|
2,358 |
|
|
2021 |
|
|
2,219 |
|
Future amortization amounts presented above are estimates. Actual future amortization expense may be different as a result of future acquisitions, impairments, completion or abandonment of IPR&D intangible assets, changes in amortization periods, or other factors.
The Company defines IPR&D as the value of technology acquired for which the related projects have substance and are incomplete. IPR&D acquired in a business acquisition is recognized at fair value and is capitalized as an indefinite-lived intangible asset until completion of the IPR&D project or abandonment. Upon completion of the development project (generally when regulatory approval to market the product is obtained), an impairment assessment is performed prior to amortizing the asset over its estimated useful life. If the IPR&D projects are abandoned, the related IPR&D assets would be written off. The Company assesses indefinite-lived assets for impairment annually in the fourth quarter and whenever an event occurs or circumstances change that would indicate that
F-11
the carrying amount may be impaired. Similar to the goodwill impairment test, the indefinite-lived assets impairment test requires the Company to make several estimates about fair value, most of which are based on projected future cash flows. The Company performed its annual impairment analysis as of August 31, 2016 and the fair value of certain trade name assets were deemed to be less than their carrying value, resulting in an impairment loss of less than $0.1 million, which was recorded in Selling, general and administrative in the consolidated statements of income for the fiscal year ended September 30, 2016. No other impairment losses were identified during the annual impairment analysis.
Goodwill
Goodwill represents the excess of the cost of an acquired entity over the fair value assigned to the assets purchased and liabilities assumed in connection with a company’s acquisition. Goodwill is not amortized but is subject, at a minimum, to annual tests for impairment in accordance with accounting guidance for goodwill. The carrying amount of goodwill is evaluated annually, and between annual evaluations if events occur or circumstances change indicating that it is more likely than not that the fair value of a reporting unit is less than its carrying amount.
Goodwill is evaluated for impairment based on an assessment of qualitative factors to determine whether the existence of events or circumstances leads to a determination that it is more likely than not that the fair value of a reporting unit is less than its carrying amount (Step 0). If, after assessing the totality of events or circumstances, an entity determines it is not more likely than not that the fair value of a reporting unit is less than its carrying amount, then performing the two-step impairment test, as described below, becomes unnecessary. If events or circumstances occur that would indicate that the carrying amount may be impaired, or if the Company otherwise determines it necessary, the two-step impairment test will be performed.
The two-step impairment test requires Surmodics to compare the fair value of the reporting units to which goodwill was assigned to their respective carrying values (Step 1 of the impairment test). In calculating fair value, the Company would use the income approach as its primary indicator of fair value, with the market approach used as a test of reasonableness. The income approach is a valuation technique under which the Company estimates future cash flows using the reporting units’ financial forecasts. Future estimated cash flows would be discounted to their present value to calculate fair value. The market approach establishes fair value by comparing Surmodics’ reporting units to other publicly traded guideline companies or by analysis of actual transactions of similar businesses or assets sold. The income approach would be tailored to the circumstances of the Company’s business, and the market approach would be completed as a secondary test to ensure that the results of the income approach are reasonable and in line with comparable companies in the industry. The summation of the Company’s reporting units’ fair values would be compared and reconciled to its market capitalization as of the date of its impairment test.
In the situation where a reporting unit’s carrying amount exceeds its fair value, the amount of the impairment loss must be measured. The measurement of the impairment (Step 2 of the impairment test) is calculated by determining the implied fair value of a reporting unit’s goodwill. In calculating the implied fair value of goodwill, the fair value of the reporting unit is allocated to all other assets and liabilities of that unit based on their fair values. The excess of the fair value of a reporting unit over the amount assigned to its other assets and liabilities is the implied fair value of goodwill. The goodwill impairment is measured as the excess of the carrying amount of goodwill over its implied fair value.
The Company’s reporting units are the In Vitro Diagnostics operations known as its In Vitro Diagnostics unit which contains its BioFX branded products and the Surmodics device drug delivery, hydrophilic coatings and medical device manufacturing operations known as the Medical Device unit. Inherent in the determination of fair value of the reporting units are certain estimates and judgments, including the interpretation of current economic indicators and market valuations as well as the Company’s strategic plans with regard to its operations.
Goodwill as of September 30, 2016 and September 30, 2015 totaled $26.6 million and $8.0 million, respectively. The $8.0 million of goodwill as of September 30, 2016 and 2015 is related to the In Vitro Diagnostics reporting unit and represents the gross value from the acquisition of BioFX Laboratories, Inc. in 2007. As part of the Creagh Medical and NorMedix acquisitions, the Medical Device reporting segment recorded $17.9 million of goodwill during 2016, $13.4 million of which is denominated in Euros and subject to revaluation due to fluctuations in exchange rates. Due to these acquisitions in the current year, the Company performed the two-step impairment test to determine if impairment exists and to provide for a baseline against which qualitative factors can be compared going forward. The Company performed its annual impairment test of goodwill (Step 1) as of August 31, 2016, and did not record any goodwill impairment charges during fiscal 2016 as it was determined that the reporting units’ fair values were greater than their carrying values. The Company also did not record any goodwill impairment charges related to the In Vitro Diagnostics reporting unit during fiscal 2015 or 2014 based on the Company’s Step 0 analysis.
F-12
In the first quarter of fiscal 2016, the Company purchased Creagh Medical for up to €30 million, or approximately $32.1 million based on acquisition date exchange rates. The purchase price of Creagh Medical exceeded the net acquisition-date amounts of the identifiable assets acquired and the liabilities assumed by $13.4 million.
In the second quarter of fiscal 2016, the Company purchased NorMedix. The purchase price of NorMedix exceeded the net acquisition-date amounts of the identifiable assets acquired and the liabilities assumed by $4.5 million. The Company finalized its allocation of purchase price to the assets acquired and the liabilities assumed for both of these acquisitions in the quarter ended September 30, 2016.
The change in the carrying amount of goodwill by segment for the year ended September 30, 2016 was as follows:
|
(Dollars in thousands) |
|
In Vitro Diagnostics |
|
|
Medical Device |
|
|
Total |
|
|||
|
Balance as of September 30, 2015 |
|
$ |
8,010 |
|
|
$ |
— |
|
|
$ |
8,010 |
|
|
Additions (See Note 3) |
|
|
— |
|
|
|
17,892 |
|
|
|
17,892 |
|
|
Foreign currency translation adjustment |
|
|
— |
|
|
|
653 |
|
|
|
653 |
|
|
Balance as of September 30, 2016 |
|
$ |
8,010 |
|
|
$ |
18,545 |
|
|
$ |
26,555 |
|
|
|
|
|
|
|
|
|
|
|
|
|
|
|
Valuation of Long-Lived Assets
Accounting guidance requires the Company to evaluate periodically whether events and circumstances have occurred that may affect the estimated useful life or the recoverability of the remaining balance of long-lived assets, such as property and equipment and intangibles with finite lives. If such events or circumstances were to indicate that the carrying amount of these assets may not be recoverable, the Company would estimate the future cash flows expected to result from the use of the assets and their eventual disposition. If the sum of the expected future cash flows (undiscounted and without interest charges) were less than the carrying amount of the assets, the Company would recognize an impairment charge to reduce such assets to their fair value. In fiscal 2016, 2015 and 2014, there were no impairment charges relating to the Company’s long-lived assets as there were no events or circumstances that occurred that affected the recoverability of such assets.
Revenue Recognition
The Company recognizes revenue when all of the following criteria are met: (1) persuasive evidence of an arrangement exists; (2) shipment has occurred or delivery has occurred if the terms specify destination; (3) the sales price is fixed or determinable; and (4) collectability is reasonably assured. When there are additional performance requirements, revenue is recognized when all such requirements have been satisfied. Under revenue arrangements with multiple deliverables, the Company recognizes each separable deliverable as it is earned.
The Company derives its revenue from three primary sources: (1) royalties and license fees from licensing our proprietary surface modification and device drug delivery technologies to customers; the vast majority (typically in excess of 90%) of revenue in the “royalties and license fees” category is in the form of royalties; (2) product revenues from the sale of reagent chemicals to licensees, the sale of stabilization products, antigens, substrates and surface coatings to the diagnostic and biomedical research markets as well as the sale of medical devices and related products (such as balloons and catheters) to original equipment manufacturer (OEM) suppliers and distributors; and (3) research and commercial development fees generated on customer projects.
Taxes collected from customers and remitted to governmental authorities are excluded from revenue and amounted to $0.1 million for each of the years ended September 30, 2016, 2015 and 2014.
Royalties and license fees. The Company licenses technology to third parties and collects royalties. Royalty revenue is generated when a customer sells products incorporating the Company’s licensed technologies. Royalty revenue is recognized as licensees report it to the Company, and payment is typically submitted concurrently with the report. For stand-alone license agreements, up-front license fees are recognized over the term of the related licensing agreement. Minimum royalty fees are recognized in the period earned.
F-13
Revenue related to a performance milestone is recognized upon the achievement of the milestone, as defined in the respective agreements and provided the following conditions have been met:
|
|
• |
The milestone payment is non-refundable; |
|
|
• |
The milestone involved a significant degree of risk, and was not reasonably assured at the inception of the arrangement; |
|
|
• |
Accomplishment of the milestone involved substantial effort; |
|
|
• |
The amount of the milestone payment is commensurate with the related effort and risk; and |
|
|
• |
A reasonable amount of time passed between the initial license payment and the first and subsequent milestone payments. |
If these conditions have not been met, the milestone payment is deferred and recognized over the term of the agreement.
Product sales. Product sales to third parties consist of direct and distributor sales and are recognized at the time of shipment. The Company’s sales terms provide no right of return outside of the standard warranty policy. Payment terms are generally set at 30-45 days.
Research and development. The Company performs third-party research and development activities, which are typically provided on a time and materials basis. Generally, revenue for research and development is recorded as performance progresses under the applicable contract.
Arrangements with multiple deliverables. Revenue arrangements with multiple deliverables requires the Company to:
(i) disclose whether multiple deliverables exist, how the deliverables in an arrangement should be separated, and how the consideration should be allocated;
(ii) allocate revenue in an arrangement using estimated selling prices (“ESP”) of deliverables if a vendor does not have vendor-specific objective evidence of selling price (“VSOE”) or third-party evidence of selling price (“TPE”); and
(iii) allocate revenue using the relative selling price method.
The Company accounts for revenue using a multiple attribution model in which consideration allocated to research and development activities is recognized as performed, and milestone payments are recognized when the milestone events are achieved, when such activities and milestones are deemed substantive. Accordingly, in situations where a unit of accounting includes both a license and research and development activities, and when a license does not have stand-alone value, the Company applies a multiple attribution model in which consideration allocated to the license is recognized ratably, consideration allocated to research and development activities is recognized as performed and milestone payments are recognized when the milestone events are achieved, when such activities and milestones are deemed substantive.
The Company enters into license and development arrangements that may consist of multiple deliverables which could include a license(s) to Surmodics’ technology, research and development activities, manufacturing services, and product sales based on the needs of its customers. For example, a customer may enter into an arrangement to obtain a license to Surmodics’ intellectual property which may also include research and development activities, and supply of products manufactured by Surmodics. For these services provided, Surmodics could receive upfront license fees upon signing of an agreement and granting the license, fees for research and development activities as such activities are performed, milestone payments contingent upon advancement of the product through development and clinical stages to successful commercialization, fees for manufacturing services and supply of product, and royalty payments based on customer sales of product incorporating Surmodics’ technology. The Company’s license and development arrangements generally do not have refund provisions if the customer cancels or terminates the agreement. Typically all payments made are non-refundable.
The Company is required to evaluate each deliverable in a multiple element arrangement for separability. The Company is then required to allocate revenue to each separate deliverable using a hierarchy of VSOE, TPE, or ESP. In many instances, the Company is not able to establish VSOE for all deliverables in an arrangement with multiple elements. This may be a result of the Company infrequently selling each element separately or having a limited history with multiple element arrangements. When VSOE cannot be established, the Company attempts to establish a selling price of each element based on TPE. TPE is determined based on competitor prices for similar deliverables when sold separately.
F-14
When the Company is unable to establish a selling price using VSOE or TPE, the Company uses ESP in its allocation of arrangement consideration. The objective of ESP is to determine the price at which the Company would transact a sale if the product or service were sold on a stand-alone basis. ESP is generally used for highly customized offerings.
The Company determines ESP for undelivered elements by considering multiple factors including, but not limited to, market conditions, competitive landscape and past pricing arrangements with similar features. The determination of ESP is made through consultation with the Company’s management, taking into consideration the marketing strategies for each business unit.
Deferred Revenue
Amounts received prior to satisfying the above revenue recognition criteria are recorded as deferred revenue in the accompanying consolidated balance sheets, with deferred revenue to be recognized beyond one year being classified as non-current deferred revenue. The Company had current and non-current deferred revenue of $0.4 million and $0.3 million for September 30, 2016 and 2015, respectively.
Customer overpayments are accounted for as a liability until all criteria for revenue recognition have been met. As of September 30, 2016, and 2015 the Company has recorded a liability of $0.9 million and $0.1 million, respectively, for customer royalty overpayments.
Customer Concentrations
The Company’s licensed technologies provide royalty revenue, which represents the largest revenue stream to the Company. The Company has licenses with a diverse base of customers and certain customers have multiple products using the Company’s technology. Medtronic plc (“Medtronic”) is the Company’s largest customer at approximately 25%, 26% and 19% of total consolidated revenue for the fiscal years ended September 30, 2016, 2015 and 2014, respectively. Medtronic has several separately licensed products that generate royalty revenue for Surmodics, none of which represented more than 6% of Surmodics’ total revenue. No other individual customer using licensed technology constitutes more than 10% of the Company’s total revenue.
The Company’s licensing agreements with many of its customers, including most of its significant customers, cover many licensed products that each separately generates royalty revenue. This structure reduces the potential risk to the Company’s operations that may result from reduced sales (or the termination of a license) of a single product for any specific customer.
Income Taxes
The Company accounts for income taxes under the asset and liability method prescribed in accounting guidance. Deferred tax assets and liabilities are recognized for the future tax consequences attributable to differences between the financial statement carrying amounts of existing assets and liabilities and their respective tax bases. A valuation allowance is provided when it is more likely than not that some portion or all of a deferred tax asset will not be realized. The ultimate realization of deferred tax assets depends on the generation of future taxable income during the period in which related temporary differences become deductible. Management considers the scheduled reversal of deferred tax liabilities, projected future taxable income and tax planning strategies in this assessment. Deferred tax assets and liabilities are measured using the enacted tax rates expected to apply to taxable income in the years in which those temporary differences are expected to be recovered or settled. The effect on deferred tax assets and liabilities of a change in tax rates is recognized in income in the period that includes the enactment date of such change.
Research and Development
Research and development costs are expensed as incurred. Some research and development costs are related to third-party contracts, and the related revenue is recognized as described in “Revenue Recognition” above. Costs associated with customer-related research and development include specific project direct labor costs and material expenses as well as an allocation of overhead costs based on direct labor dollars.
Use of Estimates
The preparation of consolidated financial statements in conformity with U.S. GAAP requires management to make estimates and assumptions that affect the reported amounts of assets and liabilities, the disclosure of contingent assets and liabilities at the
F-15
date of the consolidated financial statements and the reported amounts of revenue and expenses during the reporting period. Ultimate results could differ from those estimates.
Discontinued Operations
On November 1, 2011, the Company entered into a definitive agreement (the “Purchase Agreement”) to sell substantially all of the assets of its wholly-owned subsidiary, SurModics Pharmaceuticals, to Evonik Degussa Corporation (“Evonik”). The loss from discontinued operations net of income taxes in fiscal 2014 related to a litigation settlement completed during that fiscal year. Pharmaceuticals discontinued operations used operating cash of less than $0.1 million in fiscal 2015. Cash generated from financing activities of less than $0.1 million in fiscal 2015 related to transfers of cash from continuing operations of Surmodics and consisted of cash used to make payments on accrual balances. There was no discontinued operations activity in fiscal 2016.
Income Per Share Data
Basic income per common share is calculated based on the weighted average number of common shares outstanding during the period. Diluted income per common share is computed by dividing income by the weighted average number of common and common equivalent shares outstanding during the period. The Company’s only potentially dilutive common shares are those that result from dilutive common stock options and non-vested stock relating to restricted stock awards, restricted stock units and performance shares.
The following table sets forth the denominator for the computation of basic and diluted income per share (in thousands):
|
|
|
2016 |
|
|
2015 |
|
|
2014 |
|
|||
|
Net income from continuing operations available to common shareholders |
|
$ |
9,985 |
|
|
$ |
11,947 |
|
|
$ |
12,207 |
|
|
|
|
|
|
|
|
|
|
|
|
|
|
|
|
Basic weighted average shares outstanding |
|
|
12,998 |
|
|
|
13,029 |
|
|
|
13,632 |
|
|
Dilutive effect of outstanding stock options, non-vested restricted stock, restricted stock units and performance shares |
|
|
221 |
|
|
|
260 |
|
|
|
244 |
|
|
Diluted weighted average shares outstanding |
|
|
13,219 |
|
|
|
13,289 |
|
|
|
13,876 |
|
The calculation of weighted average diluted shares outstanding excludes outstanding common stock options associated with the right to purchase 0.7 million, 0.5 million and 0.5 million shares for fiscal 2016, 2015 and 2014, respectively, as their inclusion would have had an antidilutive effect on diluted income per share.
Currency Translation
Assets and liabilities of non-U.S. dollar functional currency subsidiaries are translated into U.S. dollars at the period-end exchange rates, and revenues and expenses are translated at the average exchange rate for the period. The net effect of these translation adjustments in the consolidated financial statements are recorded as a foreign currency translation adjustment, as a component of accumulated other comprehensive income. Foreign currency transaction gains and losses are included in other, income (loss) net in the consolidated statements of income.
Reclassifications
Certain prior-year amounts on the consolidated balance sheets and statements of income have been reclassified for consistency with the current period presentation. These reclassifications had no effect on the reported results of operations. The reclassified amounts on the consolidated balance sheets relate to the current portion of contingent consideration previously included in accrued other. The reclassified amounts on the consolidated statements of income relate to amortization on acquired intangible assets, which are shown separately due to their significance with regard to the Fiscal 2016 Acquisitions, as well as gains on strategic investments, which are combined with other income (loss).
F-16
Accounting Standards to be Adopted
In May 2014, the Financial Accounting Standards Board (“FASB”) issued Accounting Standards Codification (“ASC”) Update No. 2014-09, Revenue from Contracts with Customers (ASC Topic 606). Principles of this guidance require entities to recognize revenue in a manner that depicts the transfer of goods or services to customers in amounts that reflect the consideration an entity expects to be entitled to in exchange for those goods or services. The guidance also requires expanded disclosures relating to the nature, amount, timing, and uncertainty of revenue and cash flows arising from contracts with customers. Additionally, qualitative and quantitative disclosures are required about customer contracts, significant judgments and changes in judgments, and assets recognized from the costs to obtain or fulfill a contract. This accounting standard will be effective for the Company beginning in the first quarter of fiscal year 2019 (October 1, 2018) using one of two prescribed retrospective methods. The Company is currently evaluating the impact that the adoption of this standard will have on the Company’s business model and consolidated results of operations, cash flows and financial position. The Company currently estimates the impact may be material due to the potential acceleration of minimum license fees and a one quarter acceleration of royalty revenue pursuant to our hydrophilic license agreements.
In February 2016, the FASB issued Accounting Standards Update ASU 2016-02, Leases (ASC Topic 842). The new guidance primarily affects lessee accounting, while accounting by lessors will not be significantly impacted by the update. The update maintains two classifications of leases: finance leases, which replace capital leases, and operating leases. Lessees will need to recognize a right-of-use asset and a lease liability on the statement of financial position for those leases previously classified as operating leases under the old guidance. The liability will be equal to the present value of lease payments. The asset will be based on the liability, subject to adjustment, such as for direct costs. The accounting standard will be effective for the Company beginning the first quarter of fiscal year 2020 (October 1, 2019) using a modified retrospective approach. The Company is currently evaluating the impact that the adoption of this standard will have on the Company’s results of operations, cash flows and financial position.
In June 2016, the FASB issued ASU No 2016-13, Financial Instruments – Credit Losses (ASC Topic 326), Measurement of Credit Losses on Financial Statements. This ASU requires a financial asset (or a group of financial assets) measured at an amortized cost basis to be presented at the net amount expected to be collected. The allowance for credit losses is a valuation account that is deducted from the amortized cost basis of the financial asset(s) to present the net carrying value at the amount expected to be collected on the financial asset. The accounting standard will be effective for the Company beginning in the first quarter of fiscal 2020 (October 1, 2019), and early adoption is permitted. The Company is currently evaluating the impact that the adoption of this standard will have on the Company’s results of operations, cash flows and financial position.
In August 2016, the FASB issued ASU No. 2016-15, Statement of Cash Flows (Topic 230): Classification of Certain Cash Receipts and Cash Payments. The new guidance clarifies requirements for presentation and classification of the following items within the statement of cash flows: debt prepayments, settlement of zero coupon debt instruments, contingent consideration payments, insurance proceeds, securitization transactions and distributions from equity method investees. The update also addresses classification of transactions that have characteristics of more than one class of cash flows. The accounting standard will be effective for the Company beginning in the first quarter of fiscal 2018. Early adoption is permitted, including adoption in an interim period. The Company is currently evaluating the impact that the adoption of this standard will have on the Company’s consolidated statements of cash flows.
Accounting Standards Implemented
In September 2015, the FASB issued Accounting Standards Update (“ASU”) 2015-16, Business Combinations (Topic 805): Simplifying the Accounting for Measurement-Period Adjustments. The update requires that an acquirer recognize adjustments to provisional amounts that are identified during the measurement period in the reporting period in which the adjustment amounts are determined, including the cumulative effect of the change in provisional amounts as if the accounting had been completed at the acquisition date. The adjustments related to previous reporting periods since the acquisition date must be disclosed by income statement line item either on the face of the income statement or in the notes. ASU 2015-16 is effective for fiscal years beginning after December 15, 2015, including interim periods within those fiscal years, with early adoption permitted. The Company adopted the ASU in the first quarter of fiscal 2016 without any material impact on the Company’s financial position or financial results.
In November 2015, the FASB issued ASU 2015-17, Balance Sheet Classification of Deferred Taxes, which eliminates the current requirement to present deferred tax liabilities and assets as current and noncurrent in a classified balance sheet. Instead, entities are required to classify all deferred tax assets and liabilities as noncurrent. This ASU is effective for the Company beginning in its first quarter of fiscal year 2018 and early implementation is permitted using either the prospectively or retroactive adoption method. The Company prospectively adopted this ASU in the first quarter of fiscal 2016.
F-17
In March 2016, the FASB issued ASU No. 2016-09, Compensation – Stock Compensation (ASC Topic 718): Improvements to Employee Share-Based Payment Accounting. The accounting standard intends to simplify several areas of accounting for share-based compensation arrangements, including the income tax impact, classification of awards as either equity or liabilities, and classification on the statement of cash flows. The accounting standard is effective for the Company beginning in the first quarter of fiscal 2018 (October 1, 2017), and early adoption is permitted. The Company elected to early-adopt this accounting standard in the fourth quarter of fiscal 2016, for the annual period ended September 30, 2016. As a result of the adoption, the Company will no longer record excess tax benefits and certain tax deficiencies in additional paid-in capital. Instead, all excess tax benefits and tax deficiencies will be recognized as income tax expense or benefit in the consolidated statements of income, and additional paid-in capital pools will be eliminated. The effects of the adoption of this guidance on the income tax provision is discussed further in Note 8 to the consolidated financial statements.
The guidance also requires presentation of excess tax benefits as an operating activity on the statement of cash flows rather than as a financing activity. Prior to the adoption of ASU No. 2016-09, cash flows resulting from the tax benefits generated by tax deductions in excess of the compensation cost recognized for those options (excess tax benefits) are classified as financing cash flows. During the fiscal years ended September 30, 2015 and 2014, the Company realized tax benefits from stock options generated in previous and current periods resulting in approximately $0.4 million and $0.2 million of gross excess tax benefits, which are included as a component of cash flows from financing activities in the accompanying fiscal 2015 and 2014 consolidated statements of cash flows, respectively.
No other new accounting pronouncement issued or effective has had, or is expected to have, a material impact on the Company’s consolidated financial statements.
3. Business Combinations
For all business combinations, the Company records all assets and liabilities of the acquired business, including goodwill and other identified intangible assets, their respective fair values as of the acquisition date. Contingent consideration, if any, is recognized at its fair value on the acquisition date and changes in fair value are recognized in earnings until settlement. Acquisition-related transaction costs are expensed as incurred.
Creagh Medical Ltd.
On November 20, 2015, the Company acquired 100% of the outstanding common shares and voting shares of Creagh Medical located in Ballinasloe, Ireland. The results of Creagh Medical’s operations have been included in the Company’s consolidated financial statements as of the Creagh Medical acquisition date. The acquisition was financed with cash on hand and contingent seller financing. The Company acquired Creagh Medical for up to €30 million (approximately $32 million as of the acquisition date), including an upfront payment of €18 million (approximately $19.3 million as of the acquisition date), and up to €12 million (approximately $12.8 million as of the acquisition date) based on achievement of revenue and value-creating operational milestones through September 30, 2018. The payment of the milestones, if any, will occur in the quarter ending December 31, 2018. As of September 30, 2016, the Company has paid $18.4 million in cash for this acquisition. Total transaction, integration and other costs associated with the Creagh Medical acquisition aggregated $2.7 million for the fiscal year ended September 30, 2016. The operating results for Creagh Medical are included in the Medical Device segment.
Creagh Medical designs and manufactures high-quality percutaneous transluminal angioplasty (“PTA”) balloon catheters. Since 2006, Creagh Medical has grown its technical and product capability with PTA products approved throughout the world, including Europe, the United States, and Japan. With these resources, the Company is uniquely positioned to offer a total solutions approach from product design and development through in-house extrusion, balloon forming, top-assembly and packaging and regulatory capabilities to approved products for exclusive distribution.
The purchase price of Creagh Medical consisted of the following (in thousands):
|
Cash paid |
|
$ |
18,449 |
|
|
Debt assumed |
|
|
761 |
|
|
Contingent consideration |
|
|
9,064 |
|
|
Total purchase price |
|
|
28,274 |
|
|
Less cash and cash equivalents acquired |
|
|
(251 |
) |
|
Total purchase price, net of cash acquired |
|
$ |
28,023 |
|
F-18
The purchase accounting allocation of assets acquired and liabilities assumed was finalized during the fourth quarter of fiscal 2016. During the measurement period, which ended September 30, 2016, certain insignificant adjustments were made from amounts previously reported to finalize Creagh’s preliminary fair value estimates related primarily to other current assets, intangible assets, goodwill, certain property value, contingent liabilities and the related deferred tax impacts.
The following table summarizes the final allocation of the purchase price to the fair values assigned to the assets acquired and the liabilities assumed at the date of the Creagh Medical acquisition:
|
|
|
Fair Value (Dollars in thousands) |
|
Estimated Useful Life (In years) |
|
|
Current assets |
|
$ |
896 |
|
N/A |
|
Property and equipment |
|
|
634 |
|
1.0-10.0 |
|
Trade name |
|
|
75 |
|
N/A |
|
Developed technology |
|
|
1,787 |
|
7.0 |
|
In-process research and development |
|
|
942 |
|
N/A |
|
Customer relationships |
|
|
11,119 |
|
7.0-10.0 |
|
Other noncurrent assets |
|
|
81 |
|
N/A |
|
Current liabilities |
|
|
(942 |
) |
N/A |
|
Deferred tax liabilities |
|
|
(9 |
) |
N/A |
|
Net assets acquired |
|
|
14,583 |
|
|
|
Goodwill |
|
|
13,440 |
|
N/A |
|
Total purchase price, net of cash acquired |
|
$ |
28,023 |
|
|
The Creagh Medical goodwill is a result of acquiring and retaining the Creagh Medical existing workforce and expected synergies from integrating their business into the Company’s Medical Device segment. The goodwill is not deductible for tax purposes.
NorMedix, Inc.
On January 8, 2016, the Company acquired 100% of the shares of NorMedix, a privately owned design and development company focused on ultra thin-walled, minimally invasive catheter technologies based in Plymouth, Minnesota. The acquisition was financed with cash on hand and contingent seller financing. The Company acquired NorMedix for up to $14.0 million, including an upfront payment of $7.0 million, and up to $7.0 million based on achievement of revenue and value-creating operational milestones through September 30, 2019. Contingent consideration associated with the NorMedix transaction is payable as earned. This acquisition strengthens the Company’s vascular device expertise and Research and Development (“R&D”) capabilities. This acquisition positions the Company to make significant progress on its strategy to offer whole-product solutions to medical device customers, while continuing its commitment to consistently deliver innovation in coating technologies. Total transaction, integration and other costs associated with the NorMedix acquisition aggregated $0.3 million for the year ended September 30, 2016. The operating results for NorMedix are included in the Medical Device segment.
The purchase price of NorMedix consisted of the following (in thousands):
|
Cash paid |
|
$ |
6,905 |
|
|
Contingent consideration |
|
|
3,520 |
|
|
Total purchase price |
|
|
10,425 |
|
|
Less cash and cash equivalents acquired |
|
|
(17 |
) |
|
Total purchase price, net of cash acquired |
|
$ |
10,408 |
|
|
|
|
|
|
|
The purchase accounting allocation of assets acquired and liabilities assumed was finalized during the fourth quarter of fiscal 2016. During the measurement period, which ended September 30, 2016, certain insignificant adjustments were made from amounts previously reported to finalize NorMedix’s preliminary fair value estimates related primarily to working capital, intangible assets, goodwill, certain property value, contingent liabilities and the related deferred tax impacts.
The following table summarizes the allocation of the purchase price to the fair values assigned to the assets acquired and the liabilities assumed at the date of the NorMedix acquisition:
F-19
|
|
Fair Value (Dollars in thousands) |
|
Estimated Useful Life (In years) |
||
|
Net current assets |
|
$ |
113 |
|
N/A |
|
Property and equipment |
|
|
60 |
|
N/A |
|
Developed technology |
|
|
6,850 |
|
10.0-14.0 |
|
Customer relationships |
|
|
900 |
|
4.0 |
|
Deferred tax asset |
|
|
690 |
|
N/A |
|
Other noncurrent asset |
|
|
13 |
|
N/A |
|
Accounts payable |
|
|
(187 |
) |
N/A |
|
Deferred tax liabilities |
|
|
(2,483 |
) |
N/A |
|
Net assets acquired |
|
|
5,956 |
|
|
|
Goodwill |
|
|
4,452 |
|
N/A |
|
Total purchase price, net of cash acquired |
|
$ |
10,408 |
|
|
|
|
|
|
|
|
|
The NorMedix goodwill is a result of acquiring and retaining the NorMedix existing workforce and expected synergies from integrating their business into the Medical Device segment. The goodwill is not deductible for tax purposes.
The Company has realized $4.1 million of revenue and a loss of $3.1 million from the Creagh Medical and NorMedix operations since they were acquired, which are reflected in the Company’s consolidated statement of income for the year ended September 30, 2016.
Unaudited Pro Forma Results
The following unaudited pro forma financial information presents the combined results of operation of the Company as if the acquisitions of Creagh Medical and NorMedix had occurred as of October 1, 2014.
The fiscal 2016 unaudited pro forma financial information includes adjustments for additional amortization expense on identifiable intangible assets of $2.8 million and contingent consideration accretion expense of $1.8 million, and to eliminate non-recurring, transactional professional fees of $3.2 million, and the related tax effect impact of $0.2 million.
The fiscal 2015 unaudited pro forma financial information includes adjustments for additional amortization expense on identifiable intangible assets of $3.2 million and contingent consideration accretion expense of $2.1 million and tax effect impact of $0.5 million.
The tax impact of the adjustments in all periods reflects no tax benefit from either the contingent consideration accretion or a significant portion of the transaction related costs in fiscal 2016 as they are not deductible for tax purposes. Further, Creagh Medical amortization expense does not reflect an Irish tax benefit as the Company acquired a net operating loss carryforward as of the acquisition date that was offset in the aggregate by deferred tax liabilities and valuation allowance. Therefore, the amortization of Creagh Medical intangible assets results in an increase in deferred tax liabilities with a corresponding increase to a deferred tax valuation allowance. NorMedix amortization expense reflects a tax benefit based on the Company’s incremental U.S. tax rate.
The unaudited pro forma financial information is not necessarily indicative of what the Company’s consolidated results of operations actually would have been had the acquisition occurred at the beginning of each year. Additionally, the unaudited pro forma financial information does not attempt to project the future results of operations of the combined company.
|
|
|
Year Ended |
|
|||||
|
|
|
September 30, |
|
|||||
|
|
|
2016 |
|
|
2015 |
|
||
|
(In thousands, except per share data) |
(Unaudited) |
|
||||||
|
Revenue |
|
$ |
72,416 |
|
|
$ |
65,432 |
|
|
Net income |
|
$ |
12,315 |
|
|
$ |
6,583 |
|
|
|
|
|
|
|
|
|
|
|
|
Per share amounts: |
|
|
|
|
|
|
|
|
|
Basic net income per share |
|
$ |
0.95 |
|
|
$ |
0.51 |
|
|
Diluted net income per share |
|
$ |
0.93 |
|
|
$ |
0.50 |
|
F-20
4. Fair Value Measurements
The accounting guidance on fair value measurements defines fair value, establishes a framework for measuring fair value under U.S. GAAP, and expands disclosures about fair value measurements. The guidance is applicable for all financial assets and financial liabilities and for all nonfinancial assets and nonfinancial liabilities recognized or disclosed at fair value in the consolidated financial statements on a recurring basis. Fair value is defined as the exchange price that would be received from selling an asset or paid to transfer a liability (an exit price) in an orderly transaction between market participants at the measurement date. When determining the fair value measurements for assets and liabilities required or permitted to be recorded at fair value, the Company considers the principal or most advantageous market in which it would transact and also considers assumptions that market participants would use when pricing the asset or liability, such as inherent risk, transfer restrictions and risk of nonperformance.
Fair Value Hierarchy
Accounting guidance on fair value measurements requires that assets and liabilities carried at fair value be classified and disclosed in one of the following three categories:
Level 1 — Quoted (unadjusted) prices in active markets for identical assets or liabilities.
The Company did not have any Level 1 assets as of September 30, 2016 or 2015.
Level 2 — Observable inputs other than quoted prices included in Level 1, such as quoted prices for similar assets or liabilities in active markets; quoted prices for identical or similar assets or liabilities in markets that are not active; or other inputs that are observable or can be corroborated by observable market data for substantially the full term of the asset or liability.
The Company’s Level 2 assets as of September 30, 2016 and September 30, 2015 consisted of money market funds, commercial paper instruments and corporate debt securities. Fair market values for these assets are based on quoted vendor prices and broker pricing where all significant inputs are observable. To ensure the accuracy of quoted vendor prices and broker pricing, the Company performs regular reviews of investment returns to industry benchmarks and sample tests of individual securities to validate quoted vendor prices with other available market data.
Level 3 — Unobservable inputs to the valuation methodology that are supported by little or no market activity and that are significant to the measurement of the fair value of the assets or liabilities. Level 3 assets and liabilities include those whose fair value measurements are determined using pricing models, discounted cash flow methodologies or similar valuation techniques, as well as significant management judgment or estimation.
Included in Level 3 liabilities as of September 30, 2016 is a $14.5 million contingent consideration liability, of which $13.6 million is noncurrent, related to achievement of revenue and value-creating milestones in future periods. There were no Level 3 assets as of September 30, 2016 or 2015.
In valuing assets and liabilities, the Company is required to maximize the use of quoted market prices and minimize the use of unobservable inputs. The Company did not significantly change its valuation techniques from prior periods. The carrying value of cash, accounts receivable, accounts payable and accrued liabilities approximates fair value as of September 30, 2016 and 2015 due to the short maturity nature of these instruments.
F-21
Assets and Liabilities Measured at Fair Value on a Recurring Basis
In instances where the inputs used to measure fair value fall into different levels of the fair value hierarchy, the fair value measurement has been determined based on the lowest level input that is significant to the fair value measurement in its entirety. The Company’s assessment of the significance of a particular item to the fair value measurement in its entirety requires judgment, including the consideration of inputs specific to the asset or liability.
The following table presents information about the Company’s assets and liabilities measured at fair value on a recurring basis as of September 30, 2016 (in thousands):
|
|
|
Quoted Prices in Active Markets for Identical Instruments (Level 1) |
|
|
Significant Other Observable Inputs (Level 2) |
|
|
Significant Unobservable Inputs (Level 3) |
|
|
Total Fair Value as of September 30, 2016 |
|
||||
|
Assets |
|
|
|
|
|
|
|
|
|
|
|
|
|
|
|
|
|
Cash equivalents |
|
$ |
— |
|
|
$ |
22,160 |
|
|
$ |
— |
|
|
$ |
22,160 |
|
|
Available-for-sale securities |
|
|
— |
|
|
|
21,954 |
|
|
|
|
|
|
$ |
21,954 |
|
|
Total assets |
|
$ |
— |
|
|
$ |
44,114 |
|
|
$ |
— |
|
|
$ |
44,114 |
|
|
|
|
|
|
|
|
|
|
|
|
|
|
|
|
|
|
|
|
Liabilities |
|
|
|
|
|
|
|
|
|
|
|
|
|
|
|
|
|
Contingent consideration |
|
$ |
— |
|
|
$ |
— |
|
|
$ |
(14,517 |
) |
|
$ |
(14,517 |
) |
|
Total liabilities |
|
$ |
— |
|
|
$ |
— |
|
|
$ |
(14,517 |
) |
|
$ |
(14,517 |
) |
|
|
|
|
|
|
|
|
|
|
|
|
|
|
|
|
|
|
The following table presents information about the Company’s assets and liabilities measured at fair value on a recurring basis as of September 30, 2015 (in thousands):
|
|
|
Quoted Prices in Active Markets for Identical Instruments (Level 1) |
|
|
Significant Other Observable Inputs (Level 2) |
|
|
Significant Unobservable Inputs (Level 3) |
|
|
Total Fair Value as of September 30, 2015 |
|
||||
|
Assets: |
|
|
|
|
|
|
|
|
|
|
|
|
|
|
|
|
|
Cash equivalents |
|
$ |
— |
|
|
$ |
53,591 |
|
|
$ |
— |
|
|
$ |
53,591 |
|
|
Total assets measured at fair value |
|
$ |
— |
|
|
$ |
53,591 |
|
|
$ |
— |
|
|
$ |
53,591 |
|
|
|
|
|
|
|
|
|
|
|
|
|
|
|
|
|
|
|
Included in Level 3 fair value measurements as of September 30, 2016 is a $14.5 million contingent consideration liability related to achievement of revenue and value-creating milestones associated with the Creagh Medical and NorMedix acquisitions. The following table summarizes the changes in the contingent consideration liability for the year ended September 30, 2016:
|
(Dollars in thousands) |
|
|
|
|
|
Contingent consideration liability at September 30, 2015 |
|
$ |
— |
|
|
Additions |
|
|
12,584 |
|
|
Fair value adjustments |
|
|
70 |
|
|
Settlements |
|
|
— |
|
|
Interest accretion |
|
|
1,422 |
|
|
Foreign currency translation |
|
|
441 |
|
|
Contingent consideration liability at September 30, 2016 |
|
$ |
14,517 |
|
There were no transfers of assets or liabilities to or from amounts measured using Level 3 fair value measurements during fiscal 2016 or 2015.
F-22
The valuation techniques used to measure the fair value of assets are as follows:
Cash equivalents — These assets are classified as Level 2 and are carried at historical cost which is a reasonable estimate of fair value because of the relatively short time between origination of the instrument and its expected realization.
Available-for-sale securities — These assets are classified as Level 2 and include commercial paper instruments and corporate bonds. These securities are valued based on quoted vendor prices in active markets underlying the securities.
Contingent consideration — The contingent consideration liabilities were determined based on discounted cash flow analyses that included revenue estimates, probability of strategic milestone achievement and a discount rate, which are considered significant unobservable inputs as of the acquisition dates and September 30, 2016. For the revenue-based milestones, the Company discounted forecasted revenue by 14.1% to 22.8%, which represents the Company’s weighted average cost of capital for each transaction, adjusted for the short-term nature of the cash flows. The resulting present value of revenue was used as an input into an option pricing approach, which also considered the Company’s risk of non-payment of the revenue-based milestones. Non-revenue milestones were projected to have a 25% to 100% probability of achievement and related payments were discounted using the Company’s estimated cost of debt, or 5.6% to 6.7%. To the extent that actual results differ from these estimates, the fair value of the contingent consideration liabilities could change significantly. Included in the consolidated statement of income for the year ended September 30, 2016 is $1.5 million of expense related to the accretion of the contingent consideration. The €12 million (approximately $12.8 million as of September 30, 2016) contingent consideration related to the Creagh Medical acquisition is denominated in Euros and is not hedged. The Company recorded a $0.4 million foreign currency loss in fiscal 2016 related to this contingent consideration as this obligation was marked to year-end exchange rates.
Assets and Liabilities Measured at Fair Value on a Non-Recurring Basis
The Company’s investments in non-marketable securities of private companies are accounted for using the cost method as the Company does not exert significant influence over the investees’ operating or financial activities. These investments are measured at fair value on a non-recurring basis when they are deemed to be other-than-temporarily impaired. In determining whether a decline in value of non-marketable equity investments in private companies has occurred and is other-than-temporary, an assessment is made by considering available evidence, including the general market conditions in the investee’s industry, the investee’s product development status and subsequent rounds of financing and the related valuation and/or the Company’s participation in such financings. The Company also assesses the investee’s ability to meet business milestones and the financial condition and near-term prospects of the individual investee, including the rate at which the investee is using its cash and the investee’s need for possible additional funding at a potentially lower valuation. The valuation methodology for determining the decline in value of non-marketable equity securities is based on inputs that require management judgment and are Level 3 inputs.
In the fourth quarter of fiscal 2014, the Company recognized an other-than-temporary impairment loss of $1.2 million based on capital funding initiatives and current operating conditions of ThermopeutiX. In the fourth quarter of fiscal 2015, the Company recognized an other-than-temporary impairment loss of $1.5 million on its investment in CeloNova. These impairment charges were based on Level 3 inputs further discussed in Note 2 to the consolidated financial statements. No other-than-temporary impairment losses were recognized during fiscal 2016.
5. Stockholders’ Equity
Repurchase of Common Stock
Shares are repurchased from time to time to support the Company’s stock-based compensation programs and to return capital to stockholders. The Company accounts for repurchases of common stock using the par value method.
As of September 30, 2013, $11.5 million remained from Board authorized repurchase authorization. During fiscal 2014, the Company repurchased an aggregate of 485,777 shares of common stock for a total of $11.5 million under this authorization at an average price of $23.77 per share.
On November 5, 2014, the Company’s Board of Directors authorized it to repurchase up to $30.0 million of the Company’s outstanding common stock in open-market purchases, privately negotiated transactions, block trades, accelerated share repurchase
F-23
transactions, tender offers or by any combination of such methods. The authorization has no fixed expiration date. As part of the accelerated share repurchase (“ASR”) program discussed below, the Company repurchased 758,143 shares of common stock on November 11, 2014 and 89,721 of common stock on July 8, 2015, the date that the ASR program was completed. As adjusted for the final ASR program settlement, $10.0 million remains available for future repurchases under the November 5, 2014 authorization.
On November 11, 2014, the Company entered into an ASR program with Wells Fargo Bank, National Association. In connection with this agreement, the Company made a $20.0 million payment to the bank and immediately received an initial delivery of 758,143 shares of its common stock with a fair value of $16.0 million as of the purchase date. Effective as of the date of the initial share purchase, the transaction was accounted for as a share retirement, resulting in a reduction of common stock of less than $0.1 million, additional paid-in capital of $2.5 million and retained earnings of $13.5 million. The remaining $4.0 million of the Company’s payment was also reported as a reduction in retained earnings. The specific number of shares that the Company ultimately purchased under the ASR agreement was based on the volume weighted average price of the Company’s common stock during the purchase period, less an agreed upon discount. In the aggregate the Company purchased 847,864 shares under the ASR program for an average price of $23.59 per share. Based on the facts associated with the agreement, the forward contract was indexed to the Company’s common stock and met the U.S. GAAP requirements to be classified as permanent equity as of July 8, 2015, the date the ASR was completed.
On November 6, 2015, the Company’s Board of Directors authorized the repurchase of up to $20.0 million of the Company’s outstanding common stock in open-market purchases, privately negotiated transactions, block trades, accelerated share repurchase transactions, tender offers or by any combination of such methods. With this authorization, the Company may currently repurchase up to $30.0 million of its outstanding stock. The authorization has no fixed expiration date.
6. Stock-Based Compensation Plans
The Company has stock-based compensation plans under which it grants stock options, restricted stock awards, performance share awards, restricted stock units and deferred stock units. Accounting guidance requires all share-based payments to be recognized as an expense, based on their fair values, over the requisite service period. The Company’s stock-based compensation expenses for the years ended September 30 were allocated to the following expense categories (in thousands):
|
|
|
2016 |
|
|
2015 |
|
|
2014 |
|
|||
|
Product costs |
|
$ |
22 |
|
|
$ |
24 |
|
|
$ |
16 |
|
|
Research and development |
|
|
324 |
|
|
|
226 |
|
|
|
175 |
|
|
Selling, general and administrative |
|
|
3,498 |
|
|
|
2,131 |
|
|
|
3,146 |
|
|
Total stock-based compensation expense |
|
$ |
3,844 |
|
|
$ |
2,381 |
|
|
$ |
3,337 |
|
As of September 30, 2016, approximately $3.8 million of total unrecognized compensation costs related to non-vested awards is expected to be recognized over a weighted average period of approximately 2.1 years. Such costs include $1.7 million based on payout levels associated with performance share awards that are currently anticipated to be fully expensed because the performance conditions are expected to be met above the minimum levels for each award period.
Under the amended 2009 Equity Incentive Plan (“2009 Plan”), the Company is authorized to issue up to 2,000,000, plus the number of shares that have not yet been awarded under the 2003 Equity Incentive Plan, or were awarded and subsequently returned to the pool of available shares under the 2003 Equity Incentive Plan pursuant to its terms. As of September 30, 2016, there were 1,159,754 shares available for future equity awards, including stock options, restricted stock awards, performance share awards, and restricted stock and deferred stock units, under the 2009 Plan.
F-24
The Company uses the Black-Scholes option pricing model to determine the weighted average grant date fair value of stock options. Weighted average per share fair values of stock options granted during fiscal 2016, 2015 and 2014 were $6.95, $7.26 and $8.72, respectively. The assumptions used as inputs in the model for the years ended September 30 were as follows:
|
|
|
2016 |
|
|
2015 |
|
|
2014 |
|
|||
|
Risk-free interest rates |
|
|
1.89 |
% |
|
|
1.43 |
% |
|
|
1.19 |
% |
|
Expected life |
|
4.6 years |
|
|
4.5 years |
|
|
4.6 years |
|
|||
|
Expected volatility |
|
|
37 |
% |
|
|
43 |
% |
|
|
45 |
% |
|
Dividend yield |
|
|
0 |
% |
|
|
0 |
% |
|
|
0 |
% |
The risk-free interest rate assumption was based on the U.S. Treasury’s rates for U.S. Treasury zero-coupon bonds with maturities similar to those of the expected term of the award. The expected life of options granted is determined based on the Company’s experience. Expected volatility is based on the Company’s stock price movement over a period approximating the expected term. Based on management’s judgment, dividend rates are expected to be 0.0% for the expected life of the options. The Company also estimates forfeitures of options granted, which are based on historical experience.
Non-qualified stock options are granted at fair market value on the grant date. Non-qualified stock options expire in seven to ten years or upon termination of employment or service as a Board member. With respect to members of the Board, non-qualified stock options generally become exercisable on a pro-rata basis over the one-year period following the date of grant. With respect to employees, non-qualified stock options generally become exercisable with respect to 25% of the shares on each of the first four anniversaries following the grant date. The stock-based compensation table above includes stock option expenses recognized related to these awards, which totaled $1.2 million, $1.2 million and $2.3 million during fiscal 2016, 2015 and 2014, respectively.
The Company modified non-qualified stock option awards granted to Board members in February 2014, which resulted in acceleration of the stock option vesting period. The modification changed the vesting period to a pro-rata basis over a one-year period from a four-year period and resulted in an increase to stock option expense of $0.5 million in fiscal 2014.
As of September 30, 2016, the aggregate intrinsic value of the option shares outstanding and option shares exercisable was $7.9 million and $4.3 million, respectively. As of September 30, 2016, the average remaining contractual life of options outstanding and options exercisable was 4.1 and 2.9 years, respectively. The total pre-tax intrinsic value of options exercised during fiscal 2016 and 2015 was $5.1 million and $1.7 million, respectively. The intrinsic value represents the difference between the exercise price and the fair market value of the Company’s common stock on the last day of the respective fiscal year end.
The following table summarizes all stock options activity and stock options outstanding and exercisable under the stock option plans during fiscal 2016, 2015 and 2014:
|
|
|
Number of Shares |
|
|
Weighted Average Exercise Price |
|
||
|
Outstanding at September 30, 2013 |
|
|
1,368,984 |
|
|
$ |
20.13 |
|
|
Granted |
|
|
138,837 |
|
|
|
22.71 |
|
|
Exercised |
|
|
(190,434 |
) |
|
|
14.42 |
|
|
Forfeited and expired |
|
|
(106,768 |
) |
|
|
31.26 |
|
|
Outstanding at September 30, 2014 |
|
|
1,210,619 |
|
|
|
20.35 |
|
|
Granted |
|
|
164,401 |
|
|
|
21.24 |
|
|
Exercised |
|
|
(166,422 |
) |
|
|
14.54 |
|
|
Forfeited and expired |
|
|
(90,590 |
) |
|
|
35.35 |
|
|
Outstanding at September 30, 2015 |
|
|
1,118,008 |
|
|
|
20.10 |
|
|
Granted |
|
|
241,582 |
|
|
|
20.63 |
|
|
Exercised |
|
|
(437,850 |
) |
|
|
15.68 |
|
|
Forfeited and expired |
|
|
(94,415 |
) |
|
|
31.52 |
|
|
Outstanding at September 30, 2016 |
|
|
827,325 |
|
|
$ |
21.30 |
|
|
Exercisable at September 30, 2016 |
|
|
434,876 |
|
|
$ |
21.50 |
|
F-25
The Company has entered into restricted stock agreements with certain key employees, covering the issuance of common stock (“Restricted Stock”). Under accounting guidance, these shares are considered to be non-vested shares. The Restricted Stock is released to the key employees if they are employed by the Company at the end of the vesting period. Compensation has been recognized for the estimated fair value of the common shares and is being charged to income over the vesting term. The stock-based compensation table above includes Restricted Stock expenses recognized related to these awards, which totaled $0.3 million, $0.3 million and $0.2 million during fiscal 2016, 2015 and 2014, respectively.
The following table summarizes all restricted stock awards activity during fiscal 2016, 2015 and 2014:
|
|
|
Number of Shares |
|
|
Weighted Average Grant Price |
|
||
|
Balance at September 30, 2013 |
|
|
5,234 |
|
|
$ |
23.88 |
|
|
Granted |
|
|
22,155 |
|
|
|
22.67 |
|
|
Vested |
|
|
(7,991 |
) |
|
|
23.98 |
|
|
Forfeited |
|
|
(774 |
) |
|
|
22.58 |
|
|
Balance at September 30, 2014 |
|
|
18,624 |
|
|
|
22.45 |
|
|
Granted |
|
|
18,073 |
|
|
|
21.84 |
|
|
Vested |
|
|
(7,606 |
) |
|
|
22.28 |
|
|
Forfeited |
|
|
(1,316 |
) |
|
|
22.16 |
|
|
Balance at September 30, 2015 |
|
|
27,775 |
|
|
|
22.12 |
|
|
Granted |
|
|
20,108 |
|
|
|
20.14 |
|
|
Vested |
|
|
(12,311 |
) |
|
|
22.19 |
|
|
Forfeited |
|
|
(2,439 |
) |
|
|
21.17 |
|
|
Balance at September 30, 2016 |
|
|
33,133 |
|
|
$ |
20.96 |
|
Performance Share Awards
The Company has entered into performance share agreements with certain key employees, covering the issuance of common stock (“Performance Shares”). The Performance Shares vest upon the achievement of all or a portion of certain performance objectives, which must be achieved during the performance period. The Performance Shares are not issued and outstanding until the performance objectives are met. The Organization and Compensation Committee of the Board of Directors (the “Committee”) approves the performance objectives used for executive compensation programs, which objectives were cumulative earnings per share and cumulative revenue for the three-year performance periods for fiscal 2013 awards (2013 – 2015), and 2014 awards (2014 – 2016), and are cumulative earnings before interest, income taxes, depreciation and amortization (“EBITDA”) for fiscal 2015 awards (2015 – 2017) and fiscal 2016 awards (2016-2018). Assuming that the minimum performance level is attained, the number of shares that may actually vest will vary based on performance from 20% (minimum) to 200% (maximum) of the target number of shares. Shares will be issued to participants as soon as practicable following the end of the performance periods, subject to Committee approval and verification of results. The per-unit compensation cost related to the shares to be granted under each performance period is fixed on the grant date, which is the date the performance period begins. Compensation expense is recognized in each period based on management’s best estimate of the achievement level of the specified performance objectives for Performance Shares for each open performance period. In fiscal 2016, the Company recognized expense of $1.9 million related to probable achievement of performance objectives for three-year Performance Shares granted in fiscal 2016, 2015 and 2014. In fiscal 2015, the Company recognized expense of $0.5 million related to probable achievement of performance objectives for three-year Performance Shares granted in fiscal 2015, 2014 and 2013. In fiscal 2014, the Company recognized expense of $0.6 million related to probable achievement of performance objectives for three-year Performance Shares granted in fiscal 2014, 2013 and 2012. The stock-based compensation table above includes the Performance Shares expenses.
The fair values of the Performance Shares, at target, were $1.3 million, $0.9 million and $0.9 million for grants awarded in fiscal 2016, 2015 and 2014, respectively.
F-26
The aggregate number of shares that could be awarded to key employees if the minimum, target and maximum performance goals are met, based upon the fair value at the date of grant is as follows:
|
Performance Period |
|
Minimum Shares |
|
|
Target Shares |
|
|
Maximum Shares |
|
|||
|
Fiscal 2014 - 2016 |
|
|
7,861 |
|
|
|
39,303 |
|
|
|
78,606 |
|
|
Fiscal 2015 – 2017 |
|
|
8,440 |
|
|
|
42,199 |
|
|
|
84,398 |
|
|
Fiscal 2016 – 2018 |
|
|
13,268 |
|
|
|
66,338 |
|
|
|
132,676 |
|
The Fiscal 2014 – 2016 awards are expected to be finalized in December 2016 at an estimated 38,517 shares based on performance objective results. Based on the Company’s performance through September 30, 2016, it is estimated that approximately 37,220 shares may be earned for the Fiscal 2015 – 2017 performance period and that approximately 96,654 shares may be earned for the Fiscal 2016 – 2018 performance period.
1999 Employee Stock Purchase Plan
Under the amended 1999 Employee Stock Purchase Plan (“Stock Purchase Plan”), the Company is authorized to issue up to 600,000 shares of common stock. All full-time and part-time U.S. employees can choose to have up to 10% of their annual compensation withheld, with a limit of $25,000, to purchase the Company’s common stock at purchase prices defined within the provisions of the Stock Purchase Plan. As of September 30, 2016 and 2015, there were less than $0.1 million of employee contributions in accrued liabilities in the consolidated balance sheets. Stock compensation expense recognized related to the Stock Purchase Plan for the fiscal years ended September 30, 2016, 2015 and 2014 totaled $0.1 million or less for each year. The stock-based compensation table above includes the Stock Purchase Plan expenses.
Restricted Stock and Deferred Stock Units
The Company awarded 18,877 and 10,678 restricted stock units (“RSU”) in fiscal 2016 and 2015, respectively, under the 2009 Plan to non-employee directors and certain key employees in foreign jurisdictions with forfeitures of 1,609 and 3,068 RSUs in fiscal 2016 and 2015, respectively. The Company modified the RSU awards granted to Board members in February 2014, which resulted in acceleration of the RSU award vesting period. The modification changed the vesting period to a pro-rata basis over a one-year period from a three-year period and resulted in an increase to RSU award expense of $0.2 million in fiscal 2014. RSU awards are not considered issued or outstanding common stock of the Company until they vest. The estimated fair value of the RSU awards was calculated based on the closing market price of Surmodics’ common stock on the date of grant. Compensation expense has been recognized for the estimated fair value of the common shares and is being charged to income over the vesting term. The stock-based compensation table above includes RSU expenses recognized related to these awards, which totaled $0.2 million, $0.4 million and $0.1 million for fiscal 2016, 2015 and 2014, respectively.
Directors can also elect to receive their annual fees for services to the Board in deferred stock units (“DSUs”). Certain directors elected this option beginning on January 1, 2013. As of September 30, 2016 and 2015, outstanding DSUs totaled 21,077 and 17,005, respectively, with an estimated fair value of $0.6 million. These DSUs are fully vested. Stock-based compensation expense related to DSU awards, totaled $0.2 million, $0.1 million and $0.1 million in fiscal 2016, 2015 and 2014, respectively.
7. Revolving Credit Facility
On November 4, 2013, the Company entered into a three-year $20.0 million secured revolving credit facility. The Company’s obligations under the credit facility were secured by substantially all of its and its subsidiaries’ assets, other than intellectual property and real estate. There were no borrowings on the facility during fiscal 2016.
On November 2, 2016, the Company amended and restated the revolving credit facility. The new agreement increased the available principle to $30.0 million and extended the maturity of the previous facility by three-years. In addition, the agreement includes a $5.0 million multi-currency overdraft facility in Ireland. Borrowings under the credit facility, if any, will bear interest at a benchmark rate plus a margin ranging from 1.00% to 1.75% based on the Company’s leverage ratio, as defined in the loan agreement. A facility fee is payable quarterly on unused commitments at a rate of 0.15% per annum. The Company has the option to increase the credit facility increments of $5.0 million up to an additional $20.0 million, subject to approval of the lender. The Company’s obligations under the credit facility were secured by substantially all of its assets, other than intellectual property and real estate, as well as the majority of its equity interest in its subsidiaries.
F-27
In connection with the credit facility, the Company is required to maintain certain financial covenants related to a maximum leverage ratio and a minimum EBITDA amount and to comply with nonfinancial covenants. As of September 30, 2016, the Company has no debt outstanding and was in compliance with all financial covenants under the then-existing credit facility.
8. Income Taxes
Income taxes from continuing operations in the accompanying consolidated statements of income for the fiscal years ended September 30 are as follows (in thousands):
|
|
|
2016 |
|
|
2015 |
|
|
2014 |
|
|||
|
Current provision: |
|
|
|
|
|
|
|
|
|
|
|
|
|
Federal |
|
$ |
6,550 |
|
|
$ |
6,065 |
|
|
$ |
6,470 |
|
|
State and foreign |
|
|
152 |
|
|
|
136 |
|
|
|
147 |
|
|
Total current provision |
|
|
6,702 |
|
|
|
6,201 |
|
|
|
6,617 |
|
|
Deferred provision (benefit): |
|
|
|
|
|
|
|
|
|
|
|
|
|
Federal |
|
|
169 |
|
|
|
58 |
|
|
|
(347 |
) |
|
State and foreign |
|
|
92 |
|
|
|
35 |
|
|
|
(5 |
) |
|
Total deferred provision (benefit) |
|
|
261 |
|
|
|
93 |
|
|
|
(352 |
) |
|
Total provision |
|
$ |
6,963 |
|
|
$ |
6,294 |
|
|
$ |
6,265 |
|
The reconciliation of the difference between amounts calculated at the statutory U.S. federal tax rate of 35% for the fiscal years ended September 30 and the Company’s effective tax rate from continuing operations is as follows (in thousands):
|
|
|
2016 |
|
|
2015 |
|
|
2014 |
|
|||
|
Amount at statutory U.S. federal income tax rate |
|
$ |
5,932 |
|
|
$ |
6,385 |
|
|
$ |
6,465 |
|
|
Change because of the following items: |
|
|
|
|
|
|
|
|
|
|
|
|
|
State income taxes, net of federal benefit |
|
|
142 |
|
|
|
67 |
|
|
|
118 |
|
|
Stock-based compensation |
|
|
(607 |
) |
|
|
16 |
|
|
|
21 |
|
|
Valuation allowance change |
|
|
(2,500 |
) |
|
|
348 |
|
|
|
120 |
|
|
Tax reserve change |
|
|
258 |
|
|
|
34 |
|
|
|
(121 |
) |
|
Federal manufacturing deduction |
|
|
(280 |
) |
|
|
(268 |
) |
|
|
(235 |
) |
|
Federal research and development credit |
|
|
(571 |
) |
|
|
(74 |
) |
|
|
(67 |
) |
|
Gain on strategic investment and corporate subsidiary |
|
|
2,630 |
|
|
|
— |
|
|
|
— |
|
|
Foreign rate differential |
|
|
622 |
|
|
|
— |
|
|
|
— |
|
|
Acquisition-related transaction costs |
|
|
768 |
|
|
|
— |
|
|
|
— |
|
|
Contingent consideration accretion |
|
|
522 |
|
|
|
— |
|
|
|
— |
|
|
Other |
|
|
47 |
|
|
|
(214 |
) |
|
|
(36 |
) |
|
Income tax provision |
|
$ |
6,963 |
|
|
$ |
6,294 |
|
|
$ |
6,265 |
|
The federal research and development tax credit for fiscal 2016, 2015 and 2014 includes the benefit generated for the periods from October 1, 2015 to December 31, 2015, October 1, 2014 to December 31, 2014 and October 1, 2013 to December 31, 2013, respectively, prior to the expiration of the benefit in each period. During fiscal 2016, the Company monetized $7.5 million of capital losses realized in prior years by accelerating built-in gains in the Company’s IVD subsidiary. For tax purposes, this resulted in an increase in the Company’s tax basis in the IVD subsidiary and a $2.6 million reduction in both deferred tax assets and the valuation allowance as of September 30, 2016.
The Company recorded an income tax benefit from discontinued operations of $0.1 million in fiscal 2014 associated with the sale of discontinued operations assets completed in fiscal 2012.
As discussed in Note 2, the Company adopted new accounting guidance for stock-based compensation during the fourth quarter of fiscal 2016. Amendments related to accounting for excess tax benefits have been adopted prospectively, effective October 1, 2015, resulting in recognition of excess tax benefits against income tax expenses in the consolidated statement of income rather than additional paid-in capital of $0.6 million for the year ended September 30, 2016. During fiscal 2015 and 2014, excess tax benefits totaling $0.4 million and $0.2 million, respectively, were recorded in additional paid-in capital.
F-28
The components of deferred income taxes consisted of the following as of September 30 and result from differences in the recognition of transactions for income tax and financial reporting purposes (in thousands):
|
|
|
2016 |
|
|
2015 |
|
||
|
Depreciable assets |
|
$ |
(2,257 |
) |
|
$ |
1,618 |
|
|
Deferred revenue |
|
|
80 |
|
|
|
96 |
|
|
Accruals and reserves |
|
|
1,153 |
|
|
|
835 |
|
|
Stock-based compensation |
|
|
3,113 |
|
|
|
4,194 |
|
|
Impaired strategic investments |
|
|
2,701 |
|
|
|
4,186 |
|
|
Capital loss carryforward |
|
|
63 |
|
|
|
1,456 |
|
|
NOL carryforward |
|
|
3,324 |
|
|
|
— |
|
|
Federal and state R&D credit |
|
|
110 |
|
|
|
|
|
|
Other |
|
|
587 |
|
|
|
586 |
|
|
Valuation allowance |
|
|
(3,847 |
) |
|
|
(5,721 |
) |
|
Total deferred tax assets |
|
|
5,027 |
|
|
|
7,250 |
|
|
Less current deferred tax assets |
|
|
— |
|
|
|
(546 |
) |
|
Noncurrent deferred tax assets |
|
$ |
5,027 |
|
|
$ |
6,704 |
|
As of September 30, 2016 and 2015, the Company recorded a deferred tax asset valuation allowance of $3.9 million and $5.7 million, respectively. The valuation allowance is primarily related to other-than-temporary impairment losses on strategic investments, state R&D credit carryforwards, and net operating loss carryforwards of Creagh Medical.
Unrecognized tax benefits are the differences between a tax position taken, or expected to be taken in a tax return, and the benefit recognized for accounting purposes pursuant to accounting guidance. A reconciliation of the beginning and ending amount of unrecognized tax benefits, excluding interest and penalties, is as follows (in thousands):
|
|
|
2016 |
|
|
2015 |
|
|
2014 |
|
|||
|
Beginning of fiscal year |
|
$ |
1,248 |
|
|
$ |
1,216 |
|
|
$ |
1,300 |
|
|
Increases in tax positions for prior years |
|
|
77 |
|
|
|
50 |
|
|
|
43 |
|
|
Decreases in tax positions for prior years |
|
|
(21 |
) |
|
|
(10 |
) |
|
|
(1 |
) |
|
Increases in tax positions for current year |
|
|
365 |
|
|
|
146 |
|
|
|
149 |
|
|
Lapse of the statute of limitations |
|
|
(161 |
) |
|
|
(154 |
) |
|
|
(275 |
) |
|
End of fiscal year |
|
$ |
1,508 |
|
|
$ |
1,248 |
|
|
$ |
1,216 |
|
The total amount of unrecognized tax benefits excluding interest and penalties that, if recognized, would affect the effective tax rate as of September 30, 2016, 2015 and 2014, respectively, are $1.2 million, $0.9 million and $1.0 million. Currently, the Company does not expect the liability for unrecognized tax benefits to change significantly in the next 12 months and has classified the above balances on the consolidated balance sheets in other long-term liabilities. Interest and penalties related to unrecognized tax benefits are recorded in income tax expense. As of September 30, 2016, 2015 and 2014, a gross balance of $0.6 million, $0.6 million and $0.7 million, respectively, has been accrued related to the unrecognized tax benefits balance for interest and penalties.
The Company files income tax returns, including returns for its subsidiaries, in the U.S. federal jurisdiction and in various state jurisdictions as well as several non-U.S. jurisdictions. Uncertain tax positions are related to tax years that remain subject to examination. The Internal Revenue Service (“IRS”) completed an examination of the Company’s U.S. income tax return for fiscal 2012 in the fourth quarter of fiscal 2014 with a payment made associated with a timing adjustment. U.S. income tax returns for years prior to fiscal 2013 are no longer subject to examination by federal tax authorities. For tax returns for state and local jurisdictions, the Company is no longer subject to examination for tax years generally before fiscal 2006. For tax returns for non-U.S. jurisdictions, the Company is no longer subject to income tax examination for years prior to 2011. Additionally, the Company has been indemnified of liability for any taxes relating to Creagh Medical and NorMedix for periods prior to the respective acquisition dates, pursuant to the terms of the related share purchase agreements. As of September 30, 2016 and 2015 there were no undistributed earnings in foreign subsidiaries.
F-29
The Company has a 401(k) retirement and savings plan for the benefit of qualifying U.S. employees. The Company matches 50% of employee contributions on the first 6% of eligible compensation. Company contributions totaling $0.3 million, $0.3 million and $0.2 million have been expensed in the years ended September 30, 2016, 2015 and 2014, respectively.
10. Amounts Reclassified Out of Accumulated Other Comprehensive Income
Amounts reclassified out of Accumulated Other Comprehensive Income (“AOCI”) totaled $0.3 and $0.1 million on a pre-tax basis for the fiscal year ended September 30, 2015 and 2014, respectively. There were no amounts reclassified out of AOCI for fiscal 2016. The amounts reclassified out of AOCI for fiscal 2015 were associated with unrealized gains on available-for-sale securities that were realized on the sale of the securities and are presented in other income, net in the consolidated statements of income.
11. Commitments and Contingencies
Litigation. From time to time, the Company has been, and may become, involved in various legal actions involving its operations, products and technologies, including intellectual property and employment disputes. The outcomes of these legal actions are not within the Company’s complete control and may not be known for prolonged periods of time. In some actions, the claimants seek damages as well as other relief, including injunctions barring the sale of products that are the subject of the lawsuit, which if granted, could require significant expenditures or result in lost revenue. The Company records a liability in the consolidated financial statements for these actions when a loss is known or considered probable and the amount can be reasonably estimated. If the reasonable estimate of a known or probable loss is a range, and no amount within the range is a better estimate, the minimum amount of the range is accrued. If a loss is possible but not known or probable, and can be reasonably estimated, the estimated loss or range of loss is disclosed. In most cases, significant judgment is required to estimate the amount and timing of a loss to be recorded.
In the Company’s Quarterly Reports on Form 10-Q for the periods ended March 31, 2015, and June 30, 2015, it was disclosed a notice was received from a customer alleging an overpayment of approximately $5.7 million in royalties covering the period January 2009 through September 2014 (the “Claim”). On September 29, 2015, the Company entered into a settlement and release agreement resolving the Claim. Under the agreement, among other things, (a) the Company agreed to pay the customer $2.5 million to settle the Claim, (b) the customer agreed to pay the Company approximately $0.5 million for undisputed royalties that were unpaid and were not previously recognized, during fiscal 2015, and (c) the Company and the customer agreed to a mutual release relating to the Claim and certain other claims by the Company for royalties owed by the customer. In connection with the settlement, in the fourth quarter of fiscal 2015, the Company recognized revenue of approximately $0.5 million and recorded a charge of approximately $2.5 million.
InnoRx, Inc. In January 2005, the Company entered into a merger agreement whereby the Company acquired all of the assets of InnoRx, Inc. (“InnoRx”), an early stage company developing drug delivery devices and therapies for the ophthalmology market. The Company will be required to issue up to approximately 480,059 additional shares of its common stock to the stockholders of InnoRx upon the successful completion of the remaining development and commercial milestones involving InnoRx technology acquired in the transaction. The Company has not recorded any accrual for this contingency as of September 30, 2016 as the milestones have not been achieved and the probability of achievement is remote.
InnoCore Technologies BV. In March 2006, the Company entered into a license agreement whereby Surmodics obtained an exclusive license to a drug delivery coating for licensed products within the vascular field which included peripheral, coronary and neurovascular biodurable stent product. The license requires an annual minimum payment of 200,000 euros (equivalent to $224,000 using a euro to US $ exchange rate of 1.1222 as of September 30, 2016) until the last patent expires which is currently estimated to be September 2027. The total minimum future payments associated with this license are approximately $2.7 million. The license is currently utilized with one of Surmodics’ drug delivery customers.
PR Pharmaceuticals, Inc. In November 2008, SurModics Pharmaceuticals acquired certain contracts and assets of PR Pharma to enhance its portfolio of drug delivery technologies for the pharmaceutical and biotechnology industries. The Company agreed to indemnify Evonik, for a period of five years, for up to $2.5 million of contingent consideration obligations owed to the sellers of PR Pharma related to a future patent issuance milestone when it sold substantially all of the SurModics Pharmaceuticals assets to Evonik on November 17, 2011. In the fourth quarter of fiscal 2014, Surmodics submitted a bid of less than $0.1 million related to the Company’s indemnification obligations to Evonik related to a contingent consideration matter associated with the PR Pharma
F-30
intellectual property purchased by Evonik in the Pharma Sale. Surmodics was notified in October 2014 that the bid was accepted with a payment made at that time. The indemnification period expired on November 17, 2016 with no additional claims.
Operating Leases. The Company leases certain facilities under noncancelable operating lease agreements. Rent expense for the years ended September 30, 2016, 2015 and 2014 was $0.1 million for each period. Annual commitments pursuant to operating lease agreements are as follows (in thousands):
|
Year Ended September 30, |
|
|
|
|
|
2017 |
|
$ |
135 |
|
|
2018 |
|
|
114 |
|
|
2019 |
|
|
72 |
|
|
2020 |
|
|
74 |
|
|
2021 |
|
|
12 |
|
|
Thereafter |
|
|
— |
|
|
Total minimum lease payments |
|
$ |
407 |
|
12. Reportable Segment Information
The accounting standards for reporting information about operating segments define operating segments as components of an enterprise about which separate financial information is available that is evaluated regularly by the chief operating decision maker, who is the Company’s Chief Executive Officer, in deciding how to allocate resources and in assessing performance. For financial accounting and reporting purposes, the Company reports its results for the two reportable segments as follows: (1) the Medical Device unit, which is comprised of surface modification coating technologies to improve access, deliverability, and predictable deployment of medical devices; international cardiology and peripheral balloon design, development and manufacturing; as well as drug delivery coating technologies to provide site-specific drug delivery from the surface of a medical device, with end markets that include coronary, peripheral, neuro-vascular and urology, among others, and (2) the In Vitro Diagnostics unit, which consists of component products and technologies for diagnostic test kits and biomedical research applications, with products that include protein stabilization reagents, substrates, antigens and surface coatings. During fiscal 2016, the Company acquired Creagh Medical and NorMedix, which are included in the Medical Device segment.
The tables below present segment revenue, operating income from continuing operations and depreciation and amortization, for the years ended September 30, as follows (in thousands):
|
|
|
2016 |
|
|
2015 |
|
|
2014 |
|
|||
|
Revenue: |
|
|
|
|
|
|
|
|
|
|
|
|
|
Medical Device |
|
$ |
53,202 |
|
|
$ |
45,944 |
|
|
$ |
43,068 |
|
|
In Vitro Diagnostics |
|
|
18,164 |
|
|
|
15,954 |
|
|
|
14,371 |
|
|
Total revenue |
|
$ |
71,366 |
|
|
$ |
61,898 |
|
|
$ |
57,439 |
|
|
|
|
|
|
|
|
|
|
|
|
|
|
|
|
Operating income (loss): |
|
|
|
|
|
|
|
|
|
|
|
|
|
Medical Device |
|
$ |
16,975 |
|
|
$ |
21,192 |
|
|
$ |
22,636 |
|
|
In Vitro Diagnostics |
|
|
7,115 |
|
|
|
4,484 |
|
|
|
3,459 |
|
|
Total segment operating income |
|
|
24,090 |
|
|
|
25,676 |
|
|
|
26,095 |
|
|
Corporate |
|
|
(7,231 |
) |
|
|
(6,587 |
) |
|
|
(7,519 |
) |
|
Total operating income from continuing operations |
|
$ |
16,859 |
|
|
$ |
19,089 |
|
|
$ |
18,576 |
|
|
|
|
|
|
|
|
|
|
|
|
|
|
|
|
Depreciation and amortization: |
|
|
|
|
|
|
|
|
|
|
|
|
|
Medical Device |
|
$ |
3,261 |
|
|
$ |
1,138 |
|
|
$ |
1,136 |
|
|
In Vitro Diagnostics |
|
|
789 |
|
|
|
873 |
|
|
|
850 |
|
|
Corporate |
|
|
823 |
|
|
|
794 |
|
|
|
729 |
|
|
Total depreciation and amortization |
|
$ |
4,873 |
|
|
$ |
2,805 |
|
|
$ |
2,715 |
|
F-31
The Corporate category includes expenses that are not fully allocated to Medical Device and In Vitro Diagnostics segments. These Corporate costs are related to functions, such as executive management, corporate accounting, legal, human resources and Board of Directors. Corporate may also include expenses, such as litigation, which are not specific to a segment and thus not allocated to the operating segments.
Corporate segment results above for fiscal 2014 include increased stock option expense of $0.9 million related to a modification of equity awards granted to Board members.
Asset information by segment is not presented because the Company does not provide its chief operating decision maker assets by segment, as the data is not readily available.
Major Customers
Revenue from customers that equaled or exceeded 10% of total revenue was as follows for the years ended September 30:
|
|
|
2016 |
|
|
2015 |
|
|
2014 |
|
|||
|
Medtronic |
|
|
25 |
% |
|
|
26 |
% |
|
|
19 |
% |
The revenue from the customer listed is derived from two primary sources: licensing and product sales (primarily in the Medical Device segment). The percentage of revenue increased in fiscal 2015 as a result of Medtronic’s merger with Covidien PLC on January 26, 2015.
Geographic Revenue
Geographic revenue was as follows for the years ended September 30:
|
|
|
2016 |
|
|
2015 |
|
|
2014 |
|
|||
|
Domestic |
|
|
79 |
% |
|
|
77 |
% |
|
|
78 |
% |
|
Foreign |
|
|
21 |
% |
|
|
23 |
% |
|
|
22 |
% |
13. Quarterly Financial Data (Unaudited)
The following is a summary of the unaudited quarterly results for the years ended September 30, 2016 and 2015 (in thousands, except per share data).
|
|
|
First Quarter |
|
|
Second Quarter |
|
|
Third Quarter |
|
|
Fourth Quarter |
|
||||
|
Fiscal 2016 |
|
|
|
|
|
|
|
|
|
|
|
|
|
|
|
|
|
Total revenue |
|
$ |
16,541 |
|
|
$ |
16,699 |
|
|
$ |
19,972 |
|
|
$ |
18,154 |
|
|
Operating income |
|
|
3,939 |
|
|
|
2,240 |
|
|
|
6,597 |
|
|
|
4,083 |
|
|
Net income (1) |
|
|
2,653 |
|
|
|
821 |
|
|
|
3,934 |
|
|
|
2,577 |
|
|
Basic net income per share (2): |
|
|
0.20 |
|
|
|
0.06 |
|
|
|
0.31 |
|
|
|
0.20 |
|
|
Diluted net income per share (2): |
|
|
0.20 |
|
|
|
0.06 |
|
|
|
0.30 |
|
|
|
0.20 |
|
|
|
|
|
|
|
|
|
|
|
|
|
|
|
|
|
|
|
|
Fiscal 2015 |
|
|
|
|
|
|
|
|
|
|
|
|
|
|
|
|
|
Total revenue |
|
$ |
14,205 |
|
|
$ |
14,415 |
|
|
$ |
15,914 |
|
|
$ |
17,364 |
|
|
Operating income |
|
|
5,034 |
|
|
|
3,932 |
|
|
|
5,857 |
|
|
|
4,266 |
|
|
Net income |
|
|
3,614 |
|
|
|
3,051 |
|
|
|
3,924 |
|
|
|
1,358 |
|
|
Basic net income per share (2): |
|
|
0.27 |
|
|
|
0.24 |
|
|
|
0.30 |
|
|
|
0.10 |
|
|
Diluted net income per share (2): |
|
|
0.27 |
|
|
|
0.23 |
|
|
|
0.30 |
|
|
|
0.10 |
|
F-32
|
|
Additionally, basic and diluted net income per share for the first quarter were adjusted from $0.19 to $0.20 as a result of the adoption of the ASU. |
|
|
(2) |
The sum of the quarterly income per share amounts may not equal the annual income per share total because of changes in the weighted average number of shares outstanding that occurred during the year. |
In the first quarter of fiscal 2016, the Company recorded expense related to acquisition related costs, including due diligence and integration expenses of $2.5 million, related to the acquisitions of Creagh Medical and NorMedix (Note 3).
During the second quarter of fiscal 2016, the Company recorded an out-of-period adjustment of $1.1 million to correct a cumulative overstatement of royalty revenue, of which $1.0 million related to years prior to fiscal 2016. The overstatement was evaluated and concluded to not be material to fiscal 2016, or any prior interim or annual periods.
In the third quarter of fiscal 2016, the Company recorded a $2.9 million customer royalty catch-up payment related to periods prior to the third quarter fiscal 2016.
In the fourth quarter of fiscal 2016, the Company recorded a $0.5 million reduction of the income tax provision related to the adoption of ASU 2016-09 as discussed in Note 2.
In the fourth quarter of fiscal 2015, the Company recorded expense related to the settlement of a claim of $2.5 million, a $1.5 million impairment loss on a strategic investment and recognized $0.8 million in previously contingent royalties.
In the third quarter of fiscal 2015, the Company recorded a $0.6 million customer royalty catch-up payment related to periods prior to the third quarter fiscal 2015.
In the second quarter of fiscal 2015, the Company recorded a $0.5 million gain on a strategic investment in Intersect ENT shares.
F-33