Attached files
| file | filename |
|---|---|
| 8-K - FORM 8-K - Manitex International, Inc. | d293926d8k.htm |
| Exhibit 99.1
|
MANITEX INTERNATIONAL, INC.
(NASD A Q : M N T X )
Corporate Presentation December 2016
|
|
FO RWARD-LOOKIN G S TAT E M E N T
& N O N—G A A P M E A S U R E S
Safe Harbor Statement under the U.S. Private Securities Litigation Reform Act of 1995: This presentation contains statements that are forward-looking in nature which express the beliefs and expectations of management including statements regarding the Company’s expected results of operations or liquidity; statements concerning projections, predictions, expectations, estimates or forecasts as to our business, financial and operational results and future economic performance; and statements of management’s goals and objectives and other similar expressions concerning matters that are not historical facts. In some cases, you can identify forward-looking statements by terminology such as “anticipate,” “estimate,” “plan,” “project,” “continuing,” “ongoing,” “expect,” “we believe,” “we intend,” “may,” “will,” “should,” “could,” and similar expressions. Such statements are based on current plans, estimates and expectations and involve a number of known and unknown risks, uncertainties and other factors that could cause the Company’s future results, performance or achievements to differ significantly from the results, performance or achievements expressed or implied by such forward-looking statements. These factors and additional information are discussed in the Company’s filings with the Securities and Exchange Commission and statements in this presentation should be evaluated in light of these important factors. Although we believe that these statements are based upon reasonable assumptions, we cannot guarantee future results. Forward-looking statements speak only as of the date on which they are made, and the Company undertakes no obligation to update publicly or revise any forward-looking statement, whether as a result of new information, future developments or otherwise.
Non-GAAP Measures: Manitex International from time to time refers to various non-GAAP (generally accepted accounting principles) financial measures in this presentation. Manitex believes that this information is useful to understanding its operating results without the impact of special items. See Manitex’s Q3 2016 earnings release on the Investor Relations section of our website www.manitexinternational.com for a description and/or reconciliation of these measures.
NASDAQ : MNTX 2
PRODUCT O V E R V I E W
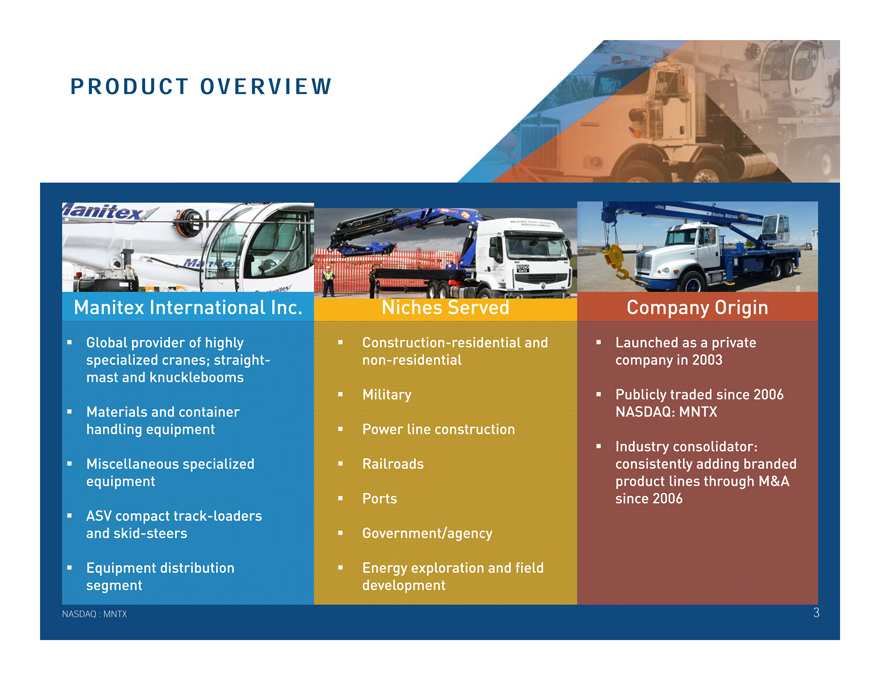
Manitex International Inc.
Global provider of highly specialized cranes; straight-mast and knucklebooms
Materials and container handling equipment
Miscellaneous specialized equipment
ASV compact track-loaders and skid-steers
Equipment distribution segment
NASDAQ : MNTX
Niches Served
Construction-residential and non-residential
Military
Power line construction? Railroads? Ports? Government/agency
Energy exploration and field development
Company Origin
Launched as a private company in 2003
Publicly traded since 2006 NASDAQ: MNTX
Industry consolidator: consistently adding branded product lines through M&A since 2006
3
|
|
COMPA N Y T I M E L I N E
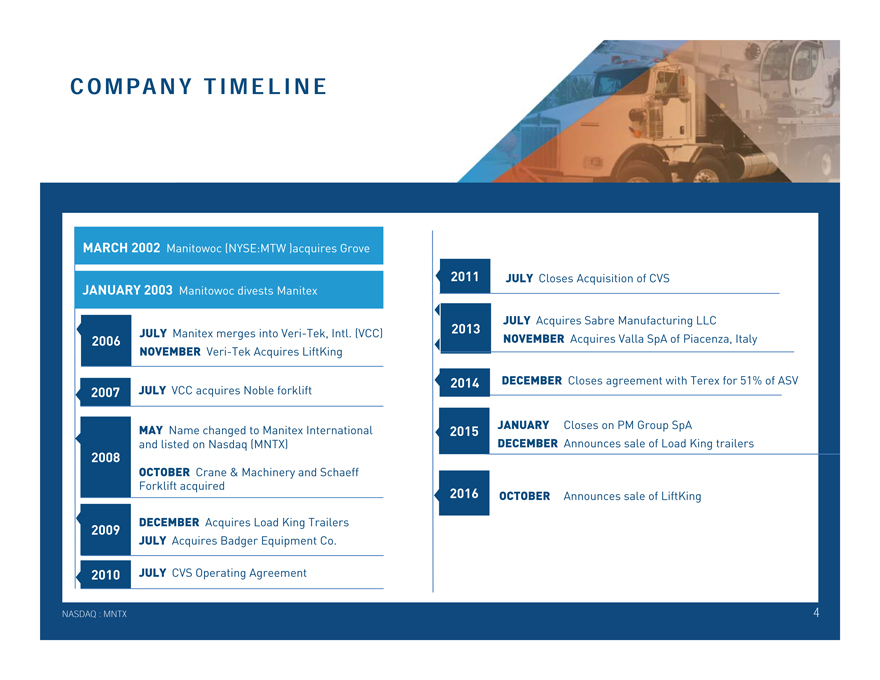
MARCH 2002 Manitowoc (NYSE:MTW )acquires Grove
JANUARY 2003 Manitowoc divests Manitex
JULY Manitex merges into Veri-Tek, Intl. (VCC)
2006
NOVEMBER Veri-Tek Acquires LiftKing
2007 JULY VCC acquires Noble forklift
MAY Name changed to Manitex International and listed on Nasdaq (MNTX)
2008
OCTOBER Crane & Machinery and Schaeff Forklift acquired
DECEMBER Acquires Load King Trailers
2009
JULY Acquires Badger Equipment Co.
2010 JULY CVS Operating Agreement
NASDAQ : MNTX
2011 JULY Closes Acquisition of CVS
2013 JULY Acquires Sabre Manufacturing LLC NOVEMBER Acquires Valla SpA of Piacenza, Italy
2014 DECEMBER Closes agreement with Terex for 51% of ASV
JANUARY Closes on PM Group SpA
2015
DECEMBER Announces sale of Load King trailers
2016 OCTOBER Announces sale of LiftKing
4
|
|
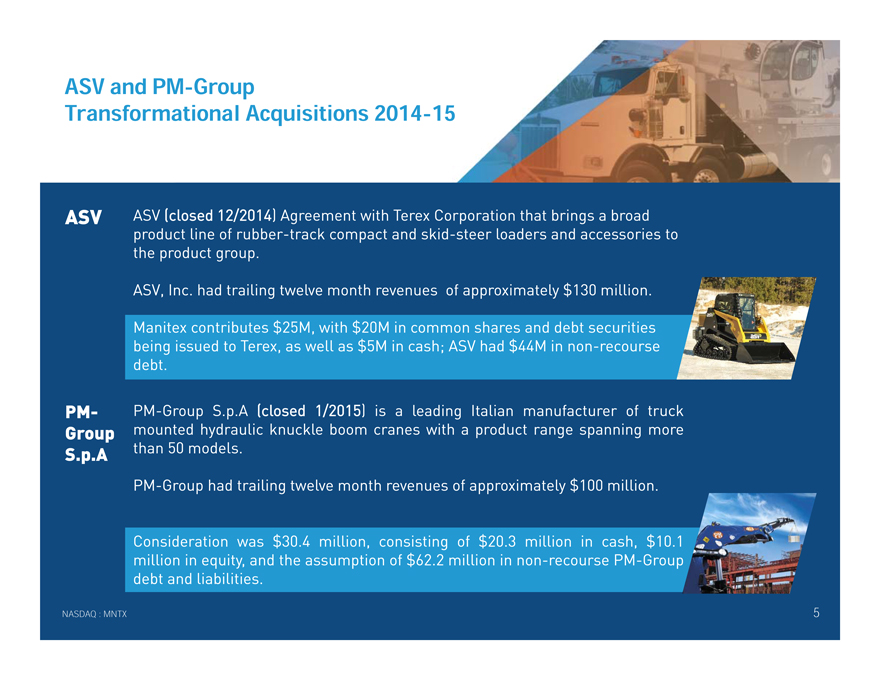
ASV and PM-Group
Transformational Acquisitions 2014-15
ASV ASV (closed 12/2014) Agreement with Terex Corporation that brings a broad product line of rubber-track compact and skid-steer loaders and accessories to the product group.
ASV, Inc. had trailing twelve month revenues of approximately $130 million.
Manitex contributes $25M, with $20M in common shares and debt securities being issued to Terex, as well as $5M in cash; ASV had $44M in non-recourse debt.
PM- PM-Group S.p.A (closed 1/2015) is a leading Italian manufacturer of truck Group mounted hydraulic knuckle boom cranes with a product range spanning more than 50 models.
S.p.A
PM-Group had trailing twelve month revenues of approximately $100 million.
Consideration was $30.4 million, consisting of $20.3 million in cash, $10.1 million in equity, and the assumption of $62.2 million in non-recourse PM-Group debt and liabilities.
NASDAQ : MNTX 5
|
|
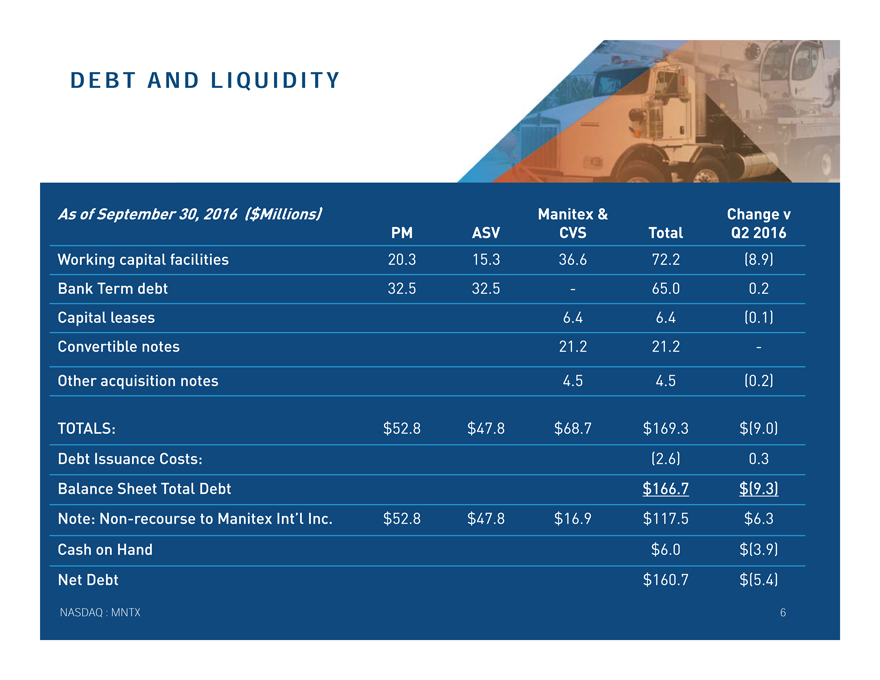
D E B T A N D L I Q U I D I T Y
As of September 30, 2016 ($Millions) Manitex &Change v
PM ASVCVSTotalQ2 2016
Working capital facilities 20.3 15.336.672.2(8.9)
Bank Term debt 32.5 32.5-65.00.2
Capital leases 6.46.4(0.1)
Convertible notes 21.221.2-
Other acquisition notes 4.54.5(0.2)
TOTALS: $52.8$47.8$68.7$169.3$(9.0)
Debt Issuance Costs: (2.6)0.3
Balance Sheet Total Debt $166.7$(9.3)
Note: Non-recourse to Manitex Int’l Inc. $52.8$47.8$16.9$117.5$6.3
Cash on Hand $6.0$(3.9)
Net Debt $160.7$(5.4)
NASDAQ : MNTX 6
|
|
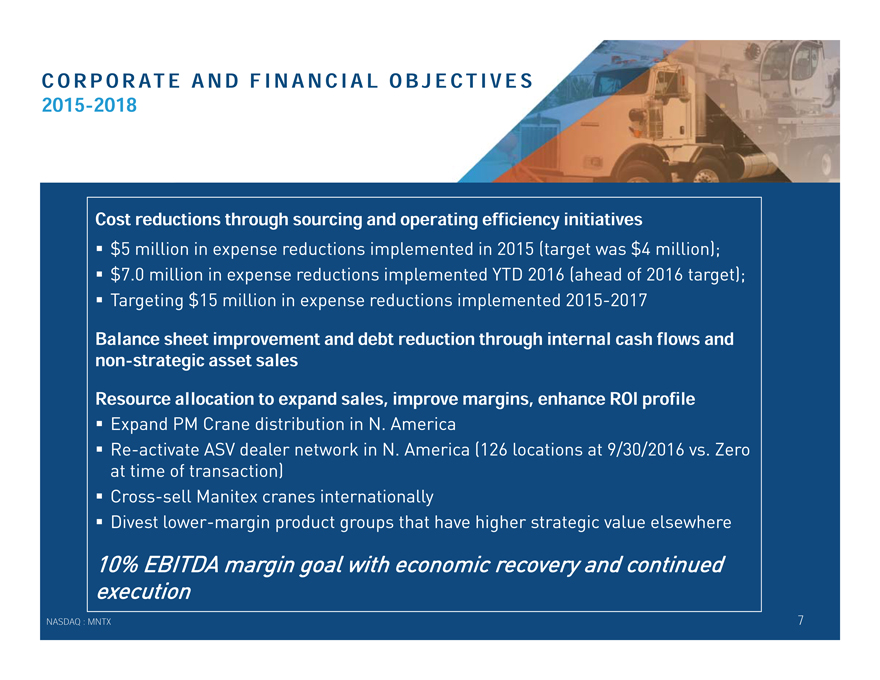
CORPORAT E A N D F I N A N C I A L O B J E C T I V E S 2015-2018
Cost reductions through sourcing and operating efficiency initiatives
$5 million in expense reductions implemented in 2015 (target was $4 million);
$7.0 million in expense reductions implemented YTD 2016 (ahead of 2016 target);
Targeting $15 million in expense reductions implemented 2015-2017
Balance sheet improvement and debt reduction through internal cash flows and
non-strategic asset sales
Resource allocation to expand sales, improve margins, enhance ROI profile
Expand PM Crane distribution in N. America
Re-activate ASV dealer network in N. America (126 locations at 9/30/2016 vs. Zero
at time of transaction)
Cross-sell Manitex cranes internationally
Divest lower-margin product groups that have higher strategic value elsewhere
10% EBITDA margin goal with economic recovery and continued
execution
NASDAQ : MNTX 7
|
|
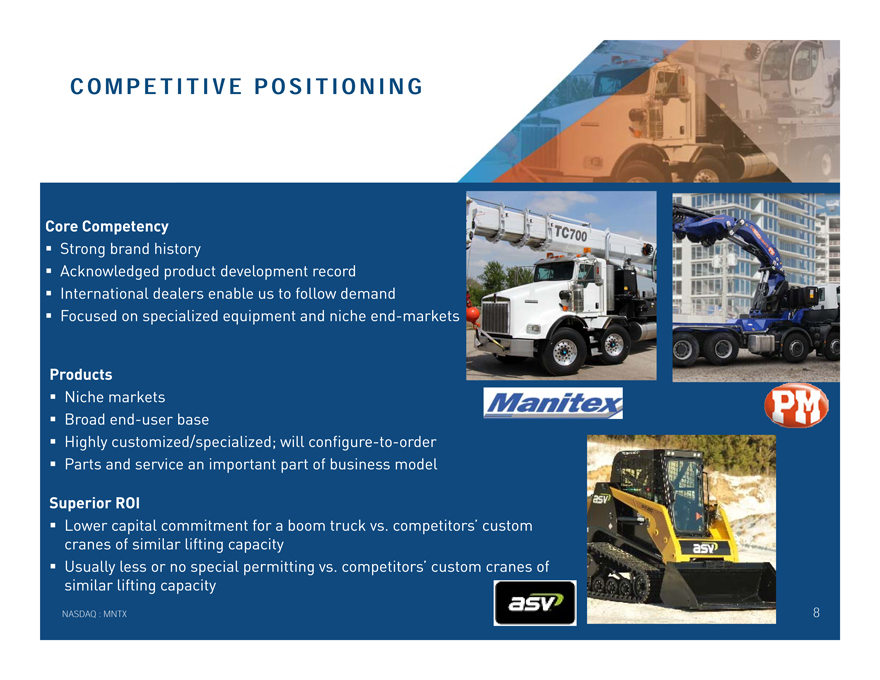
C O M P E T I T I V E P O S I T I O N I N G
Core Competency
Strong brand history
Acknowledged product development record International dealers enable us to follow demand
Focused on specialized equipment and niche end-markets
Products
Niche markets Broad end-user base
Highly customized/specialized; will configure-to-orde? Parts and service an important part of business model
Superior ROI
Lower capital commitment for a boom truck vs. competitors’ custom cranes of similar lifting capacity Usually less or no special permitting vs. competitors’ custom cranes of similar lifting capacity
NASDAQ : MNTX 8
|
|
L I F T I N G E Q U I P M E N T M A R K E T O V E R V I E W – S T R A I G H T M A S T
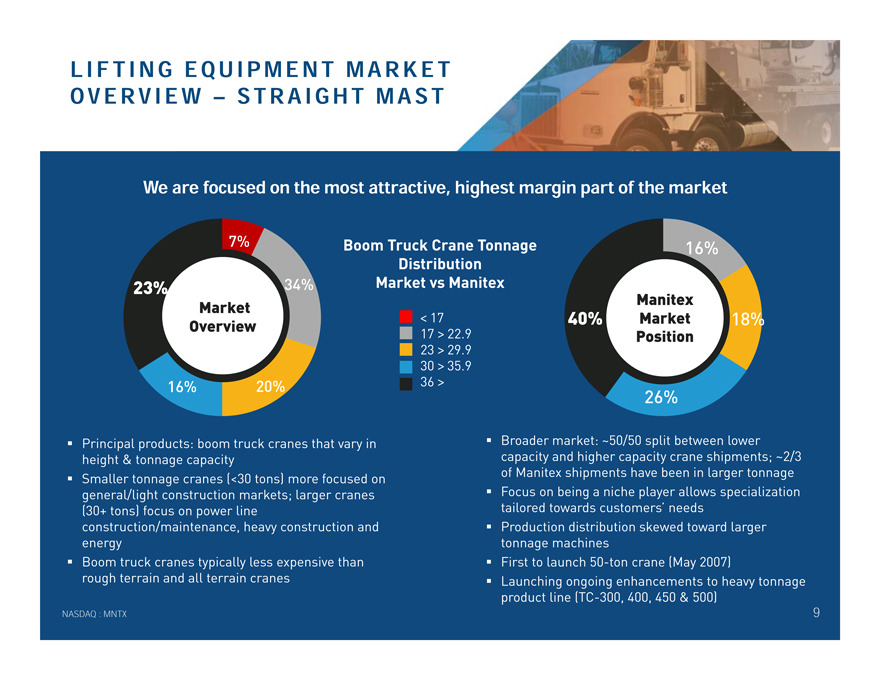
We are focused on the most attractive, highest margin part of the market
7% Boom Truck Crane Tonnage
16%
Distribution 23% 34% Market vs Manitex
Manitex Market
< 17 40% Market 18% Overview 17 .9
> 22 Position
23 > 29.9
30 > 35.9
16% 20% 36 >
26%
Principal products: boom truck cranes that vary in height & tonnage capacity Smaller tonnage cranes (<30 tons) more focused on general/light construction markets; larger cranes (30+ tons) focus on power line construction/maintenance, heavy construction and energy Boom truck cranes typically less expensive than rough terrain and all terrain cranes
NASDAQ : MNTX
Broader market: ~50/50 split between lower capacity and higher capacity crane shipments; ~2/3 of Manitex shipments have been in larger tonnage Focus on being a niche player allows specialization tailored towards customers’ needs Production distribution skewed toward larger tonnage machines First to launch 50-ton crane (May 2007) Launching ongoing enhancements to heavy tonnage product line (TC-300, 400, 450 & 500)
9
|
|
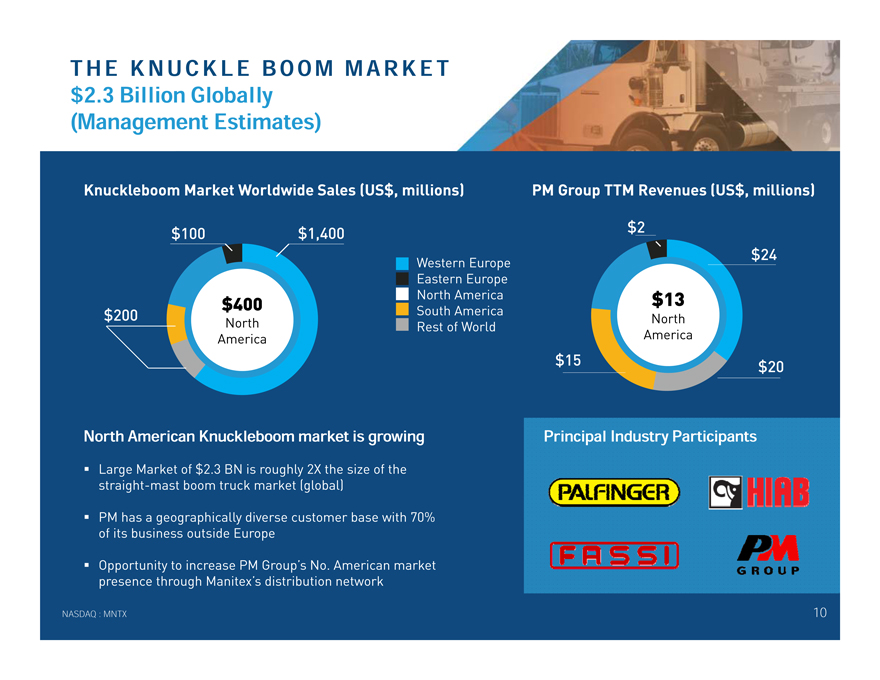
T H E K N U C K L E B O O M M A R K E T $2.3 Billion Globally (Management Estimates)
Knuckleboom Market Worldwide Sales (US$, millions)
$100 $1,400
Western Europe Eastern Europe North America $400 South America $200 North Rest of World America
PM Group TTM Revenues (US$, millions)
$2
$24
$13
North America $15 $20
North American Knuckleboom market is growing
Large Market of $2.3 BN is roughly 2X the size of the straight-mast boom truck market (global)
PM has a geographically diverse customer base with 70% of its business outside Europe
Opportunity to increase PM Group’s No. American market presence through Manitex’s distribution network
NASDAQ : MNTX
Principal Industry Participants
10
|
|
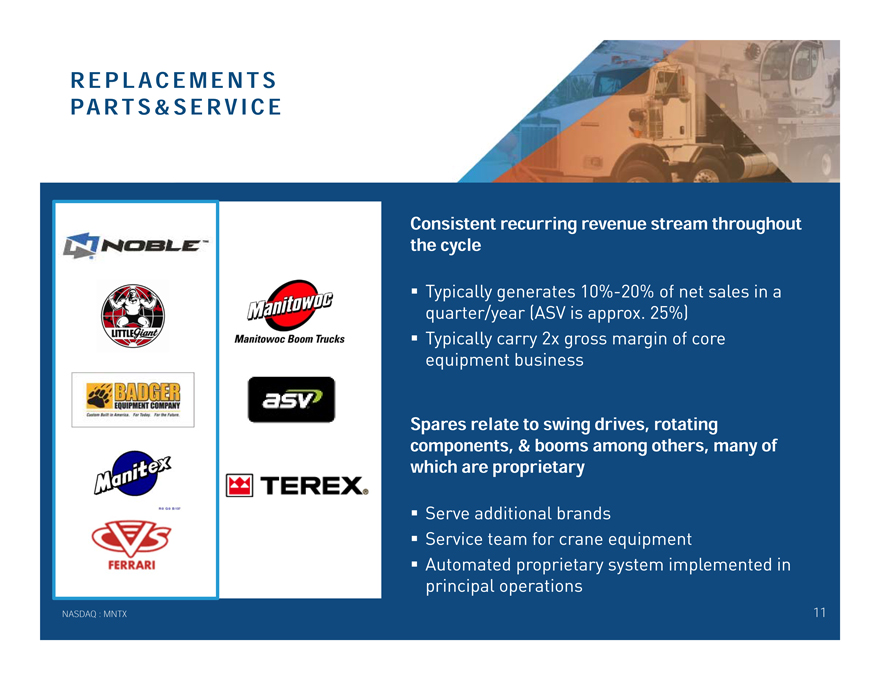
REPLA C E M E N T S PA R T S & S E R V I C E
Consistent recurring revenue stream throughout the cycle
Typically generates 10%-20% of net sales in a quarter/year (ASV is approx. 25%) Typically carry 2x gross margin of core equipment business
Spares relate to swing drives, rotating components, & booms among others, many of which are proprietary
Serve additional brands
Service team for crane equipment
Automated proprietary system implemented in principal operations
11
NASDAQ : MNTX
|
|
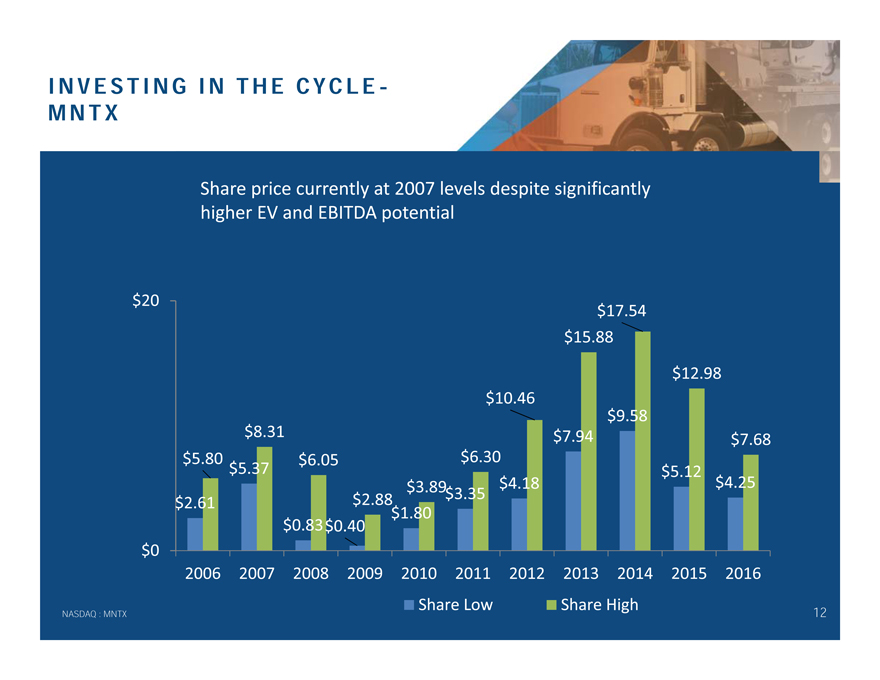
I N V E S T I N G I N T H E C Y C L E -M N T X
Share price currently at 2007 levels despite significantly higher EV and EBITDA potential
$20
$17.54
$15.88
$12.98
$10.46 $9.58 $8.31 $7.94 $7.68 $5.80 $6.05 $6.30 $5.37 $5.12 $3.89 $4.18 $4.25 $2.88 $3.35 $2.61 $1.80 $0.83$0.40 $0 2006 2007 2008 2009 2010 2011 2012 2013 2014 2015 2016
Share Low Share High
NASDAQ : MNTX 12
|
|
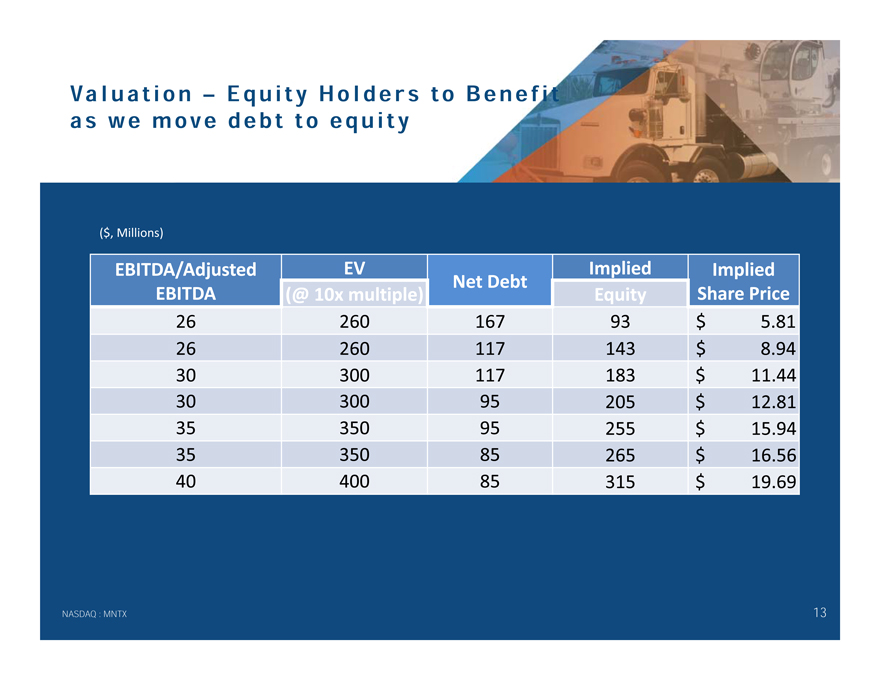
Va l u a t i o n – E q u i t y H o l d e r s t o B e n e f i t a s w e m o v e d e b t t o e q u i t y
($, Millions)
EBITDA/Adjusted EV Implied Implied Net Debt EBITDA (@ 10x multiple) Equity Share Price
26 260 167 93 $ 5.81
26 260 117 143 $ 8.94
30 300 117 183 $ 11.44
30 300 95 205 $ 12.81
35 350 95 255 $ 15.94
35 350 85 265 $ 16.56
40 400 85 315 $ 19.69
NASDAQ : MNTX 13
|
|
MANITEX INTERNATIONAL, INC.
F I N A N C I A L O V E R V I E W
December 2016
*Results may contain adjustments, please see reconciliation to GAAP on Slide 19 and other Manitex source disclosure and SEC filings.
|
|
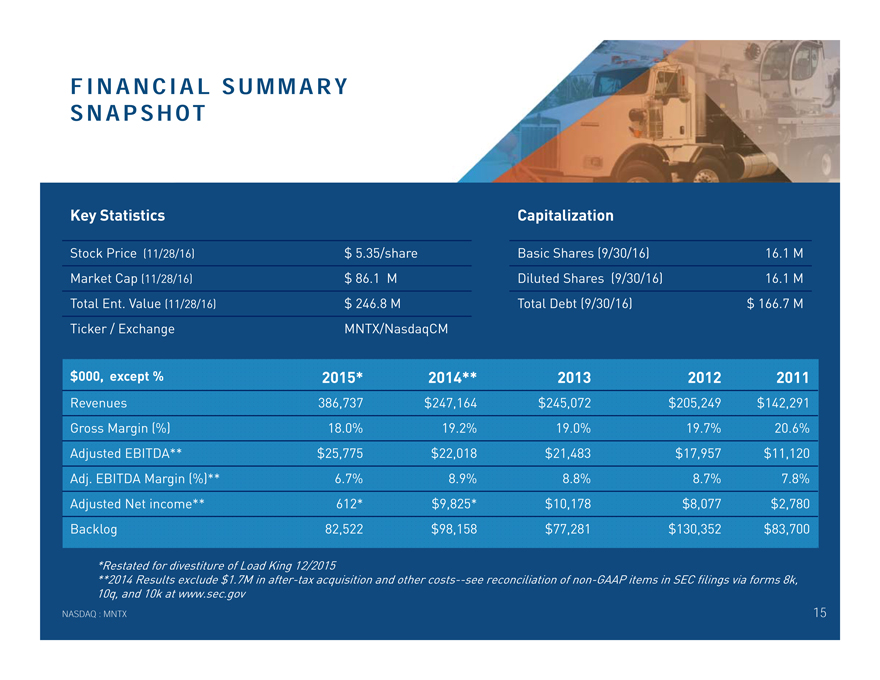
F I N A N C I A L S U M M A R Y S N A P S H OT
Key Statistics Capitalization
Stock Price (11/28/16) $ 5.35/share Basic Shares (9/30/16)16.1 M
Market Cap (11/28/16) $ 86.1 MDiluted Shares (9/30/16)16.1 M
Total Ent. Value (11/28/16) $ 246.8 M Total Debt (9/30/16)$ 166.7 M
Ticker / Exchange MNTX/NasdaqCM
$000, except % 2015* 2014**201320122011
Revenues 386,737 $247,164$245,072$205,249$142,291
Gross Margin (%) 18.0% 19.2%19.0%19.7%20.6%
Adjusted EBITDA** $25,775 $22,018$21,483$17,957$11,120
Adj. EBITDA Margin (%)** 6.7% 8.9%8.8%8.7%7.8%
Adjusted Net income** 612* $9,825*$10,178$8,077$2,780
Backlog 82,522 $98,158$77,281$130,352$83,700
*Restated for divestiture of Load King 12/2015
**2014 Results exclude $1.7M in after-tax acquisition and other costs—see reconciliation of non-GAAP items in SEC filings via forms 8k,
10q, and 10k at www.sec.gov
NASDAQ : MNTX 15
|
|
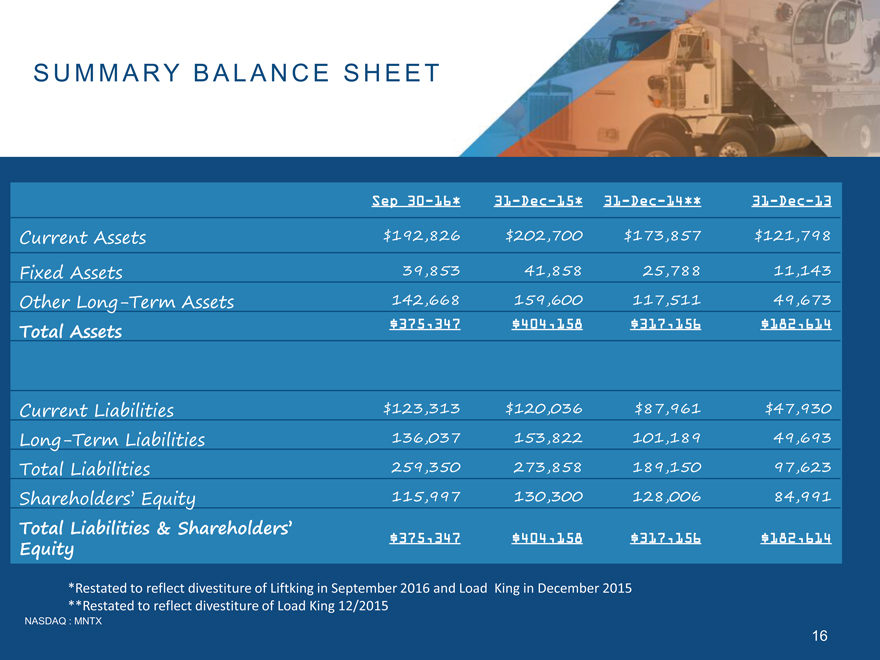
S U M M A R Y B A L A N C E S H E E T
Sep 30-16 31-Dec-15*31-Dec-14*31-Dec-13
Current Assets $192,826 $202,700$173,857$121,798
Fixed Assets 39,853 41,98525,78811,143
Other Long-Term Assets 142,668 159,473117,51149,673
Total Assets $375,347 $404,158$317,156$182,614
Current Liabilities $123,313 $120,036$87,961$47,930
Long-Term Liabilities 136,037 153,822101,18949,693
Total Liabilities 259,350 273,858189,15097,623
Shareholders’ Equity 115,997 130,300128,00684,991
Total Liabilities & Shareholders’ Equity $375,347 $404,158$317,156$182,614
*Restated to reflect divestiture of Load King 12/2015
NASDAQ : MNTX 16
**Restated to reflect divestiture of Load King 12/2015
$159,600 $41,858
|
|
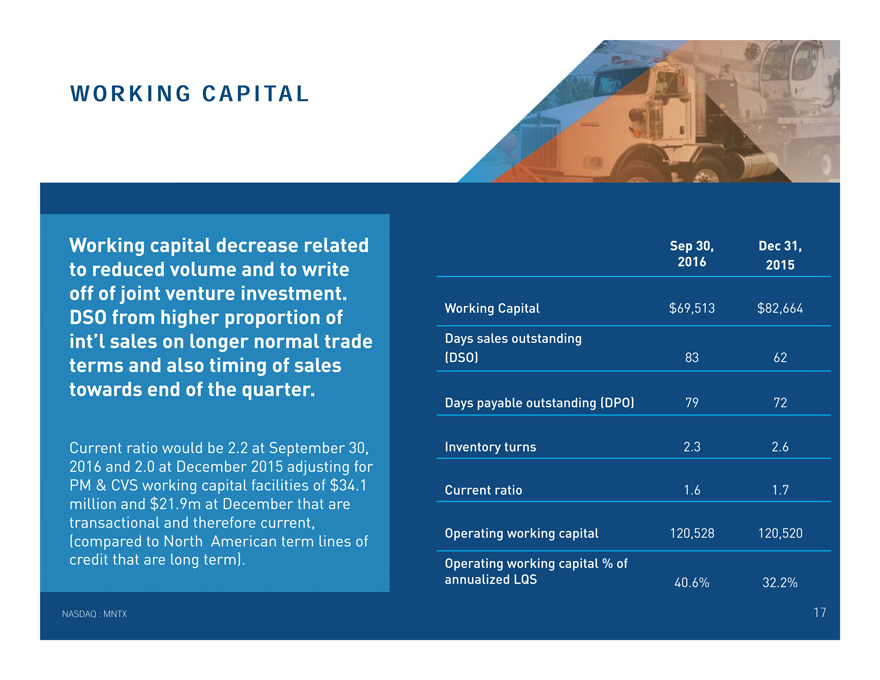
W O R K I N G C A P I TA L
Working capital decrease related to reduced volume and to write off of joint venture investment. DSO from higher proportion of int’l sales on longer normal trade terms and also timing of sales towards end of the quarter.
Current ratio would be 2.2 at September 30, 2016 and 2.0 at December 2015 adjusting for PM & CVS working capital facilities of $34.1 million and $21.9m at December that are transactional and therefore current, (compared to North American term lines of credit that are long term).
NASDAQ : MNTX
Sep 30, Dec 31,
2016 2015
Working Capital $69,513 $82,664
Days sales outstanding
(DSO) 83 62
Days payable outstanding (DPO) 79 72
Inventory turns 2.3 2.6
Current ratio 1.6 1.7
Operating working capital 120,528 120,520
Operating working capital % of
annualized LQS 40.6% 32.2%
17
|
|
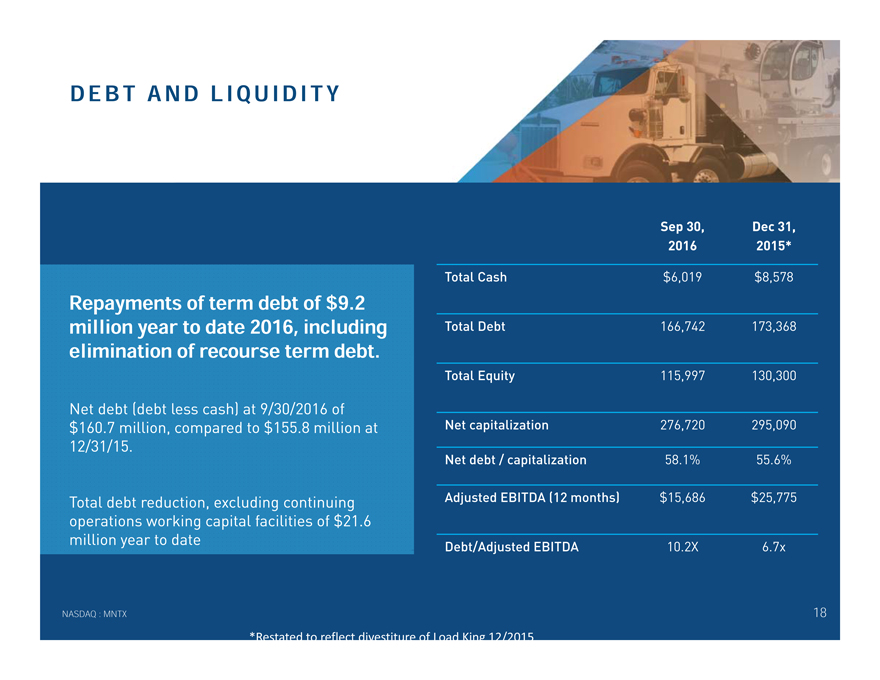
D E B T A N D L I Q U I D I T Y
Repayments of term debt of $9.2 million year to date 2016, including elimination of recourse term debt.
Net debt (debt less cash) at 9/30/2016 of $160.7 million, compared to $155.8 million at 12/31/15.
Total debt reduction, excluding continuing operations working capital facilities of $21.6 million year to date
Sep 30, Dec 31,
2016 2015*
Total Cash $6,019 $8,578
Total Debt 166,742 173,368
Total Equity 115,997 130,300
Net capitalization 276,720 295,090
Net debt / capitalization 58.1% 55.6%
Adjusted EBITDA (12 months) $15,686 $25,775
Debt/Adjusted EBITDA 10.2X 6.7x
NASDAQ : MNTX 18
*RestatedtoreflectdivestitureofLoadKing12/2015
|
|
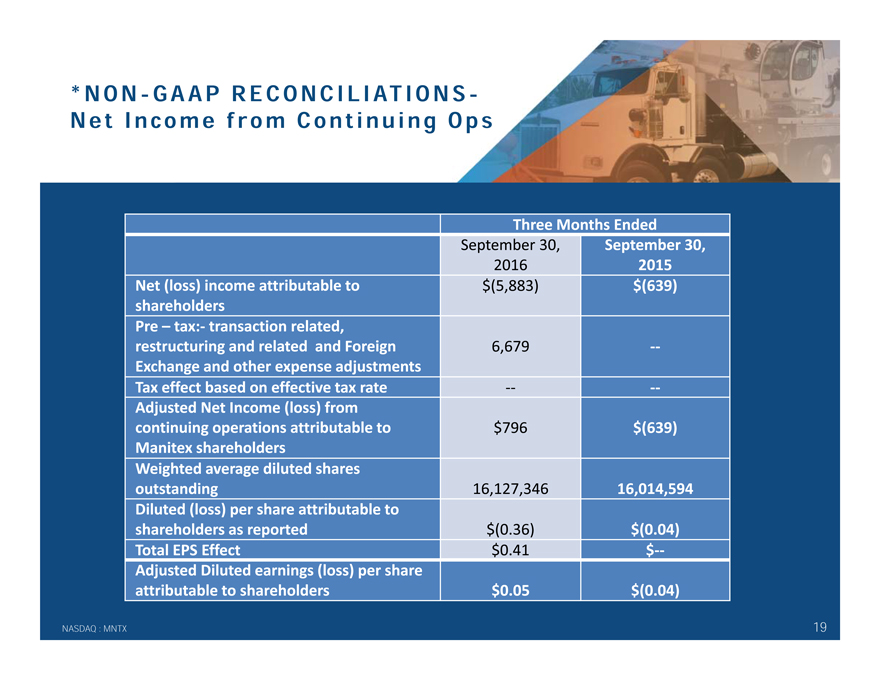
*NON-G A A P R E C O N C I L I AT I O N S -N e t I n co m e f ro m C o n t i n u i n g O p s
Three Months Ended
September 30,September 30,
20162015
Net (loss) income attributable to $(5,883)$(639)
shareholders
Pre – tax: transaction related,
restructuring and related and Foreign 6,679
Exchange and other expense adjustments
Tax effect based on effective tax rate
Adjusted Net Income (loss) from
continuing operations attributable to $796$(639)
Manitex shareholders
Weighted average diluted shares
outstanding 16,127,34616,014,594
Diluted (loss) per share attributable to
shareholders as reported $(0.36)$(0.04)
Total EPS Effect $0.41$
Adjusted Diluted earnings (loss) per share
attributable to shareholders $0.05$(0.04)
NASDAQ : MNTX 19
|
|
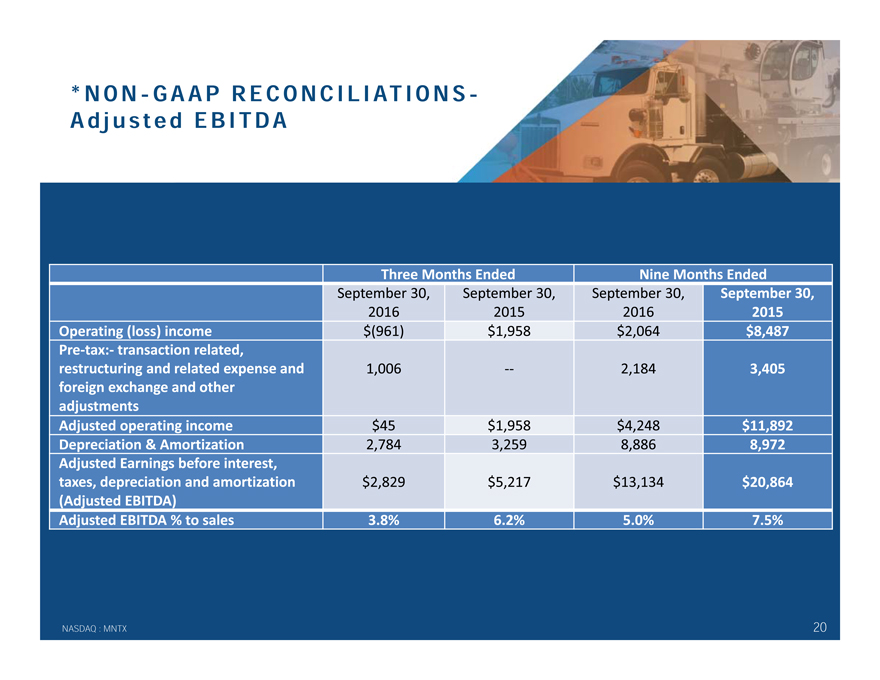
* N O N—G A A P R E C O N C I L I AT I O N S -A d j u s t e d E B I T D A
Three Months Ended Nine Months Ended
September 30, September 30,September 30,September 30,
2016 201520162015
Operating (loss) income $(961) $1,958$2,064$8,487
Pretax: transaction related,
restructuring and related expense and 1,006 2,1843,405
foreign exchange and other
adjustments
Adjusted operating income $45 $1,958$4,248$11,892
Depreciation & Amortization 2,784 3,2598,8868,972
Adjusted Earnings before interest,
taxes, depreciation and amtization $2,829 $5,217$13,134$20,864
(Adjusted EBITDA)
Adjusted EBITDA % to sales 3.8% 6.2%5.0%7.5%
NASDAQ : MNTX 20
|
|
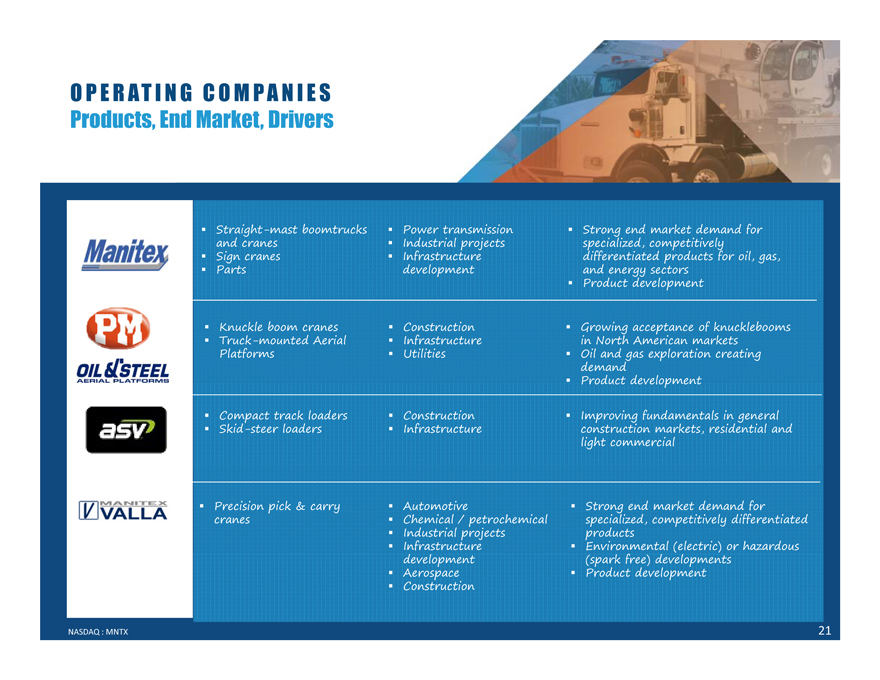
O P E R AT I N G C O M PA N I E S Products, End Market, Drivers
Straight-mast boomtrucks and cranes
Sign cranes Parts
Knuckle boom cranes Truck-mounted Aerial Platforms
Compact track loaders Skid-steer loaders
Precision pick & carry cranes
Power transmission Industrial projects Infrastructure development
Construction Infrastructure Utilities
Construction Infrastructure
Automotive
Chemical / petrochemical Industrial projects Infrastructure development Aerospace Construction
Strong end market demand for specialized, competitively differentiated products for oil, gas, and energy sectors Product development
Growing acceptance of knucklebooms in North American markets Oil and gas exploration creating demand Product development
Improving fundamentals in general construction markets, residential and light commercial
Strong end market demand for specialized, competitively differentiated products Environmental (electric) or hazardous (spark free) developments Product development
NASDAQ : MNTX
21
|
|
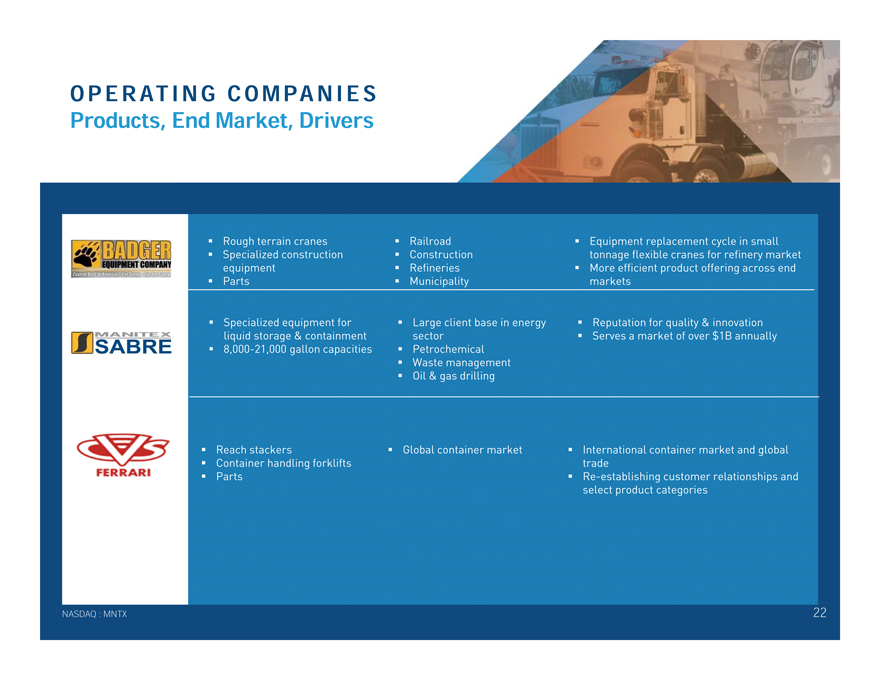
OPERAT I N G C O M PA N I E S Products, End Market, Drivers
Rough terrain cranes Specialized construction equipment Parts
Specialized equipment for liquid storage & containment 8,000-21,000 gallon capacities
Reach stackers
Container handling forklifts Parts
Railroad Construction Refineries Municipality
Large client base in energy sector Petrochemical Waste management Oil & gas drilling
Global container market
Equipment replacement cycle in small tonnage flexible cranes for refinery market More efficient product offering across end markets
Reputation for quality & innovation Serves a market of over $1B annually
International container market and global trade Re-establishing customer relationships and select product categories
NASDAQ : MNTX 22
|
|
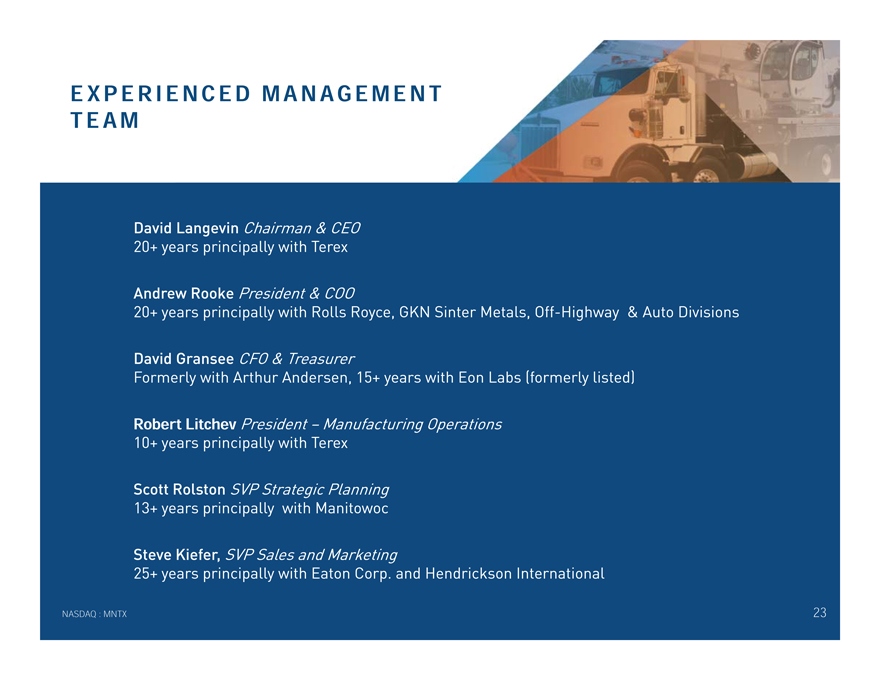
E X P E R I E N C E D M A N A G E M E N T T E A M
David Langevin Chairman & CEO
20+ years principally with Terex
Andrew Rooke President & COO
20+ years principally with Rolls Royce, GKN Sinter Metals, Off-Highway & Auto Divisions
David Gransee CFO & Treasurer
Formerly with Arthur Andersen, 15+ years with Eon Labs (formerly listed)
Robert Litchev President – Manufacturing Operations
10+ years principally with Terex
Scott Rolston SVP Strategic Planning
13+ years principally with Manitowoc
Steve Kiefer, SVP Sales and Marketing
25+ years principally with Eaton Corp. and Hendrickson International
NASDAQ : MNTX 23
|
|
MANITEX INTERNATIONAL, INC.
(NASDAQ: MNTX ) December 2016
David Langevin, C
708—237—20 dlangevin@manitex.c
Peter Seltzberg,Darrow Associates, I
516—419—99 pseltzberg@darrowir.c