Attached files
| file | filename |
|---|---|
| 8-K - 8-K - RigNet, Inc. | d298441d8k.htm |
RigNet 3Q 2016 Investor Presentation November 2016 Exhibit 99.1
Forward-Looking Statements Certain statements made in this presentation may constitute "forward-looking statements" within the meaning of the safe harbor provisions of the United States Private Securities Litigation Reform Act of 1995 — that is, statements related to the future, not past, events. Forward-looking statements are based on current expectations and include any statement that does not directly relate to a current or historical fact. In this context, forward-looking statements often address our expected future business and financial performance, and often contain words such as "anticipate," "believe," "intend," "expect," "plan" or other similar words. Forward-looking statements in this presentation include, without limitation, statements regarding projected revenue, Adjusted EBITDA and Unlevered Free Cash Flow (UFCF) for RigNet. These forward-looking statements involve certain risks and uncertainties that ultimately may not prove to be accurate. Actual results and future events could differ materially from those anticipated in such statements. Factors that could cause actual results to differ materially from those contemplated in our forward-looking statements include, among others: adverse changes in economic conditions in the markets we operate; the extent, timing and overall effects of competition in our industry; the impact of new, emerging or competing technologies; material changes in the communications industry that could adversely affect vendor relationships with equipment and network suppliers and customer relationships with wholesale customers; unfavorable results of litigation or intellectual property infringement claims asserted against us; unanticipated increases or other changes in our future cash requirements; the effects of federal and state legislation, and rules and regulations governing the communications industry; the impact of equipment failure, natural disasters or terrorist acts; and those additional factors set forth under the caption “Risk Factors” and other factors described in our filings with the SEC, including under the section “Management’s Discussion and Analysis of Financial Condition and Results of Operations” in our Form 10-K for the fiscal period December 31, 2015, which is incorporated by reference herein. RigNet undertakes no obligation and does not intend to update these forward-looking statements to reflect events or circumstances occurring after this press release. You are cautioned not to place undue reliance on these forward-looking statements, which speak only as of the date of this press release. All forward-looking statements are qualified in their entirety by this cautionary statement. In addition to U.S. GAAP financials, this presentation includes certain non-GAAP financial measures. These non-GAAP measures are in addition to, not a substitute for or superior to, measures of financial performance prepared in accordance with GAAP. Definitions of these non-GAAP measures and reconciliations between certain GAAP and non-GAAP measures are included in the appendix to this presentation. 2
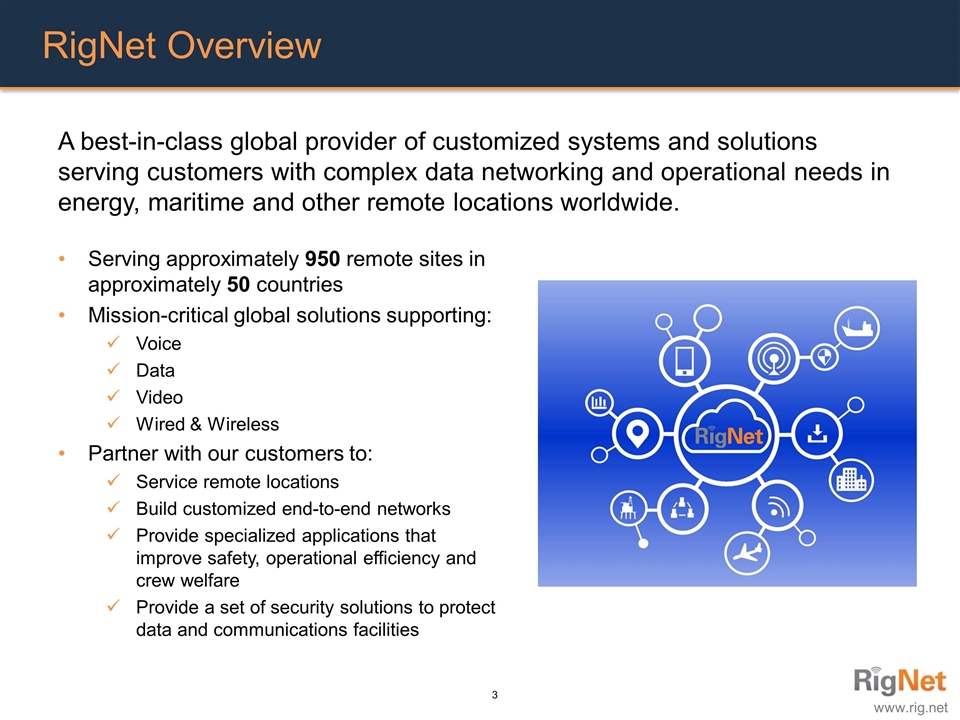
RigNet Overview A best-in-class global provider of customized systems and solutions serving customers with complex data networking and operational needs in energy, maritime and other remote locations worldwide. Serving approximately 950 remote sites in approximately 50 countries Mission-critical global solutions supporting: Voice Data Video Wired & Wireless Partner with our customers to: Service remote locations Build customized end-to-end networks Provide specialized applications that improve safety, operational efficiency and crew welfare Provide a set of security solutions to protect data and communications facilities 3
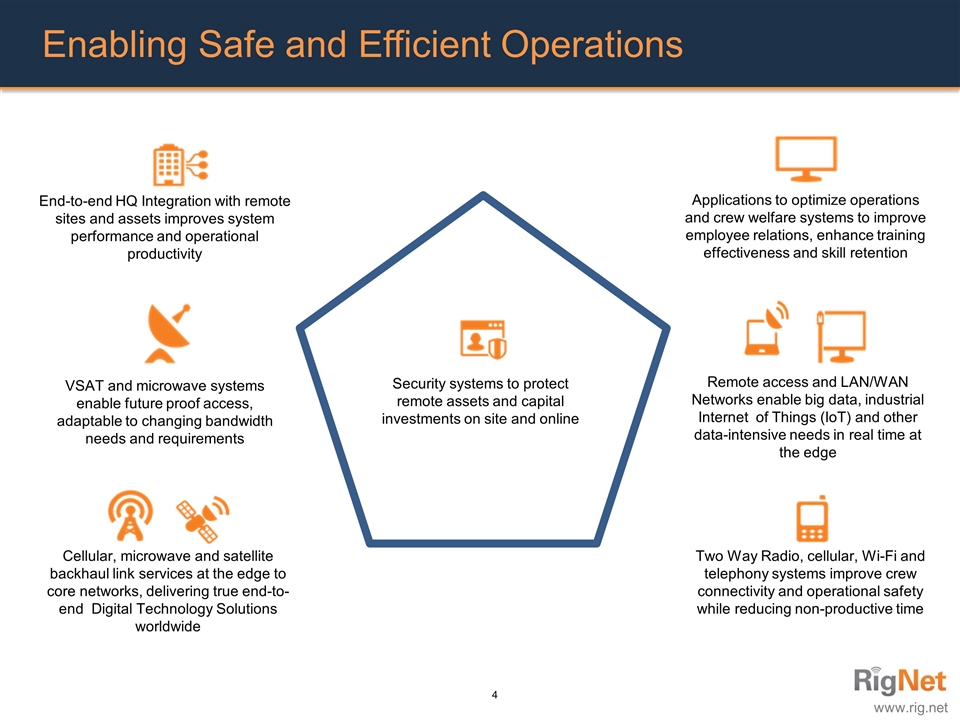
Enabling Safe and Efficient Operations Cellular, microwave and satellite backhaul link services at the edge to core networks, delivering true end-to-end Digital Technology Solutions worldwide VSAT and microwave systems enable future proof access, adaptable to changing bandwidth needs and requirements Remote access and LAN/WAN Networks enable big data, industrial Internet of Things (IoT) and other data-intensive needs in real time at the edge End-to-end HQ Integration with remote sites and assets improves system performance and operational productivity Two Way Radio, cellular, Wi-Fi and telephony systems improve crew connectivity and operational safety while reducing non-productive time Applications to optimize operations and crew welfare systems to improve employee relations, enhance training effectiveness and skill retention Security systems to protect remote assets and capital investments on site and online 4
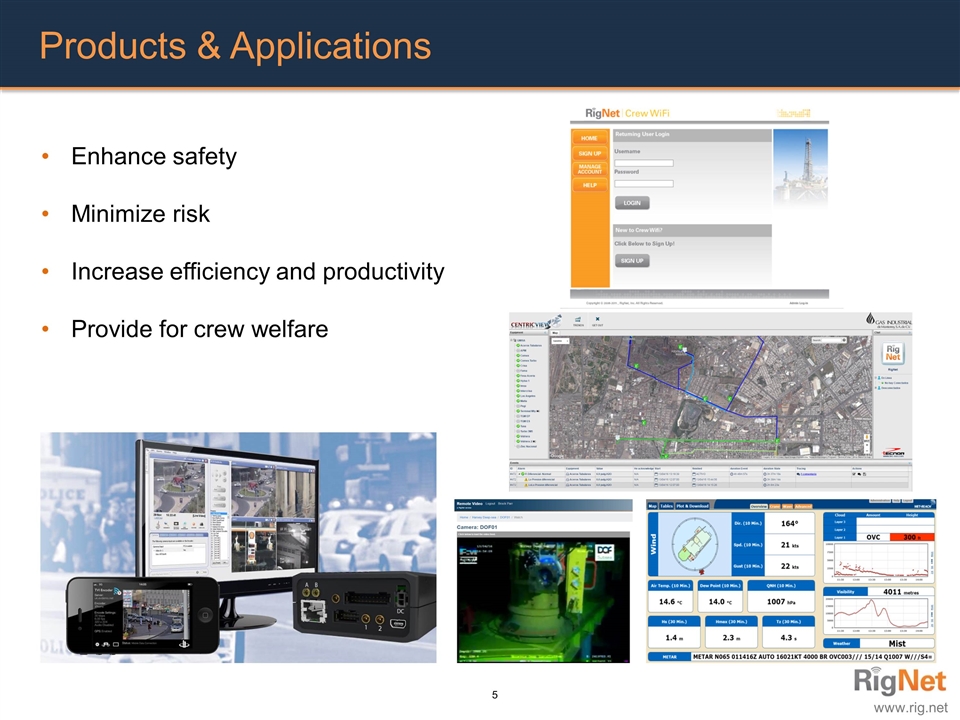
Products & Applications Enhance safety Minimize risk Increase efficiency and productivity Provide for crew welfare 5
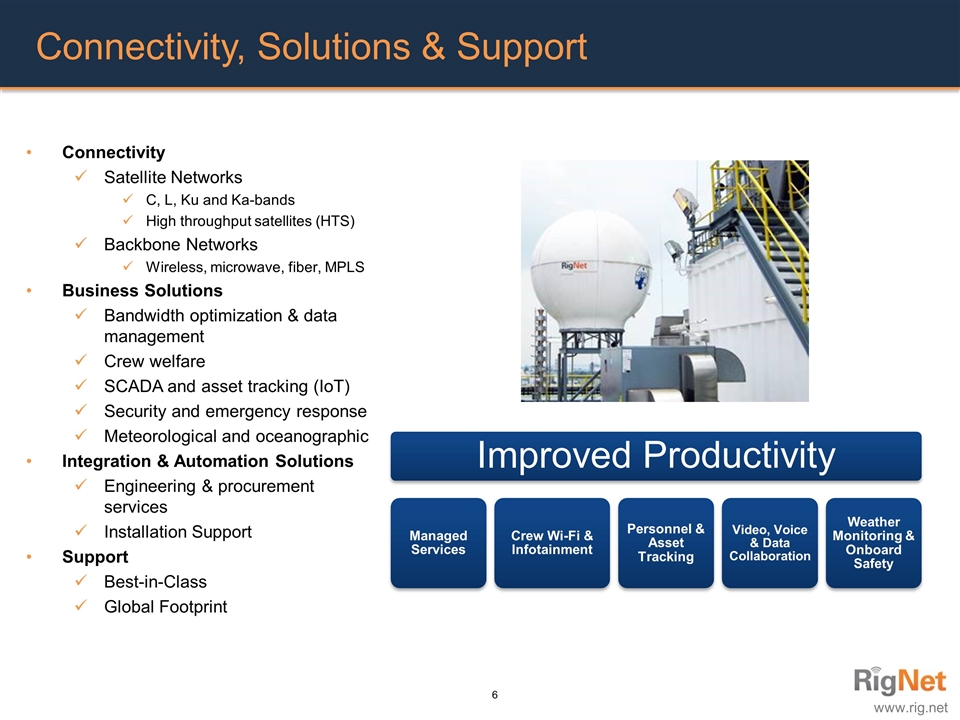
Connectivity, Solutions & Support Connectivity Satellite Networks C, L, Ku and Ka-bands High throughput satellites (HTS) Backbone Networks Wireless, microwave, fiber, MPLS Business Solutions Bandwidth optimization & data management Crew welfare SCADA and asset tracking (IoT) Security and emergency response Meteorological and oceanographic Integration & Automation Solutions Engineering & procurement services Installation Support Support Best-in-Class Global Footprint 6 Improved Productivity Managed Services Crew Wi-Fi & Infotainment Personnel & Asset Tracking Video, Voice & Data Collaboration Weather Monitoring & Onboard Safety
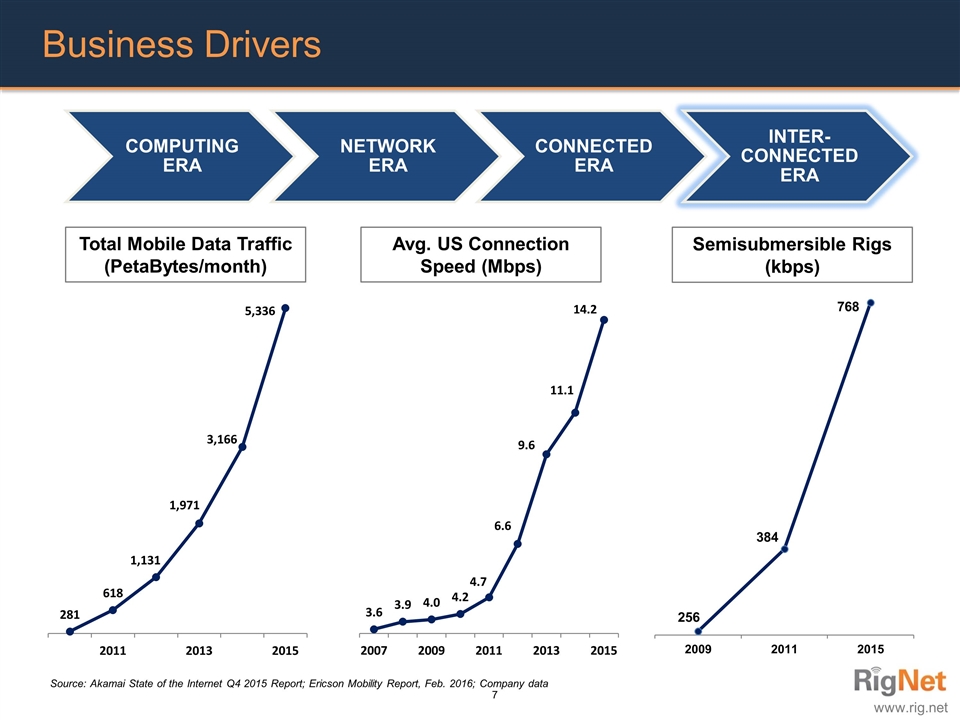
Business Drivers Source: Akamai State of the Internet Q4 2015 Report; Ericson Mobility Report, Feb. 2016; Company data Avg. US Connection Speed (Mbps) Total Mobile Data Traffic (PetaBytes/month) Semisubmersible Rigs (kbps) 7 COMPUTING ERA CONNECTED ERA INTER-CONNECTED ERA NETWORK ERA
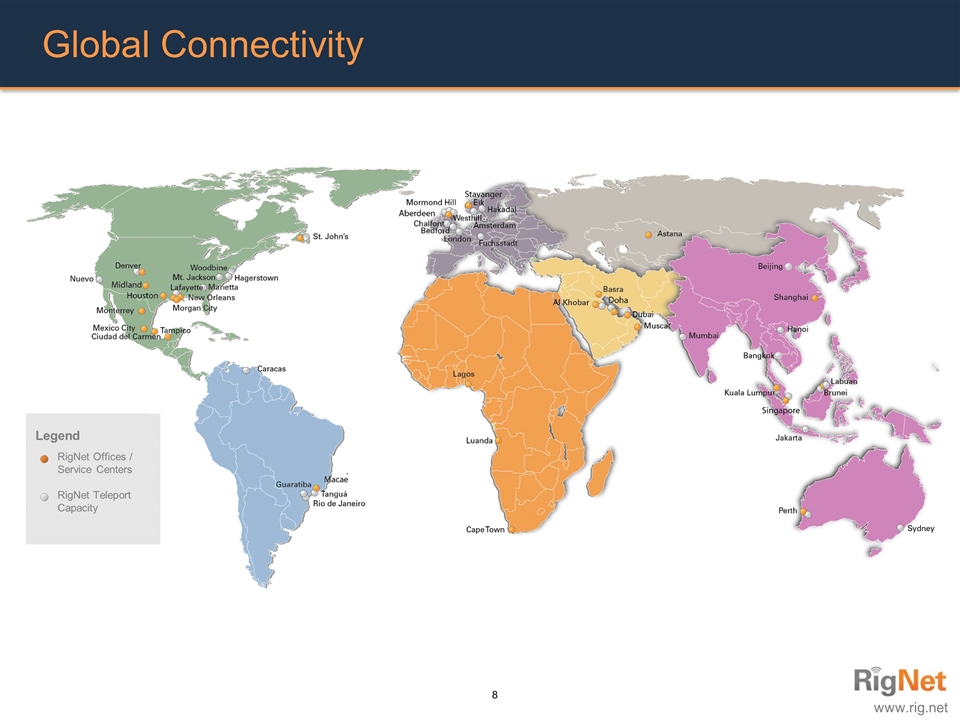
Global Connectivity 8 RigNet Offices / Service Centers RigNet Teleport Capacity Legend
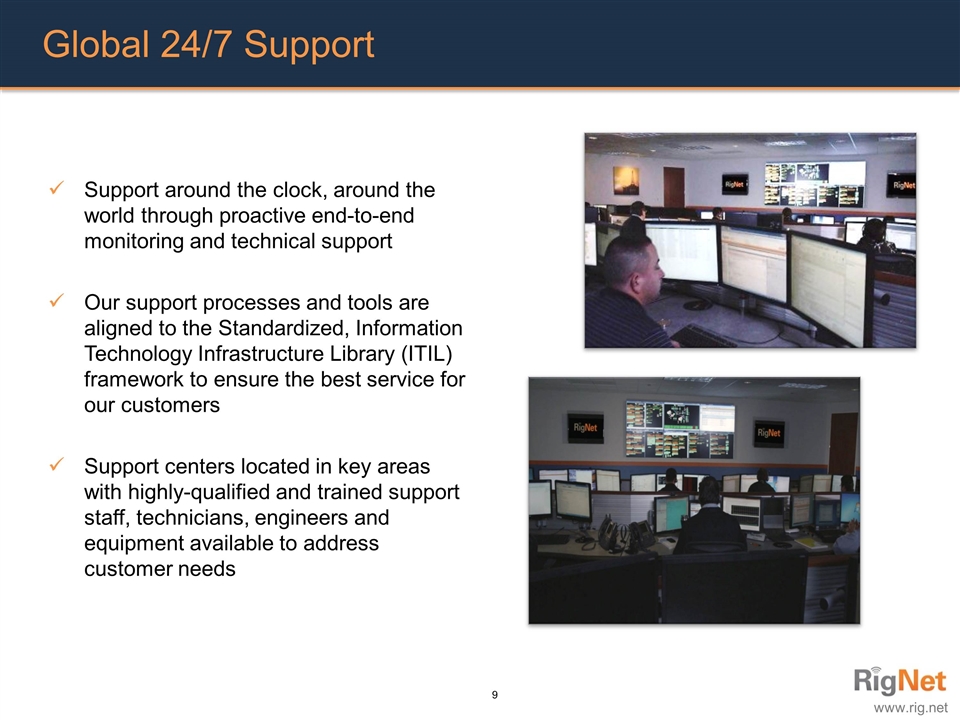
Global 24/7 Support Support around the clock, around the world through proactive end-to-end monitoring and technical support Our support processes and tools are aligned to the Standardized, Information Technology Infrastructure Library (ITIL) framework to ensure the best service for our customers Support centers located in key areas with highly-qualified and trained support staff, technicians, engineers and equipment available to address customer needs 9
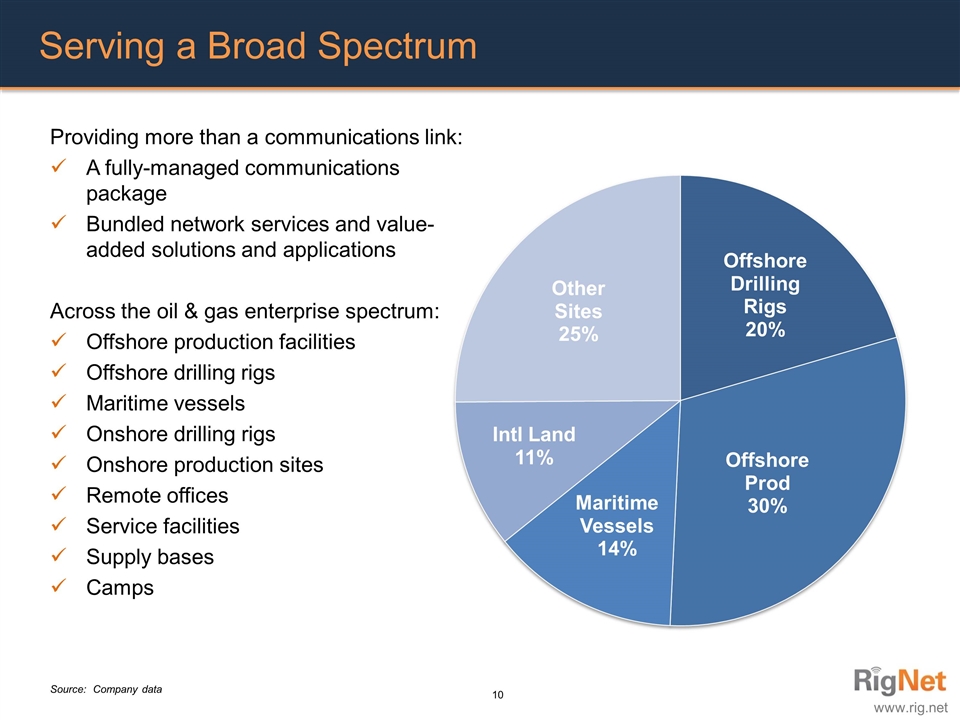
Serving a Broad Spectrum Providing more than a communications link: A fully-managed communications package Bundled network services and value-added solutions and applications Across the oil & gas enterprise spectrum: Offshore production facilities Offshore drilling rigs Maritime vessels Onshore drilling rigs Onshore production sites Remote offices Service facilities Supply bases Camps Source: Company data 10
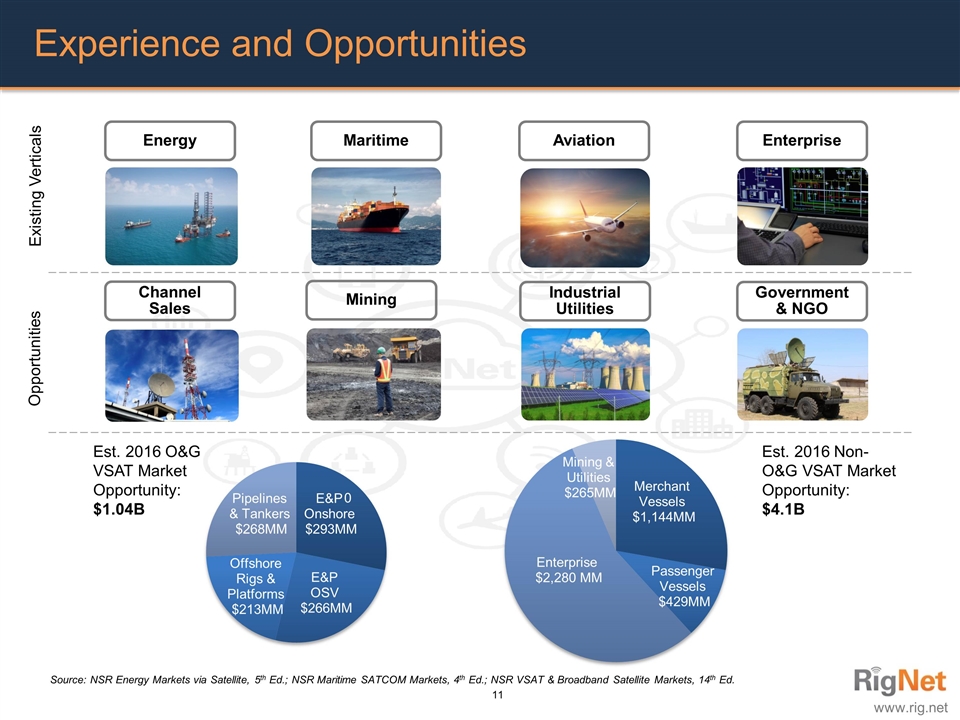
Experience and Opportunities Maritime Energy Aviation Mining Enterprise Industrial Utilities Existing Verticals Opportunities Est. 2016 O&G VSAT Market Opportunity: $1.04B Est. 2016 Non-O&G VSAT Market Opportunity: $4.1B Government & NGO Channel Sales Source: NSR Energy Markets via Satellite, 5th Ed.; NSR Maritime SATCOM Markets, 4th Ed.; NSR VSAT & Broadband Satellite Markets, 14th Ed. 11
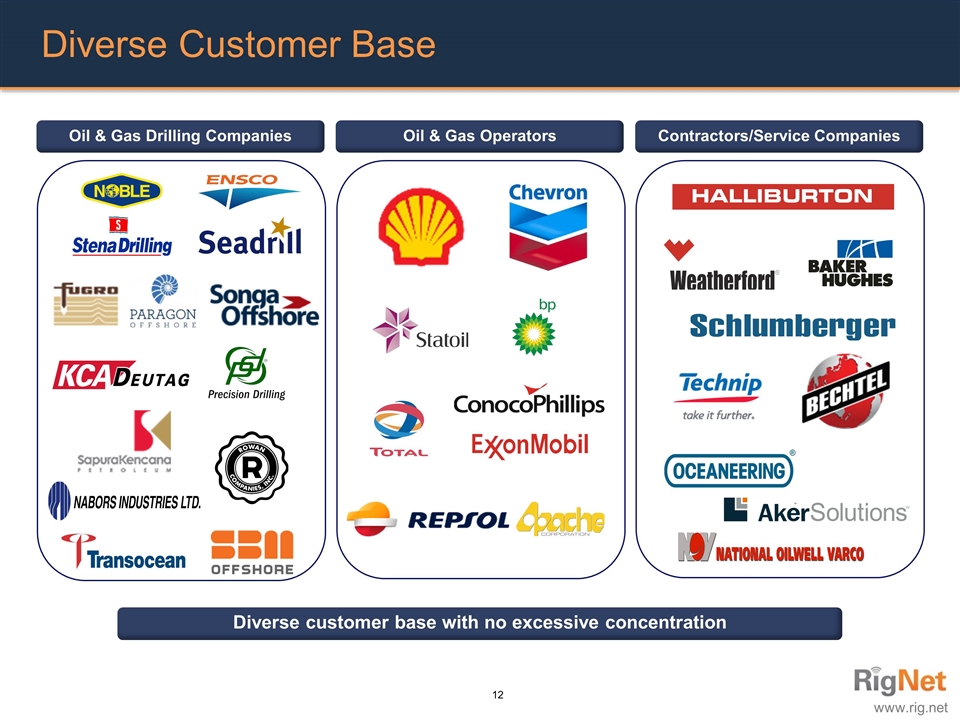
Oil & Gas Drilling Companies Oil & Gas Operators Contractors/Service Companies Diverse customer base with no excessive concentration Diverse Customer Base 12
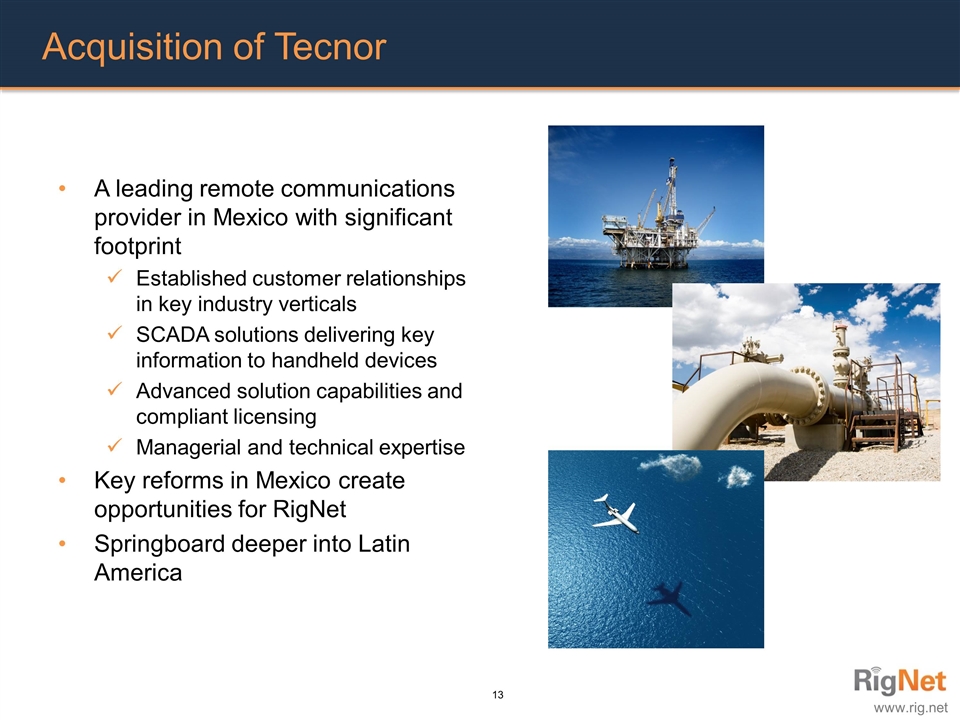
Acquisition of Tecnor A leading remote communications provider in Mexico with significant footprint Established customer relationships in key industry verticals SCADA solutions delivering key information to handheld devices Advanced solution capabilities and compliant licensing Managerial and technical expertise Key reforms in Mexico create opportunities for RigNet Springboard deeper into Latin America 13
Well-Positioned for Success Worldwide customer care is a key differentiator Maintaining high levels of network availability Responsive with solutions to common and uncommon challenges Global investment in people and equipment Strong customer base Major oil and gas drillers Major energy operators and service companies Traditional and new technology offerings Fiber, Microwave, L-band, C-band, Ku and Ka band LTE, Wi-Fi, Fiber, Cat 5 cabling GX, O3b Flexible balance sheet Liquidity from cash and revolving credit facility Manageable debt position De-leveraging with use of excess cash Cost structure rationalization underway Demonstrated progress in reducing SG&A Aggressively pursuing reductions in capital expenditures Opportunities to reduce supply chain costs 14
Near Term Objectives Business Increase ARPU through commercialization of over-the-top solutions Diversify our business and add scale Drive operational improvements Financial Maintain balance sheet flexibility Focus on cash efficiency Manage debt Address further cost reductions through strategic sourcing, back-office automation and performance management Invest opportunistically Pursue targeted M&A prospects 15
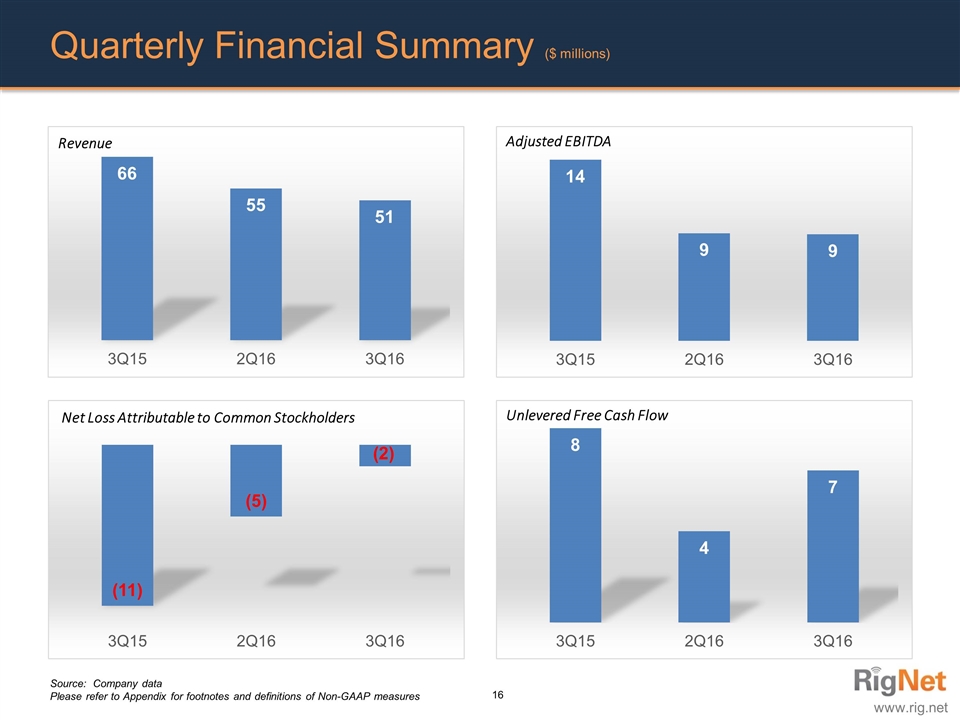
Quarterly Financial Summary ($ millions) Revenue Adjusted EBITDA Unlevered Free Cash Flow Net Loss Attributable to Common Stockholders Source: Company data Please refer to Appendix for footnotes and definitions of Non-GAAP measures 16
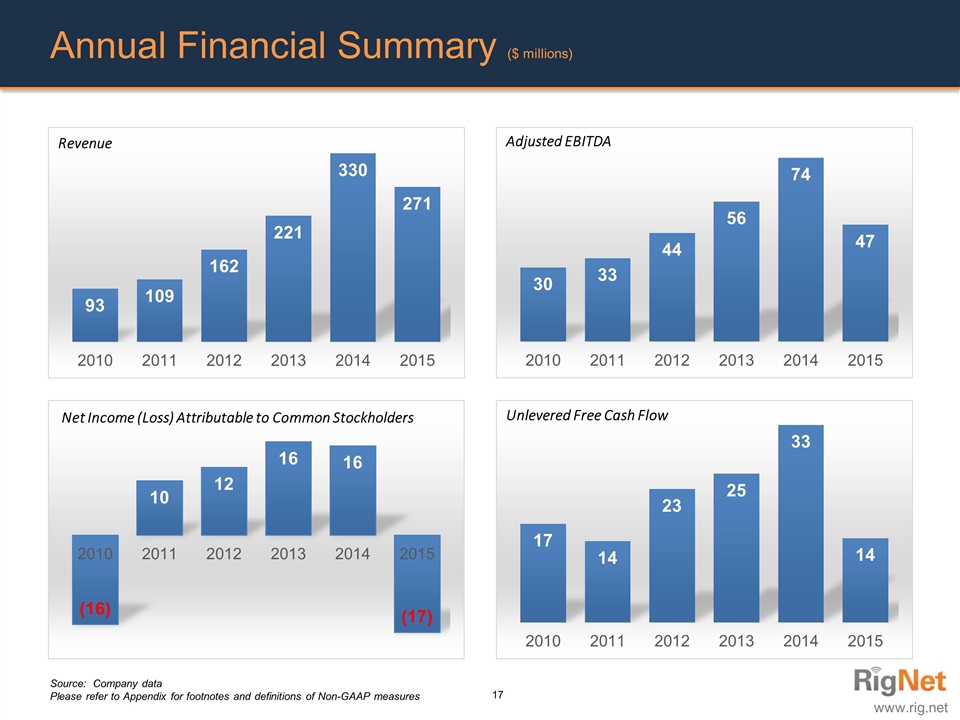
Annual Financial Summary ($ millions) Revenue Adjusted EBITDA Unlevered Free Cash Flow Net Income (Loss) Attributable to Common Stockholders Source: Company data Please refer to Appendix for footnotes and definitions of Non-GAAP measures 17
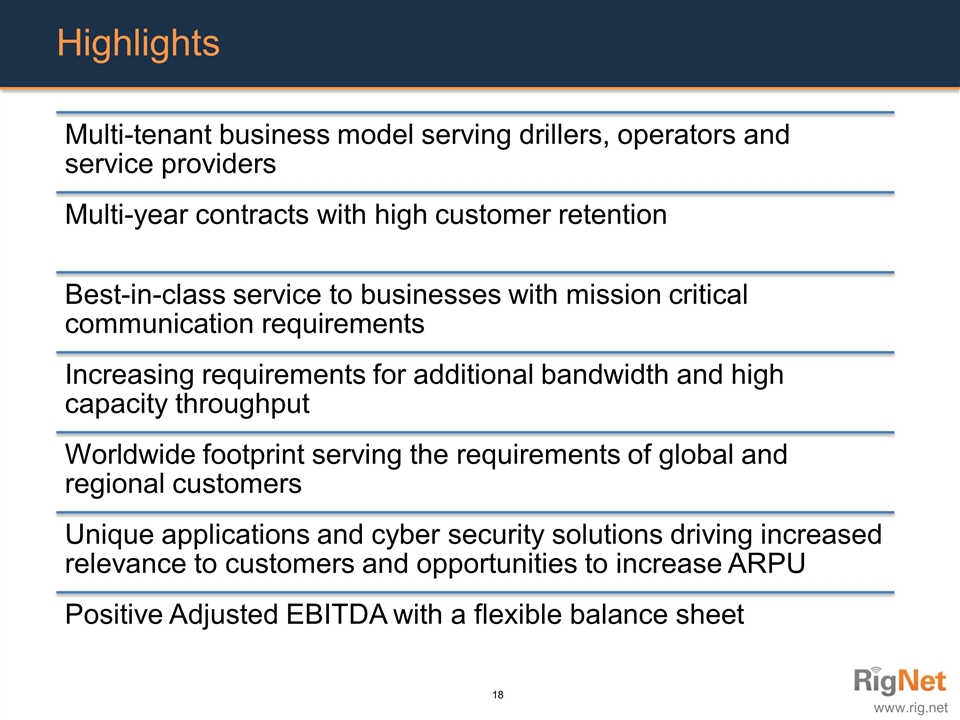
Highlights 18 Best-in-class service to businesses with mission critical communication requirements Increasing requirements for additional bandwidth and high capacity throughput Worldwide footprint serving the requirements of global and regional customers Multi-tenant business model serving drillers, operators and service providers Unique applications and cyber security solutions driving increased relevance to customers and opportunities to increase ARPU Multi-year contracts with high customer retention Positive Adjusted EBITDA with a flexible balance sheet
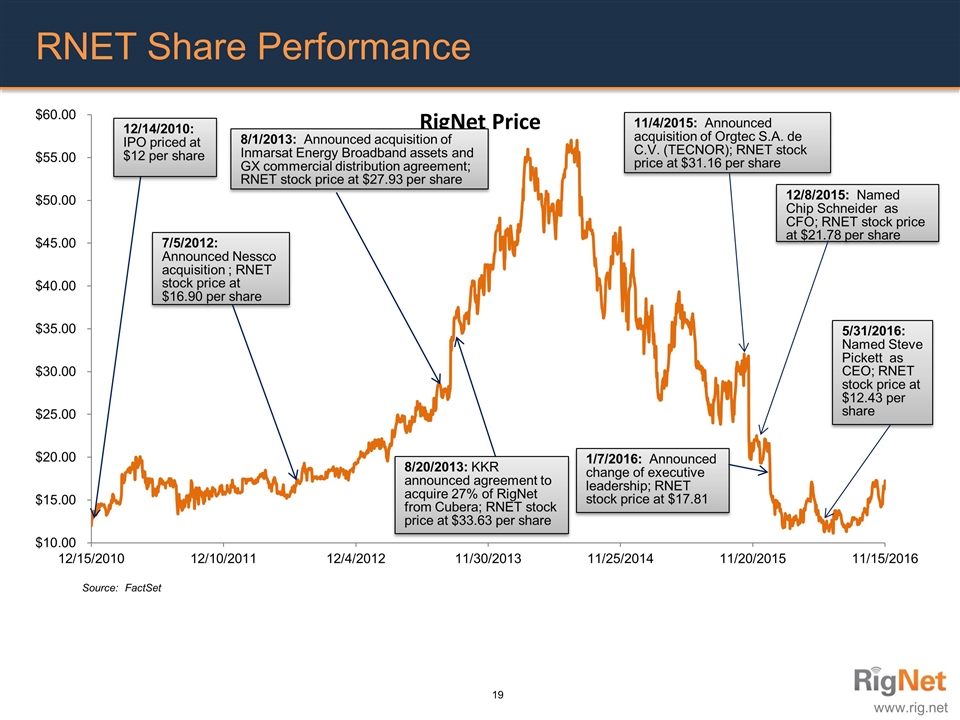
RNET Share Performance Source: FactSet 19
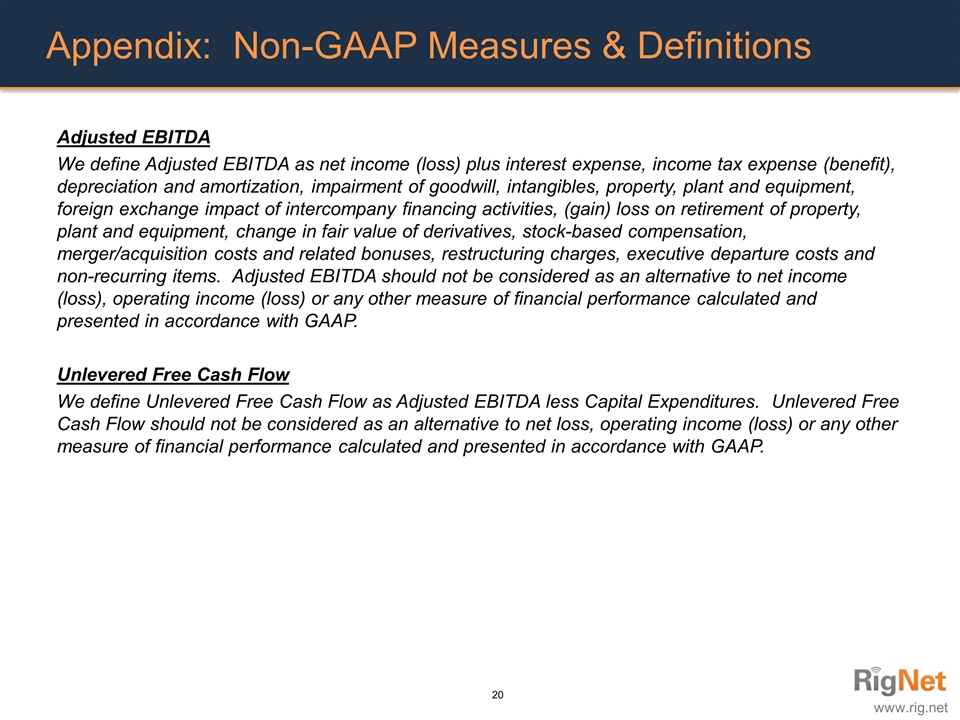
Appendix: Non-GAAP Measures & Definitions Adjusted EBITDA We define Adjusted EBITDA as net income (loss) plus interest expense, income tax expense (benefit), depreciation and amortization, impairment of goodwill, intangibles, property, plant and equipment, foreign exchange impact of intercompany financing activities, (gain) loss on retirement of property, plant and equipment, change in fair value of derivatives, stock-based compensation, merger/acquisition costs and related bonuses, restructuring charges, executive departure costs and non-recurring items. Adjusted EBITDA should not be considered as an alternative to net income (loss), operating income (loss) or any other measure of financial performance calculated and presented in accordance with GAAP. Unlevered Free Cash Flow We define Unlevered Free Cash Flow as Adjusted EBITDA less Capital Expenditures. Unlevered Free Cash Flow should not be considered as an alternative to net loss, operating income (loss) or any other measure of financial performance calculated and presented in accordance with GAAP. 20
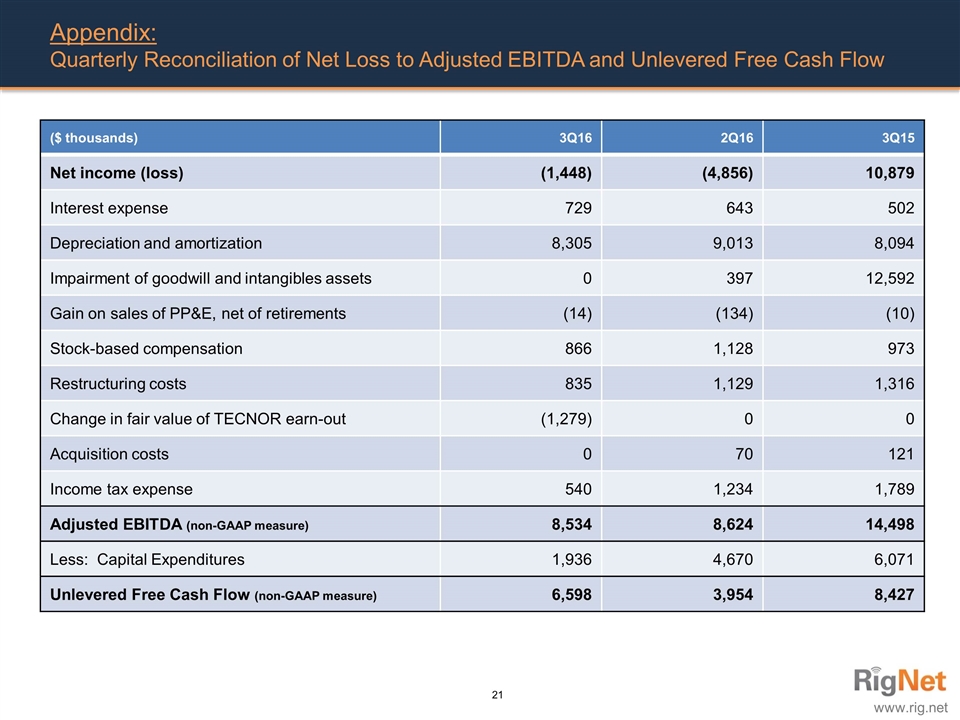
Appendix: Quarterly Reconciliation of Net Loss to Adjusted EBITDA and Unlevered Free Cash Flow ($ thousands) 3Q16 2Q16 3Q15 Net income (loss) (1,448) (4,856) 10,879 Interest expense 729 643 502 Depreciation and amortization 8,305 9,013 8,094 Impairment of goodwill and intangibles assets 0 397 12,592 Gain on sales of PP&E, net of retirements (14) (134) (10) Stock-based compensation 866 1,128 973 Restructuring costs 835 1,129 1,316 Change in fair value of TECNOR earn-out (1,279) 0 0 Acquisition costs 0 70 121 Income tax expense 540 1,234 1,789 Adjusted EBITDA (non-GAAP measure) 8,534 8,624 14,498 Less: Capital Expenditures 1,936 4,670 6,071 Unlevered Free Cash Flow (non-GAAP measure) 6,598 3,954 8,427 21
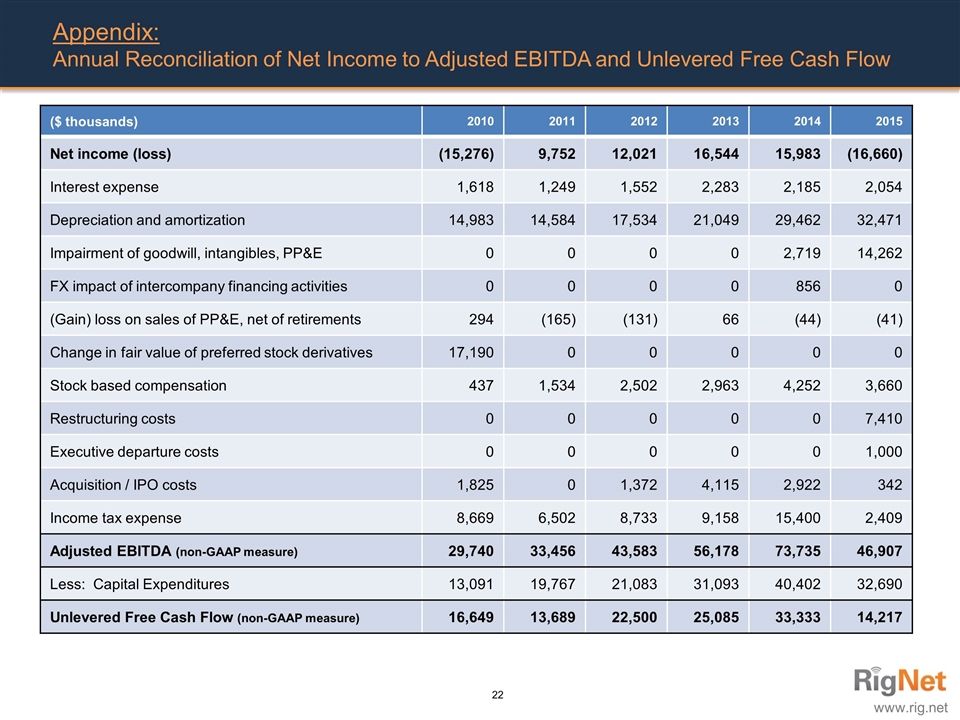
Appendix: Annual Reconciliation of Net Income to Adjusted EBITDA and Unlevered Free Cash Flow ($ thousands) 2010 2011 2012 2013 2014 2015 Net income (loss) (15,276) 9,752 12,021 16,544 15,983 (16,660) Interest expense 1,618 1,249 1,552 2,283 2,185 2,054 Depreciation and amortization 14,983 14,584 17,534 21,049 29,462 32,471 Impairment of goodwill, intangibles, PP&E 0 0 0 0 2,719 14,262 FX impact of intercompany financing activities 0 0 0 0 856 0 (Gain) loss on sales of PP&E, net of retirements 294 (165) (131) 66 (44) (41) Change in fair value of preferred stock derivatives 17,190 0 0 0 0 0 Stock based compensation 437 1,534 2,502 2,963 4,252 3,660 Restructuring costs 0 0 0 0 0 7,410 Executive departure costs 0 0 0 0 0 1,000 Acquisition / IPO costs 1,825 0 1,372 4,115 2,922 342 Income tax expense 8,669 6,502 8,733 9,158 15,400 2,409 Adjusted EBITDA (non-GAAP measure) 29,740 33,456 43,583 56,178 73,735 46,907 Less: Capital Expenditures 13,091 19,767 21,083 31,093 40,402 32,690 Unlevered Free Cash Flow (non-GAAP measure) 16,649 13,689 22,500 25,085 33,333 14,217 22

Thank You
