Attached files
| file | filename |
|---|---|
| EX-99.1 - EXHIBIT 99.1 - RE/MAX Holdings, Inc. | v453946_ex99-1.htm |
| EX-10.1 - EXHIBIT 10.1 - RE/MAX Holdings, Inc. | v453946_ex10-1.htm |
| EX-2.1 - EXHIBIT 2.1 - RE/MAX Holdings, Inc. | v453946_ex2-1.htm |
| 8-K - FORM 8-K - RE/MAX Holdings, Inc. | v453946_8k.htm |
Exhibit 99.2

November 28, 2016 2016 Independent Region Acquisitions Supplementary Materials Andy Schulz – Executive Director Investor Relations – aschulz@remax.com
2 Forward - Looking Statements This presentation includes “forward - looking statements” within the meaning of the “safe harbor” provisions of the United States Private Securities Litigation Reform Act of 1995 . Forward - looking statements may be identified by the use of words such as “believe,” “intend,” “expect,” “estimate,” “plan,” “outlook,” “project” and other similar words and expressions that predict or indicate future events or trends that are not statements of historical matters . These forward - looking statements include statements regarding the Company’s outlook, including expectations regarding agent - count, revenue, SO&A expenses, and Adjusted EBITDA margins, the Company’s optimism for agent recruitment, investment, acquisitions, improving market conditions, and the launch of Motto Mortgage, as well as other statements regarding the Company’s strategic and operational plans and business models . Forward - looking statements should not be read as a guarantee of future performance or results, and will not necessarily be accurate indications of the times at, or by, which such performance or results will be achieved . Forward - looking statements are based on information available at the time those statements are made and/or management’s good faith belief as of that time with respect to future events, and are subject to risks and uncertainties that could cause actual performance or results to differ materially from those expressed in or suggested by the forward - looking statements . Such risks and uncertainties include, without limitation, ( 1 ) changes in business and economic activity in general, ( 2 ) changes in the real estate market, including changes due to interest rates and availability of financing, ( 3 ) the Company’s ability to attract and retain quality franchisees, ( 4 ) the Company’s franchisees’ ability to recruit and retain agents and mortgage loan originators, ( 5 ) changes in laws and regulations that may affect the Company’s business or the real estate market, ( 6 ) failure to maintain, protect and enhance the RE/MAX and Motto Mortgage brands, ( 7 ) fluctuations in foreign currency exchange rates, as well as those risks and uncertainties described in the sections entitled “Risk Factors” and “Management’s Discussion and Analysis of Financial Condition and Results of Operations” in the most recent Annual Report on Form 10 - K filed with the Securities and Exchange Commission (“SEC”) and similar disclosures in subsequent periodic and current reports filed with the SEC, which are available on the investor relations page of the Company’s website at www . remax . com and on the SEC website at www . sec . gov . Readers are cautioned not to place undue reliance on forward - looking statements, which speak only as of the date on which they are made . Except as required by law, the Company does not intend, and undertakes no duty, to update this information to reflect future events or circumstances .
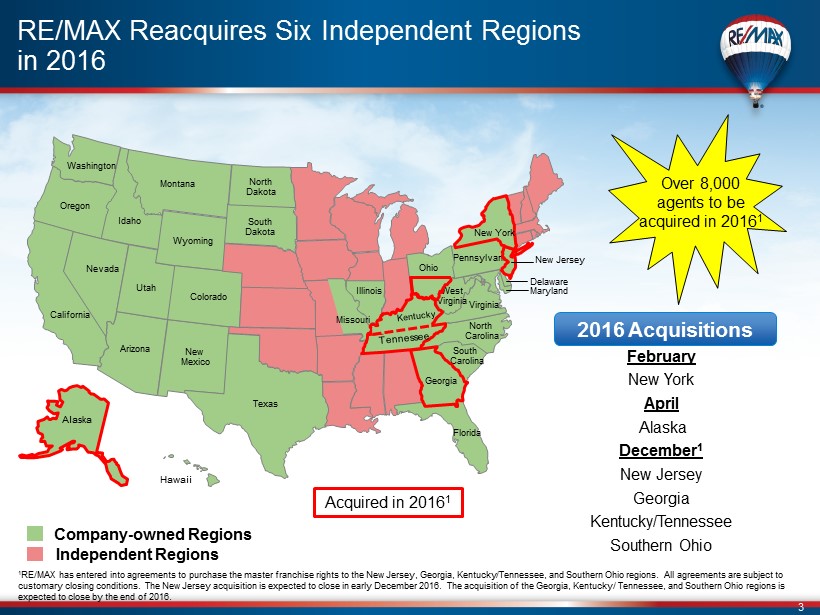
3 RE/MAX Reacquires Six Independent Regions in 2016 Hawaii Alaska Acquired in 2016 1 Washington Oregon Idaho Montana California Colorado Utah Wyoming South Dakota North Dakota Texas Pennsylvania Delaware Florida North Carolina South Carolina Nevada Arizona New Mexico Maryland Virginia Missouri Illinois New Jersey Georgia West Virginia New York Company - owned Regions Independent Regions Over 8,000 agents to be acquired in 2016 1 1 RE/MAX has entered into agreements to purchase the master franchise rights to the New Jersey, Georgia, Kentucky/Tennessee, and Southern Ohio regions. All agreements are subject to customary closing conditions. The New Jersey acquisition is expected to close in early December 2016. The acquisition of the Georgia , Kentucky/ Tennessee, and Southern Ohio regions is expected to close by the end of 2016. 2016 Acquisitions February New York April Alaska December 1 New Jersey Georgia Kentucky/Tennessee Southern Ohio Ohio

4 Georgia, Kentucky/Tennessee, & Southern Ohio (“Regional Services”) Acquisition Overview ▪ Purchase price: $50.4 million ▪ Includes three regions – Georgia, Kentucky/Tennessee, and Southern Ohio (“Regional Services”) Key Statistics 1 As of September 30, 2016 2 Includes the Company - owned region in Central and Northern Ohio ▪ The acquisition will enable RE/MAX to capture the incremental revenue earned from the region in its financial statements ▪ RE/MAX expects to realize cost synergies in 2017 and will continue to optimize cost efficiencies across all Company - owned regions prospectively ▪ Opportunity to sell additional franchises and grow the region, especially in Georgia and Tennessee Acquisition Benefits ▪ RE/MAX represented the following percentages of the National Association of Realtors in each respective state as of September 30, 2016: Market Highlights ▪ Agent Count: 3,925 1 ▪ Office locations: 255 1 ▪ Expected to close by end of 2016 ▪ Georgia: 4.7% ▪ Kentucky: 8.4% ▪ Tennessee: 4.9% ▪ Ohio 2 : 6.1%
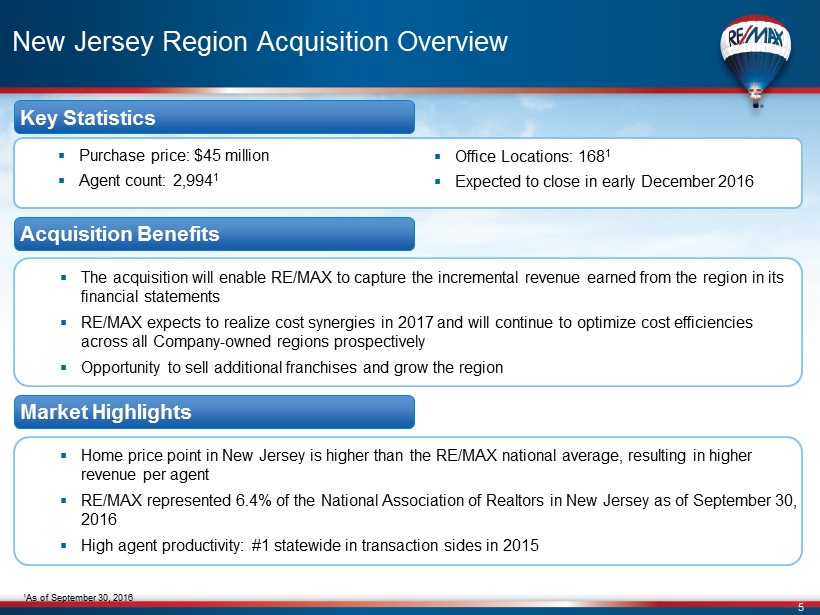
5 New Jersey Region Acquisition Overview ▪ Purchase price: $45 million ▪ Agent count: 2,994 1 Key Statistics ▪ The acquisition will enable RE/MAX to capture the incremental revenue earned from the region in its financial statements ▪ RE/MAX expects to realize cost synergies in 2017 and will continue to optimize cost efficiencies across all Company - owned regions prospectively ▪ Opportunity to sell additional franchises and grow the region Acquisition Benefits ▪ Home price point in New Jersey is higher than the RE/MAX national average, resulting in higher revenue per agent ▪ RE/MAX represented 6.4% of the National Association of Realtors in New Jersey as of September 30, 2016 ▪ High agent productivity: #1 statewide in transaction sides in 2015 Market Highlights ▪ Office Locations: 168 1 ▪ Expected to close in early December 2016 1 As of September 30, 2016
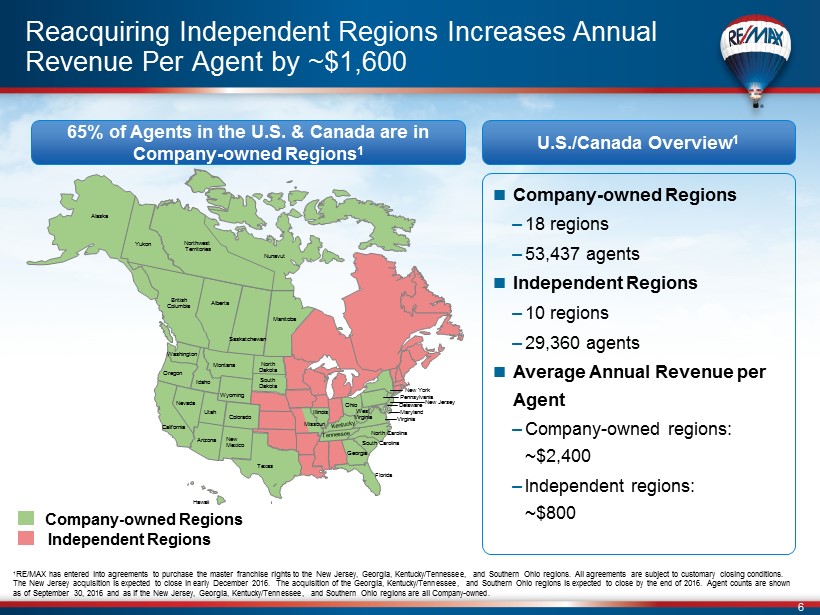
6 65% of Agents in the U.S. & Canada are in Company - owned Regions 1 Washington Oregon Idaho Montana California Hawaii Colorado Utah Wyoming South Dakota North Dakota Texas Pennsylvania Delaware Florida North Carolina South Carolina British Columbia Alberta Saskatchewan Manitoba Yukon U.S./Canada Overview 1 Company - owned Regions – 18 regions – 53,437 agents Independent Regions – 10 regions – 29,360 agents Average Annual Revenue per Agent – Company - owned regions: ~$2,400 – Independent regions: ~$800 Nevada Arizona New Mexico Maryland Virginia West Virginia Missouri Illinois Ohio Northwest Territories Nunavut Reacquiring Independent Regions Increases Annual Revenue Per Agent by ~$1,600 New York Alaska New Jersey Georgia Company - owned Regions Independent Regions 1 RE/MAX has entered into agreements to purchase the master franchise rights to the New Jersey, Georgia, Kentucky/Tennessee, and Southern Ohio regions. All agreements are subject to customary closing conditions. The New Jersey acquisition is expected to close in early December 2016. The acquisition of the Georgia , Kentucky/Tennessee , and Southern Ohio regions is expected to close by the end of 2016. Agent counts are shown as of September 30, 2016 and as if the New Jersey, Georgia, Kentucky/Tennessee, and Southern Ohio regions are all Company - owned.
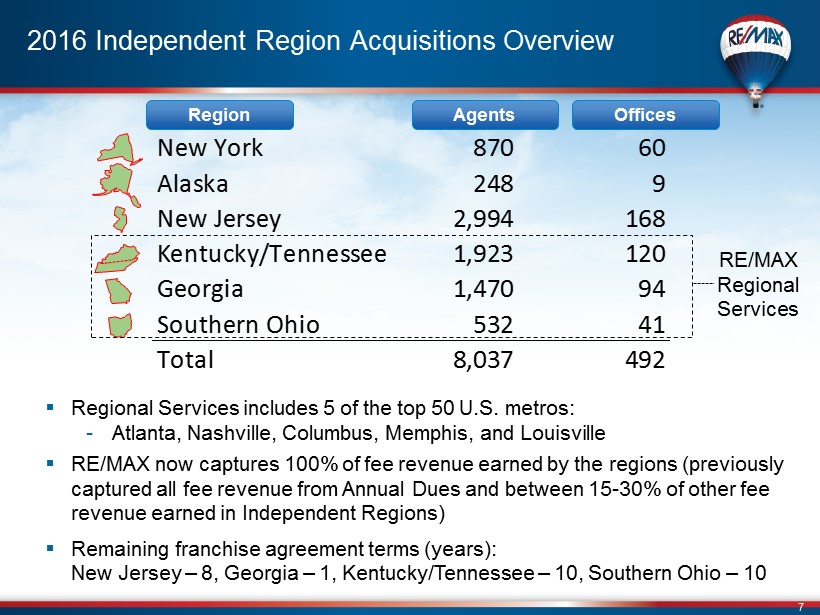
7 2016 Independent Region Acquisitions Overview Region Agents ▪ Regional Services includes 5 of the top 50 U.S. metros: - Atlanta, Nashville, Columbus, Memphis, and Louisville ▪ RE/MAX now captures 100% of fee revenue earned by the regions (previously captured all fee revenue from Annual Dues and between 15 - 30% of other fee revenue earned in Independent Regions ) ▪ Remaining franchise agreement terms (years): New Jersey – 8, Georgia – 1, Kentucky/Tennessee – 10, Southern Ohio – 10 RE/ MAX Regional Services Offices New York 870 60 Alaska 248 9 New Jersey 2,994 168 Kentucky/Tennessee 1,923 120 Georgia 1,470 94 Southern Ohio 532 41 Total 8,037 492
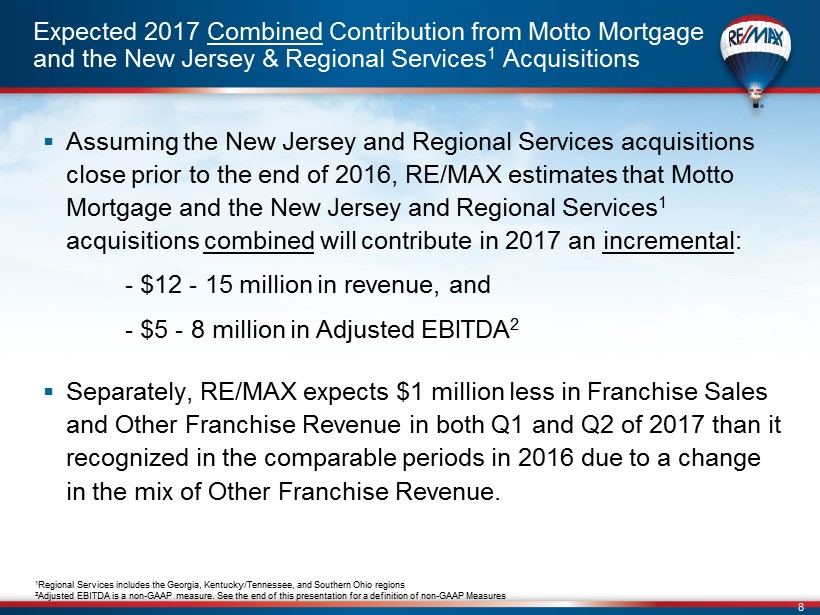
8 ▪ Assuming the New Jersey and Regional Services acquisitions close prior to the end of 2016, RE/MAX estimates that Motto Mortgage and the New Jersey and Regional Services 1 acquisitions combined will contribute in 2017 an incremental : - $12 - 15 million in revenue, and - $ 5 - 8 million in Adjusted EBITDA 2 ▪ Separately, RE/MAX expects $1 million less in Franchise Sales and Other Franchise Revenue in both Q1 and Q2 of 2017 than it recognized in the comparable periods in 2016 due to a change in the mix of Other Franchise Revenue. Expected 2017 Combined Contribution from Motto Mortgage and the New Jersey & Regional Services 1 Acquisitions 1 Regional Services includes the Georgia, Kentucky/Tennessee, and Southern Ohio regions 2 Adjusted EBITDA is a non - GAAP measure. See the end of this presentation for a definition of non - GAAP Measures
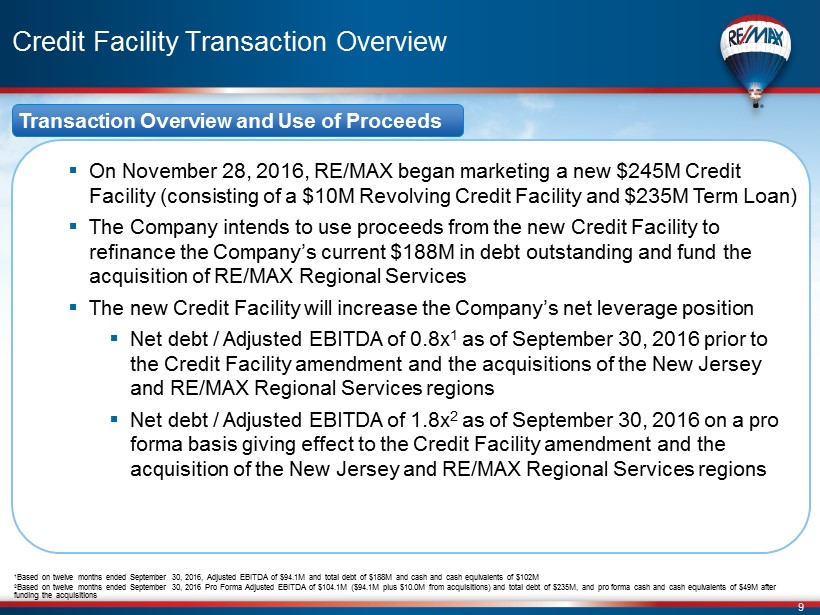
9 Credit Facility Transaction Overview ▪ On November 28, 2016, RE/MAX began marketing a new $245M Credit Facility ( consisting of a $10M Revolving Credit Facility and $235M Term Loan) ▪ The Company intends to use proceeds from the new Credit Facility to refinance the Company’s current $188M in debt outstanding and fund the acquisition of RE/MAX Regional Services ▪ The new Credit Facility will increase the Company’s net leverage position ▪ Net debt / Adjusted EBITDA of 0.8x 1 as of September 30, 2016 prior to the Credit Facility amendment and the acquisitions of the New Jersey and RE/MAX Regional Services regions ▪ Net debt / Adjusted EBITDA of 1.8x 2 as of September 30, 2016 on a pro forma basis giving effect to the Credit Facility amendment and the acquisition of the New Jersey and RE/MAX Regional Services regions Transaction Overview and Use of Proceeds 1 Based on twelve months ended September 30, 2016, Adjusted EBITDA of $94.1M and total debt of $ 188M and cash and cash equivalents of $102M 2 Based on twelve months ended September 30, 2016 Pro Forma Adjusted EBITDA of $104.1M ($94.1M plus $10.0M from acquisitions) a nd total debt of $235M, and pro forma cash and cash equivalents of $49M after funding the acquisitions
10 Non - GAAP Financial Measures The SEC has adopted rules to regulate the use in filings with the SEC and in public disclosures of financial measures not in accordance with U . S . GAAP, such as Adjusted EBITDA and the ratios related thereto . These measures are derived on the basis of methodologies other than in accordance with U . S . GAAP . The Company defines Adjusted EBITDA as EBITDA (consolidated net income before depreciation and amortization, interest expense, interest income and the provision for income taxes, each of which is presented in the unaudited condensed consolidated financial statements included in the Quarterly Report on Form 10 - Q) adjusted for the impact of the following items that the Company does not consider representative of its ongoing operating performance : loss or gain on sale or disposition of assets and sublease, loss on early extinguishment of debt, non - cash straight - line rent expense, professional fees and certain expenses incurred in connection with the IPO and subsequent secondary offering, acquisition related expenses and severance related expenses . Because Adjusted EBITDA omits certain non - cash items and other non - recurring cash charges or other items, the Company believes that it is less susceptible to variances that affect its operating performance resulting from depreciation, amortization and other non - cash and non - recurring cash charges or other items and is more reflective of other factors that affect its operating performance . The Company presents Adjusted EBITDA because the Company believes it is useful as a supplemental measure in evaluating the performance of the operating businesses and provides greater transparency into the Company’s results of operations . The Company’s management uses Adjusted EBITDA as a factor in evaluating the performance of the business . Adjusted EBITDA has limitations as an analytical tool, and you should not consider Adjusted EBITDA either in isolation or as a substitute for analyzing the Company’s results as reported under U . S . GAAP . Some of these limitations are : • this measure does not reflect changes in, or cash requirements for, the Company’s working capital needs ; • this measure does not reflect the Company’s interest expense, or the cash requirements necessary to service interest or principal payments on its debt ; • this measure does not reflect the Company’s income tax expense or the cash requirements to pay its taxes ; • this measure does not reflect historical cash expenditures or future requirements for capital expenditures or contractual commitments ; • this measure does not reflect the cash requirements to pay dividends to stockholders of the Company’s Class A common stock and tax and other cash distributions to its non - controlling unitholders ; • this measure does not reflect the cash requirements to pay RIHI Inc . and Oberndorf pursuant to the tax receivable agreements ; • although depreciation and amortization are non - cash charges, the assets being depreciated and amortized will often require replacement in the future, and these measures do not reflect any cash requirements for such replacements ; and • other companies may calculate this measure differently so they may not be comparable . Adjusted EBITDA margin represents Adjusted EBITDA as a percentage of Revenue. The Company is not able to provide a reconciliation of the Company’s non - GAAP financial guidance to the corresponding U . S . GAAP measures without unreasonable effort because of the uncertainty and variability of the nature and amount of these future charges and costs .