Attached files
| file | filename |
|---|---|
| EX-99.1 - FIRST QUARTER FISCAL 2017 PRESS RELEASE - BRADY CORP | exhibit991pressrelease1031.htm |
| 8-K - 8-K - BRADY CORP | form8-kxearningsrelease103.htm |

November 16, 2016
Brady Corporation
F’17 Q1 Financial Results

2 Forward-Looking Statements
In this presentation, statements that are not reported financial results or other historic information are “forward-looking
statements.” These forward-looking statements relate to, among other things, the Company's future financial position,
business strategy, targets, projected sales, costs, earnings, capital expenditures, debt levels and cash flows, and plans
and objectives of management for future operations.
The use of words such as “may,” “will,” “expect,” “intend,” “estimate,” “anticipate,” “believe,” “should,” “project” or “plan”
or similar terminology are generally intended to identify forward-looking statements. These forward-looking statements
by their nature address matters that are, to different degrees, uncertain and are subject to risks, assumptions, and other
factors, some of which are beyond Brady's control, that could cause actual results to differ materially from those
expressed or implied by such forward-looking statements. For Brady, uncertainties arise from: our ability to compete
effectively or to successfully execute our strategy; Brady’s ability to develop technologically advanced products that
meet customer demands; difficulties in protecting our websites, networks, and systems against security breaches;
deterioration or instability in the global economy and financial markets; decreased demand for our products; Brady’s
ability to retain large customers; risks associated with the loss of key employees; Brady’s ability to execute facility
consolidations and maintain acceptable operational service metrics; extensive regulations by U.S. and non-U.S.
governmental and self-regulatory entities; litigation, including product liability claims; divestitures and contingent liabilities
from divestitures; Brady’s ability to properly identify, integrate, and grow acquired companies; foreign currency
fluctuations; potential write-offs of Brady’s substantial intangible assets; changes in tax legislation and tax rates; differing
interests of voting and non-voting shareholders; Brady’s ability to meet certain financial covenants required by our debt
agreements; numerous other matters of national, regional and global scale, including those of a political, economic,
business, competitive, and regulatory nature contained from time to time in Brady’s U.S. Securities and Exchange
Commission filings, including, but not limited to, those factors listed in the “Risk Factors” section within Item 1A of Part I
of Brady’s Form 10-K for the year ended July 31, 2016.
These uncertainties may cause Brady's actual future results to be materially different than those expressed in its
forward-looking statements. Brady does not undertake to update its forward-looking statements except as required by
law.

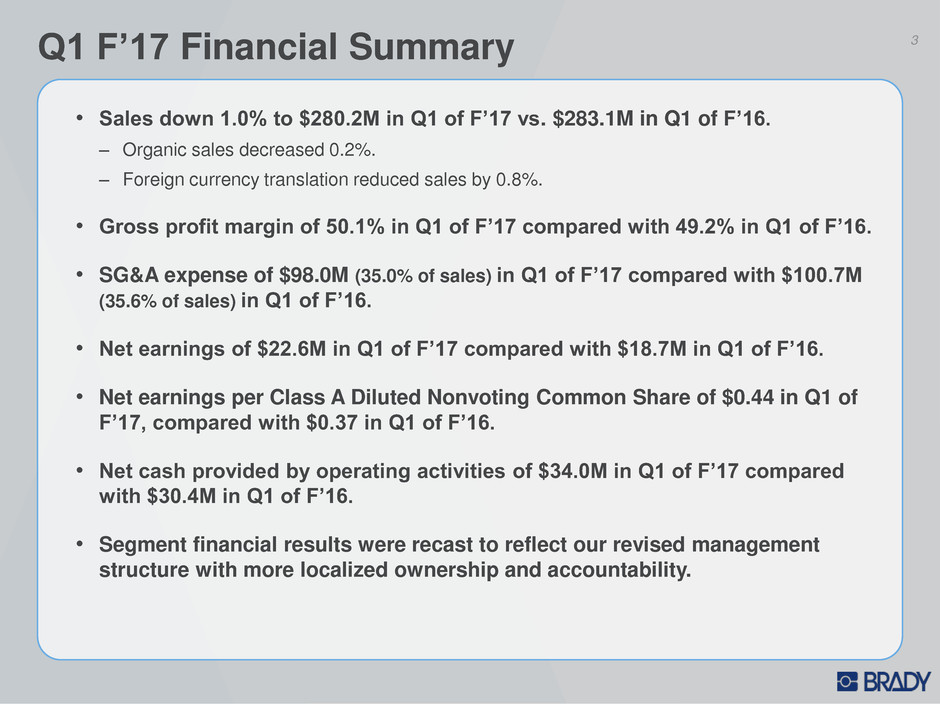
3 Q1 F’17 Financial Summary
• Sales down 1.0% to $280.2M in Q1 of F’17 vs. $283.1M in Q1 of F’16.
– Organic sales decreased 0.2%.
– Foreign currency translation reduced sales by 0.8%.
• Gross profit margin of 50.1% in Q1 of F’17 compared with 49.2% in Q1 of F’16.
• SG&A expense of $98.0M (35.0% of sales) in Q1 of F’17 compared with $100.7M
(35.6% of sales) in Q1 of F’16.
• Net earnings of $22.6M in Q1 of F’17 compared with $18.7M in Q1 of F’16.
• Net earnings per Class A Diluted Nonvoting Common Share of $0.44 in Q1 of
F’17, compared with $0.37 in Q1 of F’16.
• Net cash provided by operating activities of $34.0M in Q1 of F’17 compared
with $30.4M in Q1 of F’16.
• Segment financial results were recast to reflect our revised management
structure with more localized ownership and accountability.

4 Sales Overview
• (0.2%) organic sales decline:
• ID Solutions – Organic sales growth of 0.7%.
• Workplace Safety – Organic sales decline of
(2.5%).
• (0.8%) decrease due to currency translation.
Q1 F’17 SALES:
• Our healthcare and Asian IDS businesses experienced
low-single digit organic sales growth. Our European
WPS business continued to grow organically.
• Organic sales challenges persist in the U.S. and
Australia.
• Foreign currency translation headwinds persist.
Q1 F’17 SALES COMMENTARY:
$310
$283
$290 $289
$283
$269
$287
$282 $280
$200
$225
$250
$275
$300
$325
Q1 F'15
2.4%
Q2 F'15
1.4%
Q3 F'15
1.7%
Q4 F'15
(1.2%)
Q1 F'16
(2.2%)
Q2 F'16
0.4%
Q3 F'16
(0.1%)
Q4 F'16
(0.9%)
Q1 F'17
(0.2%)Organic Sales
Growth
SALES (millions of USD)

Gross Profit Margin 5
• GPM of 50.1% in Q1 of F’17 compared with 49.2% in Q1 of F’16.
• GPM improved due to ongoing efficiency gains throughout our global operations.
GROSS PROFIT MARGIN COMMENTARY:
$150
$138
$141
$129
$139
$133
$145
$141 $140
48% 49% 49%
45%
49% 49%
51%
50% 50%
25%
30%
35%
40%
45%
50%
$100
$125
$150
$175
Q1 F'15 Q2 F'15 Q3 F'15 Q4 F'15 Q1 F'16 Q2 F'16 Q3 F'16 Q4 F'16 Q1 F'17
GROSS PROFIT & GPM% (millions of USD)

SG&A Expense 6
• SG&A expense was down $2.7M to $98.0M in Q1 of F’17 compared to $100.7M in Q1 of F’16, continuing the general
downward trend.
• The ongoing declines in SG&A expense are a direct result of focused efforts on driving efficiencies across the
organization.
SG&A EXPENSE:
$109 $108
$103 $103 $101 $100
$106
$98 $98
35%
38%
35% 36% 36%
37% 37%
35% 35%
20%
25%
30%
35%
40%
$50
$75
$100
$125
$150
Q1 F'15 Q2 F'15 Q3 F'15 Q4 F'15 Q1 F'16 Q2 F'16 Q3 F'16 Q4 F'16 Q1 F'17
SG&A and SG&A% of SALES (millions of USD)

7 Net Earnings & EPS
* Net Earnings from Continuing Operations, Excluding Certain Items in F’15 and Net Earnings from Continuing
Operations Per Class A Diluted Share in F’15 are non-GAAP measures. See appendix.
• Q1 F’17 net earnings were $22.6M compared to $18.7M in Q1 of F’16.
• Increase in earnings trend driven by improved gross profit margins, efficiencies in operating expenses, and a reduced
income tax rate.
Q1 F’17 – NET EARNINGS & EPS:
$0.36
$0.29
$0.34
$0.28
$0.37
$0.30
$0.42
$0.49
$0.44
$0.00
$0.20
$0.40
$0.60
Q1 F'15 Q2 F'15 Q3 F'15 Q4 F'15 Q1 F'16 Q2 F'16 Q3 F'16 Q4 F'16 Q1 F'17
NET EARNINGS FROM CONTINUING OPERATIONS PER CLASS
A DILUTED SHARE, EXCLUDING CERTAIN ITEMS IN F’15*
$18
$15
$18
$14
$19
$15
$21
$25
$23
$0
$10
$20
$30
$40
Q1 F'15 Q2 F'15 Q3 F'15 Q4 F'15 Q1 F'16 Q2 F'16 Q3 F'16 Q4 F'16 Q1 F'17
NET EARNINGS FROM CONTINUING OPERATIONS,
EXCLUDING CERTAIN ITEMS IN F’15* (millions of USD)

8 Cash Generation & Uses
• Cash flow from operating activities was
$34.0M in Q1 of F’17 compared to
$30.4M in Q1 of F’16.
• Free cash flow* was $30.0M in Q1 of
F’17 compared to $28.0M in Q1 of F’16.
• Returned $10.4M to our shareholders in
the form of dividends in Q1 of F’17.
CASH FLOWS IN Q1 OF F’17:
* Free Cash Flow is calculated as Net Cash Provided by
Operating Activities less Capital Expenditures.
$26
$5
$29
$41
$30
$28
$40 $40
$34
$0
$10
$20
$30
$40
$50
Q1 F'15 Q2 F'15 Q3 F'15 Q4 F'15 Q1 F'16 Q2 F'16 Q3 F'16 Q4 F'16 Q1 F'17
Cash Flow from Operating Activities (millions of USD)
(millions of USD) 3 Mos. Ended
Oct. 31, 2016
3 Mos. Ended
Oct. 31, 2015
Cash Balance - Beginning of Period 141.2$ 114.5$
Cash Flow from perating Activities 34.0 30.4
Capital Expenditures (4.0) (2.3)
Repurchase of Stock - (16.2)
Dividends (10.4) (10.2)
Debt Repayments - Net 0.4 (2.7)
Effect of Exchange Rate on Cash (4.1) (2.6)
Other 9.2 (0.3)
Cash Balance - End of Period 166.3$ 110.6$

Net Debt & EBITDA 9
1.2
1.2
1.2 1.1 1.1
1.0
0.8
0.5
0.3
0.0x
0.5x
1.0x
1.5x
Q1 F'15 Q2 F'15 Q3 F'15 Q4 F'15 Q1 F'16 Q2 F'16 Q3 F'16 Q4 F'16 Q1 F'17
NET DEBT / TTM EBITDA*
• October 31, 2016 Cash = $166.3M, Debt = $216.0M, and TTM EBITDA = $151.3M.
• Net Debt/EBITDA* = 0.3 to 1.
• Net debt declined by $26.0M from $75.7M at July 31, 2016 to $49.7M at October 31, 2016.
• Balance sheet provides flexibility for future cash uses.
STRONG BALANCE SHEET:
* EBITDA is a non-GAAP measure. See appendix for the reconciliation of net earnings to EBITDA.
$174
$184
$168
$139 $140
$132
$101
$76
$50
$0
$50
$100
$150
$200
$250
Q1 F'15 Q2 F'15 Q3 F'15 Q4 F'15 Q1 F'16 Q2 F'16 Q3 F'16 Q4 F'16 Q1 F'17
NET DEBT (millions of USD)

10 Full Year F’17 Guidance Unchanged
F’17 Diluted EPS $1.55 to $1.70
Guidance Assumptions:
• Low single digit organic sales declines to slight organic sales growth.
• Full-year depreciation and amortization expense of approximately $30M.
• Full-year income tax rate ranging from 27% to 29%.
• Full-year capital expenditures of approximately $25M.

IDENTIFICATION SOLUTIONS – FINANCIAL PERFORMANCE SUMMARY (millions of USD)
11 Segment Financial Results – Recast
Q1 F’17 Q1 F’16 Q2 F’16 Q3 F’16 Q4 F’16
Full Year
F’16
Sales $ 201.3 $ 201.0 $ 189.8 $ 201.5 $ 203.2 $ 795.5
Organic Sales % 0.7% (2.2%) 0.9% (0.9%) (0.6%) (0.7%)
Segment Profit $ 33.1 $ 25.4 $ 23.1 $ 31.9 $ 31.9 $ 112.3
Segment Profit % of Sales 16.4% 12.7% 12.1% 15.8% 15.7% 14.1%
WORKPLACE SAFETY – FINANCIAL PERFORMANCE SUMMARY (millions of USD)
COMMENTARY
Q1 F’17 Q1 F’16 Q2 F’16 Q3 F’16 Q4 F’16
Full Year
F’16
Sales $ 78.9 $ 82.1 $ 78.9 $ 85.3 $ 78.8 $ 325.1
Organic Sales % (2.5%) (2.2%) (0.6%) 1.7% (1.8%) (0.7%)
Segment Profit $ 6.5 $ 9.4 $ 6.3 $ 6.0 $ 9.1 $ 30.8
Segment Profit % of Sales 8.2% 11.4% 8.0% 7.0% 11.5% 9.5%
Segment Financial Results were recast to reflect the following changes:
• Certain businesses were realigned between our WPS and IDS segments as we adjusted reporting responsibilities to
better match our strategy. This resulted in a relatively small decrease in our WPS revenues and an equal increase in
our IDS revenues.
• Our internal measure of segment profitability includes certain general and administrative expenses related to supporting
the business as part of our continued drive for increased local ownership and accountability.

Q1 F’17 vs. Q1 F’16 PERFORMANCE (millions of USD)
12 Identification Solutions
• All historical amounts have been recast to reflect the
revised segment definitions.
• Revenues up 0.1%:
• Organic = + 0.7%
• Fx = - (0.6)%
• Organic sales growth in healthcare and Asia-based
businesses.
• Organic sales declined in the U.S. and Europe.
Order patterns have not shown signs of
strengthening in the U.S.
• Segment profit as a percent of sales increased as a
result of ongoing operational improvements and the
management of operating expenses.
Q1 F’17 SUMMARY:
• Expect low-single digit organic sales declines to slight
organic growth in F’17.
• Expect segment profit to continue to be in the mid-
teens as a percent of sales in F’17.
OUTLOOK UNCHANGED:
Q1 F’17 Q1 F’16 Change
Sales $ 201.3 $ 201.0 + 0.1%
Segment Profit 33.1 25.4 + 30.0%
Segment Profit % 16.4% 12.7% + 3.7 pts
$201
$190
$201
$203
$201
13% 12%
16%
16%
16%
10%
12%
14%
16%
18%
20%
$180
$185
$190
$195
$200
$205
$210
Q1 F'16 Q2 F'16 Q3 F'16 Q4 F'16 Q1 F'17
SALES & SEGMENT PROFIT % (millions of USD)

Q1 F’17 vs. Q1 F’16 PERFORMANCE (millions of USD)
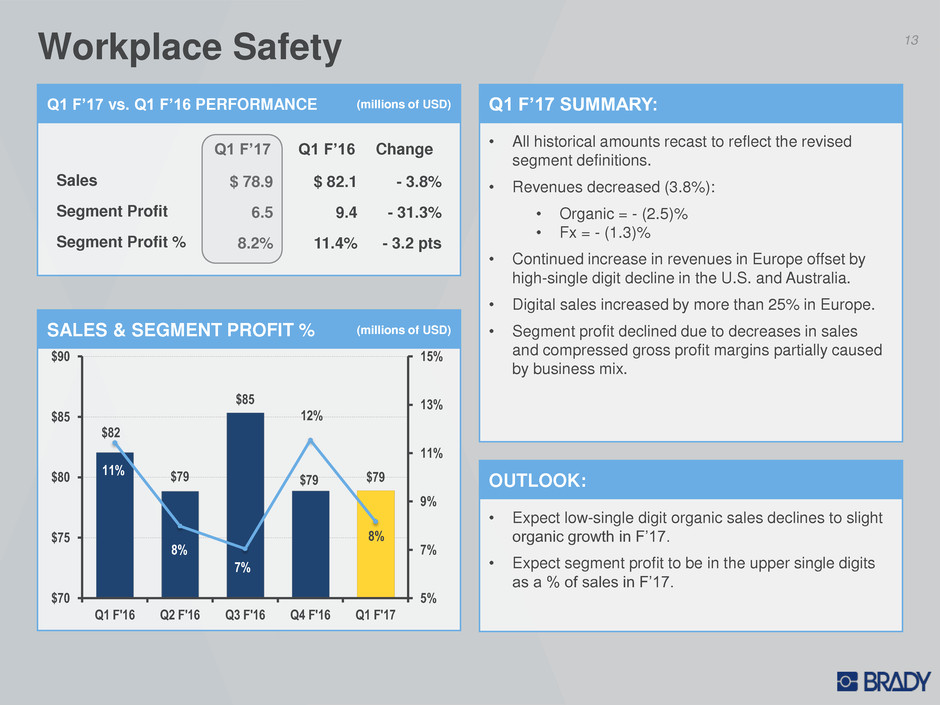
13 Workplace Safety
• All historical amounts recast to reflect the revised
segment definitions.
• Revenues decreased (3.8%):
• Organic = - (2.5)%
• Fx = - (1.3)%
• Continued increase in revenues in Europe offset by
high-single digit decline in the U.S. and Australia.
• Digital sales increased by more than 25% in Europe.
• Segment profit declined due to decreases in sales
and compressed gross profit margins partially caused
by business mix.
Q1 F’17 SUMMARY:
• Expect low-single digit organic sales declines to slight
organic growth in F’17.
• Expect segment profit to be in the upper single digits
as a % of sales in F’17.
OUTLOOK:
Q1 F’17 Q1 F’16 Change
Sales $ 78.9 $ 82.1 - 3.8%
Segment Profit 6.5 9.4 - 31.3%
Segment Profit % 8.2% 11.4% - 3.2 pts
$82
$79
$85
$79 $79
11%
8%
7%
12%
8%
5%
7%
9%
11%
13%
15%
$70
$75
$80
$85
$90
Q1 F'16 Q2 F'16 Q3 F'16 Q4 F'16 Q1 F'17
SALES & SEGMENT PROFIT % (millions of USD)

14 Investor Relations
Brady Contact:
Ann Thornton
Investor Relations
414-438-6887
Ann_Thornton@bradycorp.com
See our web site at
www.bradycorp.com

Appendix
15

COMPARABLE INCOME STATEMENTS (millions of USD)
16 Comparable Income Statements
2016 2015 Change
Sales 280.2$ 283.1$ (2.9)$
Gross Margin 140.4 139.3 1.1
% of Sales 50.1% 49.2%
Research and Development (9.2) (8.6) (0.6)
Selling, General and Admin. (98.0) (100.6) 2.6
% of Sales (35.0%) 35.6% (0.6) pts
- - -
Operating Income 33.2 30.1 3.1
Interest and Other (2.2) (2.9) 0.7
Income Taxes (8.4) (8.5) 0.1 - - -
Net Earnings 22.6$ 18.7$ 3.9$ - - -
% of Sales 8.1% 6.6% 1.5 pts
Net Earnings per Class A Nonvoting
Common Share 0.44$ 0.37$ 0.07$ - - -
Three Months Ended October 31, -

(‘000s of USD)
17 Debt Structure
October 31, 2016
Balance
July 31, 2016
Balance
Revolver Borrowings:
USD-denominated 1.33% Variable 112,000$ 112,000$
China Borrowings:
USD & CNY-denominated notes payable 4.19% Variable 5,354 4,928
Private Placements:
USD-denominated 2006 Series 5.30% Fixed - -
USD-denominated 2007 Series 5.33% Fixed 16,350 16,334
EUR-denominated 2010 Series (7-yr.) 3.71% Fixed 32,949 33,510
EUR-denominated 2010 Series (10-yr.) 4.24% Fixed 49,309 50,138
TOTAL DEBT 215,962$ 216,910$
Interest Rate

Brady is presenting EBITDA because it is used by many of our investors and lenders, and is presented as a convenience to them. EBITDA represents net earnings
before interest expense, income taxes, depreciation, amortization and impairment charges. EBITDA is not a calculation based on generally accepted accounting
principles ("GAAP"). The amounts included in the EBITDA calculation, however, are derived from amounts included in the Consolidated Statements of Earnings
data. EBITDA should not be considered as an alternative to net earnings or operating income as an indicator of the Company's operating performance, or as an
alternative to net cash provided by operating activities as a measure of liquidity. The EBITDA measure presented may not always be comparable to similarly titled
measures reported by other companies due to differences in the components of the calculation.
EBITDA (‘000s of USD)
18 EBITDA Reconciliation
Q1 Q2 Q3 Q4 Total
22,553$ 22,553$
Interest expense 1,732 1,732
Income taxes 8,434 8,434
Depreciation and amortization 7,234 7,234
39,953$ -$ -$ -$ 39,953$
Q1 Q2 Q3 Q4 Total
18,703$ 15,290$ 20,981$ 25,136$ 80,110$
Interest expense 2,151 2,130 1,838 1,705 7,824
Income taxes 8,489 5,177 8,686 6,883 29,235
Depreciation and amortization 8,889 8,613 7,394 7,536 32,432
38,232$ 31,210$ 38,899$ 41,260$ 149,601$ EBITDA (non-GAAP measure)
Fiscal 2016
EBITDA:
N t earnings
EBITDA (non-GAAP measure)
Fiscal 2017
EBITDA:
Net earnings

Brady is presenting the Non-GAAP measures "Net Earnings from Continuing Operations Excluding Certain Items“ and “Net Earnings from Continuing Operations
Per Diluted Class A Nonvoting Common Share Excluding Certain Items.” These are not calculations based upon GAAP. The amounts included in these Non-
GAAP measures are derived from amounts included in the Consolidated Financial Statements and supporting footnote disclosures. We do not view these items to
be part of our sustainable results. We believe these measures provide an important perspective of underlying business trends and results and provide more
comparable measures from year to year. The tables below provide reconciliations of Net Earnings from Continuing Operations to Net Earnings from Continuing
Operations Excluding Certain Items, and Net Earnings from Continuing Operations Per Diluted Class A Nonvoting Common Share to Net Earnings from Continuing
Operations Per Diluted Class A Nonvoting Common Share Excluding Certain Items.
Reconciliations of F’15 Non-GAAP Net Earnings from Continuing Operations (‘000s of USD)
19 Non-GAAP Reconciliations
Year ended
October 31, 2014 January 31, 2015 April 30, 2015 July 31, 2015 July 31, 2015
15,499$ 11,584$ 17,213$ (39,394)$ 4,902$
R structuring charges 2,947 3,445 3,198 2,158 11,743
I pairment charges - - - 46,867 46,867
Other non-routine charges - - - 4,757 4,757
Postretirement benefit plan curtailment gain - - (2,792) - (2,792)
18,446$ 15,029$ 17,619$ 14,388$ 65,477$
N E gs (Loss) from Continuing Operations (GAAP measure)
Three months ended
Net Earnings fro Continuing Operations Excludi g Certain Items
( on-GAAP measure)
Year ended
October 31, 2014 January 31, 2015 April 30, 2015 July 31, 2015 July 31, 2015
$ 0.30 $ 0.23 $ 0.33 $ (0. 7) $ 0.10
Restructuring charges 0.0 0.07 0.06 0.04 0.23
Impairment charges - - - 0.91 0.91
Other non-routine charges - - - 0.09 0.09
Postretirement benefit plan curtailment gain - - (0.05) - (0.05)
Nonvoting Common Share Excluding Certain Items (non-GAAP measure) 0.36$ 0.29$ 0.34$ 0.28$ 1.27$
Three months ended
Nonvoting Common Share (GAAP mea ure)
Net Earnings fro Continuing Operations Per Diluted Class
Net Earnings (Loss) from Continuing Operations Per Diluted Class A
