Attached files
| file | filename |
|---|---|
| 8-K - FORM 8-K - FTI CONSULTING, INC | d278497d8k.htm |
| Exhibit 99.1
|
FTI Consulting, Inc.
Current Investor Presentation
November 2016
|
|
Cautionary Note About Forward Looking Statements
This presentation includes “forward looking statements” within the meaning of Section 27A of the Securities Act of 1933, as amended, and Section 21E of the Securities Exchange Act of 1934, as amended, which involve uncertainties and risks. Forward looking statements include statements concerning our plans, objectives, goals, strategies, future events, future revenues, future results and performance, expectations, plans or intentions relating to acquisitions and other matters, business trends and other information that is not historical, including statements regarding estimates of our medium term growth targets or other future financial results. When used in this presentation, words such as “anticipates,” “estimates,” “expects,” “goals,” “intends,” “believes,” “forecasts,” “targets,” “objectives” and variations of such words or similar expressions are intended to identify forward looking statements. All forward looking statements, including, without limitation, estimates of our medium term growth targets and our future financial results, are based upon our expectations at the time we make them and various assumptions. Our expectations, beliefs, projections and growth targets are expressed in good faith, and we believe there is a reasonable basis for them. However, there can be no assurance that management’s expectations, beliefs, estimates or growth targets will be achieved, and the Company’s actual results may differ materially from our expectations, beliefs, estimates and growth targets. The Company has experienced fluctuating revenues, operating income and cash flow in prior periods and expects that this will occur from time to time in the future. Other factors that could cause such differences include declines in demand for, or changes in, the mix of services and products that we offer, the mix of the geographic locations where our clients are located or where services are performed, adverse financial, real estate or other market and general economic conditions, which could impact each of our segments differently, the pace and timing of the consummation and integration of past and future acquisitions, the Company’s ability to realize cost savings and efficiencies, competitive and general economic conditions, retention of staff and clients and other risks described under the heading “Item 1A Risk Factors” in the Company’s most recent Form 10 K filed with the SEC and in the Company’s other filings with the SEC, including the risks set forth under “Risks Related to Our Reportable Segments” and “Risks Related to Our Operations.” We are under no duty to update any of the forward looking statements to conform such statements to actual results or events and do not intend to do so.
2
|
|
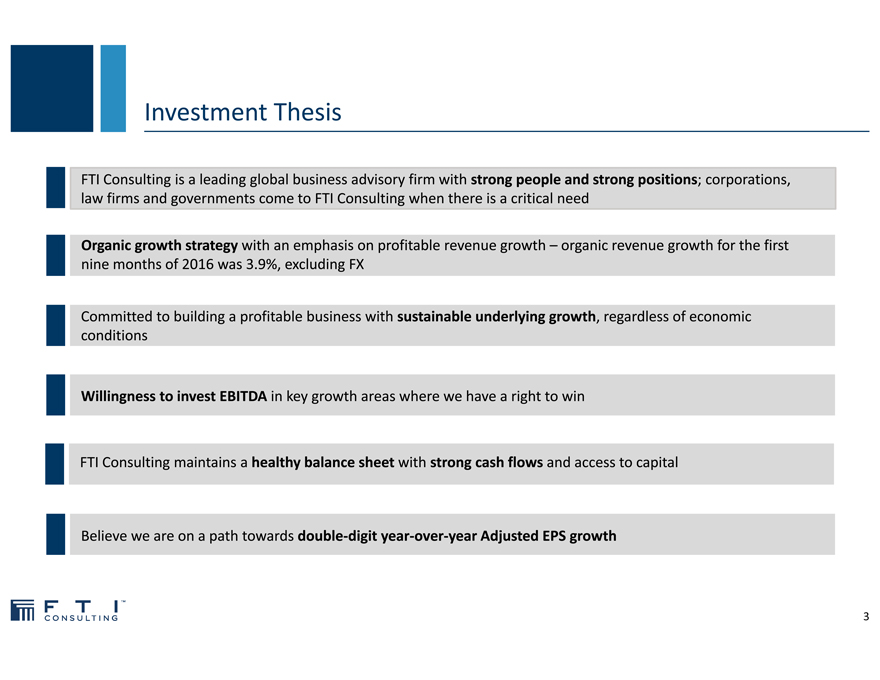
Investment Thesis
FTI Consulting is a leading global business advisory firm with strong people and strong positions; corporations,
law firms and governments come to FTI Consulting when there is a critical need
Organic growth strategy with an emphasis on profitable revenue growth – organic revenue growth for the first nine months of 2016 was 3.9%, excluding FX
Committed to building a profitable business with sustainable underlying growth, regardless of economic conditions
Willingness to invest EBITDA in key growth areas where we have a right to win
FTI Consulting maintains a healthy balance sheet with strong cash flows and access to capital
Believe we are on a path towards double?digit year?over?year Adjusted EPS growth
3
|
|
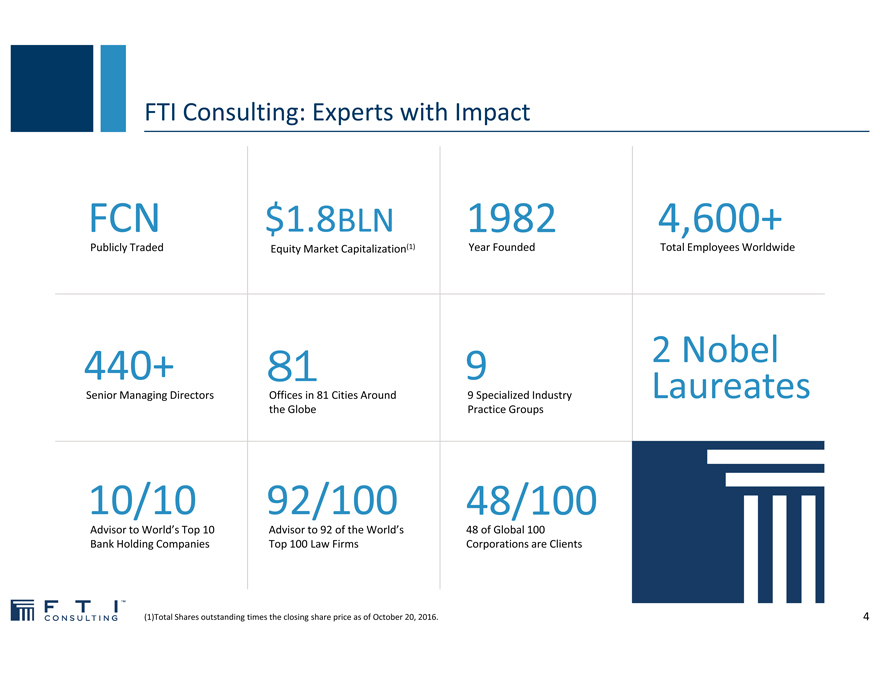
FTI Consulting: Experts with Impact
FCN $1.8BLN 1982 4,600+
Publicly Traded Equity Market Capitalization(1) Year Founded Total Employees Worldwide
440+ 81 9 2 Nobel
Senior Managing Directors Offices in 81 Cities Around 9 Specialized Industry Laureates the Globe Practice Groups
10/10 92/100 48/100
Advisor to World’s Top 10 Advisor to 92 of the World’s 48 of Global 100 Bank Holding Companies Top 100 Law Firms Corporations are Clients
(1)Total Shares outstanding times the closing share price as of October 20, 2016.
4
|
|
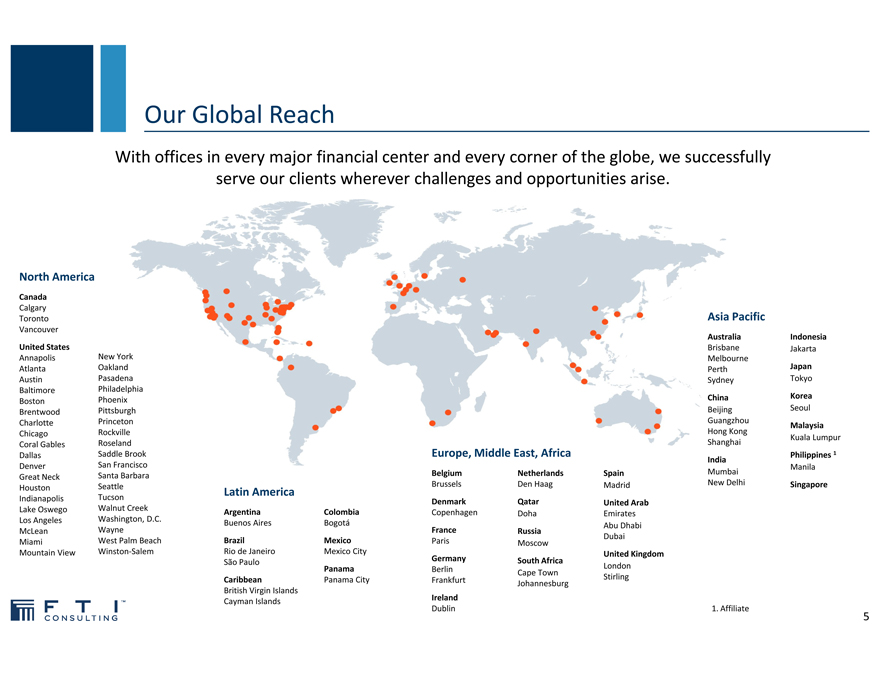
Our Global Reach
With offices in every major financial center and every corner of the globe, we successfully serve our clients wherever
challenges and opportunities arise.
North America
Canada
Calgary
Toronto Asia Pacific
Vancouver
AustraliaIndonesia
United States BrisbaneJakarta
Annapolis New York Melbourne
Atlanta Oakland PerthJapan
Austin Pasadena SydneyTokyo
Baltimore Philadelphia
Boston Phoenix ChinaKorea
Brentwood Pittsburgh BeijingSeoul
Charlotte Princeton GuangzhouMalaysia
Chicago Rockville Hong Kong Kuala Lumpur
Coral Gables Roseland Shanghai
Dallas Saddle Brook Europe, Middle East, AfricaPhilippines 1
India
Denver San Francisco Manila
Great Neck Santa Barbara BelgiumNetherlandsSpainMumbai
Houston Seattle BrusselsDen HaagMadridNew DelhiSingapore
Latin America
Indianapolis Tucson DenmarkQatarUnited Arab
Lake Oswego Walnut Creek ArgentinaColombiaCopenhagenDohaEmirates
Los Angeles Washington, D.C. Buenos AiresBogotá
McLean Wayne FranceRussiaAbu Dhabi
Miami West Palm Beach BrazilMexicoParisMoscowDubai
Mountain View Winston?Salem Rio de Janeiro Mexico CityUnited Kingdom
São PauloGermanySouth Africa
PanamaBerlinLondon
Cape Town
CaribbeanPanama CityFrankfurtStirling
Johannesburg
British Virgin Islands
Cayman IslandsIreland
Dublin1. Affiliate
5
|
|
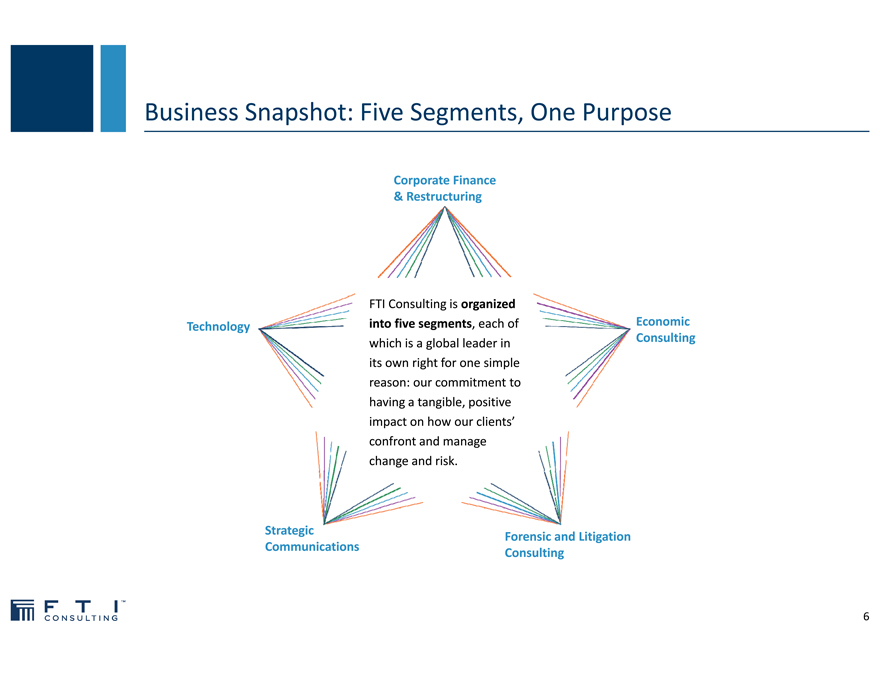
Business Snapshot: Five Segments, One Purpose
Corporate Finance
& Restructuring
FTI Consulting is organized
Technology into five segments, each ofEconomic
which is a global leader inConsulting
its own right for one simple
reason: our commitment to
having a tangible, positive
impact on how our clients’
confront and manage
change and risk.
Strategic Forensic and Litigation
Communications Consulting
6
|
|
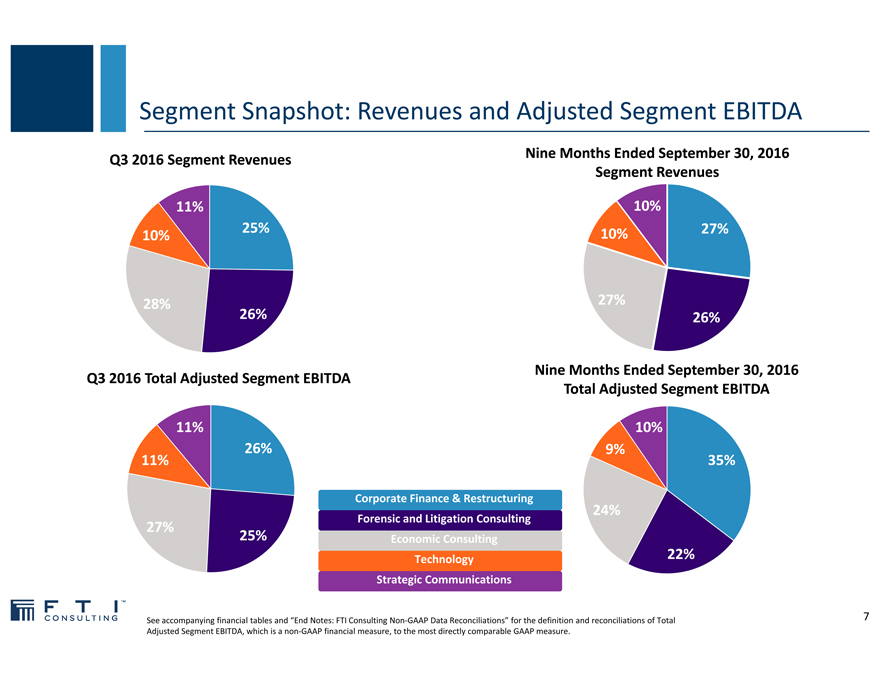
Segment Snapshot: Revenues and Adjusted Segment EBITDA
Q3 2016 Segment Revenues Nine Months Ended September 30, 2016
Segment Revenues
11% 10%
10% 25% 10%27%
28% 27%
26% 26%
Q3 2016 Total Adjusted Segment EBITDA Nine Months Ended September 30, 2016
Total Adjusted Segment EBITDA
11% 10%
26% 9%
11% 35%
Corporate Finance & Restructuring
24%
Forensic and Litigation Consulting
27%
25% Economic Consulting
Technology22%
Strategic Communications
See accompanying financial tables and “End Notes: FTI Consulting Non?GAAP Data Reconciliations” for the definition and reconciliations of Total Adjusted Segment EBITDA, which is a non?GAAP financial measure, to the most directly comparable GAAP measure.
7
|
|

Segment Overview
|
|
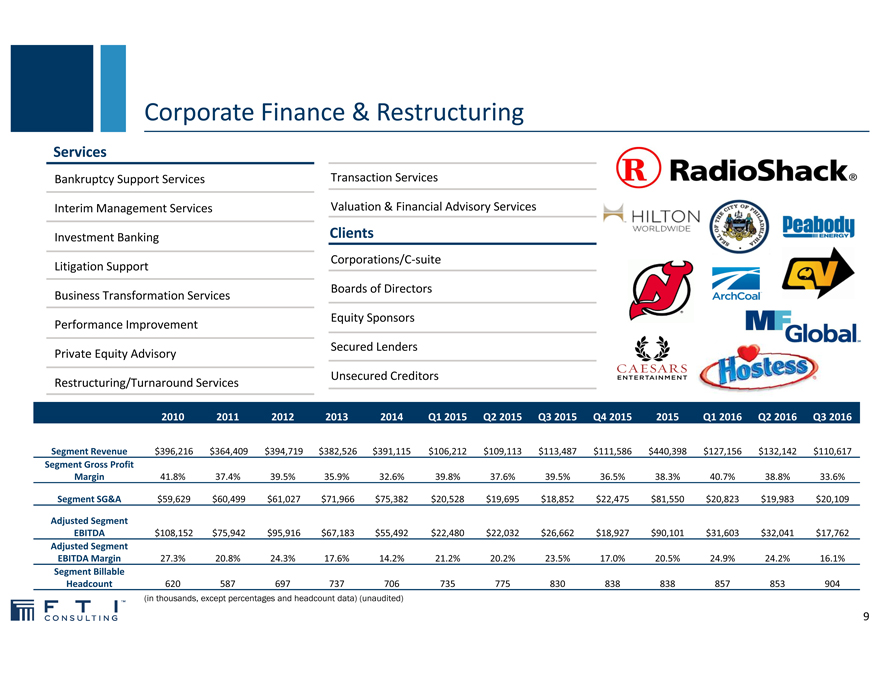
Corporate Finance & Restructuring
Services
Bankruptcy Support Services Transaction Services
Interim Management Services Valuation & Financial Advisory Services
Investment Banking Clients
Litigation Support Corporations/C?suite
Business Transformation Services Boards of Directors
Performance Improvement Equity Sponsors
Private Equity Advisory Secured Lenders
Restructuring/Turnaround Services Unsecured Creditors
2010 2011201220132014Q1 2015Q2 2015Q3 2015Q4 20152015Q1 2016Q2 2016Q3 2016
Segment Revenue $396,216 $364,409 $394,719 $382,526 $391,115$106,212$109,113$113,487$111,586$440,398$127,156$132,142$110,617
Segment Gross Profit
Margin 41.8% 37.4%39.5%35.9%32.6%39.8%37.6%39.5%36.5%38.3%40.7%38.8%33.6%
Segment SG&A $59,629 $60,499 $61,027 $71,966 $75,382$20,528$19,695$18,852$22,475$81,550$20,823$19,983$20,109
Adjusted Segment
EBITDA $108,152 $75,942 $95,916 $67,183 $55,492$22,480$22,032$26,662$18,927$90,101$31,603$32,041$17,762
Adjusted Segment
EBITDA Margin 27.3% 20.8%24.3%17.6%14.2%21.2%20.2%23.5%17.0%20.5%24.9%24.2%16.1%
Segment Billable
Headcount 620 587697737706735775830838838857853904
(in thousands, except percentages and headcount data) (unaudited)
9
|
|
Corporate Finance & Restructuring (continued)
Segment Offering
The Corporate Finance & Restructuring segment focuses on
strategic, operational, financial and capital needs of
businesses by addressing the full spectrum of financial and
transactional challenges faced by companies, boards,
private equity sponsors, creditor constituencies and other
stakeholders.
Medium–Term Initiatives
Reinforce core positions e.g., TMT, company?side, interim
management, creditor rights
Drive organic growth in new/adjacent businesses where we
have the right to win, e.g., EMEA restructuring, performance
improvement, carve?out
Drive overseas bets to fruition e.g., EMEA transaction
advisory services, EMEA Tax
Focus on profitability enhancements cost control,
engagement profitability improvements
Q3 2016 Key Financial Commentary
Revenues decreased $2.9 million, or 2.5%, to $110.6 million for
the three months ended September 30, 2016, which included a
1.6% estimated negative impact from FX. Excluding the estimated
impact of FX, revenues decreased by $1.0 million, or 0.9%
compared to the prior year quarter.
Gross profit decreased $7.7 million, or 17.1%, to $37.2 million for
the three months ended September 30, 2016.
Gross profit margin decreased 5.9 percentage points for the three
months ended September 30, 2016. The decrease was primarily
due to lower utilization and higher costs related to the ramp up of
experienced hires, which contributed to 5.2 percentage points of
the gross profit margin decrease.
Adjusted Segment EBITDA for the quarter was $17.8 million, or
16.1 percent of segment revenues, compared to $26.7 million, or
23.5 percent of segment revenues, in the prior year quarter.
10
|
|
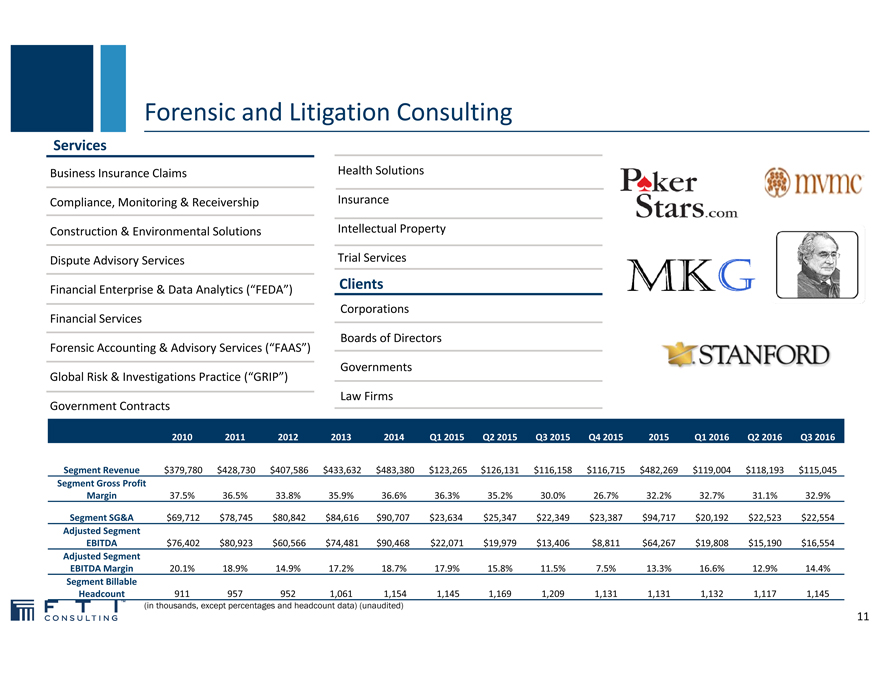
Forensic and Litigation Consulting
Services
Business Insurance Claims Health Solutions
Compliance, Monitoring & Receivership Insurance
Construction & Environmental Solutions Intellectual Property
Dispute Advisory Services Trial Services
Financial Enterprise & Data Analytics (“FEDA”) Clients
Corporations
Financial Services
Boards of Directors
Forensic Accounting & Advisory Services (“FAAS”)
Governments
Global Risk & Investigations Practice (“GRIP”)
Law Firms
Government Contracts
20102011201220132014Q1 2015Q2 2015Q3 2015Q4 20152015Q1 2016Q2 2016Q3 2016
Segment Revenue $379,780 $428,730 $407,586 $433,632 $483,380$123,265$126,131$116,158$116,715$482,269$119,004$118,193$115,045
Segment Gross Profit
Margin 37.5%36.5%33.8%35.9%36.6%36.3%35.2%30.0%26.7%32.2%32.7%31.1%32.9%
Segment SG&A $69,712 $78,745 $80,842 $84,616 $90,707$23,634$25,347$22,349$23,387$94,717$20,192$22,523$22,554
Adjusted Segment
EBITDA $76,402 $80,923 $60,566 $74,481 $90,468$22,071$19,979$13,406$8,811$64,267$19,808$15,190$16,554
Adjusted Segment
EBITDA Margin 20.1%18.9%14.9%17.2%18.7%17.9%15.8%11.5%7.5%13.3%16.6%12.9%14.4%
Segment Billable
Headcount 9119579521,0611,1541,1451,1691,2091,1311,1311,1321,1171,145
(in thousands, except percentages and headcount data) (unaudited)
11
|
|
Forensic and Litigation Consulting (continued)
Segment Offering
The Forensic and Litigation Consulting segment provides a
complete range of multidisciplinary, independent dispute
advisory, investigative, data acquisition/analysis and
forensic accounting services. Our professionals combine
end-to-end capabilities when clients face high stakes
litigation, arbitration and compliance investigations and
regulatory scrutiny.
Medium–Term Initiatives
Reinvest behind core areas of strength e.g., FAAS, FEDA,
GRIP
Grow key regions where we have a right to win in e.g., with
a focus in construction & environmental solutions
Invest behind people to expand key businesses e.g.,
insurance, geopolitical intelligence
Q3 2016 Key Financial Commentary
Revenues decreased $1.1 million, or 1.0%, to $115.0 million for the
three months ended September 30, 2016 as higher success fees
were offset by lower demand in the segment’s health solutions
practice. Excluding the estimated impact of FX, revenues were flat
compared to the prior year quarter.
Gross profit increased $3.1 million, or 8.8%, to $37.9 million for the
three months ended September 30, 2016.
Gross profit margin increased 2.9 percentage points for the three
months ended September 30, 2016. This increase was primarily
due to higher success fees realized in the segment’s health
solutions practice.
Adjusted Segment EBITDA was $16.6 million, or 14.4 percent of
segment revenues, compared to $13.4 million, or 11.5 percent of
segment revenues, in the prior year quarter.
12
|
|
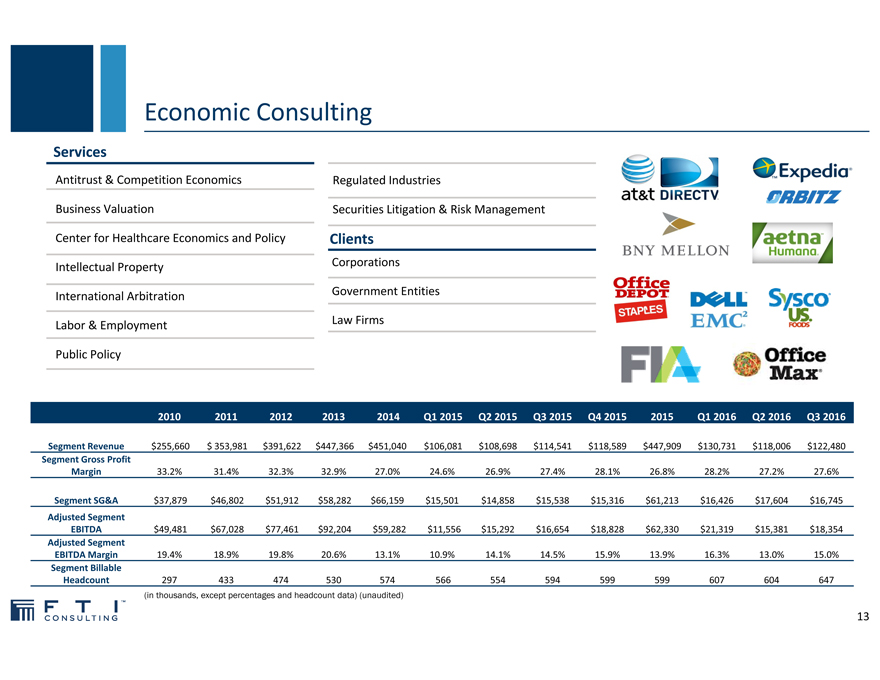
Economic Consulting
Services
Antitrust & Competition Economics Regulated Industries
Business Valuation Securities Litigation & Risk Management
Center for Healthcare Economics and Policy Clients
Intellectual Property Corporations
International Arbitration Government Entities
Labor & Employment Law Firms
Public Policy
2010 2011201220132014Q1 2015Q2 2015Q3 2015Q4 20152015Q1 2016Q2 2016Q3 2016
Segment Revenue $255,660 $ 353,981 $391,622 $447,366 $451,040$106,081$108,698$114,541$118,589$447,909$130,731$118,006$122,480
Segment Gross Profit
Margin 33.2% 31.4%32.3%32.9%27.0%24.6%26.9%27.4%28.1%26.8%28.2%27.2%27.6%
Segment SG&A $37,879 $46,802 $51,912 $58,282 $66,159$15,501$14,858$15,538$15,316$61,213$16,426$17,604$16,745
Adjusted Segment
EBITDA $49,481 $67,028 $77,461 $92,204 $59,282$11,556$15,292$16,654$18,828$62,330$21,319$15,381$18,354
Adjusted Segment
EBITDA Margin 19.4% 18.9%19.8%20.6%13.1%10.9%14.1%14.5%15.9%13.9%16.3%13.0%15.0%
Segment Billable
Headcount 297 433474530574566554594599599607604647
(in thousands, except percentages and headcount data) (unaudited)
13
|
|
Economic Consulting (continued)
Segment Offering
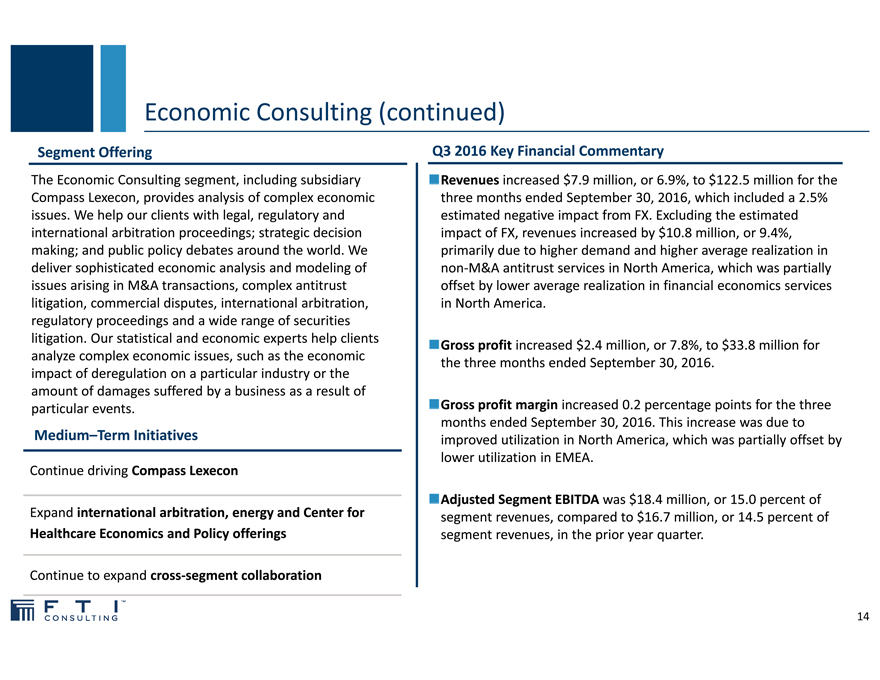
The Economic Consulting segment, including subsidiary Compass Lexecon, provides analysis of complex economic issues. We help our clients with legal, regulatory and international arbitration proceedings; strategic decision making; and public policy debates around the world. We
deliver sophisticated economic analysis and modeling of
issues arising in M&A transactions, complex antitrust
litigation, commercial disputes, international arbitration,
regulatory proceedings and a wide range of securities
litigation. Our statistical and economic experts help clients
analyze complex economic issues, such as the economic
impact of deregulation on a particular industry or the
amount of damages suffered by a business as a result of
particular events.
Medium–Term Initiatives
Continue driving Compass Lexecon
Expand international arbitration, energy and Center for
Healthcare Economics and Policy offerings
Continue to expand cross-segment collaboration
Q3 2016 Key Financial Commentary
Revenues increased $7.9 million, or 6.9%, to $122.5 million for the
three months ended September 30, 2016, which included a 2.5%
estimated negative impact from FX. Excluding the estimated
impact of FX, revenues increased by $10.8 million, or 9.4%,
primarily due to higher demand and higher average realization in
non-M&A antitrust services in North America, which was partially
offset by lower average realization in financial economics services
in North America.
Gross profit increased $2.4 million, or 7.8%, to $33.8 million for
the three months ended September 30, 2016.
Gross profit margin increased 0.2 percentage points for the three
months ended September 30, 2016. This increase was due to
improved utilization in North America, which was partially offset by
lower utilization in EMEA.
Adjusted Segment EBITDA was $18.4 million, or 15.0 percent of
segment revenues, compared to $16.7 million, or 14.5 percent of
segment revenues, in the prior year quarter.
14
|
|
Technology
Software & Services Clients
Computer Forensics & Investigations Corporations
Discovery Consulting Government Agencies
Ediscovery Software & Services Law Firms
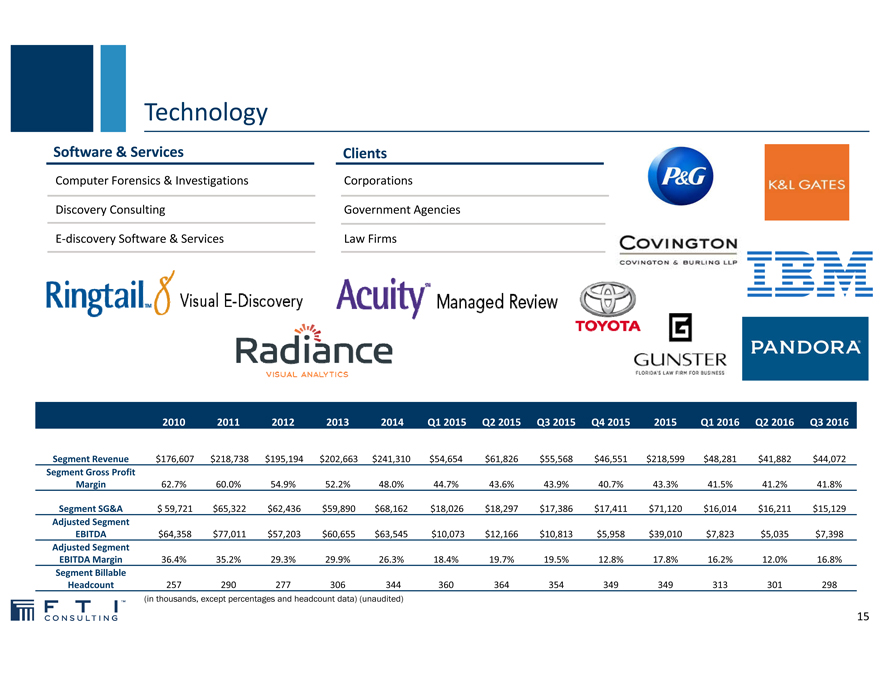
2010 2011201220132014Q1 2015Q2 2015 Q3 2015Q4 20152015Q1 2016Q2 2016Q3 2016
Segment Revenue $176,607 $218,738 $195,194 $202,663 $241,310$54,654$61,826$55,568$46,551$218,599$48,281$41,882$44,072
Segment Gross Profit
Margin 62.7% 60.0%54.9%52.2%48.0%44.7%43.6%43.9%40.7%43.3%41.5%41.2%41.8%
Segment SG&A $ 59,721 $65,322 $62,436 $59,890 $68,162$18,026$18,297$17,386$17,411$71,120$16,014$16,211$15,129
Adjusted Segment
EBITDA $64,358 $77,011 $57,203 $60,655 $63,545$10,073$12,166$10,813$5,958$39,010$7,823$5,035$7,398
Adjusted Segment
EBITDA Margin 36.4% 35.2%29.3%29.9%26.3%18.4%19.7%19.5%12.8%17.8%16.2%12.0%16.8%
Segment Billable
Headcount 257 290277306344360364354349349313301298
(in thousands, except percentages and headcount data) (unaudited)
15
|
|
Technology (continued)
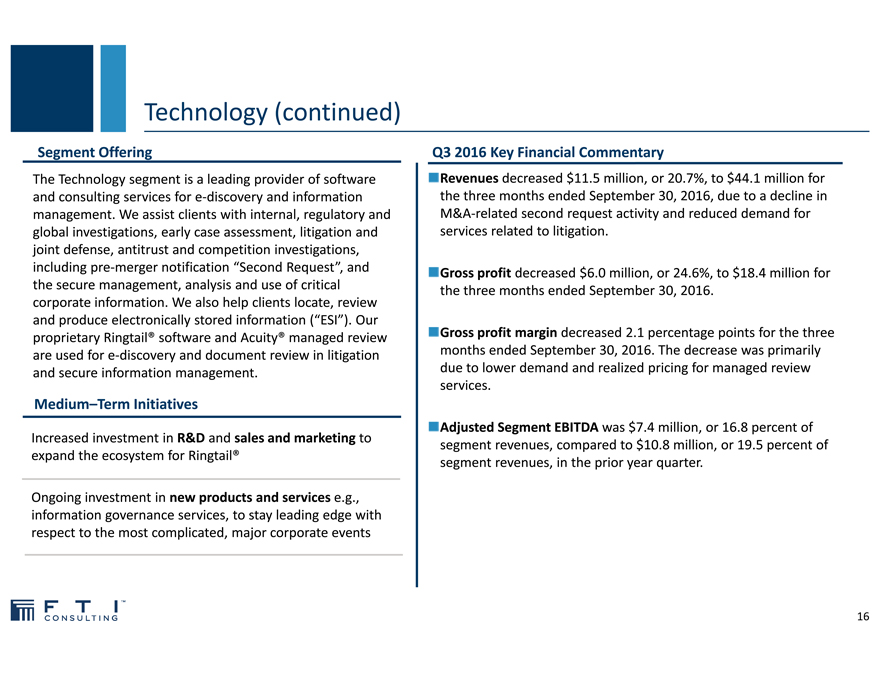
Segment Offering
The Technology segment is a leading provider of software
and consulting services for e-discovery and information
management. We assist clients with internal, regulatory and
global investigations, early case assessment, litigation and
joint defense, antitrust and competition investigations,
including pre-merger notification “Second Request”, and
the secure management, analysis and use of critical
corporate information. We also help clients locate, review
and produce electronically stored information (“ESI”). Our
proprietary Ringtail® software and Acuity® managed review
are used for e-discovery and document review in litigation
and secure information management.
Medium–Term Initiatives
Increased investment in R&D and sales and marketing to
expand the ecosystem for Ringtail®
Ongoing investment in new products and services e.g.,
information governance services, to stay leading edge with
respect to the most complicated, major corporate events
Q3 2016 Key Financial Commentary
Revenues decreased $11.5 million, or 20.7%, to $44.1 million for
the three months ended September 30, 2016, due to a decline in
M&A-related second request activity and reduced demand for
services related to litigation.
Gross profit decreased $6.0 million, or 24.6%, to $18.4 million for
the three months ended September 30, 2016.
Gross profit margin decreased 2.1 percentage points for the three
months ended September 30, 2016. The decrease was primarily
due to lower demand and realized pricing for managed review
services.
Adjusted Segment EBITDA was $7.4 million, or 16.8 percent of
segment revenues, compared to $10.8 million, or 19.5 percent of
segment revenues, in the prior year quarter.
16
|
|
Strategic Communications
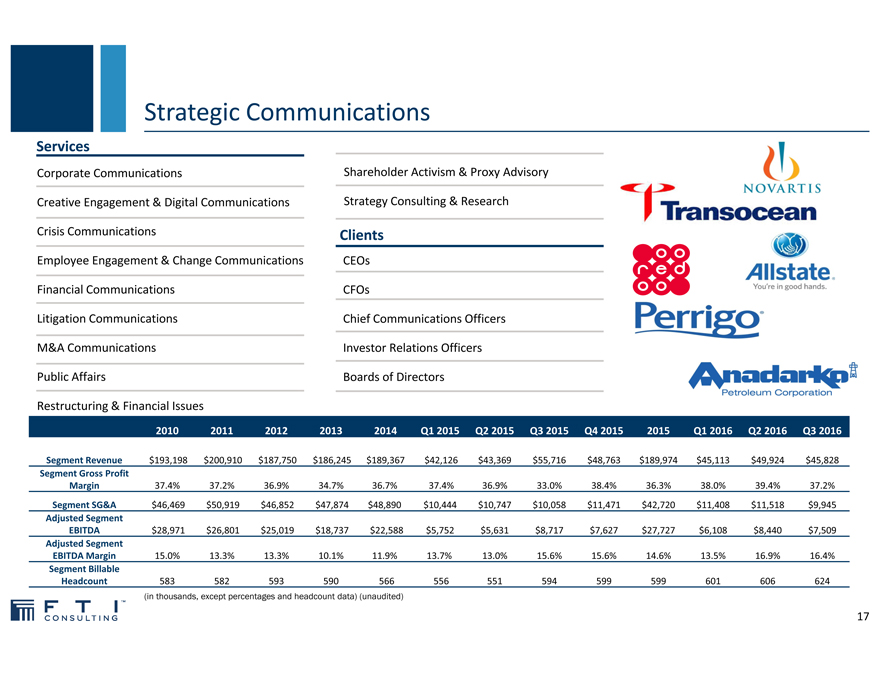
Services
Corporate Communications Shareholder Activism & Proxy Advisory
Creative Engagement & Digital Communications Strategy Consulting & Research
Crisis Communications Clients
Employee Engagement & Change Communications CEOs
Financial Communications CFOs
Litigation Communications Chief Communications Officers
M&A Communications Investor Relations Officers
Public Affairs Boards of Directors
Restructuring & Financial Issues
2010 2011201220132014Q1 2015Q2 2015Q3 2015Q4 20152015Q1 2016Q2 2016Q3 2016
Segment Revenue $193,198 $200,910 $187,750 $186,245 $189,367$42,126$43,369$55,716$48,763$189,974$45,113$49,924$45,828
Segment Gross Profit
Margin 37.4% 37.2%36.9%34.7%36.7%37.4%36.9%33.0%38.4%36.3%38.0%39.4%37.2%
Segment SG&A $46,469 $50,919 $46,852 $47,874 $48,890$10,444$10,747$10,058$11,471$42,720$11,408$11,518$9,945
Adjusted Segment
EBITDA $28,971 $26,801 $25,019 $18,737 $22,588$5,752$5,631$8,717$7,627$27,727$6,108$8,440$7,509
Adjusted Segment
EBITDA Margin 15.0% 13.3%13.3%10.1%11.9%13.7%13.0%15.6%15.6%14.6%13.5%16.9%16.4%
Segment Billable
Headcount 583 582593590566556551594599599601606624
(in thousands, except percentages and headcount data) (unaudited)
17
|
|
Strategic Communications (continued)
Segment Offering
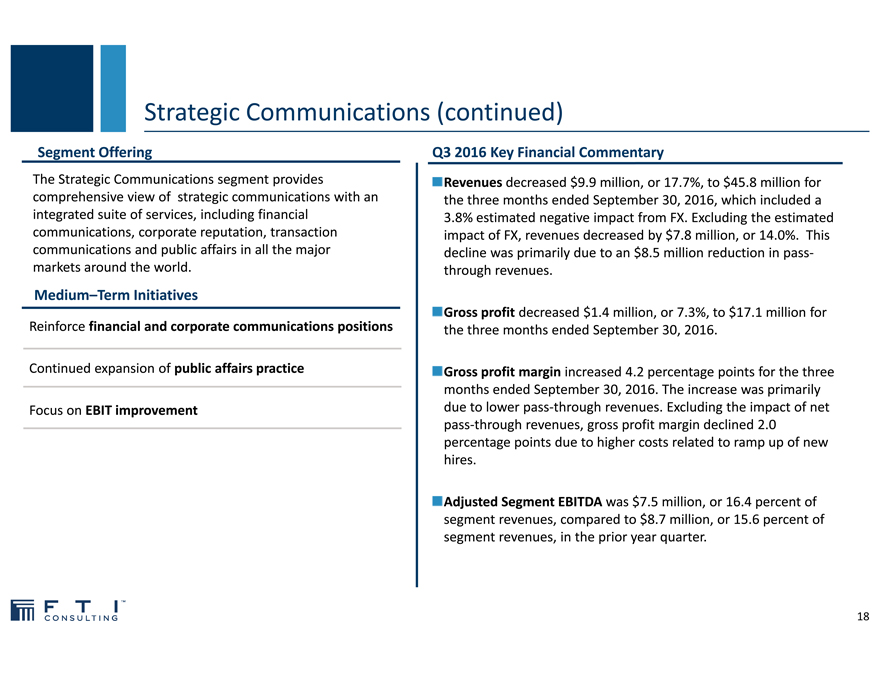
The Strategic Communications segment provides
comprehensive view of strategic communications with an
integrated suite of services, including financial
communications, corporate reputation, transaction
communications and public affairs in all the major
markets around the world.
Medium–Term Initiatives
Reinforce financial and corporate communications positions
Continued expansion of public affairs practice
Focus on EBIT improvement
Q3 2016 Key Financial Commentary
Revenues decreased $9.9 million, or 17.7%, to $45.8 million for
the three months ended September 30, 2016, which included a
3.8% estimated negative impact from FX. Excluding the estimated
impact of FX, revenues decreased by $7.8 million, or 14.0%. This
decline was primarily due to an $8.5 million reduction in pass?
through revenues.
Gross profit decreased $1.4 million, or 7.3%, to $17.1 million for
the three months ended September 30, 2016.
Gross profit margin increased 4.2 percentage points for the three
months ended September 30, 2016. The increase was primarily
due to lower pass-through revenues. Excluding the impact of net
pass-through revenues, gross profit margin declined 2.0
percentage points due to higher costs related to ramp up of new
hires.
Adjusted Segment EBITDA was $7.5 million, or 16.4 percent of
segment revenues, compared to $8.7 million, or 15.6 percent of
segment revenues, in the prior year quarter.
18
|
|
Recent Awards & Accolades
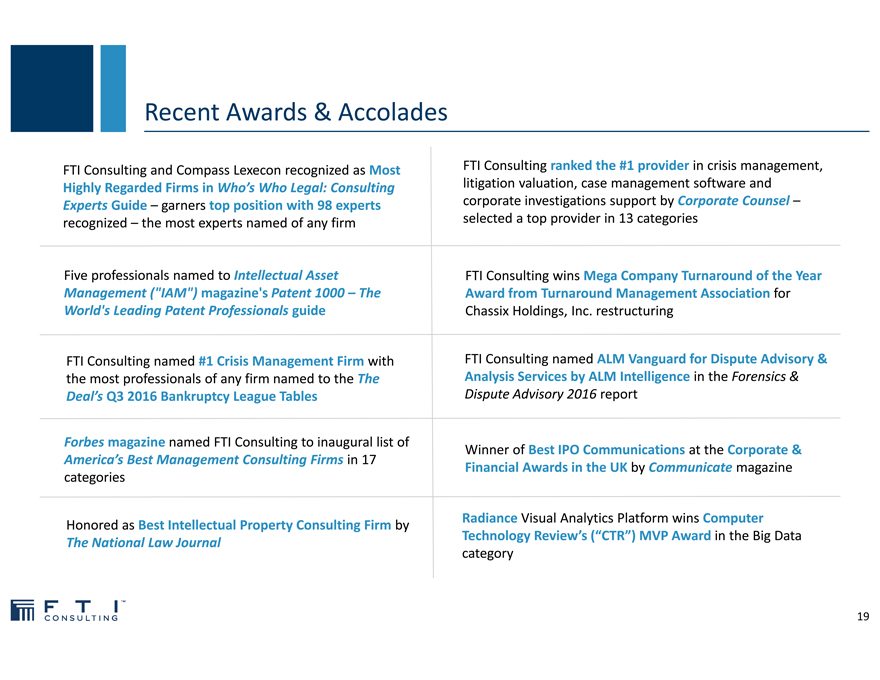
FTI Consulting and Compass Lexecon recognized as Most
Highly Regarded Firms in Who’s Who Legal: Consulting
Experts Guide – garners top position with 98 experts
recognized – the most experts named of any firm
Five professionals named to Intellectual Asset
Management (“IAM”) magazine’s Patent 1000 – The
World’s Leading Patent Professionals guide
FTI Consulting named #1 Crisis Management Firm with
the most professionals of any firm named to the The
Deal’s Q3 2016 Bankruptcy League Tables
Forbes magazine named FTI Consulting to inaugural list of
America’s Best Management Consulting Firms in 17
categories
Honored as Best Intellectual Property Consulting Firm by
The National Law Journal
FTI Consulting ranked the #1 provider in crisis management,
litigation valuation, case management software and
corporate investigations support by Corporate Counsel –
selected a top provider in 13 categories
FTI Consulting wins Mega Company Turnaround of the Year
Award from Turnaround Management Association for
Chassix Holdings, Inc. restructuring
FTI Consulting named ALM Vanguard for Dispute Advisory &
Analysis Services by ALM Intelligence in the Forensics &
Dispute Advisory 2016 report
Winner of Best IPO Communications at the Corporate &
Financial Awards in the UK by Communicate magazine
Radiance Visual Analytics Platform wins Computer
Technology Review’s (“CTR”) MVP Award in the Big Data
category
19
|
|

Financial Overview
|
|
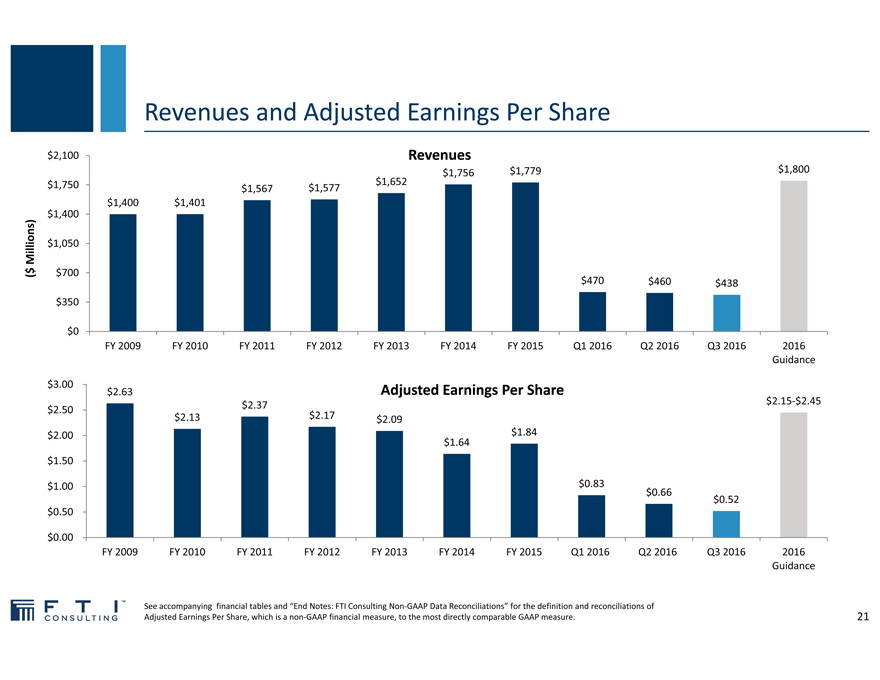
Revenues and Adjusted Earnings Per Share
$2,100 Revenues
$1,756 $1,779 $1,800
$1,750 $1,652
$1,567 $1,577
$1,400 $1,401
$1,400
$1,050
Millions)
( $ $700
$470 $460 $438
$350
$0
FY 2009FY 2010FY 2011FY 2012FY 2013FY 2014FY 2015Q1 2016Q2 2016Q3 20162016
Guidance
$3.00 $2.63 Adjusted Earnings Per Share
$2.37 $2.15?$2.45
$2.50
$2.13 $2.17 $2.09
$2.00 $1.84
$1.64
$1.50
$1.00 $0.83 $0.66
$0.52
$0.50
$0.00
FY 2009 FY 2010FY 2011FY 2012FY 2013FY 2014FY 2015Q1 2016 Q2 2016 Q3 20162016
Guidance
See accompanying financial tables and “End Notes: FTI Consulting Non?GAAP Data Reconciliations” for the definition and reconciliations of Adjusted Earnings Per Share, which is a non?GAAP financial measure, to the most directly comparable GAAP measure.
21
|
|
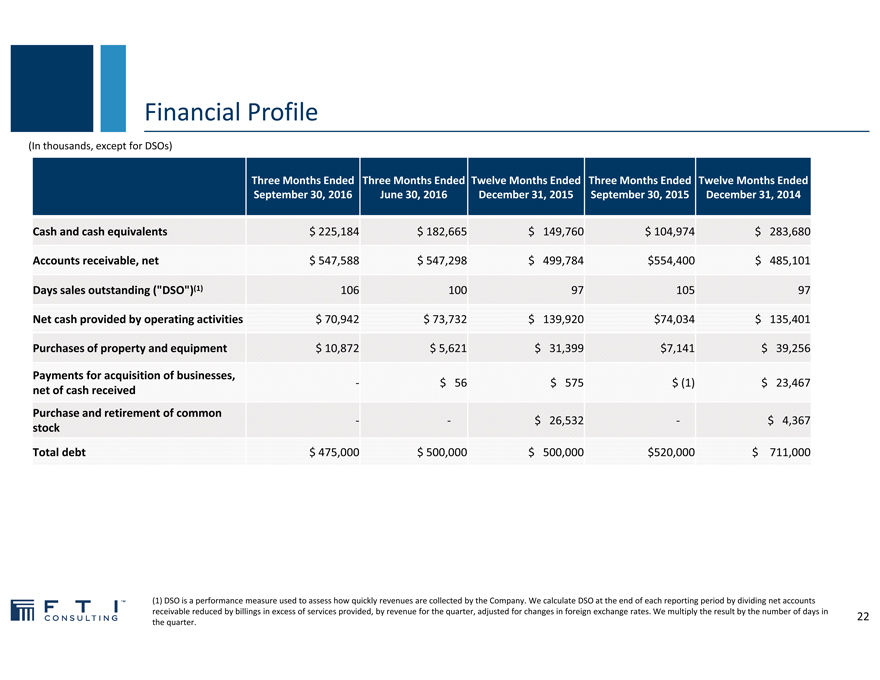
Financial Profile
(In thousands, except for DSOs)
Three Months Ended Three Months Ended Twelve Months Ended Three Months Ended Twelve Months Ended
September 30, 2016 June 30, 2016December 31, 2015September 30, 2015December 31, 2014
Cash and cash equivalents $ 225,184 $ 182,665$ 149,760$ 104,974 $ 283,680
Accounts receivable, net $ 547,588 $ 547,298$ 499,784$554,400$ 485,101
Days sales outstanding (“DSO”)(1) 106 1009710597
Net cash provided by operating activities $ 70,942 $ 73,732$ 139,920$74,034$ 135,401
Purchases of property and equipment $ 10,872 $ 5,621$ 31,399$7,141$ 39,256
Payments for acquisition of businesses,
,
net of cash received
Purchase and retirement of common
? ?$ 26,532?$ 4,367
stock
Total debt $ 475,000 $ 500,000$ 500,000$520,000$ 711,000
(1) DSO is a performance measure used to assess how quickly revenues are collected by the Company. We calculate DSO at the end of each reporting period by dividing net accounts receivable reduced by billings in excess of services provided, by revenue for the quarter, adjusted for changes in foreign exchange rates. We multiply the result by the number of days in the quarter.
22
|
|

Appendix
|
|

Financial Tables
Reconciliations of Non?GAAP Financial Measures
|
|
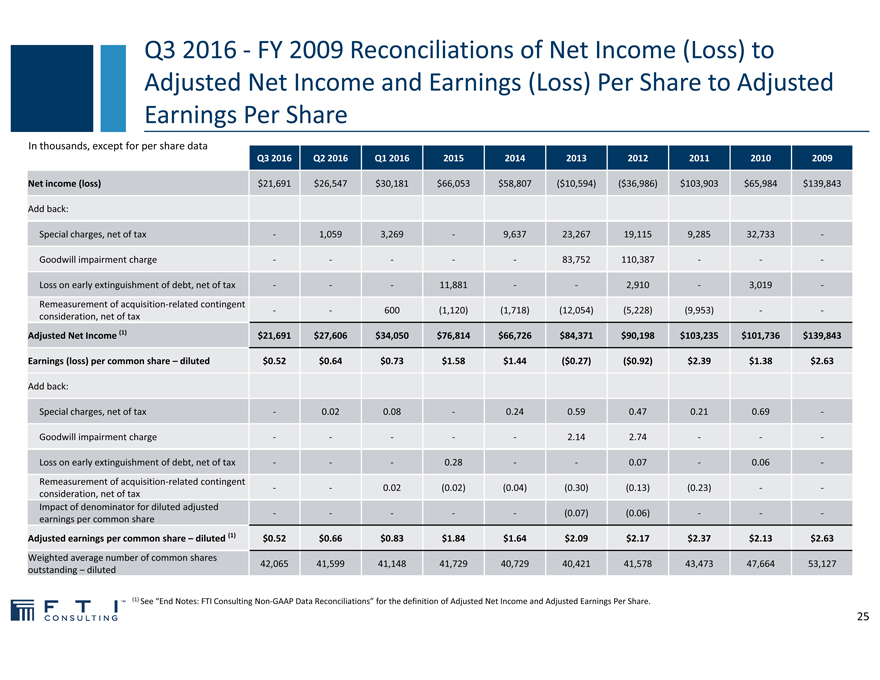
Q3 2016 FY 2009 Reconciliations of Net Income (Loss) to Adjusted Net Income and Earnings (Loss) Per Share to Adjusted Earnings Per Share
In thousands, except for per share data
Q3 2016 Q2 2016Q1 20162015201420132012201120102009
Net income (loss) $21,691 $26,547$30,181$66,053$58,807($10,594)($36,986)$103,903 $65,984 $139,843
Add back:
Special charges, net of tax 1,0593,269 9,63723,267 19,115 9,285 32,733
Goodwill impairment charge 83,752 110,387
Loss on early extinguishment of debt, net of tax 11,881 2,910 3,019
Remeasurement of acquisition related contingent
600(1,120)(1,718)(12,054)(5,228)(9,953)
consideration, net of tax
Adjusted Net Income (1) $21,691 $27,606$34,050$76,814$66,726$84,371 $90,198 $103,235 $101,736 $139,843
Earnings (loss) per common share – diluted $0.52 $0.64$0.73$1.58$1.44($0.27)($0.92)$2.39 $1.38 $2.63
Add back:
Special charges, net of tax 0.020.08 0.240.590.470.210.69
Goodwill impairment charge 2.142.74
Loss on early extinguishment of debt, net of tax 0.28 0.07 0.06
Remeasurement of acquisition related contingent
0.02(0.02)(0.04)(0.30)(0.13)(0.23)
consideration, net of tax
Impact of denominator for diluted adjusted
(0.07)(0.06)
earnings per common share
Adjusted earnings per common share – diluted (1) $0.52 $0.66$0.83$1.84$1.64$2.09$2.17$2.37$2.13$2.63
Weighted average number of common shares
42,065 41,59941,14841,72940,72940,42141,57843,47347,66453,127
outstanding – diluted
(1) See “End Notes: FTI Consulting Non GAAP Data Reconciliations” for the definition of Adjusted Net Income and Adjusted Earnings Per Share.
25
|
|
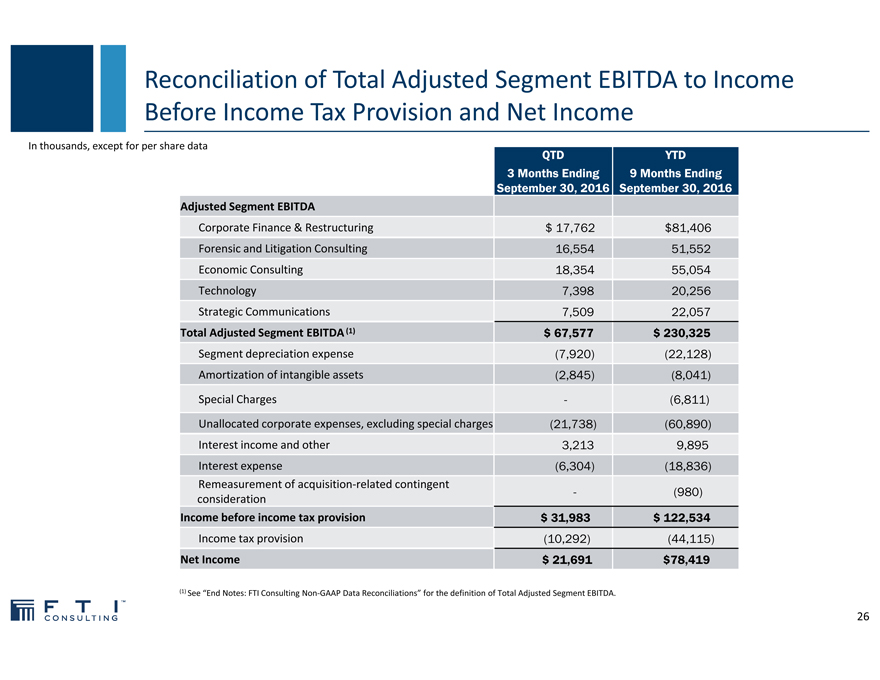
Reconciliation of Total Adjusted Segment EBITDA to Income Before Income Tax Provision and Net Income
In thousands, except for per share data
QTD YTD
3 Months Ending 9 Months Ending
September 30, 2016 September 30, 2016
Adjusted Segment EBITDA
Corporate Finance & Restructuring $ 17,762 $81,406
Forensic and Litigation Consulting 16,554 51,552
Economic Consulting 18,354 55,054
Technology 7,398 20,256
Strategic Communications 7,509 22,057
Total Adjusted Segment EBITDA (1) $ 67,577 $ 230,325
Segment depreciation expense (7,920) (22,128)
Amortization of intangible assets (2,845) (8,041)
Special Charges - (6,811)
Unallocated corporate expenses, excluding special charges (21,738) (60,890)
Interest income and other 3,213 9,895
Interest expense (6,304) (18,836)
Remeasurement of acquisition-related contingent - (980)
consideration
Income before income tax provision $ 31,983 $ 122,534
Income tax provision (10,292) (44,115)
Net Income $ 21,691 $78,419
(1) See “End Notes: FTI Consulting Non-GAAP Data Reconciliations” for the definition of Total Adjusted Segment EBITDA.
26
|
|
End Notes: FTI Consulting Non-GAAP Data Reconciliations
We have included the definitions of Segment Operating Income (Loss), Adjusted Segment EBITDA and Adjusted Segment EBITDA Margin, GAAP financial measures, below in order to more fully define the components of certain non-GAAP measures presented in this earnings release. We define Segment Operating Income (Loss) as a segment’s share of Consolidated Operating Income (Loss). We define Total Segment Operating Income (Loss), a non-GAAP financial measure, as the total of Segment Operating Income (Loss) for all segments, which excludes unallocated corporate expenses. We use Segment Operating Income (Loss) for the purpose of calculating Adjusted Segment EBITDA. We define Adjusted Segment EBITDA as a segment’s share of Consolidated Operating Income (Loss) before depreciation, amortization of intangible assets, remeasurement of acquisition-related contingent consideration, special charges and goodwill impairment charges. We define Adjusted Segment EBITDA Margin as Adjusted Segment EBITDA as a percentage of a segment’s revenues. We use Adjusted Segment EBITDA to internally evaluate the financial performance of our segments because we believe it is a useful measure which reflects current core operating performance and provides an indicator of the segment’s ability to generate cash.
We define, non-GAAP measures, Total Adjusted Segment EBITDA as the total of Adjusted Segment EBITDA for all segments, which excludes unallocated corporate expenses, and Adjusted EBITDA as consolidated net income (loss) before income tax provision, other non-operating income (expense), depreciation, amortization of intangible assets, remeasurement of acquisition-related contingent consideration, special charges, goodwill impairment charges and losses on early extinguishment of debt. We believe that our non-GAAP financial measures, when considered together with our GAAP financial results and GAAP financial measures, provide management and investors with a more complete understanding of our operating results, including underlying trends, by excluding the effects of remeasurement of acquisition-related contingent consideration, special charges and goodwill impairment charges. In addition, EBITDA and Adjusted EBITDA are common alternative measures of operating performance used by many of our competitors. They are used by investors, financial analysts, rating agencies and others to value and compare the financial performance of companies in our industry. Therefore, we also believe that these measures, considered along with corresponding GAAP financial measures, provide management and investors with additional supplemental information for comparison of our operating results to the operating results of other companies.
We define Adjusted Net Income and Adjusted Earnings per Diluted Share (“Adjusted EPS”), non-GAAP financial measures, as net income (loss) and earnings per diluted share (“GAAP EPS”), respectively, excluding the impact of remeasurement of acquisition-related contingent consideration, special charges, goodwill impairment charges and losses on early extinguishment of debt. We use Adjusted Net Income for the purpose of calculating Adjusted EPS. Management uses Adjusted EPS to assess total company operating performance on a consistent basis. We believe that this measure, when considered together with our GAAP financial results and GAAP financial measures, provides management and investors with a more complete understanding of our business operating results, including underlying trends, by excluding the effects of remeasurement of acquisition-related contingent consideration, special charges, goodwill impairment charges and losses on early extinguishment of debt.
Non-GAAP financial measures are not defined in the same manner by all companies and may not be comparable to other similarly titled measures of other companies. Non-GAAP financial measures should be considered in addition to, but not as a substitute for or superior to, the information contained in our Consolidated Statements of Comprehensive Income. Reconciliations of non-GAAP financial measures to GAAP are included in the financial tables accompanying this presentation.
The financial tables accompanying this presentation do not include a reconciliation of the Company’s 2016 Adjusted EPS guidance to an estimate of GAAP EPS. It is difficult to predict and estimate future remeasurement of acquisition-related contingent consideration, special charges, goodwill impairment charges and/or losses on early extinguishment of debt, as these items are dependent on future events that are uncertain. Accordingly, a reconciliation of our non-GAAP financial measure guidance to the corresponding GAAP measure is not available without unreasonable effort.
27
|
|

Experts with Impact