Attached files
| file | filename |
|---|---|
| EX-99.1 - EX-99.1 - Manitex International, Inc. | d276026dex991.htm |
| 8-K - FORM 8-K - Manitex International, Inc. | d276026d8k.htm |
“Focused manufacturer of engineered lifting equipment” Manitex International, Inc. (NASDAQ:MNTX) Conference Call Third Quarter 2016 November 9th, 2016 Exhibit 99.2
Forward Looking Statements & Non GAAP Measures “Focused manufacturer of engineered lifting equipment” Safe Harbor Statement under the U.S. Private Securities Litigation Reform Act of 1995: This presentation contains statements that are forward-looking in nature which express the beliefs and expectations of management including statements regarding the Company’s expected results of operations or liquidity; statements concerning projections, predictions, expectations, estimates or forecasts as to our business, financial and operational results and future economic performance; and statements of management’s goals and objectives and other similar expressions concerning matters that are not historical facts. In some cases, you can identify forward-looking statements by terminology such as “anticipate,” “estimate,” “plan,” “project,” “continuing,” “ongoing,” “expect,” “we believe,” “we intend,” “may,” “will,” “should,” “could,” and similar expressions. Such statements are based on current plans, estimates and expectations and involve a number of known and unknown risks, uncertainties and other factors that could cause the Company's future results, performance or achievements to differ significantly from the results, performance or achievements expressed or implied by such forward-looking statements. These factors and additional information are discussed in the Company's filings with the Securities and Exchange Commission and statements in this presentation should be evaluated in light of these important factors. Although we believe that these statements are based upon reasonable assumptions, we cannot guarantee future results. Forward-looking statements speak only as of the date on which they are made, and the Company undertakes no obligation to update publicly or revise any forward-looking statement, whether as a result of new information, future developments or otherwise. Non-GAAP Measures: Manitex International from time to time refers to various non-GAAP (generally accepted accounting principles) financial measures in this presentation. Manitex believes that this information is useful to understanding its operating results without the impact of special items. See Manitex’s Third Quarter 2016 Earnings Release on the Investor Relations section of our website www.manitexinternational.com for a description and/or reconciliation of these measures.
Summary “Focused manufacturer of engineered lifting equipment” Our objectives in 2016 Cost reduction program to include plant consolidations Continue program of strategic rationalization to drive growth in highest margin products and operating units Cash generation to continue debt reduction by a similar amount as in 2015 Implementation and execution of integration of PM strategy Expand ASV through new distribution
“Focused manufacturer of engineered lifting equipment” Commercial Overview Q3 market conditions extremely challenging Oil and gas demand continues to be minimal, adversely impacting yoy comparisons for core crane products. Used equipment overhang still impacting other sectors also. Some more favorable used equipment pricing being seen, however. North American general construction demand slow in the third quarter. Straight mast market maintaining low levels of activity and preference for lower capacity equipment. Knuckle boom crane market in contrast growing in absolute terms and in certain geographies eg North America. European markets modest improvement. Launched new crane products aimed at construction sector, including knuckleboom fabricated in Texas facility. Significant activity and interest related to our new acquisition products PM sales strength in Q3-2016 in Italy & West Europe, and N America. ASV controlled distribution channels gaining momentum. ASV branded product at over 80% of quarterly machine shipments in Q3. New ASV dealer sign-ups at approximately 126 locations. 9/30/16 Backlog of $46.3 million (12/31/15, $75.5 million, 6/30/16, $54.2 million) Broad based order book: ASV 14%, PM 22% All other 64%. Quote activity progressively increasing
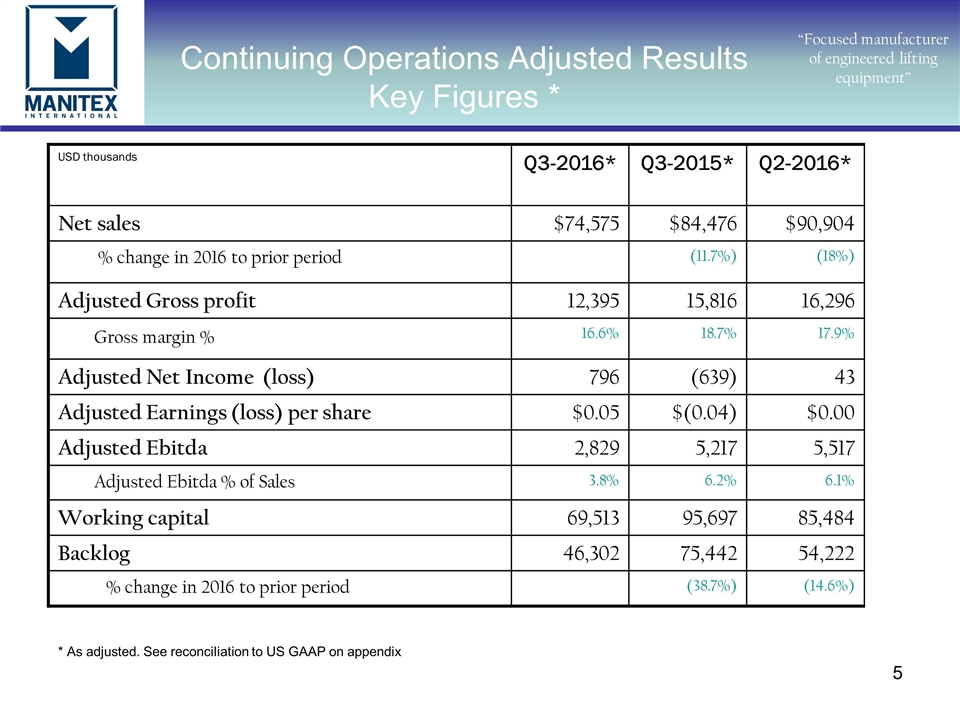
Continuing Operations Adjusted Results Key Figures * “Focused manufacturer of engineered lifting equipment” USD thousands Q3-2016* Q3-2015* Q2-2016* Net sales $74,575 $84,476 $90,904 % change in 2016 to prior period (11.7%) (18%) Adjusted Gross profit 12,395 15,816 16,296 Gross margin % 16.6% 18.7% 17.9% Adjusted Net Income (loss) 796 (639) 43 Adjusted Earnings (loss) per share $0.05 $(0.04) $0.00 Adjusted Ebitda 2,829 5,217 5,517 Adjusted Ebitda % of Sales 3.8% 6.2% 6.1% Working capital 69,513 95,697 85,484 Backlog 46,302 75,442 54,222 % change in 2016 to prior period (38.7%) (14.6%) * As adjusted. See reconciliation to US GAAP on appendix
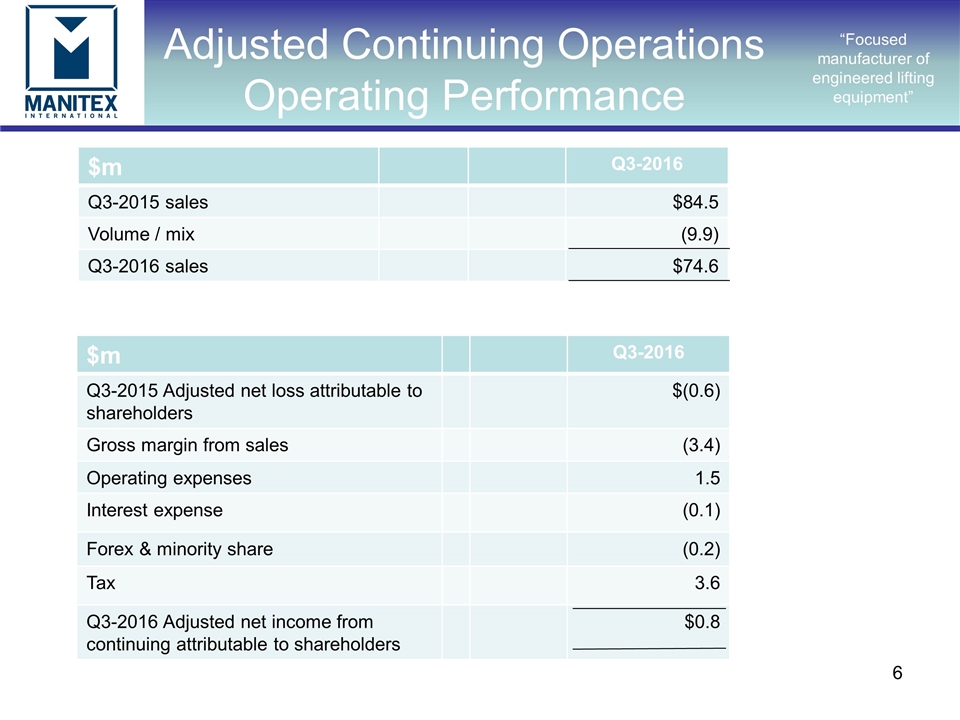
“Focused manufacturer of engineered lifting equipment” Adjusted Continuing Operations Operating Performance $m Q3-2016 Q3-2015 sales $84.5 Volume / mix (9.9) Q3-2016 sales $74.6 $m Q3-2016 Q3-2015 Adjusted net loss attributable to shareholders $(0.6) Gross margin from sales (3.4) Operating expenses 1.5 Interest expense (0.1) Forex & minority share (0.2) Tax 3.6 Q3-2016 Adjusted net income from continuing attributable to shareholders $0.8
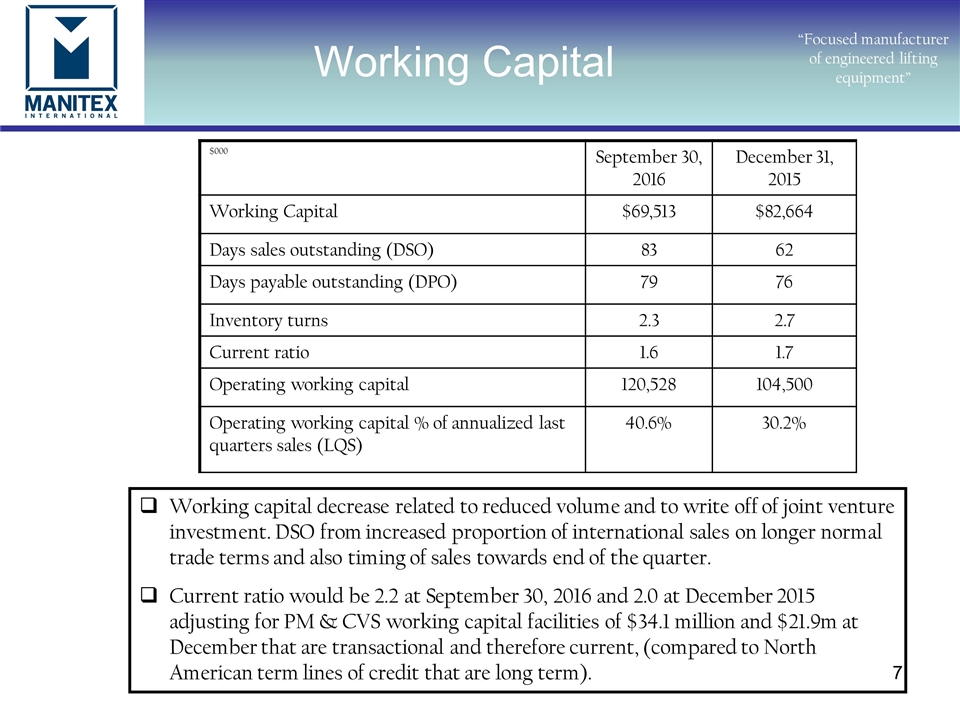
Working Capital “Focused manufacturer of engineered lifting equipment” $000 September 30, 2016 December 31, 2015 Working Capital $69,513 $82,664 Days sales outstanding (DSO) 83 62 Days payable outstanding (DPO) 79 76 Inventory turns 2.3 2.7 Current ratio 1.6 1.7 Operating working capital 120,528 104,500 Operating working capital % of annualized last quarters sales (LQS) 40.6% 30.2% Working capital decrease related to reduced volume and to write off of joint venture investment. DSO from increased proportion of international sales on longer normal trade terms and also timing of sales towards end of the quarter. Current ratio would be 2.2 at September 30, 2016 and 2.0 at December 2015 adjusting for PM & CVS working capital facilities of $34.1 million and $21.9m at December that are transactional and therefore current, (compared to North American term lines of credit that are long term).
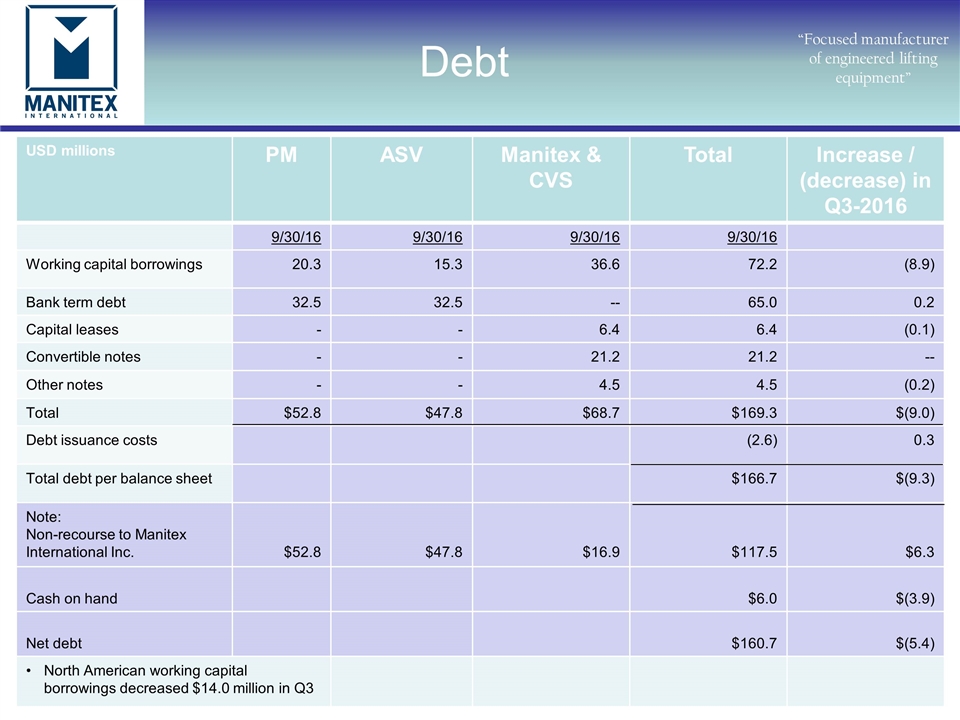
“Focused manufacturer of engineered lifting equipment” Debt USD millions PM ASV Manitex & CVS Total Increase / (decrease) in Q3-2016 9/30/16 9/30/16 9/30/16 9/30/16 Working capital borrowings 20.3 15.3 36.6 72.2 (8.9) Bank term debt 32.5 32.5 -- 65.0 0.2 Capital leases - - 6.4 6.4 (0.1) Convertible notes - - 21.2 21.2 -- Other notes - - 4.5 4.5 (0.2) Total $52.8 $47.8 $68.7 $169.3 $(9.0) Debt issuance costs (2.6) 0.3 Total debt per balance sheet $166.7 $(9.3) Note: Non-recourse to Manitex International Inc. $52.8 $47.8 $16.9 $117.5 $6.3 Cash on hand $6.0 $(3.9) Net debt $160.7 $(5.4) North American working capital borrowings decreased $14.0 million in Q3
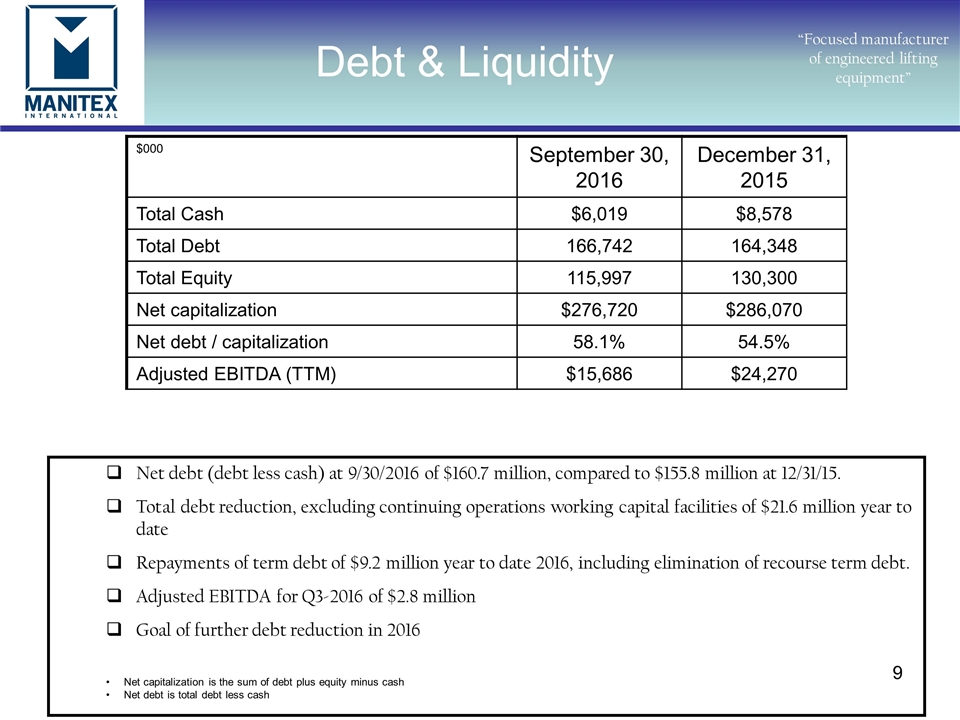
“Focused manufacturer of engineered lifting equipment” $000 September 30, 2016 December 31, 2015 Total Cash $6,019 $8,578 Total Debt 166,742 164,348 Total Equity 115,997 130,300 Net capitalization $276,720 $286,070 Net debt / capitalization 58.1% 54.5% Adjusted EBITDA (TTM) $15,686 $24,270 Net debt (debt less cash) at 9/30/2016 of $160.7 million, compared to $155.8 million at 12/31/15. Total debt reduction, excluding continuing operations working capital facilities of $21.6 million year to date Repayments of term debt of $9.2 million year to date 2016, including elimination of recourse term debt. Adjusted EBITDA for Q3-2016 of $2.8 million Goal of further debt reduction in 2016 Debt & Liquidity Net capitalization is the sum of debt plus equity minus cash Net debt is total debt less cash
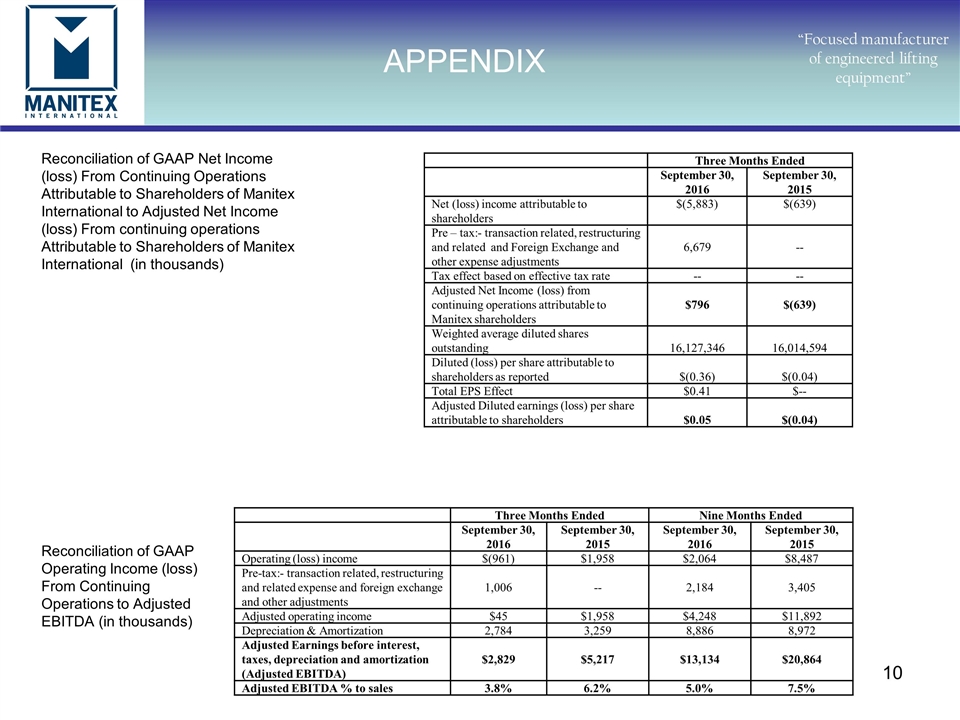
APPENDIX “Focused manufacturer of engineered lifting equipment” Reconciliation of GAAP Net Income (loss) From Continuing Operations Attributable to Shareholders of Manitex International to Adjusted Net Income (loss) From continuing operations Attributable to Shareholders of Manitex International (in thousands) Reconciliation of GAAP Operating Income (loss) From Continuing Operations to Adjusted EBITDA (in thousands) Three Months Ended September 30, 2016 September 30, 2015 Net (loss) income attributable to shareholders $(5,883) $(639) Pre – tax:- transaction related, restructuring and related and Foreign Exchange and other expense adjustments 6,679 -- Tax effect based on effective tax rate -- -- Adjusted Net Income (loss) from continuing operations attributable to Manitex shareholders $796 $(639) Weighted average diluted shares outstanding 16,127,346 16,014,594 Diluted (loss) per share attributable to shareholders as reported $(0.36) $(0.04) Total EPS Effect $0.41 $-- Adjusted Diluted earnings (loss) per share attributable to shareholders $0.05 $(0.04) Three Months Ended Nine Months Ended September 30, 2016 September 30, 2015 September 30, 2016 September 30, 2015 Operating (loss) income $(961) $1,958 $2,064 $8,487 Pre-tax:- transaction related, restructuring and related expense and foreign exchange and other adjustments 1,006 -- 2,184 3,405 Adjusted operating income $45 $1,958 $4,248 $11,892 Depreciation & Amortization 2,784 3,259 8,886 8,972 Adjusted Earnings before interest, taxes, depreciation and amortization (Adjusted EBITDA) $2,829 $5,217 $13,134 $20,864 Adjusted EBITDA % to sales 3.8% 6.2% 5.0% 7.5%
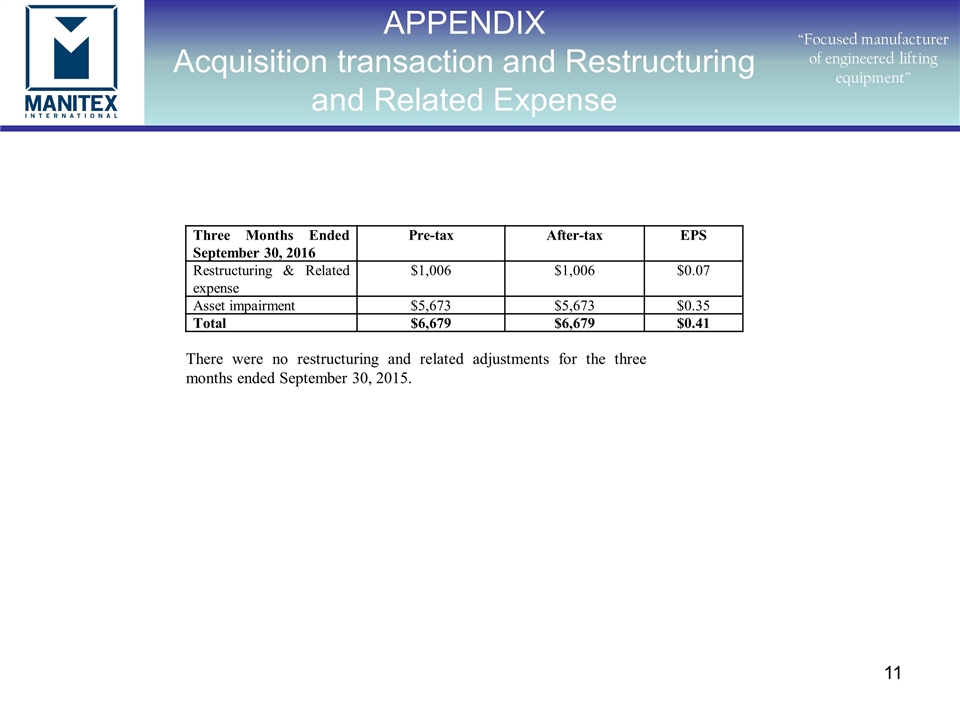
APPENDIX Acquisition transaction and Restructuring and Related Expense “Focused manufacturer of engineered lifting equipment” Three Months Ended September 30, 2016 Pre-tax After-tax EPS Restructuring & Related expense $1,006 $1,006 $0.07 Asset impairment $5,673 $5,673 $0.35 Total $6,679 $6,679 $0.41 There were no restructuring and related adjustments for the three months ended September 30, 2015.
