Attached files
| file | filename |
|---|---|
| 8-K - 8-K - John Bean Technologies CORP | bairdconference.htm |
JBT Investor Presentation
Baird 2016 Global Industrial Conference
November 9, 2016
Tom Giacomini, Chairman, President & CEO
Brian Deck, EVP & CFO
These slides and the accompanying presentation contain “forward-looking”
statements which represent management’s best judgment as of the date
hereof, based on currently available information. Actual results may differ
materially from those contained in such forward-looking statements.
JBT Corporation’s (the “Company”) most recent filings with the Securities
and Exchange Commission include information concerning factors that may
cause actual results to differ from those anticipated by these forward-looking
statements. The Company undertakes no obligation to update or revise
these forward-looking statements to reflect new events or uncertainties.
Although the Company reports its results using US GAAP, the Company
uses non-GAAP measures when management believes those measures
provide useful information for its stockholders. The appendices to this
presentation provide reconciliations to US GAAP for any non-GAAP
measures referenced in this presentation.
Forward-Looking Statements
2
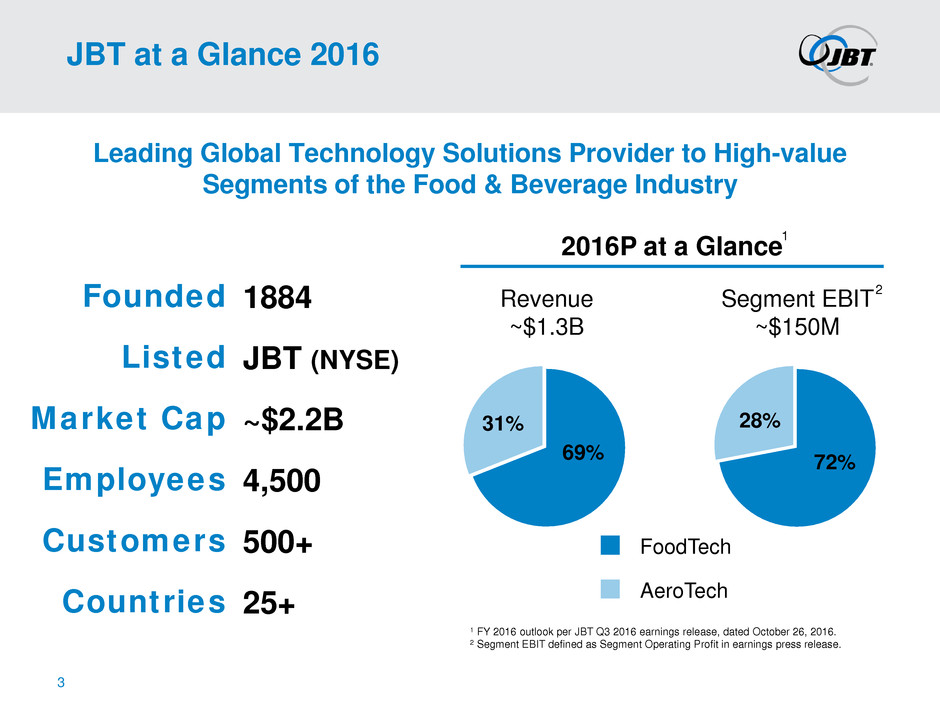
JBT at a Glance 2016
Leading Global Technology Solutions Provider to High-value
Segments of the Food & Beverage Industry
69%
31%
Revenue
~$1.3B
Segment EBIT
~$150M
72%
28%
2016P at a Glance
AeroTech
FoodTech
1 FY 2016 outlook per JBT Q3 2016 earnings release, dated October 26, 2016.
2 Segment EBIT defined as Segment Operating Profit in earnings press release.
3
1
2 Founded
Listed
Market Cap
Employees
Customers
Countries
1884
JBT (NYSE)
~$2.2B
4,500
500+
25+
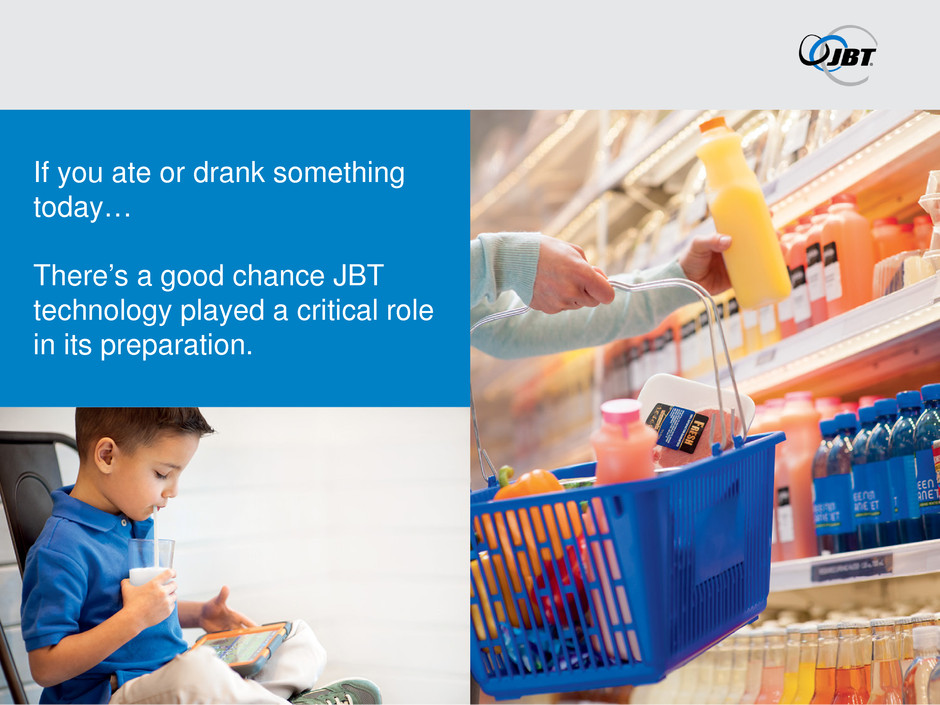
If you ate or drank something
today…
There’s a good chance JBT
technology played a critical role
in its preparation.
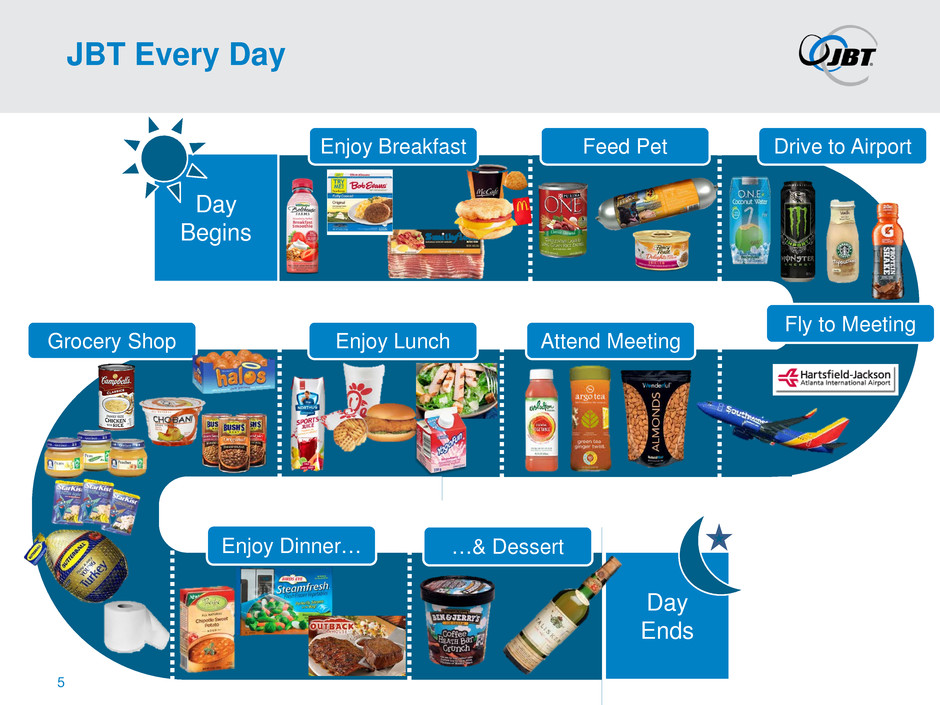
JBT Every Day
Enjoy Lunch
Day
Ends
Drive to Airport
Day
Begins
Enjoy Dinner… …& Dessert
5
Fly to Meeting
Feed Pet
Grocery Shop Attend Meeting
Enjoy Breakfast
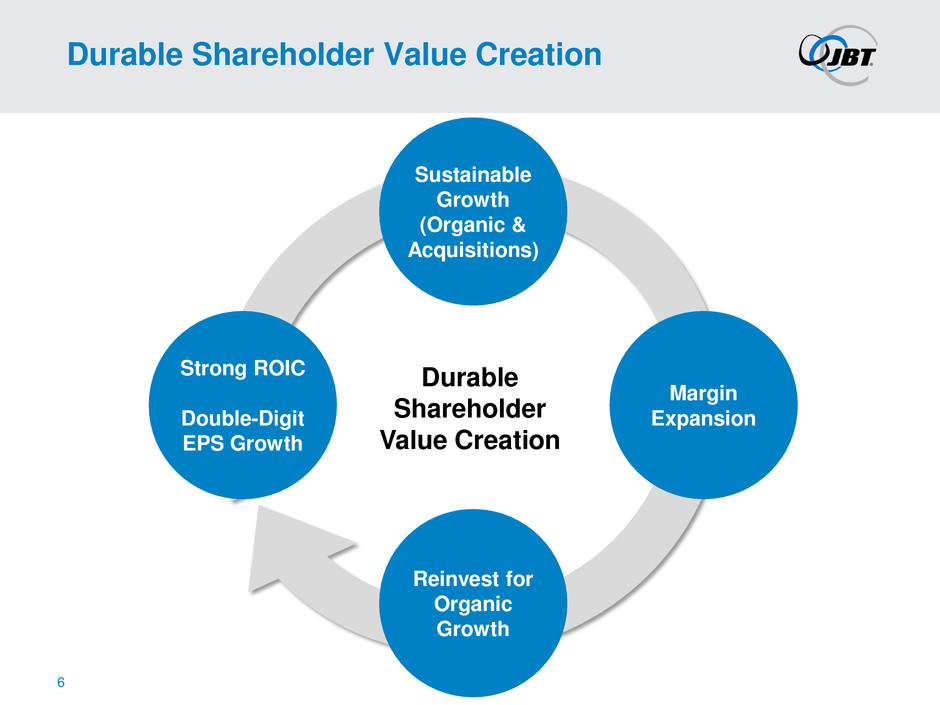
Durable Shareholder Value Creation
Sustainable
Growth
(Organic &
Acquisitions)
Margin
Expansion
Reinvest for
Organic
Growth
Strong ROIC
Double-Digit
EPS Growth
Durable
Shareholder
Value Creation
6
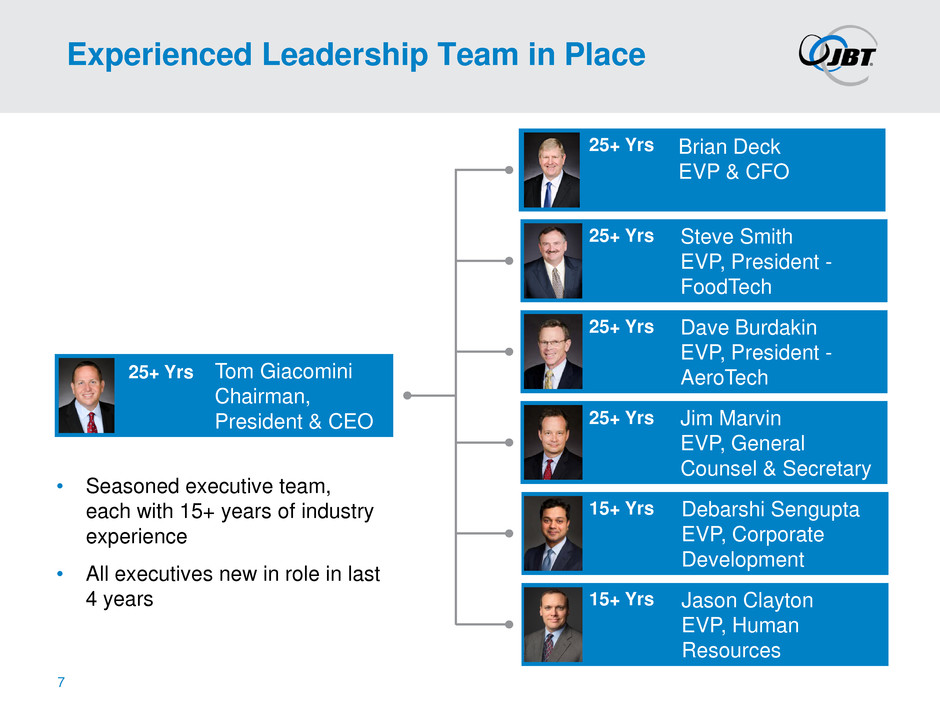
Debarshi Sengupta
EVP, Corporate
Development
Jason Clayton
EVP, Human
Resources
Experienced Leadership Team in Place
Jim Marvin
EVP, General
Counsel & Secretary
Brian Deck
EVP & CFO
Dave Burdakin
EVP, President -
AeroTech Tom Giacomini
Chairman,
President & CEO
25+ Yrs
Steve Smith
EVP, President -
FoodTech
• Seasoned executive team,
each with 15+ years of industry
experience
• All executives new in role in last
4 years
7
15+ Yrs
25+ Yrs
25+ Yrs
25+ Yrs
25+ Yrs
15+ Yrs
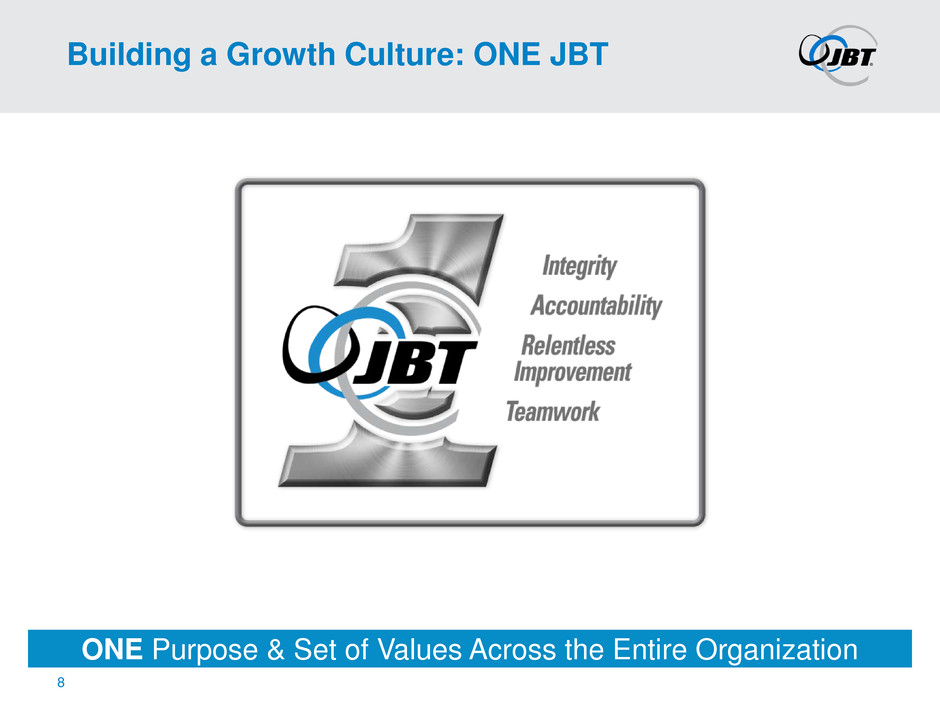
Building a Growth Culture: ONE JBT
8
ONE Purpose & Set of Values Across the Entire Organization
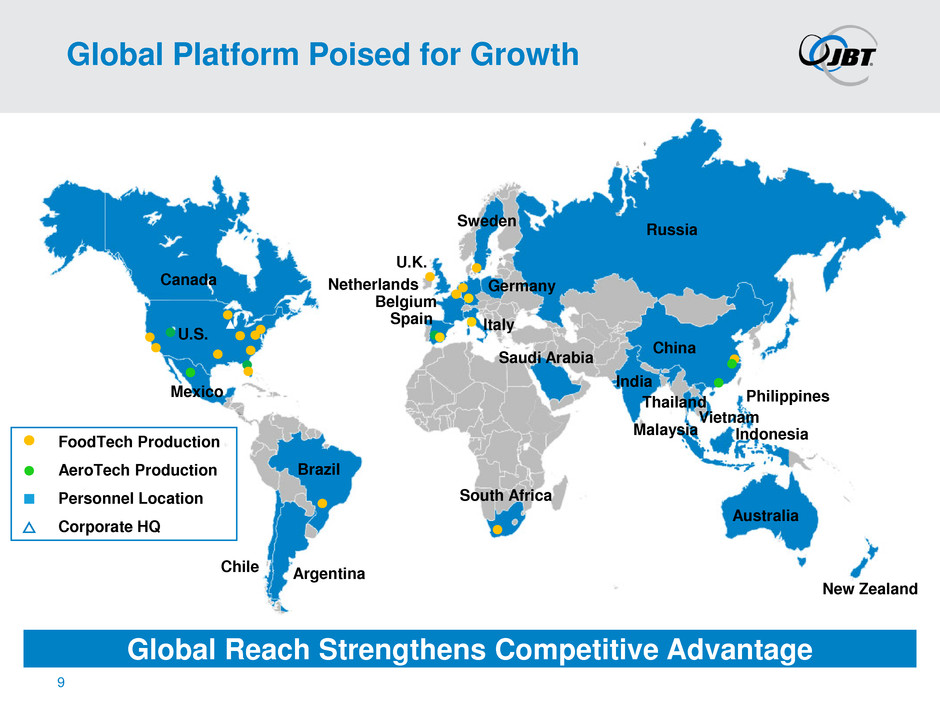
Canada
U.S.
Mexico
Brazil
Chile Argentina
U.K.
Belgium
Spain
Sweden
Germany
Italy
South Africa
Saudi Arabia
Russia
India
Malaysia
Philippines
Australia
New Zealand
Netherlands
China
Vietnam
Thailand
Indonesia
Global Platform Poised for Growth
Global Reach Strengthens Competitive Advantage
9
FoodTech Production
AeroTech Production
Personnel Location
Corporate HQ
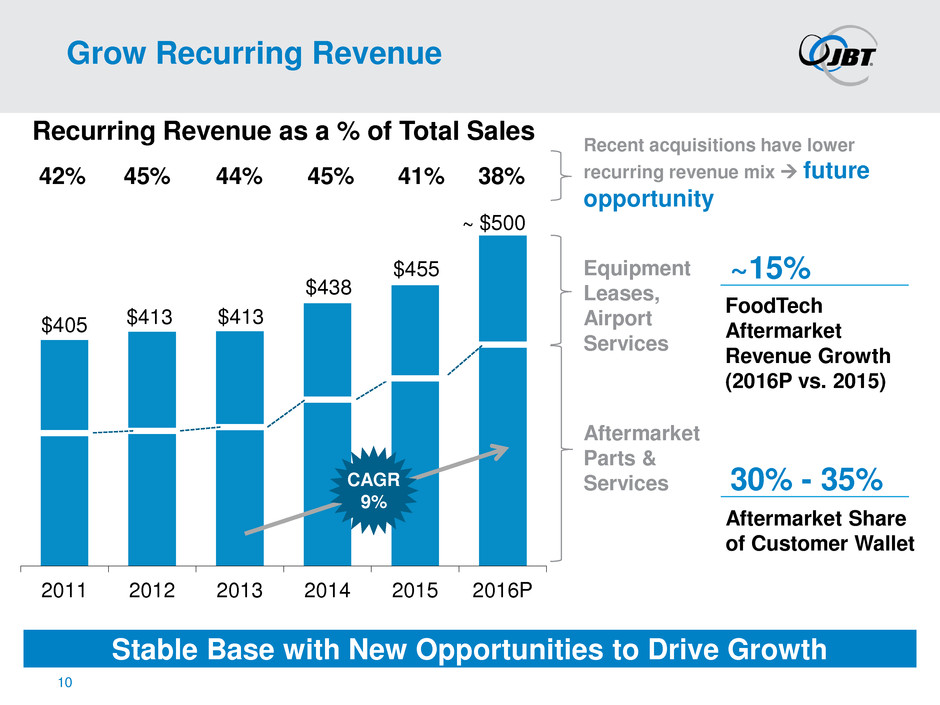
$405 $413 $413
$438
$455
$500
2011 2012 2013 2014 2015 2016P
Grow Recurring Revenue
Stable Base with New Opportunities to Drive Growth
FoodTech
Aftermarket
Revenue Growth
(2016P vs. 2015)
~15%
Aftermarket Share
of Customer Wallet
30% - 35%
42% 45% 44% 45%
Recurring Revenue as a % of Total Sales
Aftermarket
Parts &
Services
41%
Equipment
Leases,
Airport
Services
10
38%
Recent acquisitions have lower
recurring revenue mix future
opportunity
~
CAGR
9%
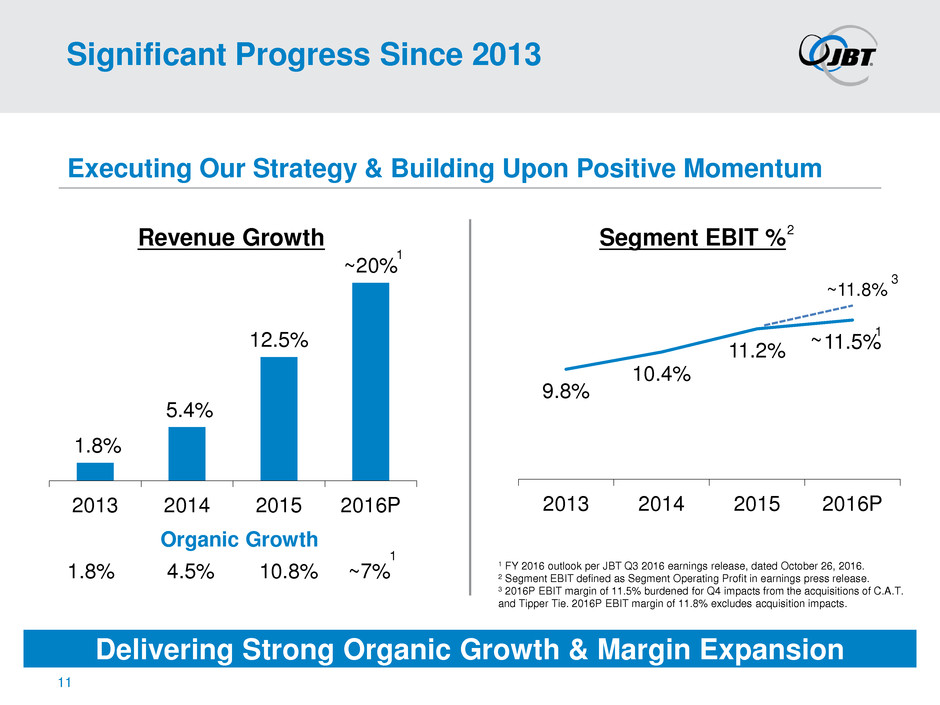
Significant Progress Since 2013
Executing Our Strategy & Building Upon Positive Momentum
Delivering Strong Organic Growth & Margin Expansion
1.8%
5.4%
12.5%
~20%
2013 2014 2015 2016P
Revenue Growth
9.8%
10.4%
11.2% 11.5%
2013 2014 2015 2016P
Segment EBIT %
11
1.8% 4.5% 10.8% ~7%
Organic Growth
~
1
1
1
1 FY 2016 outlook per JBT Q3 2016 earnings release, dated October 26, 2016.
2 Segment EBIT defined as Segment Operating Profit in earnings press release.
3 2016P EBIT margin of 11.5% burdened for Q4 impacts from the acquisitions of C.A.T.
and Tipper Tie. 2016P EBIT margin of 11.8% excludes acquisition impacts.
~11.8%
3
2
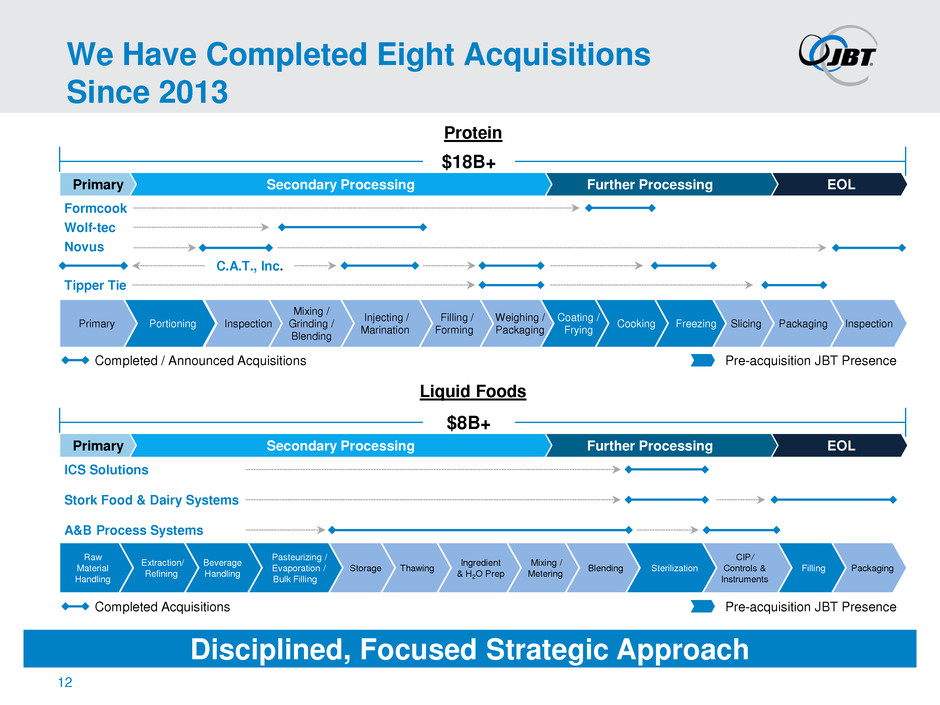
We Have Completed Eight Acquisitions
Since 2013
12
EOL Further Processing
$18B+
Liquid Foods
Packaging Filling
CIP/
Controls &
Instruments
Sterilization Blending Mixing / Metering
Ingredient
& H2O Prep
Thawing Storage
Pasteurizing /
Evaporation /
Bulk Filling
Beverage
Handling
Extraction/
Refining
Raw
Material
Handling
ICS Solutions
Wolf-tec
Formcook
A&B Process Systems
Stork Food & Dairy Systems
Novus
Secondary Processing
Tipper Tie
Primary
Protein
C.A.T., Inc.
Primary Portioning Weighing / Packaging
Coating /
Frying Cooking Freezing
Filling /
Forming Slicing
Injecting /
Marination Inspection Packaging Inspection
Mixing /
Grinding /
Blending
EOL Further Processing
$8B+
Secondary Processing Primary
Disciplined, Focused Strategic Approach
Completed / Announced Acquisitions Pre-acquisition JBT Presence
Completed Acquisitions Pre-acquisition JBT Presence
JBT
41%
0
50
100
150
200
250
300
350
400
450
500
(60) (40) (20) 0 20 40 60 80
1st Quartile
16%
2nd Quartile
8%
3rd Quartile
0%
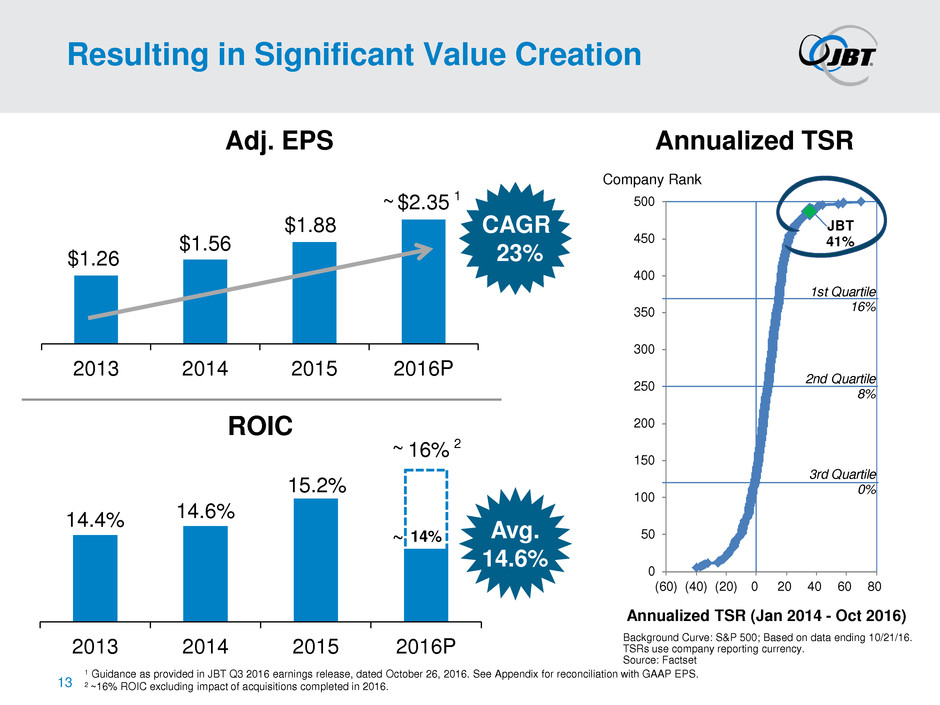
Resulting in Significant Value Creation
Annualized TSR
Company Rank
Annualized TSR (Jan 2014 - Oct 2016)
Background Curve: S&P 500; Based on data ending 10/21/16.
TSRs use company reporting currency.
Source: Factset
$1.26
$1.56
$1.88
$2.35
2013 2014 2015 2016P
Adj. EPS
14.4% 14.6%
15.2%
16%
2013 2014 2015 2016P
ROIC
CAGR
23%
13
Avg.
14.6%
1
14%
1 Guidance as provided in JBT Q3 2016 earnings release, dated October 26, 2016. See Appendix for reconciliation with GAAP EPS.
2 ~16% ROIC excluding impact of acquisitions completed in 2016.
2
~
~
~
The Elevate Plan
2016 – 2019
Strategy
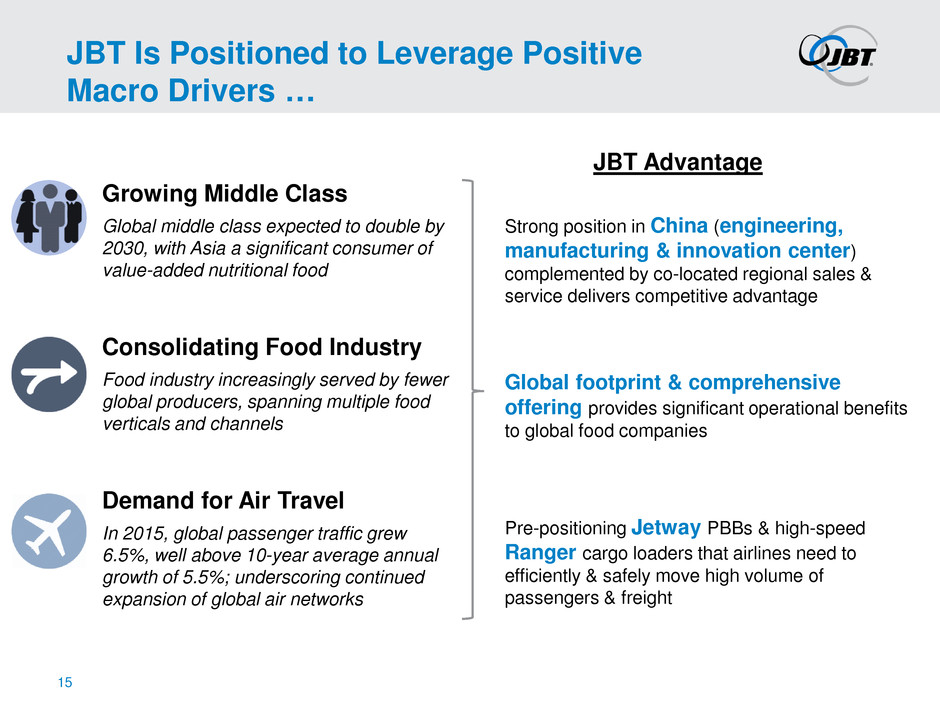
JBT Is Positioned to Leverage Positive
Macro Drivers …
15
Growing Middle Class
Global middle class expected to double by
2030, with Asia a significant consumer of
value-added nutritional food
Consolidating Food Industry
Food industry increasingly served by fewer
global producers, spanning multiple food
verticals and channels
Demand for Air Travel
In 2015, global passenger traffic grew
6.5%, well above 10-year average annual
growth of 5.5%; underscoring continued
expansion of global air networks
Strong position in China (engineering,
manufacturing & innovation center)
complemented by co-located regional sales &
service delivers competitive advantage
JBT Advantage
Global footprint & comprehensive
offering provides significant operational benefits
to global food companies
Pre-positioning Jetway PBBs & high-speed
Ranger cargo loaders that airlines need to
efficiently & safely move high volume of
passengers & freight
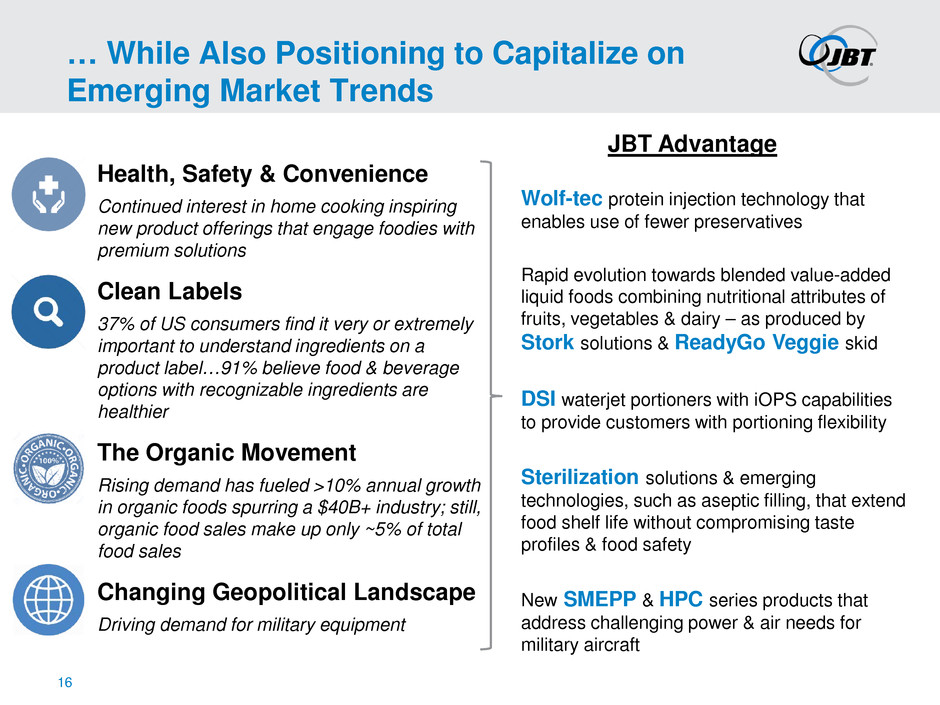
… While Also Positioning to Capitalize on
Emerging Market Trends
16
Health, Safety & Convenience
Continued interest in home cooking inspiring
new product offerings that engage foodies with
premium solutions
Clean Labels
37% of US consumers find it very or extremely
important to understand ingredients on a
product label…91% believe food & beverage
options with recognizable ingredients are
healthier
The Organic Movement
Rising demand has fueled >10% annual growth
in organic foods spurring a $40B+ industry; still,
organic food sales make up only ~5% of total
food sales
Changing Geopolitical Landscape
Driving demand for military equipment
Wolf-tec protein injection technology that
enables use of fewer preservatives
Rapid evolution towards blended value-added
liquid foods combining nutritional attributes of
fruits, vegetables & dairy – as produced by
Stork solutions & ReadyGo Veggie skid
DSI waterjet portioners with iOPS capabilities
to provide customers with portioning flexibility
Sterilization solutions & emerging
technologies, such as aseptic filling, that extend
food shelf life without compromising taste
profiles & food safety
New SMEPP & HPC series products that
address challenging power & air needs for
military aircraft
JBT Advantage
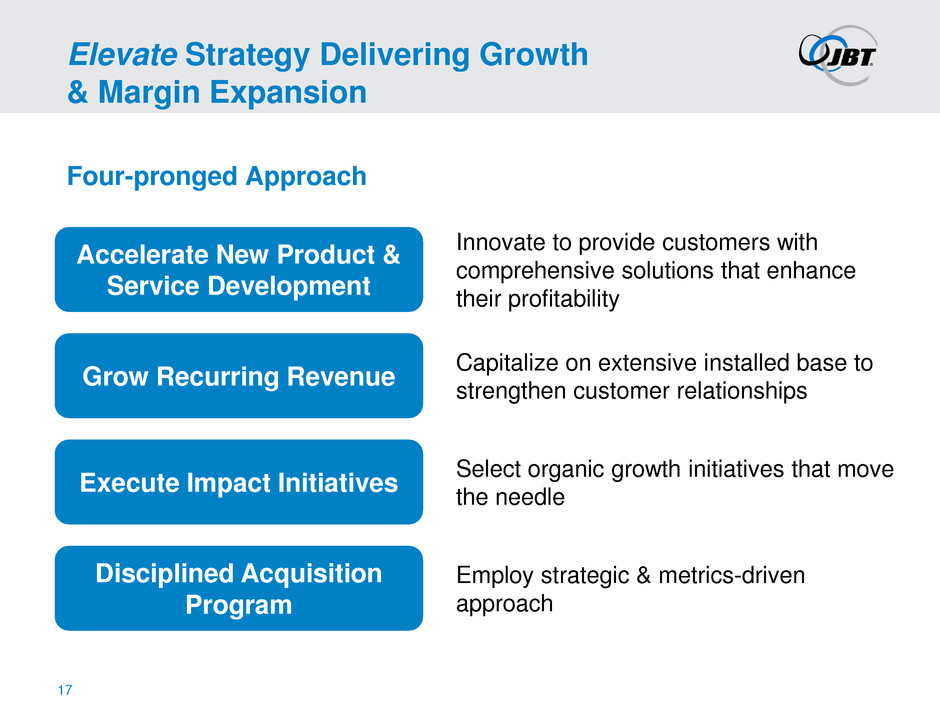
Elevate Strategy Delivering Growth
& Margin Expansion
17
Grow Recurring Revenue
Disciplined Acquisition
Program
Accelerate New Product &
Service Development
Execute Impact Initiatives
Innovate to provide customers with
comprehensive solutions that enhance
their profitability
Capitalize on extensive installed base to
strengthen customer relationships
Select organic growth initiatives that move
the needle
Employ strategic & metrics-driven
approach
Four-pronged Approach
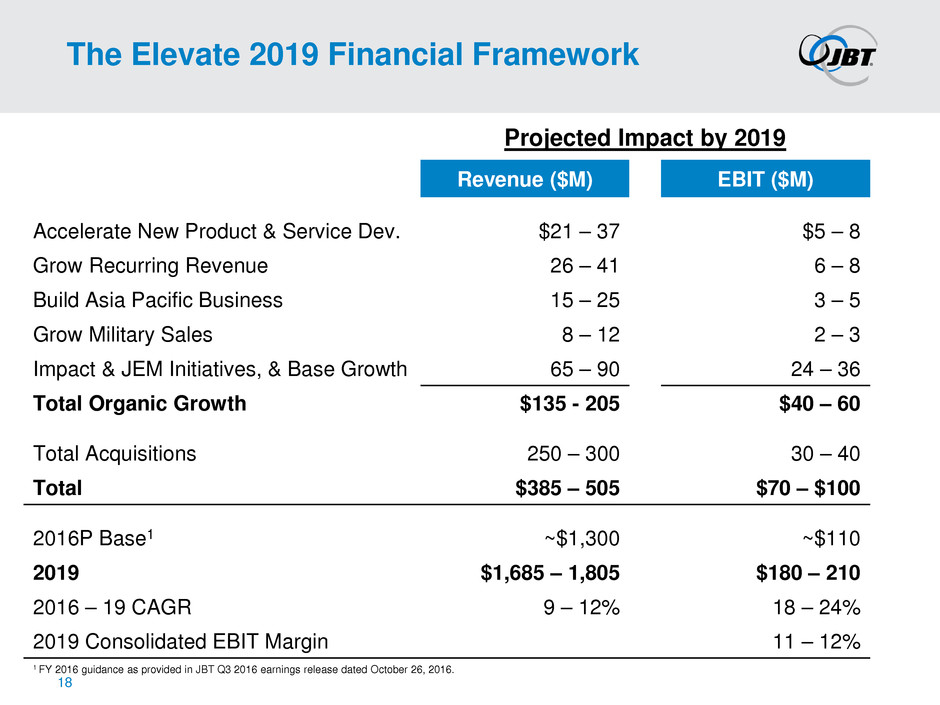
18
Projected Impact by 2019
Revenue ($M) EBIT ($M)
Accelerate New Product & Service Dev. $21 – 37 $5 – 8
Grow Recurring Revenue 26 – 41 6 – 8
Build Asia Pacific Business 15 – 25 3 – 5
Grow Military Sales 8 – 12 2 – 3
Impact & JEM Initiatives, & Base Growth 65 – 90 24 – 36
Total Organic Growth $135 - 205 $40 – 60
Total Acquisitions 250 – 300 30 – 40
Total $385 – 505 $70 – $100
2016P Base1 ~$1,300 ~$110
2019 $1,685 – 1,805 $180 – 210
2016 – 19 CAGR 9 – 12% 18 – 24%
2019 Consolidated EBIT Margin 11 – 12%
The Elevate 2019 Financial Framework
1 FY 2016 guidance as provided in JBT Q3 2016 earnings release dated October 26, 2016.
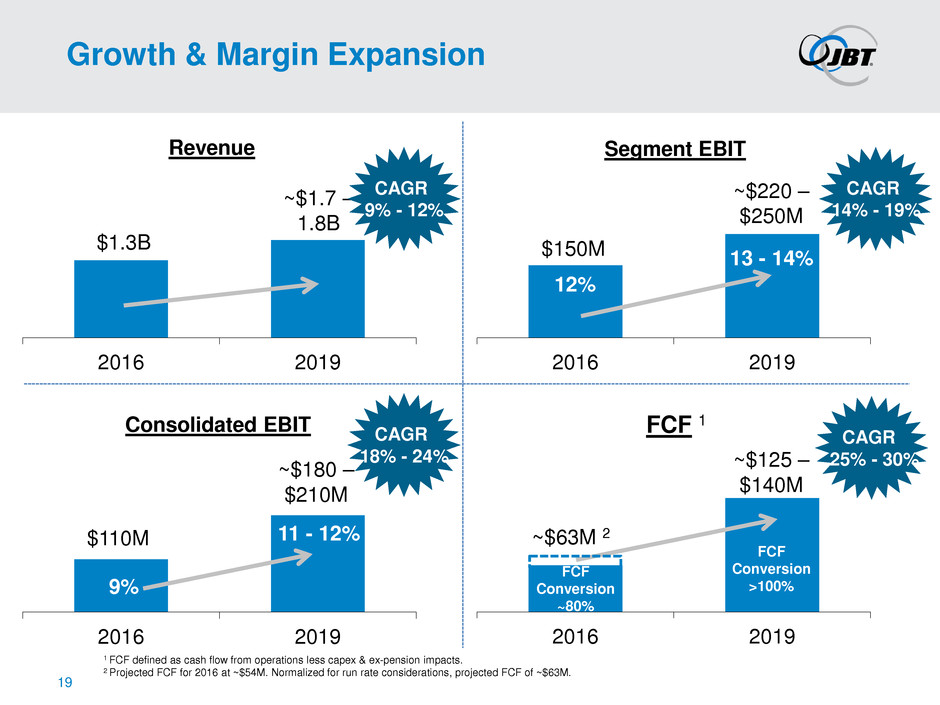
2016 2019
FCF 1
Growth & Margin Expansion
1 FCF defined as cash flow from operations less capex & ex-pension impacts.
2 Projected FCF for 2016 at ~$54M. Normalized for run rate considerations, projected FCF of ~$63M.
2016 2019
Revenue
$1.3B
~$1.7 –
1.8B
2016 2019
Segment EBIT
$150M
~$220 –
$250M
2016 2019
Consolidated EBIT
9%
11 - 12% $110M
~$180 –
$210M
FCF
Conversion
>100%
12%
13 - 14%
CAGR
9% - 12%
CAGR
25% - 30%
CAGR
18% - 24%
CAGR
14% - 19%
19
~$63M 2
~$125 –
$140M
FCF
Conversion
~80%
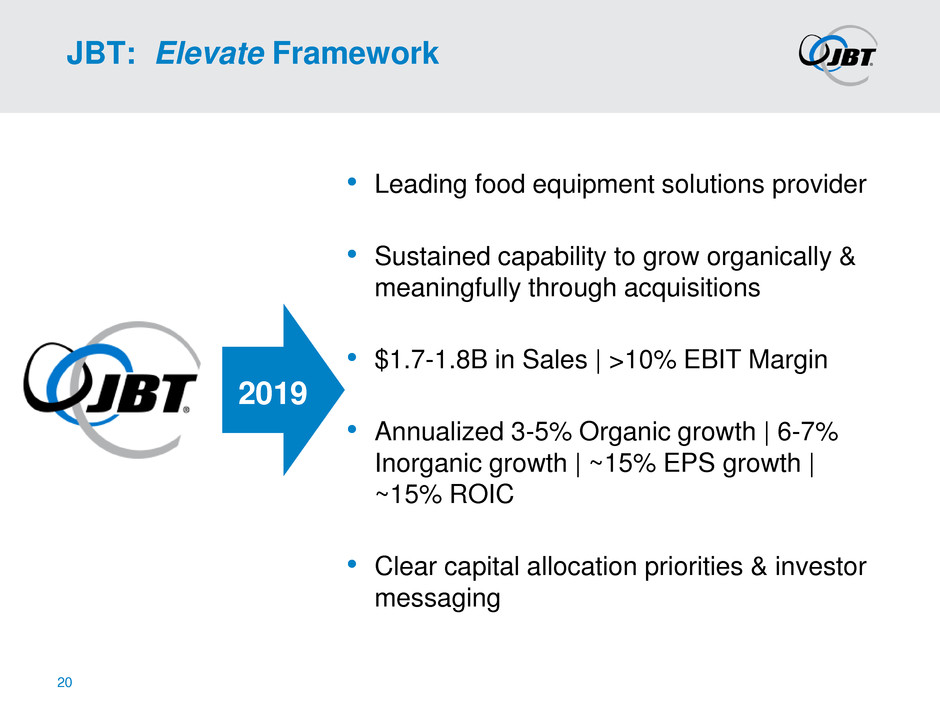
JBT: Elevate Framework
2019
• Leading food equipment solutions provider
• Sustained capability to grow organically &
meaningfully through acquisitions
• $1.7-1.8B in Sales | >10% EBIT Margin
• Annualized 3-5% Organic growth | 6-7%
Inorganic growth | ~15% EPS growth |
~15% ROIC
• Clear capital allocation priorities & investor
messaging
20
JBT Investor Presentation
Baird 2016 Global Industrial Conference
November 9, 2016
