Attached files
UNITED STATES
SECURITIES AND EXCHANGE COMMISSION
Washington, D.C. 20549
FORM 10-K
(Mark One)
|
x
|
ANNUAL REPORT PURSUANT TO SECTION 13 OR 15(d) OF THE SECURITIES EXCHANGE ACT OF 1934
|
For the fiscal year ended December 31, 2010
OR
|
¨
|
TRANSITION REPORT PURSUANT TO SECTION 13 OR 15(d) OF THE SECURITIES EXCHANGE ACT OF 1934
|
Commission file number: 1-34036
John Bean Technologies Corporation
(Exact name of registrant as specified in its charter)
|
Delaware
|
91-1650317
|
|
|
(State or other jurisdiction of
incorporation or organization)
|
(I.R.S. Employer
Identification Number)
|
70 West Madison Street
Chicago, IL 60602
(Address of principal executive offices)
(312) 861-5900
(Registrant’s telephone number, including area code)
Securities registered pursuant to Section 12(b) of the Act:
|
Title of Each Class
|
Name of Exchange on Which Registered
|
|
|
Common Stock, $0.01 par value
Preferred Share Purchase Rights
|
New York Stock Exchange
New York Stock Exchange
|
Securities registered pursuant to Section 12(g) of the Act: None
Indicate by check mark if the registrant is a well-known seasoned issuer as defined in Rule 405 of the Securities Act. Yes ¨ No x
Indicate by check mark if the registrant is not required to file reports pursuant to Section 13 or Section 15(d) of the Act. Yes ¨ No x
Indicate by check mark whether the registrant (1) has filed all reports required to be filed by Section 13 or 15(d) of the Securities Exchange Act of 1934 during the preceding 12 months (or for such shorter period that the registrant was required to file such reports), and (2) has been subject to such filing requirements for the past 90 days. Yes x No ¨
Indicate by check mark if disclosure of delinquent filers pursuant to Item 405 of Regulation S-K is not contained herein, and will not be contained, to the best of the registrant’s knowledge, in definitive proxy or information statements incorporated by reference in Part III of this Form 10-K or any amendment to this Form 10-K. x
Indicate by check mark whether the registrant has submitted electronically and posted on its corporate Web site, if any, every Interactive Data File required to be submitted and posted pursuant to Rule 405 of Regulation S-T during the preceding 12 months (or for such shorter period that the registrant was required to submit and post such files). Yes ¨ No ¨
Indicate by check mark whether the registrant is a large accelerated filer, an accelerated filer, a non-accelerated filer or a smaller reporting company. See definitions of “large accelerated filer,” “accelerated filer” and “smaller reporting company” in Rule 12b-2 of the Exchange Act. (Check one):
Large accelerated filer ¨ Accelerated filer x Non-accelerated filer ¨ Smaller reporting company ¨
Indicate by check mark whether the registrant is a shell company (as defined in Rule 12b-2 of the Exchange Act). Yes ¨ No x
The aggregate market value of common stock held by non-affiliates of the registrant on the last business day of the registrant’s most recently completed second fiscal quarter was: $409,615,033.
At February 28, 2011, there were 28,641,164 shares of the registrant’s common stock outstanding.
DOCUMENTS INCORPORATED BY REFERENCE
Portions of the registrant’s Proxy Statement for the 2011 Annual Meeting of Stockholders are incorporated herein by reference in Part III of this Annual Report on Form 10-K to the extent stated herein.
|
Page
|
|
|
PART I
|
|
|
Item 1. Business
|
4
|
|
Item 1A. Risk Factors
|
14
|
|
Item 1B. Unresolved Staff Comments
|
24
|
|
Item 2. Properties
|
25
|
|
Item 3. Legal Proceedings
|
25
|
|
PART II
|
|
|
Item 5. Market for Registrant’s Common Equity and Related Stockholder Matters
|
26
|
|
Item 6. Selected Financial Data
|
27
|
|
Item 7. Management’s Discussion and Analysis of Financial Condition and Results of Operations
|
28
|
|
Item 7A. Qualitative and Quantitative Disclosures About Market Risk
|
37
|
|
Item 8. Financial Statements and Supplementary Data
|
39
|
|
Item 9. Changes in and Disagreements with Accountants on Accounting and Financial Disclosure
|
66
|
|
Item 9A. Controls and Procedures
|
66
|
|
Item 9B. Other Information
|
66
|
|
PART III
|
|
|
Item 10. Directors, Executive Officers and Corporate Governance
|
68
|
|
Item 11. Executive Compensation
|
68
|
|
Item 12. Security Ownership of Certain Beneficial Owners and Management and Related Stockholder Matters
|
68
|
|
Item 13. Certain Relationships and Related Transactions, and Director Independence
|
68
|
|
Item 14. Principal Accountant Fees and Services
|
68
|
|
PART IV
|
|
|
Item 15. Exhibits and Financial Statement Schedules
|
69
|
|
Signatures
|
72
|
2
SPECIAL NOTE ABOUT FORWARD-LOOKING STATEMENTS
This Annual Report on Form 10-K and other materials filed or to be filed by John Bean Technologies Corporation, as well as information in oral statements or other written statements made or to be made by us, contain statements that are, or may be considered to be, forward-looking statements. All statements that are not historical facts, including statements about our beliefs or expectations, are forward-looking statements. You can identify these forward-looking statements by the use of forward-looking words such as “outlook,” “believes,” “expects,” “potential,” “continues,” “may,” “will,” “should,” “seeks,” “approximately,” “predicts,” “intends,” “plans,” “estimates,” “anticipates,” “foresees” or the negative version of those words or other comparable words and phrases. Any forward-looking statements contained in this Annual Report on Form 10-K are based upon our historical performance and on current plans, estimates and expectations. The inclusion of this forward-looking information should not be regarded as a representation by us or any other person that the future plans, estimates or expectations contemplated by us will be achieved. These forward looking statements include, among others, statements relating to:
| • |
Fluctuations in our financial results;
|
|
|
•
|
Unanticipated delays or acceleration in our sales cycles;
|
|
|
•
|
Deterioration of economic conditions;
|
|
|
•
|
Sensitivity of segments to variable or volatile factors;
|
|
|
•
|
Changes in demand for our products and services;
|
|
|
•
|
Changes in commodity prices, including those impacting materials used in our business;
|
|
|
•
|
Disruptions in the political, regulatory, economic and social conditions of the foreign countries in which we conduct business;
|
|
|
•
|
Increases in energy prices;
|
|
|
•
|
Changes in food consumption patterns;
|
|
|
•
|
Impacts of pandemic illnesses, food borne illnesses and diseases to various agricultural products;
|
|
|
•
|
Weather conditions and natural disasters;
|
|
|
•
|
Acts of terrorism or war;
|
|
|
•
|
Termination or loss of major customer contracts;
|
|
|
•
|
Customer sourcing initiatives;
|
|
|
•
|
Competition and innovation in our industries;
|
|
|
•
|
Our ability to develop and introduce new or enhanced products and services;
|
|
|
•
|
Difficulty in developing, preserving and protecting our intellectual property;
|
|
|
•
|
Our ability to protect our information systems;
|
|
|
•
|
Adequacy of our internal controls;
|
|
|
•
|
Our ability to successfully integrate, operate and manage acquired businesses and assets;
|
|
|
•
|
Loss of key management and other personnel;
|
|
|
•
|
Potential liability arising out of the installation or use of our systems;
|
|
|
•
|
Our ability to comply with the laws and regulations governing our U.S. government contracts;
|
|
|
•
|
Our ability to comply with U.S. and international laws governing our operations and industries;
|
|
|
•
|
The outcome of pending or future litigation;
|
|
|
•
|
Increases in tax liabilities;
|
|
|
•
|
Difficulty in implementing our business strategies;
|
|
|
•
|
Availability and access to financial and other resources;
|
|
|
•
|
Failure to qualify as a tax-free reorganization; and
|
|
|
•
|
Our ability to establish our own financial, administrative and other support functions.
|
We believe that the factors that could cause our actual results to differ materially include but are not limited to the factors we describe herein, including under “Risk Factors,” and “Management’s Discussion and Analysis of Financial Condition and Results of Operations.” If one or more of those or other risks or uncertainties materialize, or if our underlying assumptions prove to be incorrect, actual results may vary materially from what we projected. Consequently, actual events and results may vary significantly from those included in or contemplated or implied by our forward-looking statements. The forward-looking statements included in this Annual Report on Form 10-K are made only as of the date hereof, and we undertake no obligation to publicly update or review any forward-looking statement made by us or on our behalf, whether as a result of new information, future developments, subsequent events or circumstances or otherwise.
3
PART I
Unless the context indicates otherwise, all references in this report to JBT Corporation, the Company, us, we, or our include John Bean Technologies Corporation and its subsidiaries (JBT Corporation). Effective July 31, 2008, JBT Corporation was spun-off from FMC Technologies, Inc. (FMC Technologies) and became a separate, publicly-traded company. This transaction is referred to in this Annual Report on Form 10-K as the “distribution” or the “spin-off.” Prior to the spin-off, JBT Corporation and its subsidiaries were wholly-owned subsidiaries of FMC Technologies and our operations were a part of FMC Technologies’ operations.
Overview
We are a global technology solutions provider for the food processing and air transportation industries. We design, manufacture, test and service technologically sophisticated systems and products for customers through our JBT FoodTech and JBT AeroTech segments.
JBT FoodTech markets its solutions and services to multi-national and regional industrial food processing companies. The product offerings of our JBT FoodTech businesses include:
|
•
|
freezer solutions for the freezing and chilling of meat, seafood, poultry, ready-to-eat meals, fruits, vegetables and bakery products;
|
|
|
|
•
|
protein processing solutions that portion, coat and cook poultry, meat, seafood, vegetable and bakery products;
|
|
|
•
|
in-container processing solutions for fruits, vegetables, soups, sauces, dairy and pet food products as well as ready-to-eat meals in a wide variety of modern packages; and
|
|
|
•
|
fruit processing solutions that extract, concentrate and aseptically process citrus, tomato and other fruits and juices.
|
JBT AeroTech markets its solutions and services to domestic and international airport authorities, passenger airlines, airfreight and ground handling companies and military forces. The product offerings of our JBT AeroTech businesses include:
|
•
|
ground support equipment for cargo loading, aircraft deicing and aircraft towing;
|
|
|
|
•
|
gate equipment for passenger boarding, on the ground aircraft power and cooling;
|
|
|
•
|
airport services for maintenance of airport equipment, systems and facilities;
|
|
|
•
|
military equipment for cargo loading, aircraft towing and on the ground aircraft cooling; and
|
|
•
|
automatic guided vehicles for material handling in the automotive, printing, food & beverage, manufacturing, warehouse, and hospital industries.
|
Most of our product offerings contribute more than 10% to our consolidated revenue. While the business contribution varies year to year, individual revenue contributions of these product offerings have been between 2% and 18% of consolidated revenue. For financial information about our business segments see Note 17 of our consolidated financial statements included in Item 8 of this Annual Report on Form 10-K.
In October 2007, FMC Technologies announced an intention to separate into two independent publicly-traded companies through the distribution of 100% of its FoodTech and Airport Systems businesses to the shareholders of FMC Technologies (the “Separation”). In preparation for the Separation, FMC Technologies contributed all of the assets and liabilities of the FoodTech and Airport Systems business to JBT Corporation, a wholly-owned subsidiary of FMC Technologies. FMC Technologies accomplished the Separation through a distribution of .216 of a share of JBT Corporation common stock for every share of FMC Technologies common stock on July 31, 2008, to FMC Technologies shareholders of record as of July 22, 2008.
Our principal executive offices are located at 70 West Madison, Suite 4400, Chicago, IL 60602.
4
BUSINESS SEGMENTS
JBT FoodTech
Overview
JBT FoodTech is a leading supplier of customized industrial food processing solutions and services used in the food processing industry. We design, manufacture and service technologically sophisticated food processing systems for the preparation of ready-to-eat meals, shelf stable packaged foods, meat, seafood and poultry products, bakery products, juice and dairy products, and fruit and vegetable products.
We believe our success is derived from our continued technological innovation. We broadly categorize our technology solutions offerings into freezing and chilling, protein processing, in-container processing and fruit processing. We apply these differentiated and proprietary technologies to meet our customers’ food processing needs. We continually strive to improve our existing solutions and develop new solutions by working closely with our customers.
Our historically strong position in the markets we serve has provided us with a large installed base of systems and equipment. Throughout our history, we have delivered over 40,000 pieces of food processing equipment which includes more than 8,000 industrial freezers, 2,400 industrial citrus juice extractors, 3,000 industrial sterilization systems and 8,000 coating systems. We estimate that the installed base of our equipment collectively processes approximately 75% of the global production of citrus juices, freezes approximately 50% of commercially frozen foods on a global basis and sterilizes approximately 50% of the world’s canned foods. This installed base provides a stream of recurring revenue from aftermarket products, parts, services and lease arrangements. Recurring revenue accounted for approximately 47% of our JBT FoodTech total revenue in 2010. Our installed base also provides us with strong, long-term customer relationships from which we derive information for new product development to meet the evolving needs of our food processing customers.
We have operations positioned around the world to serve our existing JBT FoodTech equipment base located in more than 100 countries. Our principal production facilities are located in the United States (California, Ohio and Florida), Belgium, Brazil, China, Italy, South Africa, Sweden and the United Kingdom. In addition to sales and services offices based in more than 25 countries, we also support our customers in their development of new food products and processes as well as the refinement and experimentation of their current applications through eight technical centers located in the United States (California, Ohio and Florida), Brazil, Sweden, Belgium, Italy and China. Our global presence allows us to provide direct customized support to customers virtually anywhere they process foods.
Solutions, Products and Services
We offer a broad portfolio of systems, equipment and services to our customers which are often sold as part of a fully integrated processing line solution. Our systems are typically customized to meet the specific customer application needs. Thus, actual production capacity ranges vary and are dependent on the food and product packaging type being processed.
Freezing and Chilling. We developed the first commercial food processing freezers in the 1960s, and we remain the world’s leading supplier of freezing and chilling solutions to the food processing industry. We design, assemble, test and install industry-leading technologies that include individual quick freezing (IQF), self-stacking spiral, linear/impingement and contact freezers and chillers. Our freezers are designed to meet the most stringent demands for quality, economy, hygiene and user-friendliness. We offer a full range of capacities and accessories to optimize our customers’ variable production needs. Our industrial freezers can be found in plants that are processing food products ranging from meat, seafood and poultry to bakery products and ready-to-eat meals, fruits, vegetables and dairy products. The following is an overview of our freezing and chilling technology offerings.
|
Product Offering
|
|
Product Description
|
|
Food Applications
|
|
Capacity Ranges
|
|
|
FloFREEZE®
Individual Quick Freeze (IQF)
|
|
Individually freezes sensitive, sticky and uneven shaped products
|
|
Fruits, Vegetables, Seafood, Pasta, Rice
|
|
Over 16 tons/hour
|
|
|
GYRoCOMPACT® Self-Stacking
Spiral Freezer, Chiller, Proofer
|
|
Compact, self-contained design for quick, uniform freezing
|
|
Poultry, Meat, Seafood, Bakery, Dairy, Vegetables, Ready Meals
|
|
Over 9 tons/hour
|
|
|
ADVANTEC® Impingement Linear Freezers and Chillers
|
|
Quick freezing of thin, flat food
|
|
Meat, Seafood
|
|
Up to 5 tons/hour (over 20,000 ¼ lb burgers per hour)
|
|
5
Protein Processing. We are a leading supplier of equipment and services that enable us to provide integrated protein processing lines for a variety of convenience food products. Our broad systems offering includes horizontal slicers, continuous water-jet portioners, coating and seasoning applicators, frying systems and oven and cooking systems. Our fully integrated processing lines often span from the raw products initial point of entry onto the processing line through final packaging. Although our solutions are primarily used in the processing of poultry (including nuggets, strips and wings), we also provide systems that portion, coat or cook other food products ranging from breads and pizzas to meat patties, seafood and ready-to-eat meals. All of these applications we collectively refer to as “protein processing.” We believe that our installed base of cooking systems processes more meat, seafood and poultry products in North America than that of any other food processing equipment supplier. The following is an overview of our protein processing technology offerings.
|
Product Offering
|
|
Product Description
|
|
Food Applications
|
|
Capacity Ranges
|
|
|
DSI Portioning Systems
|
|
Horizontal slicing for consistent product thickness and computer-positioned vertical high-pressure water-jets cut complex shapes
|
|
Poultry, Meat,
Seafood, Pizza
|
|
Over 1 ton/hour
|
|
|
Coating Applicators
|
|
Application of batter, tempura or breading prior to cooking
|
|
Poultry, Meat,
Seafood, Vegetables
|
|
Over 7 tons/hour (over 150,000 ½ oz. chicken nuggets per hour)
|
|
|
THERMoFIN™Frying Systems
|
|
Patented technology that heats oil quickly and precisely for even and cost effective frying
|
|
Poultry, Meat,
Seafood
|
|
Over 7 tons/hour (over 150,000 ½ oz. nuggets/hour)
|
|
|
GYRoCOMPACT® Spiral Ovens
|
|
Multi-zone spiral oven with programmable air control for consistent and uniform cooking
|
|
Poultry, Meat,
Seafood
|
|
Over 9 tons/hour (over 40,000 4 oz. chicken breasts per hour)
|
|
|
JSO JetStream® Linear Ovens
|
|
High intensity convection oven for fast cooking with optimal flavor sealing and browning
|
|
Meat, Poultry
|
|
Over 4.5 tons/hour (over 20,000 ¼ lb. burgers per hour)
|
|
|
Double D Revoband Linear Oven
|
|
Custom built, high impingement oven for roasting, steaming and baking
|
|
Bakery, Meat, Seafood, Poultry, Vegetables
|
|
Over 1.6 tons/hour (over 30,000 Croissants per hour)
|
|
In-Container Processing. We are a leading global supplier of fully integrated industrial sterilization systems that manufacture shelf stable foods in a wide variety of flexible and rigid packages. These integrated solutions include fillers, closers, sterilizers, material handling systems and controls that process foods including fruits and vegetables, soups and sauces, dairy products, a broad range of ready-to-eat meals and pet foods. We offer the largest selection of sterilization products in the industry, including continuous rotary and hydrostatic sterilizers primarily used for processing metal cans. We also provide automated batch retorts which can process an array of flexible and rigid packages such as plastic pouches, cartons, glass and cans. Our solutions offering also includes specialized material handling systems to automate the handling and tracking of processed and unprocessed containers. Additionally, we offer leading modeling software as well as thermal processing controls that help our customers optimize and track their cooking processes and introduce on-line corrections in the case of process deviations. The following is an overview of our in-container processing solutions technology offerings.
|
Product Offering
|
|
Product Description
|
|
Food Applications
|
|
Capacity Ranges
|
|
|
Fillers
|
|
Filling of wide-neck, rigid and pre-formed containers with food and beverage products
|
|
Ready Meals, Soups, Sauces, Baby Food, Fruits, Vegetables, Seafood, Meat, Poultry, Milk, Ready to Drink Coffee and Tea, Pet Food
|
|
Over 1,200 containers per minute
|
|
|
Closers
|
|
Closing and seaming of can after being filled
|
|
Ready Meals, Soups, Sauces, Baby Food, Fruits, Vegetables, Seafood, Meat, Poultry, Milk, Ready to Drink Coffee and Tea, Pet Food
|
|
Up to 2,000 containers per minute
|
|
|
Continuous Rotary and Hydrostatic Sterilizers
|
|
Commercial sterilization of food in cans
|
|
Ready Meals, Canned Milk, Soups, Sauces, Fruits, Vegetables, Seafood, Meat, Poultry, Pet Food
|
|
Over 1,800 containers per minute (550 cans of soup/minute or 2,000 cans of cat food per minute)
|
|
|
Automated Batch Retorts
|
|
Commercial sterilization of foods in flexible or rigid pre-formed packaging
|
|
Ready Meals, Soups, Sauces, Baby Food, Fruits, Vegetables, Seafood, Meat, Poultry
|
|
Over 1,500 containers per minute (600 microwave pasta bowls per minute)
|
|
|
LOG-TEC™
Control Systems and Modeling Software
|
|
Automated control and documentation of sterilization process; modeling software to optimize cooking processes
|
|
Ready Meals, Canned Milk, Soups, Sauces, Baby Food, Fruits, Vegetables, Seafood, Meat, Poultry, Pet Food
|
|
Matches the sterilization system capacity
|
|
6
Fruit Processing. We are the leading supplier of industrial citrus processing equipment. Our citrus processing solutions typically include citrus extractors, finishers, pulp systems, evaporators and citrus ingredient recovery systems as well as aseptic systems (including sterilizers, fillers, flow lines and controls) integrated with bulk aseptic storage systems for not-from-concentrate orange juice. In addition to our high capacity industrial extractors, we also offer point of use Fresh’n Squeeze ® produce juicers. These patented juicers are used around the world in hotels, restaurants, coffee shops, convenience stores and juice bars.
We are among the leading suppliers of tomato and fruit processing equipment and aseptic sterilization and bulk filling systems. Our tomato and fruit processing lines are comprised of extraction, finishing, heating and mixing equipment, enzyme inactivators, evaporators, flash coolers, sterilizers and aseptic fillers that are mainly sold as an integrated processing line. We can also provide equipment for a specific need within a line. Our tomato processing lines are installed with leading processors throughout the world’s key tomato growing regions and produce a range of finished tomato products including tomato paste, concentrates, peeled tomato products, diced tomatoes, salsa, pizza sauce, ketchup and pureed and crushed tomatoes. Our aseptic processing lines are used in the bulk processing of a wide range of deciduous and tropical fruits into juices, particulates, purees and concentrates. These fruit products are used as ingredients for dairy products (yogurts, smoothies, flavored milk, and ice cream), bakery products and fruit-based beverages.
We provide technology solutions and products to extend the life, improve the appearance and preserve the taste of fresh fruits and vegetables. Once protected, fresh fruits or vegetables are individually labeled by our fast and efficient produce labeling systems. We also provide an integrated food safety solutions package including advisory services and data collection, management and monitoring technologies. The following is an overview of our fruit processing technology offerings.
|
Product Offering
|
|
Product Description
|
|
Food Applications
|
|
Capacity Ranges
|
|
|
Extractors, Pulpers, Finishers
|
|
Extract juice and/or pulp from fruit for large-scale processing and point-of-sale applications
|
|
Citrus, Tomatoes, Berries, Deciduous and Tropical Fruits
|
|
Industrial extractor: over 900 gallons per hour of juice
|
|
|
Hot & Cold Breaks, Evaporators
|
|
Enzymatic inactivation, concentration and aseptic cooling to preserve fruit product color and taste
|
|
Citrus, Tomatoes, Berries, Deciduous and Tropical Fruits
|
|
Over 70 tons/hour
|
|
|
Aseptic Sterilizers and Fillers
|
|
Aseptic commercial sterilization, cooling and bulk filling of fruit puree, concentrate or paste into 3 gallon to 300 gallon containers
|
|
Citrus, Tomatoes, Deciduous and Tropical Fruits
|
|
Aseptic sterilizer:
over 60 tons/hour
Aseptic filler:
over 19 tons/hour
|
|
|
Fresh Produce Technologies
|
|
Preservation of fresh produce life, appearance and taste.
High speed application of Price Look Up labels
|
|
Fruits, Vegetables
|
|
Coating application rates variable to match line speed
Apply 900+ labels per minute
|
|
Aftermarket Products, Parts and Services. We provide aftermarket products, parts and services for all of our integrated food processing systems and equipment. We provide retrofits and refurbishments to accommodate changing operational requirements, and we supply our own brand of food grade lubricants and cleaners designed specifically for our equipment. We also provide continuous, proactive service to our customers including the fulfillment of preventative maintenance agreements, consulting services such as water treatment, corrosion monitoring control, food safety and process auditing and the provision of on-site technical personnel. In addition to helping our customers reduce their operating costs and improve efficiencies, our customer service focus also helps us maintain strong commercial relationships and provides us with ongoing access to information about our customers’ requirements and strategies to foster continuing product development. Our aftermarket products, parts and services coupled with our large installed base of food processing systems and equipment, provide us with a strong base for growing recurring revenue.
7
JBT AeroTech
Overview
JBT AeroTech is a leading supplier of customized solutions and services used for applications in the air transportation industry. We design, manufacture and service technologically sophisticated ground support equipment, airport gate equipment, automated systems and services for airport authorities, airlines, airfreight, ground handling companies, the military and other industries.
We believe our strong market positions result from our ability to customize our equipment and services utilizing differentiated technology to meet the specific needs of our customers. We continually strive to improve our existing technologies and develop new technologies by working closely with our well established customer base.
As a market leader for many decades, there is a significant installed base of our airport and airline equipment around the world. We have delivered the largest volume of cargo loaders (9,000+), passenger boarding bridges (7,400+) and aircraft deicers (4,400+). We have also sold more than 2,100 mobile passenger steps, 1,800 cargo transporters and 1,500 tow tractors that are operating at airports around the world. This installed base provides a stream of recurring revenue from aftermarket parts, products and services. Recurring revenue accounted for approximately 35% of JBT AeroTech total revenue in 2010. Our installed base also offers continuous access to customer feedback for improvements and new product development.
JBT AeroTech products have been delivered to more than 100 countries. To support this equipment, we have operations located throughout the world. Our principal production facilities are located in the United States (Florida, Utah and Pennsylvania), China, Mexico and Spain. To augment our sourcing and manufacturing capabilities, we have established dedicated sourcing resources in India and China as well as regional manufacturing in Asia. We also have sales and services offices located in nine countries and collaborative relationships with independent sales representatives, distributors and service providers in over thirty additional countries.
Solutions, Products and Services
We offer a broad portfolio of systems, equipment and services to our airport authority, airline, air cargo, ground handling and military customers.
Ground Support Equipment. We are a leading supplier of air cargo loaders to commercial air passenger and freight carriers and ground handlers. Our Commander™ loaders service containerized narrow-body and wide-body jet aircraft and are available in a wide range of configurations.
We manufacture and supply Tempest™ aircraft deicers with a broad range of options that can be configured to meet customers’ specific and regional need to provide efficient aircraft deicing while on the tarmac. We offer a full array of conventional and towbarless aircraft tow tractors for moving aircraft without consumption of jet fuel and self propelled transporters for pallet and container handling. We also offer a line of self-propelled passenger boarding steps.
We manufacture and supply the RampSnake® bulk loader for the loading of baggage, cargo and mail packages into aircraft baggage holds.
Airlines and ground handling companies face increased pressure to reduce emissions and minimize fuel usage. We have a long history of delivering alternative fuel ground support equipment that provides a solution to these environmental and operational challenges. Our alternative fuel design approach is to provide modular ground support equipment, capable of being powered by a variety of power sources. Our electric powered product offering includes Commander cargo loaders, cargo transporters, RampSnake bulk loading systems, conventional aircraft pushback tractors, towbarless tow tractors and passenger boarding steps. We also offer electric retrofit kits for our existing delivered base of diesel powered Commander cargo loaders. The following is an overview of our ground support equipment technology offerings.
8
|
Product Offering
|
Product Description
|
Aircraft Ranges
|
Capacity Ranges
|
||||
|
Cargo Loaders
|
Loading and unloading of containerized cargo onto main and lower decks of aircraft
|
Wide variety of passenger and freighter aircraft up to Airbus A380
|
Up to 66,000 lbs
|
||||
|
Cargo Transporters
|
Transport of containerized cargo to or from aircraft
|
Aircraft handling full size pallets or containers
|
Up to 15,400 lbs at
15.5 mph
|
||||
|
Bulk Loader
|
Loading of baggage, cargo or mail packages into baggage holds with minimal lifting
|
Boeing 737 to 757-200 and Airbus A319 to 321
|
Up to 880 lbs
|
||||
|
Aircraft Deicers
|
Deicing of aircraft on the ground including removal of snow, ice and frost
|
Wide variety of aircraft up to Airbus A380
|
Up to 2,200 gallons capacity of deicing fluid
|
||||
|
Aircraft Tow Tractors
|
Pushing back of aircraft from gate or aircraft towing between gate and hangar
|
Regional to wide-body aircraft including Airbus A380
|
Draw bar pull of up to 72,000 lbs
|
||||
|
Passenger Steps
|
Boarding of passengers when a boarding bridge is not available
|
Front and rear boarding doors of narrow and wide-body aircraft
|
Load capacity up to 13,000 lbs.
|
Gate Equipment. We are a leading supplier of gate equipment. Our Jetway® passenger boarding bridges have been used by airlines and airport authorities to move passengers between the terminal building and the aircraft since 1959.
We also manufacture a variety of sizes and configurations of auxiliary equipment including 400 Hertz ground power and preconditioned air units that supply aircraft requirements for electrical power and cooled air circulation for the environmental control system (air-conditioning) and main engine starting during ground operations. Our point-of-use 400 Hertz and pre-conditioned air units enable our customers to reduce fuel consumption and emissions by minimizing requirements to use auxiliary power units or aircraft engines while parked at the gate. The following is an overview of our gate equipment technology offerings.
|
Product Offering
|
|
Product Description
|
|
Aircraft Ranges
|
|
Capacity Ranges
|
|
|
Passenger Boarding Bridges
|
|
Bridge for moving passengers between the airport terminal building and the aircraft
|
|
Regional Jets up to Airbus A380
|
|
Link aircraft with the airport terminal
|
|
|
Ground Power
|
|
Provide power and light for passenger and crew onboard, while waiting to be pushed back from gate
|
|
Regional Jets up to Airbus A380
|
|
Converts 50/60 Hertz utility power to aircraft compatible 400 Hertz power
|
|
|
Preconditioned Air
|
|
Climate convenience for passenger and crew onboard, while waiting to be pushed back from gate
|
|
Regional Jets up to Airbus A380
|
|
20 to 120 refrigerated tons preconditioned air units for ground cooling
|
|
Military Equipment. In 2000, we were awarded the production contract to supply the U.S. Air Force with a new generation of military air cargo loader which is now known as the Halvorsen loader. We have delivered over 470 Halvorsen 25K Loaders to the United States military and international forces and we continue to provide parts support, service and retrofit kits for these Halvorsen loaders. We also have begun to supply these loaders to other branches of the U.S. Department of Defense and other international military customers.
Our Ground Support and Gate Equipment product lines also supply large aircraft tow tractors to the U.S. Air Force. We supply a wide range of mobile air conditioning units to the U.S. Air Force, the U.S. Navy, international military forces and airframe manufacturers. The following is an overview of our military equipment technology offering.
|
Product Offering
|
|
Product Description
|
|
Aircraft Ranges
|
|
Capacity Ranges
|
|
|
Halvorsen 25K and 44K Cargo Loaders
|
|
Rapidly deployable, high-reach loader that can transport and lift cargo onto military cargo aircraft
|
|
Cargo transport aircraft from C-130 up to the C-17 and KC-10
|
|
Load and transport up to 44,000 lbs
|
|
|
Aircraft Tow Tractors
|
|
Towing of aircraft around the airport ramp
|
|
Large cargo transport aircraft
|
|
Draw bar pull of up to 72,000 lbs
|
|
|
Mobile Air Conditioning
|
|
Mobile air conditioning units used for on the ground cooling
|
Jet fighters up to cargo transport aircraft
|
|
30 to 110 ton mobile air conditioning units
|
|
|
9
Airport Services. We are an industry leading provider of ground support and gate equipment, systems and facility maintenance services to airlines and airports throughout North America and the Pacific. Our expertise extends to the operation, maintenance and repair of airport gate systems, baggage handling systems, airport facilities and ground support equipment. We also offer technology and operations monitoring services centered around our patented iOPS™ suite that links maintenance management systems and aircraft avionics data to critical ground-based monitoring, diagnostic and tracking systems on gate equipment, baggage handling systems, facility systems and ground support equipment.
Automated Systems. We are an industry leader in providing fully integrated Automatic Guided Vehicle Systems for repetitive material movement requirements in the automotive, printing, food & beverage, manufacturing, warehouse, and hospital industries. We provide engineering services and simulations to evaluate the material handling requirements, automatic guided vehicle system hardware and software, and hardware and software integration for a complete, seamless solution. We have delivered over 350 automatic guided vehicle systems including over 3,000 guided vehicles.
Aftermarket Products, Parts and Services. We provide aftermarket products, parts and services for our installed base of JBT AeroTech equipment. We also provide retrofits to accommodate changing operational requirements and continuous, proactive service, including, in some cases, on-site technical personnel. These systems and other services represent an integrated approach to addressing critical problems faced by our customers and ensure that we remain well positioned to respond to their new requirements and strategic initiatives through our strong customer relations.
In support of our focus and strategy of meeting our customers’ needs, we have developed a global parts service network to enable us to market with confidence our ability to “provide the right part in the right place.” Our highly experienced global parts representatives help reduce equipment downtime by providing fast, accurate responses to technical questions. We also provide worldwide operations and maintenance training programs to provide maintenance technicians with the tools necessary to deliver the highest possible level of systems reliability.
OTHER BUSINESS INFORMATION RELEVANT TO ALL OF OUR BUSINESS SEGMENTS
Order Backlog
For information regarding order backlog, refer to the section entitled “Inbound Orders and Order Backlog” in Item 7 of this Annual Report on Form 10-K.
Sources and Availability of Raw Materials
All of our business segments purchase carbon steel, stainless steel, aluminum and steel castings and forgings both domestically and internationally. We do not use single source suppliers for the majority of our raw material purchases and believe the available supplies of raw materials are adequate to meet our needs.
Research and Development
The objectives of our research and development programs are to create new products and business opportunities in relevant fields, and to improve existing products.
For additional financial information about Company-sponsored research and development activities, refer to Note 17 to our consolidated financial statements included in Item 8 of this Annual Report on Form 10-K.
Sales and Marketing
We sell and market our products and services predominantly through a direct sales force, supplemented with independent distributors and sales representatives. Our experienced international sales force is comprised of individuals with strong technical expertise in our products and services and the industries in which they are sold.
We support our sales force with marketing and training programs that are designed to increase awareness of our product offerings and highlight our differentiation while providing a set of sales tools to aid in the sales of our technology solutions. We actively employ a broad range of marketing programs to inform and educate customers, the media, industry analysts and academia through targeted newsletters, our web site, seminars, trade shows, user groups and conferences.
10
Patents, Trademarks and Other Intellectual Property
We own a number of United States and foreign patents, trademarks and licenses that are cumulatively important to our business. We own approximately 506 United States and foreign patents and have approximately 287 patent applications pending in the United States and abroad. Further, we license certain intellectual property rights to or from third parties. We also own numerous United States and foreign trademarks and trade names and have approximately 345 registrations and pending applications in the United States and abroad. Developing and maintaining a strong intellectual property portfolio is an important component of our strategy to extend our technology leadership. However, we do not believe that the loss of any one or group of related patents, trademarks or licenses would have a material adverse effect on our overall business.
Competition
We conduct business worldwide and compete with a variety of local and regional companies, which typically are focused on a specific application, technology or geographical area, and a few large multinational companies.
We compete by leveraging our industry expertise to provide differentiated and proprietary technology, integrated systems, high product quality and reliability and quality aftermarket service. In the food processing industry, we also distinguish ourselves by providing increased yields with improved final product quality.
JBT FoodTech’s major competitors include GEA Group Aktiengesellschaft, Convenience Food Systems Inc. (GEA signed a definitive agreement to acquire CFS in December 2010), Heat & Control, Inc., MYCOM, Nantong Freezing Equipment Company, Ltd., Barry-Wehmiller Companies, Inc., Allpax Products, Inc., Steriflow SAS, Atlas Pacific Engineering Company, Inc., Marel Food Systems, Brown International Corp. and CFT S.p.A.
JBT AeroTech’s major competitors include TLD, Schopf Maschinenbau GmbH, Trepel, Verstergaard Company A/S, Global Ground Support LLC, Tug Technologies Corporation, ThyssenKrupp AG, Shenzhen CIMC-TianDa Airport Support Ltd., Linc Facility Services, Johnson Controls Inc., ERMC and Elite Line Services, Inc.
Employees
We employ approximately 3,300 people with approximately 1,900 located in the United States. Approximately 190 of our employees in the United States are represented by one collective bargaining agreement that covers these employees through August of 2011.
Outside the United States, the company enters into employment contracts and agreements in those countries in which such relationships are mandatory or customary. The provisions of these agreements correspond in each case with the required or customary terms in the subject jurisdiction. Approximately 65% of our international employees are covered under national employee unions.
We maintain good employee relations and have successfully concluded all of our recent negotiations without a work stoppage. However, we cannot predict the outcome of future contract negotiations.
Customers
No single customer accounted for more than 10% of our total revenue in any of the last three fiscal years.
JBT FoodTech’s customers range from large multinational food processing companies to smaller regional food processing companies. Our principal customers include companies such as: Agrosuper S.A., Ajinomoto, Co. Ltd., Aujan Industries Co LLC, Bonduelle Group, Campbell Soup Company, CIA Pesquera Camanchaca S.A., Citrofrut, Citrovita, The Coca-Cola Company, COFCO Tunhe Tomato Products Co. Ltd., ConAgra Foods, Inc., Conserva Italia, DelMonte Foods Company, Dole Food Company, Inc., Eckes-Granini Group GmbH, Florida’s Natural Growers, General Mills, Inc., Gloria Foods Company, Great Giant Pineapple Co., Grupo Altex, Grupo Fisher, Hero AG, H.J. Heinz Company, Huiyan Group, Inghams Enterprises Pty Limited, Industrias Bachoco, J. Garcia-Carrion, Jamba Juice Company, Jain Irrigation Systems Ltd., JBS S.A., Leche Pascual, Marfrig Alimentos S.A., Louis Dreyfus Commodities, Morning Star Packing Company, National Food Industries LLC, Nestlé, Novartis AG, Nutricima Limited, OSI Group, LLC, Perdigăo S.A., Sadia S.A., Southern Gardens Citrus, Starkist Tuna, Sucocitrico Cutrale, Sunkist Growers, Inc., Thai Dairy Industry Co. Ltd., Thai Union Frozen Products Public Company Limited, Tropicana Products, Inc., Tyson Foods, Inc., Unilever PLC and Xinjiang Chalkis Tomato Products Co. Ltd.
JBT AeroTech’s customers are domestic and international airlines, airfreight and ground handling companies, domestic and international airport authorities and the United States and foreign military forces. Our principal customers include companies such as: Air Canada, Air China, Air France KLM, The Boeing Company, British Airports Authority, British Airways, the Canadian Forces, China Southern Airlines, Dallas Fort Worth International Airport, Delta Air Lines, Denver International Airport, DHL, FedEx Corp., EgyptAir, Houston Airport Systems, Iberia Airlines, LAN Airlines, Los Angeles International Airport, Massport/Logan International Airport, McCarran International Airport, Menzies Aviation, Miami International Airport, Saab AB, Servisair, Singapore Airlines, Southwest Airlines, Swissport International, TAM Airlines, Thai Airways International, United Continental Holdings, Inc., UPS, and the U.S. Air Force.
11
Government Contracts
We currently supply the Halvorsen cargo loader, aircraft tow tractors and trailer mounted air conditioning units to the U.S. Department of Defense. The amount of equipment built for these programs is dependent upon annual government appropriations and levels of military spending. In addition, United States defense contracts are unilaterally terminable at the option of the United States government with compensation for work completed and costs incurred. Contracts with the United States government are subject to special laws and regulations, the noncompliance with which may result in various sanctions that could materially affect our ongoing government business.
Governmental Regulation and Environmental Matters
Our operations are subject to various federal, state, local and foreign laws and regulations governing the prevention of pollution and the protection of environmental quality. If we fail to comply with these environmental laws and regulations, administrative, civil and criminal penalties may be imposed, and we may become subject to regulatory enforcement actions in the form of injunctions and cease and desist orders. We may also be subject to civil claims arising out of an accident or other event causing environmental pollution. These laws and regulations may expose us to liability for the conduct of or conditions caused by others or for our own acts even though these actions were in compliance with all applicable laws at the time they were performed.
Under the Comprehensive Environmental Response, Compensation and Liability Act, referred to as CERCLA, and related state laws and regulations, joint and several liability can be imposed without regard to fault or the legality of the original conduct on certain classes of persons that contributed to the release of a hazardous substance into the environment. These persons include the owner and operator of a contaminated site where a hazardous substance release occurred and any company that transported, disposed of or arranged for the transport or disposal of hazardous substances that have been released into the environment, and including hazardous substances generated by any closed operations or facilities. In addition, neighboring landowners or other third parties may file claims for personal injury, property damage and recovery of response cost. We may also be subject to the corrective action provisions of the Resource, Conservation and Recovery Act, or RCRA, and analogous state laws that require owners and operators of facilities that treat, store or dispose of hazardous waste to clean up releases of hazardous waste constituents into the environment associated with their operations.
Some of our facilities and operations are also governed by laws and regulations relating to worker health and workplace safety, including the Federal Occupational Safety and Health Act, or OSHA. We believe that appropriate precautions are taken to protect our employees and others from harmful exposure to potentially hazardous materials handled and managed at our facilities, and that we operate in substantial compliance with all OSHA or similar regulations.
Financial Information about Geographic Areas
A significant portion of our consolidated revenue is generated in markets outside of the United States. For financial information about geographic areas see Note 17 of our consolidated financial statements in Item 8 of this Annual Report on Form 10-K.
Available Information
All periodic and current reports, registration filings, and other filings that we are required to file with the Securities and Exchange Commission (“SEC”), including annual reports on Form 10-K, quarterly reports on Form 10-Q, current reports on Form 8-K, and amendments to those reports filed or furnished pursuant to Section 13(a) or 15(d) of the Securities Exchange Act of 1933, proxy statements and other information are available free of charge through our website as soon as reasonably practicable after we file them with, or furnish them to, the SEC. You may access and read our SEC filings free of charge through our website at www.jbtcorporation.com, under “Investor Relations – Financial Information – SEC Filings,” or the SEC’s website at www.sec.gov. These reports are also available to read and copy at the SEC’s Public Reference Room by contacting the SEC at 1-800-SEC-0330.
The information contained on or connected to our website, www.jbtcorporation.com, is not incorporated by reference into this Annual Report on Form 10-K or any other report we file with the SEC.
Executive Officers
The executive officers of JBT Corporation, together with the offices currently held by them, their business experience and their ages as of February 28, 2011, are as follows:
12
|
Name
|
Age
|
Office, year of election
|
||
|
Charles H. Cannon, Jr.
|
|
58
|
|
Chairman, Chief Executive Officer and President (2008)
|
|
Ronald D. Mambu
|
|
61
|
|
Vice President, Chief Financial Officer and Controller (2008)
|
|
Torbjörn Arvidsson
|
|
59
|
|
Vice President and Division Manager-Food Solutions and Services (2008)
|
|
Juan C. Podesta
|
59
|
Vice President and Division Manager-Food Processing Systems (2008)
|
||
|
John Lee
|
53
|
Vice President and Division Manager-JBT AeroTech (2008)
|
||
|
Kenneth Dunn
|
|
54
|
|
Vice President, General Counsel and Assistant Secretary (2008)
|
|
Mark Montague
|
|
57
|
|
Vice President, Human Resources (2008)
|
|
Megan Donnelly
|
|
42
|
|
Chief Accounting Officer (2008)
|
CHARLES H. CANNON, JR. has served as Chairman of the Board of Directors, Chief Executive Officer and President of JBT Corporation since April 2008. Mr. Cannon served as Senior Vice President of FMC Technologies from March 2004 until July 2008, when FMC Technologies distributed all of the stock of its wholly-owned subsidiary, JBT Corporation, to its shareholders in a spin-off effective July 31, 2008. Mr. Cannon served as a Vice President of FMC Technologies since February 2001. Since 1998, Mr. Cannon served as Vice President and General Manager-FMC FoodTech and Transportation Systems Group. Mr. Cannon joined FMC Corporation in 1982 as a Senior Business Planner in the Corporate Development Department. He became Division Manager of FMC Corporation’s Citrus Machinery Division in 1989, Division Manager of its Food Processing Systems Division in 1992 and Vice President and General Manager of FMC FoodTech in 1994. Mr. Cannon has also served on the Board of Directors of Standex International Corporation since 2004.
RONALD D. MAMBU has served as our Vice President, Chief Financial Officer and Controller since April 2008 and served as our Treasurer from April 2008 until November 2009. From February 2001 until April 2008, Mr. Mambu served as Vice President and Controller of FMC Technologies. Mr. Mambu was Director of Financial Planning of FMC Corporation from 1994 until his appointment as Vice President and Controller of FMC Corporation in 1995. Mr. Mambu joined FMC Corporation in 1974 as a financial manager in Philadelphia. He served in a variety of roles at FMC Corporation, including Controller of its former Food and Pharmaceutical Products Division from 1977 to 1982, Controller of Machinery Europe Division from 1982 to 1984, Controller of Agricultural Products Group from 1984 to 1987, Director of Financial Control from 1987 to 1993 and Director of Strategic Planning from 1993 to 1994.
TORBJÖRN ARVIDSSON has served as our Vice President and Division Manager-Food Solutions and Services since July 2008. Mr. Arvidsson served as a Division Manager for FMC Technologies’ Food Solutions and Services from October 2005 until July 2008. Mr. Arvidsson rejoined Frigoscandia Equipment in 1994 as Business Development Manager, a role he continued in after the acquisition of Frigoscandia Equipment by FMC FoodTech in 1996. In 1998, Mr. Arvidsson was appointed General Manager North America, located in Seattle, Washington, a position he held until late 2000 when he was appointed General Manager Europe and relocated back to Helsingborg, Sweden. In 2001, Mr. Arvidsson also assumed responsibility for FMC FoodTech’s Asia Pacific region. Mr. Arvidsson has been involved in the international food equipment industry his whole career, dating back to 1975 when he first joined Frigoscandia Equipment after graduating from Lund University, Sweden. In 1983 he graduated from IMI, Geneva (Advanced Management MBA). Mr. Arvidsson served as General Manager for Square AB within the Alfa-Laval Group from 1984 to 1987, when he joined Akerlund & Rausing as Division Manager for its overseas companies. In 1990, Mr. Arvidsson rejoined Alfa-Laval as Deputy General Manager for its convenience food division. Alfa-Laval later became Tetra-Laval after Tetra-Pak’s acquisition of Alfa-Laval.
JUAN C. PODESTA has served as our Vice President and Division Manager-Food Processing Systems since July 2008. Mr. Podesta served as a Division Manager for FMC Technologies’ Food Processing Systems from July 2000 until July 2008. Mr. Podesta joined FMC Corporation in 1989 as Product Manager, Citrus Systems in Lakeland, Florida. Since then, he has served in a variety of sales, marketing, and line management roles within FMC FoodTech, including International Manager for the Citrus Machinery Division from 1989 to 1992, General Manager, Fruit & Vegetable Processing based in Parma, Italy from 1992 to 1994, General Manager, Canning Systems based in St. Niklaas, Belgium from 1995 to 1996, Division Manager, Food Processing Systems & Agricultural Machinery from 1997 to 1999 and President FMC Europe, based in Brussels, Belgium from 2000 to 2002. Mr. Podesta served as Vice Chairman of Food Processing Machinery Europe, on the Board of Directors of The Council of the Americas, and on the Board of Directors of Equipment Hygiene Engineering Design Group.
JOHN LEE has served as our Vice President and General Manager – JBT AeroTech since August 2008. Prior to joining the Company, Mr. Lee worked for United Technologies Corporation, most recently as President, North America for Carrier Refrigeration. From 2006 to 2007, he was President, Building Systems and Services for Asia Pacific, and from 2005 to 2006, he was President, Carrier Refrigeration Asia Pacific, based in Shanghai, China for both positions. From 2002 to 2005, Mr. Lee served as Director, Purchasing, Vice President, Sales and Marketing, and then President, for Carrier Korea Operation based in Seoul, Korea. He started with United Technologies in 1993 as a program manager for Sikorsky Aircraft, a role he served until 1997. From 1997 to 2000, he was the Regional Director for Pratt & Whitney, Southeast Asia, based in Singapore. Before working for United Technologies, Mr. Lee served various marketing and strategic planning roles with McDonnell Douglas and Northrop Grumman Corporation. Mr. Lee is a graduate of the United States Military Academy, West Point and recived an MBA from the MIT Sloan School of Management.
13
KENNETH C. DUNN has served as our Vice President and General Counsel since October 2008. Prior to joining the Company, Mr. Dunn served as Chief Sustainability Officer for the Denver Public School (“DPS”) system from June through September 2008. Prior to DPS, Mr. Dunn worked for Quest Communications International, Inc., where he served as Vice President and Chief Corporate Development and Strategy Officer from 2004 to May 2008. From 2002 to 2004, Mr. Dunn served Qwest as Vice President and Deputy General Counsel – Complex Transactions. From 2001 to 2002, Mr. Dunn performed pro-bono environmental law work primarily on public lands issues in the Mountain West. From 1999 to 2001, Mr. Dunn worked for SBC Communications, Inc., serving as its General Attorney and Assistant General Counsel – Mergers and Acquisitions. From 1995 to 1999 he served as Assistant General Counsel – Transactions for Ameritech Corporation. Prior to that, Mr. Dunn was a Vice President and Associate General Counsel of John Nuveen & Company. From 1982 through 1995, Mr. Dunn was in private law practice with the Chicago based law firm of Gardner, Carton & Douglas. Mr. Dunn received his law degree from Stanford University in 1982 and his undergraduate degree from Duke University in 1978. Mr. Dunn has also served as a member of the Board of Directors of Integra Telecom, Inc., since December 2009.
MARK K. MONTAGUE has served as our Vice President of Human Resources since August 2008. Prior to joining the Company, Mr. Montague worked for Molex, Inc., where he served as Senior Vice President, Corporate Human Resources since 2006. From 1999 to 2006, Mr. Montague served as Vice President, Human Resources, Americas Region. Prior to Molex, Mr. Montague worked for Whirlpool Corporation, serving as its Vice President, Human Resources, North America Appliance Group from 1997 to 1999, its Group Director, Human Resources and Quality, Corporate Technology Group from 1996 to 1997 and as its Group Director, Human Resources, Manufacturing and Technology in 1996. From 1992 through 1996, Mr. Montague worked for the consulting group, Competitive Human Resources Strategies. Mr. Montague worked for Whirlpool Corporation from 1981 through 1992, in a variety of Human Resources Group Director and Vice President positions, and as a Labor Relations Attorney from 1981 to 1984. Mr. Montague began his professional career as an attorney with Shughart, Thomson & Kilroy, after receiving his law degree from George Washington University, and he earned his undergraduate degree from the University of Notre Dame.
MEGAN DONNELLY has served as our Chief Accounting Officer since November 2008. Ms. Donnelly served as our Director of Financial Control since July 2008. Ms. Donnelly was FMC Technologies’ Manager of Financial Reporting and Accounting Research from April 2005 until July 2008. Prior to that, Ms. Donnelly served as a consultant to FMC Technologies from January 2002 until April 2005. From July 1998 until December 2001, Ms. Donnelly was Director of Finance for Chart House Enterprises, Inc. Ms. Donnelly is a certified public accountant and began her professional career in the Assurance practice of Ernst & Young LLP in 1992 after receiving her degree from the University of Illinois.
You should carefully consider the risks described below, together with all of the other information included in this Annual Report on Form 10-K, in evaluating our company and our common stock. If any of the risks described below actually occurs, our business, financial condition, results of operations, cash flows and stock price could be materially adversely affected.
Risk Factors Relating to Our Business
Our financial results are subject to fluctuations caused by many factors that could result in our failing to achieve anticipated financial results.
Our quarterly and annual financial results have varied in the past and are likely to continue to vary in the future due to a number of factors, many of which are beyond our control. In particular, the capital goods industries in which we compete can have significant variations in the number, contractual terms and size of orders. The timing of our receipt of orders and our shipment of the products or provision of services can significantly impact the sales and income of a period. These and any one or more of the factors listed below, among other things, could cause us not to achieve our revenue or profitability expectations. The resulting failure to meet market expectations could cause a drop in our stock price. These factors include the risks discussed elsewhere in this section and the following:
|
•
|
Changes in demand for our products and services, including changes in growth rates in the food processing and air transportation industries;
|
|
|
|
•
|
Downturns in our customers’ businesses resulting from deteriorating domestic and international economies where our customers do substantial business;
|
|
|
•
|
Changes in commodity prices resulting in increased manufacturing costs, such as petroleum-based products, metals or other raw materials we use in significant quantities;
|
14
|
|
•
|
Changes in pricing policies resulting from competitive pressures, such as aggressive price discounting by our competitors and other market factors;
|
|
•
|
Our ability to develop and introduce on a timely basis new or enhanced versions of our products and services;
|
|
|
|
•
|
Unexpected needs for capital expenditures or other unanticipated expenses;
|
|
|
•
|
Changes in the mix of revenue attributable to domestic and international sales;
|
|
|
•
|
Changes in the mix of products and services that we sell;
|
|
|
•
|
Seasonal fluctuations in buying patterns; and
|
|
|
•
|
Future acquisitions and divestitures of technologies, products and businesses.
|
Unanticipated delays or acceleration in our sales cycles make accurate estimation of our revenue difficult and could result in significant fluctuation in quarterly operating results.
The length of our sales cycle varies depending on a number of factors over which we may have little or no control, including the size and complexity of a potential transaction, the level of competition that we encounter in our selling activities and our current and potential customers’ internal budgeting and approval process. As a result of a generally long sales cycle, we may expend significant effort over a long period of time in an attempt to obtain an order, but ultimately not obtain the order, or the order ultimately received may be smaller than anticipated. Our revenue from different customers varies from quarter to quarter, and a customer with a large order in one quarter may generate significantly lower revenue in subsequent quarters. Due to resulting fluctuations, we believe that quarter-to-quarter comparisons of our revenue and operating results may not be meaningful, and that these comparisons may not be an accurate indicator of our future performance.
Deterioration of economic conditions could negatively impact our business.
Our business may be adversely affected by changes in current or future national or global economic conditions, including interest rates, availability of capital, consumer spending rates, foreign currency exchange rates, energy availability and costs and the effects of governmental initiatives to manage economic conditions. Any such changes could adversely affect the demand for our products or the cost and availability of our required raw materials, thereby negatively affecting our financial results. Until economic conditions return to levels experienced prior to the recent disruptions in credit and other financial markets, national and global economic conditions could, among other things:
|
·
|
make it more difficult or costly for us to obtain increased financing for our operations or investments or to refinance our debt in the future;
|
|
·
|
render our lenders or other financial instrument counterparties unable to honor their commitments or otherwise default under a financing agreement;
|
|
·
|
impair the financial condition of some of our customers, thereby hindering our customers’ ability to obtain financing to purchase our products and/or increasing customer bad debts;
|
|
·
|
impair the financial condition of some of our suppliers thereby potentially increasing both the likelihood of having to renegotiate supply terms and the risk of non-performance by suppliers;
|
|
·
|
negatively impact global demand for air transportation services as well as protein food products and processed food products, which could result in a reduction of sales, operating income and cash flows in our JBT AeroTech and JBT FoodTech segments, respectively;
|
|
·
|
negatively affect our currency hedges; or
|
|
·
|
impair the financial viability of our insurers.
|
A downturn or slow recovery from the recent global economic crisis in certain of the major markets we serve could materially adversely affect results.
The recent global economic crisis has caused downturns in many industrial and/or regional markets, including the food processing and air transportation markets. Although we have been experiencing a slow recovery from the economic crisis, there can be no assurance as to when economic conditions will recover fully. A further or unexpectedly sustained downturn, or a slow recovery from the recent downturn, in one or more of these markets could have a material adverse effect on our business, results of operations or financial condition.
15
Our customers may not be able to meet their financial obligations to us or we may experience less business as a result of the recent global economic environment, which would adversely affect our financial condition and results of operations.
Some of our existing and prospective worldwide customers continue to suffer from the recent problems affecting the global economy. As a result, we may sell less new equipment and fewer parts and services to these customers and certain of these customers could pose credit risks to us. Our inability to collect receivables from one or more important customers could adversely affect our results of operations and financial condition.
Some of our business segments are cyclical or are otherwise sensitive to volatile or variable factors. A downturn or weakness in overall economic activity or fluctuations in those other factors may have a material adverse effect on us.
Historically, sales of products that we manufacture and sell have been subject to cyclical variations caused by changes in general economic conditions and other factors. The strength of the economy generally may affect the rates of expansion, consolidation, renovation and equipment replacement within the air transportation industry and within the food processing industry, which may affect the performance of our JBT AeroTech and JBT FoodTech segments, respectively.
Similarly, our sales depend in part upon our customers’ replacement or repair cycles. Adverse economic conditions may cause customers to forgo or postpone new purchases in favor of repairing existing equipment and machinery, and delay or reduce preventative maintenance, thereby reducing our revenue and/or profits.
The air transportation industry is particularly sensitive to changes in economic condition; negative economic conditions likely may have a negative impact on our JBT AeroTech segment and our results of operations.
The air transportation industry in general is particularly sensitive to changes in economic conditions. Unfavorable general economic conditions, such as a constrained credit market, reduced consumer confidence, higher unemployment rates and increased business operating costs, particularly fuel costs, can reduce spending for both passenger travel and decrease demand for cargo air carrier services. Unfavorable economic conditions can also impact our customers’ ability to raise pricing to counteract increased fuel, labor, and other costs, making it less likely that they will expend resources on JBT AeroTech equipment as they have in the past.
Disruptions in the political, regulatory, economic and social conditions of the foreign countries in which we conduct business or fluctuations in currency exchange rates could negatively affect our business, financial condition and results of operations.
We operate manufacturing facilities in nine countries other than the United States, and our international sales accounted for a significant portion of our 2010 revenue. Multiple factors relating to our international operations and to particular countries in which we operate or seek to expand our operations could have an adverse effect on our financial condition or results of operations. These factors include:
|
|
•
|
nationalization and expropriation;
|
|
|
•
|
potentially burdensome taxation;
|
|
|
•
|
increased growth in our international business operations and revenue relative to our domestic operations may result in increasing tax liabilities resulting from repatriation of income generated outside of the United States;
|
|
|
•
|
continuing economic downturns, inflationary and recessionary markets, including capital and equity markets;
|
|
|
•
|
civil unrest, political instability, terrorist attacks and wars;
|
|
|
•
|
seizure of assets;
|
|
|
•
|
trade restrictions, trade protection measures or price controls;
|
|
|
•
|
foreign ownership restrictions;
|
|
|
•
|
import or export licensing requirements;
|
|
|
•
|
restrictions on operations, trade practices, trade partners and investment decisions resulting from domestic and foreign laws and regulations;
|
|
|
•
|
changes in governmental laws and regulations;
|
|
|
•
|
inability to repatriate income or capital; and
|
|
|
•
|
reductions in the availability of qualified personnel.
|
Because a significant portion of our revenue is denominated in foreign currencies, changes in exchange rates will result in increases or decreases in our costs and earnings and may also affect the book value of our assets located outside the United States and the amount of our stockholders’ equity. We prepare our consolidated financial statements in U.S. dollars, but these results may fluctuate due to the fact that a significant portion of our earnings and expenditures are denominated in other currencies. Although we may seek to minimize our currency exposure by engaging in hedging transactions where we deem it appropriate, we cannot assure you that our efforts will be successful. To the extent we sell our systems and services in foreign markets, currency fluctuations may result in our systems and services becoming too expensive for foreign customers.
16
Our inability to obtain raw materials, component parts, and/or finished goods in a timely and cost-effective manner from suppliers would adversely affect our ability to manufacture and market our products.
We purchase raw materials and component parts from suppliers for use in manufacturing our products. We also purchase certain finished goods from suppliers. Changes in our relationships with suppliers or increases in our costs for raw materials, component parts or finished goods we purchase could result in manufacturing interruptions, delays, inefficiencies or our inability to market products. In addition, our profit margins could decrease if prices of purchased raw materials, component parts or finished goods increase and we are unable to pass on those increases to customers.
The increase in energy or raw material prices may reduce the profitability of our customers, which ultimately could negatively affect our business, financial condition, results of operations and cash flows.
In recent years, energy prices have hit historically high levels. These increases had a negative trickledown effect on many areas involved in running a business, straining profitability through increased operating costs. Our customers require large amounts of energy to run their businesses, particularly in the air transportation industry. Energy prices can affect the profitability of passenger and cargo air carriers through increased jet and ground support equipment fuel prices. Energy prices also affect food processors through increased energy and utility costs to run the plant, chemical and petroleum based raw materials used in production and fuel costs to run logistics and service fleet vehicles.
Food processors are also dependent upon the cost and supply of raw materials such as feed grains, livestock, produce and dairy products. Recent rises in the cost and limitations in availability of these commodities can negatively affect the profitability of their operations.
A reduction in profitability due to increased energy or raw material prices within our customer base may reduce their future investments in food processing equipment or airport equipment. This reduction in investment may have a material adverse effect on our business, financial condition, results of operations and cash flows.
Changes in food consumption patterns due to diet trends or economic conditions may negatively affect our business, financial condition, results of operations and cash flows.
Dietary trends can create demand for protein food products but negatively impact high-carbohydrate foods, or create demand for easy to prepare, transportable meals but negatively impact traditional canned products. Because various food types and packaging can quickly go in and out of style as a function of health, dietary or convenience trends, food processors can be challenged in forecasting the needed capacity and related equipment and services for their food plants. During periods of economic uncertainty, consumer demand for protein products or processed food products may also be negatively impacted by increases in food prices. Shifting consumer demand for protein products or processed foods may have a material adverse effect on our business, financial condition, results of operations and cash flows.
An outbreak of animal borne diseases (H5N1, BSE or other virus strains affecting poultry or livestock) may negatively affect protein processors.
An outbreak or pandemic stemming from H5N1 (avian flu) or BSE (mad cow disease) or any other animal related disease strains could reduce the availability of poultry or beef that is processed for the restaurant, food service, wholesale or retail consumer. Should a pandemic break out, eradication of entire regional animal populations could be mandated.
Any limitation on raw material could discourage producers from making additional capital investments in processing equipment, aftermarket products, parts and services. Such a decrease in demand for our products could have a material adverse effect on our business, financial condition, results of operations and cash flows.
An outbreak of food borne illness or other food safety or quality concerns may negatively affect our business, financial condition, results of operations and cash flows.
Should an E. coli or other food borne illness cause a recall of meat or produce, the companies supplying those fresh, further processed or canned forms of these products could be severely financially affected. This type of recall, whether voluntary or mandatory, could have broad ranging and long lasting negative effects on growers, packers, retailers, wholesalers and/or restaurants. If a consumer were to become critically ill due to the outbreak, the food provider’s reputation and brand could be permanently tarnished. Any affect on the financial viability of our customer base of fresh or processed food providers could seriously affect and reduce our immediate and recurring revenue base.
17
Our business, financial condition, results of operations and cash flows could be materially adversely affected if consumers were to lose confidence in the safety or quality of certain food products or ingredients. Adverse publicity about these types of concerns, whether or not valid, may discourage consumers from buying processed food products or cause production and delivery disruptions. Any disruption within the food supply chain could have a negative effect on the demand for our food processing machinery and on our financial results.
Freezes, hurricanes, droughts or other natural disasters may negatively affect our business, financial condition, results of operations and cash flows.
Should a natural disaster negatively affect the production of growers or farms, the food processing industry may not have the fresh foods necessary to meet consumer demand. The crops of entire groves or fields can be severely impacted by a drought, freeze or hurricane. Should a drought or freeze continue for an extended duration or high category hurricane directly impact a tree crop area, the trees themselves could be permanently damaged. If orchards had to be replanted, the trees may not produce viable product for several years. Since our revenue generation is dependent on a farmer’s ability to provide high quality crops to some of our customers, our business, financial condition, results of operations and cash flows could be materially adversely impacted.
Citrus tree diseases may negatively affect our business, financial condition, results of operations and cash flows.
The success of our citrus business is directly related to the viability and health of citrus crops. The citrus industries in Florida, Brazil and other countries are facing increased pressure on their harvests and citrus bearing acreage due to citrus canker and greening diseases. These citrus tree diseases are often incurable once a tree has been infested and the end result can be the destruction of the tree.
We realize operating lease revenue based partially upon capacity or throughput that a citrus processor or produce packinghouse produces. Reduced amounts of available fruit for the processed or fresh markets could materially adversely affect our business, financial condition, results of operations and cash flows.
Our failure to comply with the laws and regulations governing our U.S. government contracts or the loss of production funding of any of our U.S. government contracts could harm our business.
The federal government is the largest contractor in the United States. Our JBT AeroTech business enters into contracts with the U.S. government, including a long-term contract relating to the sale and logistics support of our Halvorsen Loader, which is a military air cargo loader, to the U.S. Air Force. As a result we are subject to various laws and regulations that apply to companies doing business with the U.S. government. The laws governing U.S. government contracts differ in several respects from the laws governing private contracts. They are heavily regulated to curb misappropriation of funds and ensure uniform policies and practices across agencies. Their ongoing funding is tied to National Defense Budgets and Procurement Programs that are annually negotiated and approved or disapproved by the U.S. Department of Defense, Executive Branch and the Congress. For example, if there were any shifts in spending priorities or if funding for the U.S. Air Force cargo loader program were reduced or cancelled, the resulting loss of revenue may have a material adverse impact on our JBT AeroTech business. Many U.S. government contracts contain pricing terms and conditions that are not applicable to private contracts. Moreover, U.S. defense contracts, in particular, are unilaterally terminable at the option of the U.S. government with compensation for work completed and costs incurred.
Contracts with the U.S. government are also subject to special laws and regulations, the noncompliance with which may result in various sanctions. If, for any reason, we were now or at any time in the future found to be non-compliant to any laws or regulations governing U.S. government contracts, our earnings could be negatively impacted. In addition, any delays of deliverables due to our non-performance would also have a negative impact on these contracts.
Terrorist attacks and threats, escalation of military activity in response to such attacks or acts of war may negatively affect our business, financial condition, results of operations and cash flows.
Terrorist attacks and threats, escalation of military activity in response to such attacks or acts of war may negatively affect our business, financial condition, results of operations and cash flows. Any future terrorist attacks against U.S. targets, rumors or threats of war, actual conflicts involving the United States or its allies, or military or trade disruptions affecting our customers or the economy as a whole may materially adversely affect our operations or those of our customers. As a result, there could be delays or losses in transportation and deliveries to our customers, decreased sales of our products and extension of time for payment of accounts receivable from our customers. Strategic targets such as those relating to transportation and food processing may be at greater risk of future terrorist attacks than other targets in the United States. It is possible that any of these occurrences, or a combination of them, could have a material adverse effect on our business, financial condition, results of operations and cash flows.
18
Due to the type of contracts we enter into, the cumulative loss of several major contracts may negatively affect our business, financial condition, results of operations and cash flows.
We often enter into large, project-oriented contracts or long-term equipment leases and service agreements. These agreements may be terminated or breached, or our customers may fail to renew these agreements. If we were to lose several key agreements over a relatively short period of time and if we were to fail to develop alternative business opportunities, we could experience a materially adverse impact on our business, financial condition, results of operations and cash flows.
We may lose money on fixed-price contracts.
As is customary for several of the business areas in which we operate, we agree, in some cases, to provide products and services under fixed-price contracts. Under these contracts, we are typically responsible for cost overruns. Our actual costs and any gross profit realized on these fixed-price contracts may vary from the estimated amounts on which these contracts were originally based. There is inherent risk in the estimation process, including significant unforeseen technical and logistical challenges or longer than expected lead times. A fixed-price contract may prohibit our ability to mitigate the impact of unanticipated increases in raw material prices (including the price of steel) through increased pricing. Depending on the size of a project, variations from estimated contract performance could have a materially adverse impact on our business, financial condition, results of operations and cash flows.
We operate in highly competitive industries, and competitive pressures may adversely affect us.
Our businesses compete in highly competitive markets where differentiation is based on product features and design, brand recognition, reliability, durability, technology, energy efficiency, breadth of product offerings, price, customer relationships, delivery lead times, serviceability and aftermarket parts and services. We have a number of domestic and international competitors in most of the product lines we offer. Many of our competitors are focused on particular product lines or geographical regions or emphasize their local manufacturing presence or local market knowledge. Some of our competitors have different pricing structures and may be able to deliver their products at lower prices. Although we believe that the performance and price characteristics of our products will provide competitive solutions for our customers' needs, there can be no assurance that our customers will continue to choose our products over products offered by competitors.These competitive pressures could adversely affect our results of operations and financial condition.
Customer sourcing initiatives may negatively affect new equipment and aftermarket businesses.
Integration of the supply chain to provide a sustainable competitive advantage has become an objective for many multi-national companies. With continued price pressure from consumers, wholesalers and retailers, manufacturers are focusing their efforts on ways to reduce costs, improve sourcing processes and enhance profitability.
Although these inherently are good practices, it can depersonalize the sales process and result in a shift in focus to short term cost savings as opposed to fully understanding all of the cost components that are associated with capital goods and aftermarket products, parts and services purchases over the lifetime of the investment. If customers implement sourcing initiatives focused solely on immediate cost savings and not on total cost of ownership, our new equipment and aftermarket sales could be negatively affected.
The solutions we sell are very complex, and we need to rapidly and successfully develop and introduce new solutions in a global, competitive, demanding and changing environment.
To succeed in the globally competitive food processing and air transportation industries, we must continually develop our product and service offerings. This requires a high level of innovation. In addition, bringing new solutions to the market entails a costly and lengthy process and requires us to accurately anticipate customer needs and technology trends. We must continue to respond to demands and develop leading technologies in the food processing and air transportation industries, or our business, financial condition, results of operations and cash flows may be materially adversely affected.
There can be no assurance that our innovations will be profitable, and if we cannot successfully market and sell both existing and newly developed solutions, our business and operating results could be impacted. Significant investments in unsuccessful research and development efforts could materially adversely affect our business, financial condition and results of operations. If we were to lose our significant technology advantage, our market share and growth could be materially adversely affected. In addition, if we are unable to deliver products, features and functionality as projected, we may be unable to meet our commitments to customers, which could have a materially adverse effect on our reputation and business.
19
Our business, financial condition, results of operations and cash flows could be materially adversely affected by competing technology. Some of our competitors are large multinational companies that may have greater financial resources than us, and they may be able to devote greater resources to research and development of new systems, services and technologies than we are able to do. Moreover, some of our competitors operate in narrow business areas, allowing them to concentrate their research and development efforts directly on products and services for those areas.
When we develop new products with higher capacity and more advanced technology, the increased difficulty and complexity associated with producing these products increases the likelihood of reliability, quality or operability problems.
Despite rigorous testing prior to their release and superior quality processes, newly developed or enhanced products and solutions may have some start up issues which may be found after the products are introduced and shipped. This risk is enhanced when products are first introduced, as well as when we develop products with more advanced technology, since the increased difficulty and complexity associated with producing these products increases the likelihood of reliability, quality or operability problems. The correction and detection of issues may cause delays, lost revenue and incremental costs. While we attempt to remedy errors that we believe would be considered critical by our customers prior to shipment, we may not be able to detect or remedy all such errors.
Our customers who rely on our solutions for business-critical applications are more sensitive to product errors, which could expose us to product liability, performance and warranty claims, as well as harm to our reputation. These and other risks associated with new product and service offerings may have a materially adverse impact on our business, financial condition, results of operations and cash flows.
Product introductions and certain enhancements of existing products by us in future periods may also reduce demand for our existing products or could delay purchases by customers awaiting arrival of our new products. As new or enhanced products are introduced, we must successfully manage the transition from older products.
In the ordinary course of business, we continually evaluate opportunities for new product and service offerings, new markets and new geographic sectors, and development of such opportunities could entail certain business risks which could affect our financial condition.
If we are unable to develop, preserve and protect our intellectual property assets, our business, financial condition, results of operations and cash flows may be negatively affected.
As a technology company, our intellectual property portfolio is crucial to our continuing ability to be a leading solutions and services provider to the food processing and air transportation industries. We strive to protect and enhance our proprietary intellectual property rights through patent, copyright, trademark and trade secret laws, as well as through technological safeguards and operating policies. To the extent we are not successful, our business, financial condition, results of operations and cash flows could be materially adversely impacted. We may be unable to prevent third parties from using our technology without our authorization or independently developing technology that is similar to ours, particularly in those countries where the laws do not protect our proprietary rights as fully as in the United States. With respect to our pending patent applications, we may not be successful in securing patents for these claims, and our competitors may already have applied for patents that, once issued, will prevail over our patent rights or otherwise limit our ability to sell our products.
While we take steps to provide for confidentiality obligations of employees and third parties with whom we do business (including customers, suppliers and strategic partners), there is a risk that such parties will breach such obligations and jeopardize our intellectual property rights. Although we have agreements in place to mitigate this risk in many cases, there can be no assurance that such protections will be sufficient.
We are actively engaged in efforts to protect the value of our intellectual property and to prevent others from infringing our intellectual property rights. However, due to the complex and technical nature of such efforts and the potentially high stakes involved, such enforcement activity can be expensive and time consuming, and there can be no assurance that we will be successful in these efforts.
Claims by others that we infringe their intellectual property rights could harm our business, financial condition, results of operations and cash flows.
We have seen a trend towards aggressive enforcement of intellectual property rights as the functionality of products in our industry increasingly overlaps and the volume of issued patents continues to grow. As a result, there is a risk that we could be subject to infringement claims which, regardless of their validity, could:
20
|
•
|
Be expensive, time consuming and divert management attention away from normal business operations;
|
|
|
|
•
|
Require us to pay monetary damages or enter into non-standard royalty and licensing agreements;
|
|
|
•
|
Require us to modify our product sales and development plans; or
|
|
|
•
|
Require us to satisfy indemnification obligations to our customers.
|
Regardless of whether these claims have any merit, they can be burdensome to defend or settle and can harm our business and reputation.
Our information systems, computer equipment and information databases are critical to our business operations, and any damage or disruptions could negatively affect our business, financial condition, results of operations and cash flows.
Our operations are dependent on our ability to protect our computer equipment and the information stored in our databases from damage by, among other things, earthquake, fire, natural disaster, power loss, telecommunications failures, unauthorized intrusions and other catastrophic events. A part of our operations is based in an area of California that has experienced power outages and earthquakes, while another part of our operations is based in an area of Florida that has experienced power outages and hurricanes. Despite our best efforts at planning for such contingencies, catastrophic events of this nature may still result in system failures and other interruptions in our operations, which could have a material adverse effect on our business, financial condition, results of operations and cash flows.
In addition, it is periodically necessary to replace, upgrade or modify our internal information systems. If we are unable to do this in a timely and cost-effective manner, especially in light of demands on our information technology resources, our ability to capture and process financial transactions and therefore our business, financial condition, results of operations and cash flows may be materially adversely impacted.
Inadequate internal controls and accounting practices could lead to errors, which could negatively impact our business, financial condition, results of operations and cash flows.
We have internal controls and management oversight systems in place, however, we may not be able to prevent or detect misstatements in our reported financial statements due to system errors, the potential for human error and unauthorized actions of employees or contractors, inadequacy of controls, temporary lapses in controls due to shortfalls in transition planning and oversight of resource contracts and other factors. In addition, due to their inherent limitations, such controls may not prevent or detect misstatements in our reported financial results as required under SEC and New York Stock Exchange (NYSE) rules, which could increase our operating costs or impair our ability to operate our business. Controls may also become inadequate due to changes in circumstances, and as it is necessary to replace, upgrade or modify our internal information systems from time to time. If we are unable to implement these changes in a timely and cost-effective manner, our ability to capture and process financial transactions and support our customers as required may be materially adversely impacted and could harm our business, financial condition, results of operations and cash flows.
We may supplement our internal growth through strategic combinations, and our success depends on our ability to successfully integrate, operate and manage these acquired businesses and assets.
We may supplement our internal growth through strategic combinations, asset purchases and other transactions that complement or expand our existing businesses. Each of these transactions involves a number of risks, including:
|
•
|
The diversion of our management’s attention from our existing businesses to integrating the operations and personnel of the acquired or combined business;
|
|
|
|
•
|
Possible material adverse effects on business, financial condition, results of operations and cash flows during the integration process; and
|
|
|
•
|
Our possible inability to achieve the intended objectives of the transaction.
|
We may hire additional employees in connection with these acquisitions. We may not be able to successfully integrate all of the newly hired employees, or profitably integrate, operate, maintain and manage our newly acquired operations in a competitive environment. We may not be able to maintain uniform standards, controls, procedures and policies, and this may lead to operational inefficiencies.
We may seek to finance an acquisition through borrowings or through the issuance of new debt or equity securities. If we make a relatively large acquisition, we could deplete a substantial portion of our financial resources to the possible detriment of our other operations. Any future acquisitions could also dilute the equity interests of our stockholders, require us to write off assets for accounting purposes or create other undesirable accounting results, such as significant expenses for amortization or impairment of goodwill or other intangible assets.
21
Loss of our key management and other personnel could impact our business.
We depend on our senior executive officers and other key personnel. The loss of any of these officers or key personnel could materially adversely affect our business, financial condition, results of operations and cash flows. In addition, competition for skilled and non-skilled employees among companies that rely heavily on engineering, technology and manufacturing is intense, and the loss of skilled or non-skilled employees or an inability to attract, retain and motivate additional skilled and non-skilled employees required for the operation and expansion of our business could hinder our ability to conduct research activities successfully, develop new products and services and meet our customers’ requirements.
The industries in which we operate expose us to potential liabilities arising out of the installation or use of our systems that could negatively affect our business, financial condition, results of operations and cash flows.
Our businesses supply equipment and systems for use in food processing as well as equipment, systems and services used in airports all over the world, which creates potential exposure for us to liability for personal injury, wrongful death, product liability, commercial claims, property damage, pollution and other environmental damages. Although we have obtained business and related risk insurance, we cannot assure you that our insurance will be adequate to cover all potential liabilities. Further, we cannot assure you that insurance will generally be available in the future or, if available, that premiums to obtain such insurance will be commercially justifiable. If we incur substantial liability and the damages are not covered by insurance or are in excess of policy limits, or if we were to incur liability at a time when we are not able to obtain liability insurance, our business, financial condition, results of operations and cash flows could be materially adversely affected.
Environmental protection initiatives may negatively impact the profitability of our business.
Global initiatives to protect and steward the environment have moved to center stage. From global warming and climate change to urban sprawl and resource depletion, corporations and consumers are becoming more aware and concerned about the impact of human activity on the environment. Comprehensive global and national greenhouse gas reduction programs have been proposed and are being discussed within legislatures, boardrooms and households. The ultimate costs, implementation and success of such broad reaching programs will be dependent on the precise emissions targets, the timing for the reductions and the means of implementation.
Pressures to reduce the footprint of carbon emissions impact the air transportation and manufacturing sectors. Airports, airlines and air cargo providers are continually looking for new ways to become more energy efficient and reduce pollutants. Manufacturing plants are seeking means to reduce their heat-trapping emissions and minimize their energy and water usage. All of the initiatives come at a cost both to our customers’ operations as well as to our operating costs and therefore may materially adversely impact our business, financial condition, results of operations and cash flows.
Our operations and industries are subject to a variety of U.S. and international laws, which laws can change. We therefore face uncertainties with regard to lawsuits, regulations and other related matters.
In the normal course of business, we are subject to proceedings, lawsuits, claims and other matters, including those that relate to the environment, health and safety, employee benefits, export compliance, intellectual property, product liability, tax matters and regulatory compliance. For example, we are subject to changes in foreign laws and regulations that may encourage or require us to hire local contractors or require foreign contractors to employ citizens of, or purchase supplies from, a particular non-U.S. jurisdiction. In addition, environmental laws and regulations affect the systems and services we design, market and sell, as well as the facilities where we manufacture our systems. We are required to invest financial and managerial resources to comply with environmental laws and regulations and anticipate that we will continue to be required to do so in the future.
There is an increased focus by the SEC and Department of Justice on enforcement of the Foreign Corrupt Practices Act (the “FCPA”). Given the breadth and scope of our international operations, we may not be able to detect or prevent improper or unlawful conduct by our international partners and employees, despite our ethics, governance and compliance standards, which could put us at risk regarding possible violations of laws, including the FCPA.
Considerable management time and resources may be spent to understand and comply with changing laws, regulations and standards relating to corporate governance, public disclosure (including the Sarbanes-Oxley Act of 2002), SEC regulations and the rules of the New York Stock Exchange where our shares are listed. Although we do not believe that any recent regulatory and legal initiatives will result in significant changes to our internal practices or our operations, rapid changes in accounting standards, taxation requirements, and federal securities laws and regulations, among others, may substantially increase costs to our organization and could materially adversely impact our business, financial condition, results of operations and cash flows.
22
Unfavorable tax law changes and tax authority rulings may adversely affect results.
We are subject to income taxes in the United States and in various foreign jurisdictions. Domestic and international tax liabilities are subject to the allocation of income among various tax jurisdictions. Our effective tax rate could be adversely affected by changes in the mix of earnings among countries with differing statutory tax rates, changes in the valuation allowance of deferred tax assets or tax laws. The amount of income taxes and other taxes are subject to ongoing audits by U.S. federal, state and local tax authorities and by non-U.S. authorities. If these audits result in assessments different from amounts we record, future financial results may include unfavorable tax adjustments.
The market price of our Common Stock may be subject to significant volatility.
The market price of our Common Stock may be highly volatile because of a number of factors, including the following:
|
•
|
actual or anticipated fluctuations in our operating results;
|
|
•
|
changes in expectations as to our future financial performance, including financial estimates by securities analysts and investors;
|
|
•
|
transactions related to complimentary technology, technology rights, product lines or businesses;
|
|
•
|
announcements by us or our competitors of new products or significant contracts, acquisitions, joint ventures or capital commitments;
|
|
•
|
changes in interest rates;
|
|
•
|
additions or departures of key personnel; and
|
|
•
|
future sales or issuances of our Common Stock.
|
Our existing financing agreements include restrictive and financial covenants.
Certain of our loan agreements require us to comply with various restrictive covenants and some contain financial covenants that require us to comply with specified financial ratios and tests. Our failure to meet these covenants could result in default under these loan agreements and would result in a cross-default under other loan agreements. In the event of a default and our inability to obtain a waiver of the default, all amounts outstanding under loan agreements could be declared immediately due and payable. Our failure to comply with these covenants could adversely affect our results of operations and financial condition.
Significant changes in actual investment return on pension assets, discount rates, and other factors could affect our results of operations, equity, and pension contributions in future periods.
Our results of operations may be positively or negatively affected by the amount of income or expense we record for our defined benefit pension plans. U.S. generally accepted accounting principles (GAAP) require that we calculate income or expense for the plans using actuarial valuations. These valuations reflect assumptions about financial market and other economic conditions, which may change based on changes in key economic indicators. The most significant year-end assumptions we use to estimate pension income or expense are the discount rate and the expected long-term rate of return on plans assets. In addition, we are required to make an annual measurement of plan assets and liabilities, which may result in a significant change to equity through a reduction or increase to accumulated gains (losses) – net, benefit plans. At the end of 2010, the projected benefit obligation of our pension plans was $275.2 million and assets were $207.5 million. For a discussion regarding how our financial statements can be affected by pension plan accounting policies, see Critical Accounting Estimates – Pension Assumptions in Part II, Item 7. “Management’s Discussion and Analysis of Financial Condition and Results of Operations” and Note 9 to the consolidated financial statements in Part II, Item 8. “Financial Statements and Supplementary Data” of this Form 10-K Report. Although GAAP expense and pension funding contributions are not directly related, key economic factors that affect GAAP expense would also likely affect the amount of cash we would contribute to pension plans as required under the Employee Retirement Income Security Act (ERISA).
We could be liable to FMC Technologies for adverse tax consequences resulting from certain change-in-control transactions and therefore could be prevented from engaging in strategic or capital raising transactions.
FMC Technologies could recognize a taxable gain if the spin-off is determined to be part of a plan or series of related transactions pursuant to which one or more persons acquire, directly or indirectly, stock representing a 50% or greater interest in either FMC Technologies or JBT Corporation. Under the Code, any acquisitions of FMC Technologies or JBT Corporation within the four-year period beginning two years before the date of the spin-off are presumed to be part of such a plan. Regulations issued by the IRS, however, provide mitigating rules in many circumstances. Nonetheless, a merger, recapitalization or acquisition, or issuance or redemption of our common stock could, in some circumstances, be counted toward the 50% change of ownership threshold. The tax sharing agreement between FMC Technologies and us precludes us from engaging in some of these transactions unless we first obtain a tax opinion acceptable to FMC Technologies or an IRS ruling to the effect that such transactions will not result in additional taxes. The tax sharing agreement further requires us to indemnify FMC Technologies for any resulting taxes owed by FMC Technologies regardless of whether we first obtain such opinion or ruling. As a result, we may be unable to engage in strategic or capital raising transactions that stockholders might consider favorable or to structure potential transactions in the manner most favorable to us.
23
Our corporate governance documents, our rights plan and Delaware law may delay or discourage takeovers and business combinations that our stockholders might consider in their best interests.
Provisions in our amended and restated certificate of incorporation and by-laws may make it difficult and expensive for a third-party to pursue a tender offer, change-in-control or takeover attempt that is opposed by our management and Board of Directors. These provisions include, among others:
|
•
|
A Board that is divided into three classes with staggered terms;
|
|
|
|
•
|
Limitations on the right of stockholders to remove directors;
|
|
|
•
|
The right of our Board to issue preferred stock without stockholder approval;
|
|
|
•
|
Inability of our stockholders to act by written consent; and
|
|
|
•
|
Rules regarding how stockholders may present proposals or nominate directors at stockholders meetings.
|
Public stockholders who might desire to participate in this type of transaction may not have an opportunity to do so. These anti-takeover provisions could substantially impede the ability of public stockholders to benefit from a change-in-control or a change in our management or Board and, as a result, may adversely affect the marketability and market price of our common stock.
In addition, we have adopted a stockholder rights plan intended to deter hostile or coercive attempts to acquire us. Under the plan, if any person or group acquires, or begins a tender or exchange offer that could result in such person acquiring 15% or more of our common stock, without approval of our Board under specified circumstances, our other stockholders will have the right to purchase shares of our common stock, or shares of the acquiring company, at a substantial discount to the public market price. Therefore, the rights will cause substantial dilution to a person or group that attempts to acquire us on terms not approved by our Board, except pursuant to any offer conditioned on a substantial number of rights being acquired.
We are also subject to the provisions of Delaware law described below regarding business combinations with interested stockholders. Section 203 of the Delaware General Corporation Law applies to a broad range of business combinations between a Delaware corporation and an interested stockholder. The Delaware law definition of “business combination” includes mergers, sales of assets, issuances of voting stock and certain other transactions. An “interested stockholder” is defined as any person who owns, directly or indirectly, 15% or more of the outstanding voting stock of a corporation.
Section 203 prohibits a corporation from engaging in a business combination with an interested stockholder for a period of three years following the date on which the stockholder became an interested stockholder, unless:
|
•
|
The Board approved the business combination before the stockholder became an interested stockholder, or the Board approved the transaction that resulted in the stockholder becoming an interested stockholder;
|
|
|
|
•
|
Upon completion of the transaction which resulted in the stockholder becoming an interested stockholder, such stockholder owned at least 85% of the voting stock outstanding when the transaction began other than shares held by directors who are also officers and other than shares held by certain employee stock plans; or
|
|
|
•
|
The Board approved the business combination after the stockholder became an interested stockholder and the business combination was approved at a meeting by at least two-thirds of the outstanding voting stock not owned by such stockholder.
|
Although we believe these provisions protect our stockholders from coercive or otherwise unfair takeover tactics and thereby provide for an opportunity to receive a higher bid by requiring potential acquirers to negotiate with our Board of Directors, these provisions apply even if the offer may be considered beneficial by some stockholders.
None.
24
|
ITEM 2.
|
PROPERTIES
|
We lease executive offices totaling approximately 24,000 square feet in Chicago, Illinois. We believe that our properties and facilities meet our current operating requirements and are in good operating condition. However, our facility in Lakeland is one of our older facilities, and we are in the process of evaluating alternatives of replacement or refurbishment. We believe that each of our significant manufacturing facilities is operating at a level consistent with the industries in which we operate. The following are significant production facilities for our JBT FoodTech operations:
|
LOCATION
|
SQUARE FEET
(approximate)
|
LEASED OR
OWNED
|
|||
|
United States:
|
|||||
|
Madera, California
|
250,000 |
Owned
|
|||
|
Lakeland, Florida
|
225,000 |
Owned
|
|||
|
Sandusky, Ohio
|
140,000 |
Owned
|
|||
|
International:
|
|||||
|
St. Niklaas, Belgium
|
289,000 |
Owned
|
|||
|
Helsingborg, Sweden
|
227,000 |
Owned/Leased
|
|||
|
Araraquara, Brazil
|
125,000 |
Owned
|
|||
|
Parma, Italy
|
72,000 |
Owned
|
|||
|
Ningbo, China
|
60,000 |
Leased
|
|||
|
Edinburgh, Scotland
|
41,000 |
Leased
|
|||
|
Cape Town, South Africa
|
38,000 |
Leased
|
|||
The significant production properties for our JBT AeroTech operations are listed below:
|
LOCATION
|
SQUARE FEET
(approximate)
|
LEASED OR
OWNED
|
|||
|
United States:
|
|||||
|
Orlando, Florida
|
253,000 |
Owned
|
|||
|
Ogden, Utah
|
220,000 |
Owned/Leased
|
|||
|
Chalfont, Pennsylvania
|
67,000 |
Leased
|
|||
|
International:
|
|||||
|
Madrid, Spain
|
258,000 |
Owned
|
|||
|
Shenzhen, China
|
43,000 |
Leased
|
|||
|
Juarez, Mexico
|
33,000 |
Leased
|
|||
|
ITEM 3.
|
LEGAL PROCEEDINGS
|
Pursuant to the Separation and Distribution Agreement we entered into with FMC Technologies, as of the time of our separation from FMC Technologies, we have assumed liabilities related to specified legal proceedings arising from our business prior to separation. Although FMC Technologies may remain the named defendant in certain of these proceedings, we will manage the litigation and are required to indemnify FMC Technologies for costs, expenses and judgments arising from this existing litigation. We do not believe that any existing litigation we have assumed will have a material effect on our results of operations, financial condition or liquidity.
We are involved in other legal proceedings arising in the ordinary course of business. Although the results of litigation cannot be predicted with certainty, we do not believe that the resolution of the proceedings that we are involved in, either individually or taken as a whole, will have a material adverse effect on our business, results of operations, cash flows or financial condition.
25
PART II
|
ITEM 5.
|
MARKET FOR REGISTRANT’S COMMON EQUITY AND RELATED STOCKHOLDER MATTERS
|
Market Information
Our common stock is listed on the New York Stock Exchange under the symbol JBT. Market information with respect to the high and low sales prices for our common stock for each fiscal quarter of 2010 and 2009 are contained in Note 18 to our consolidated financial statements.
As of February 28, 2011, there were 3,330 holders of record of JBT Corporation’s common stock.
Dividends
Since becoming a standalone public company in the third quarter of 2008, we have paid a quarterly cash dividend of $0.07 per common share. We expect to continue our policy of paying regular cash dividends, although there is no assurance as to future dividends as they are subject to Board of Directors approval and depend on future earnings, financial condition, capital requirements, financial covenants, industry practice and other factors our Board deems relevant.
Performance Graph
The following performance graph compares the cumulative total return on our common stock with the cumulative total return of the following indices: (i) the S&P SmallCap 600 Stock Index and (ii) the Russell 2000 Index. These indices are included for comparative purposes only and do not necessarily reflect management’s opinion that such indices are an appropriate measure of the relative performance of the stock involved, and are not intended to forecast or be indicative of possible future performance of the common stock.
CUMULATIVE TOTAL RETURN
Based upon an initial investment of $100 on July 31, 2008
with dividends reinvested
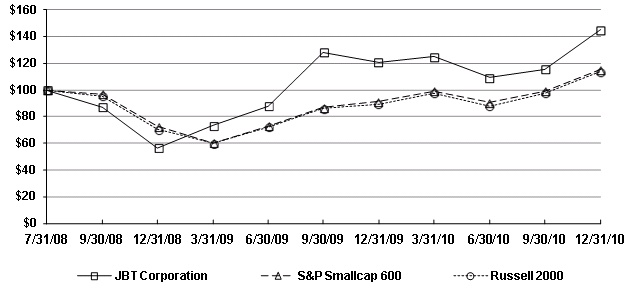
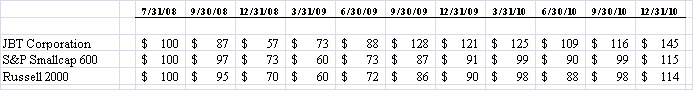
In accordance with SEC rules, the information contained in the Stock Performance Graph above shall not be deemed to be “soliciting material,” or to be “filed” with the SEC or subject to the SEC’s Regulation 14A or 14C, other than as provided under Item 201(e) of Regulation S-K, or to the liabilities of Section 18 of the Securities Exchange Act of 1934, as amended, except to the extent that the Company specifically requests that the information be treated as soliciting material or specifically incorporates it by reference into a document filed under the Securities Act of 1933, as amended, or the Securities Exchange Act of 1934, as amended.
26
|
ITEM 6.
|
SELECTED FINANCIAL DATA
|
The following table presents selected financial and other data about us for the most recent five fiscal years. The data have been derived from our consolidated and combined financial statements using the historical results of operations and bases of the assets and liabilities of our businesses and give effect to allocations of expenses from FMC Technologies, our former parent. For periods prior to the Separation, the historical combined statement of income data set forth below do not reflect changes that occurred in the operations and funding of our company as a result of our spin-off from FMC Technologies. The historical consolidated balance sheet data set forth below reflects the assets and liabilities that existed as of the dates and the periods presented.
The selected financial data should be read in conjunction with, and are qualified by reference to, Item 7. Management’s Discussion and Analysis of Financial Condition and Results of Operations. The income statement and cash flow data for each of the three years in the period ended December 31, 2010 and the balance sheet data as of December 31, 2010 and 2009 are derived from our audited financial statements included elsewhere in this report, and should be read in conjunction with those financial statements and the accompanying notes. The balance sheet data as of December 31, 2008, 2007 and 2006 and the income statement and cash flow data for the years ended December 31, 2007 and 2006 were derived from audited financial statements that are not presented in this report.
The financial information presented below may not reflect what our results of operations, cash flows and financial position would have been had we operated as a separate, stand-alone entity during the periods prior to the Separation, or what our results of operations, financial position and cash flows will be in the future. In addition, the Risk Factors section of Item 1A of this report includes a discussion of risk factors that could impact our future results of operations.
|
Year Ended December 31,
|
||||||||||||||||||||
|
(In millions, except per share data)
|
2010
|
2009
|
2008
|
2007
|
2006
|
|||||||||||||||
|
Income Statement Data:
|
||||||||||||||||||||
|
Revenue:
|
||||||||||||||||||||
|
JBT FoodTech
|
$ | 520.8 | $ | 515.8 | $ | 584.0 | $ | 594.1 | $ | 496.2 | ||||||||||
|
JBT AeroTech
|
351.2 | 320.7 | 446.9 | 386.0 | 348.7 | |||||||||||||||
|
Other revenue and intercompany eliminations
|
8.4 | 5.1 | (2.8 | ) | (2.1 | ) | (0.6 | ) | ||||||||||||
| Total Revenue | $ | 880.4 | $ | 841.6 | $ | 1,028.1 | $ | 978.0 | $ | 844.3 | ||||||||||
|
Operating expenses:
|
||||||||||||||||||||
|
Cost of sales
|
$ | 649.5 | $ | 621.2 | $ | 776.3 | $ | 740.8 | $ | 631.1 | ||||||||||
|
Selling, general and administrative expense
|
147.8 | 147.8 | 152.9 | 153.8 | 146.7 | |||||||||||||||
|
Research and development expense
|
17.5 | 17.1 | 22.0 | 18.7 | 16.2 | |||||||||||||||
|
Other (income) expense, net
|
(1.5 | ) | (2.2 | ) | 6.6 | 3.6 | (0.1 | ) | ||||||||||||
|
Operating income
|
67.1 | 57.7 | 70.3 | 61.1 | 50.4 | |||||||||||||||
|
Net interest (expense) income
|
(7.8 | ) | (8.8 | ) | (3.8 | ) | 0.5 | 0.4 | ||||||||||||
|
Income from continuing operations before income taxes
|
59.3 | 48.9 | 66.5 | 61.6 | 50.8 | |||||||||||||||
|
Provision for income taxes
|
21.4 | 16.1 | 22.4 | 21.5 | 16.0 | |||||||||||||||
|
Income from continuing operations
|
37.9 | 32.8 | 44.1 | 40.1 | 34.8 | |||||||||||||||
|
(Loss) income from discontinued operations, net of income taxes
|
(0.6 | ) | - | 0.1 | (3.7 | ) | (0.2 | ) | ||||||||||||
|
Net income
|
$ | 37.3 | $ | 32.8 | $ | 44.2 | $ | 36.4 | $ | 34.6 | ||||||||||
|
Common Stock Data:
|
||||||||||||||||||||
|
Diluted Earnings Per Share (1):
|
||||||||||||||||||||
|
Income from continuing operations
|
$ | 1.30 | $ | 1.15 | $ | 1.59 | $ | 1.45 | $ | 1.26 | ||||||||||
|
Net income
|
$ | 1.28 | $ | 1.15 | $ | 1.59 | $ | 1.32 | $ | 1.26 | ||||||||||
|
Diluted weighted average shares outstanding
|
29.1 | 28.6 | 27.8 | 27.5 | 27.5 | |||||||||||||||
|
Common Stock Price Range:
|
||||||||||||||||||||
|
High
|
$ | 20.78 | $ | 19.00 | $ | 14.50 | $ | - | $ | - | ||||||||||
|
Low
|
$ | 14.35 | $ | 8.67 | $ | 5.86 | $ | - | $ | - | ||||||||||
|
Cash dividends declared per common share
|
$ | 0.28 | $ | 0.28 | $ | 0.07 | $ | - | $ | - | ||||||||||
|
(1)
|
For all periods prior to July 31, 2008, the date of our spin-off from FMC Technologies, the number of diluted shares being used is the number of shares outstanding on July 31, 2008, as our common stock was not traded prior to July 31, 2008 and there were no dilutive securities in the prior periods.
|
27
|
At December 31,
|
||||||||||||||||||||
|
(In millions)
|
2010
|
2009
|
2008
|
2007
|
2006
|
|||||||||||||||
|
Balance Sheet Data:
|
||||||||||||||||||||
|
Total assets
|
$ | 582.2 | $ | 520.4 | $ | 578.1 | $ | 553.2 | $ | 499.4 | ||||||||||
|
Long-term debt, less current portion
|
145.4 | 131.8 | 185.0 | - | - | |||||||||||||||
|
Year Ended December 31,
|
||||||||||||||||||||
|
(In millions)
|
2010 | 2009 | 2008 | 2007 | 2006 | |||||||||||||||
|
Other Financial Information:
|
||||||||||||||||||||
|
Capital expenditures
|
$ | 24.3 | $ | 19.8 | $ | 22.9 | $ | 23.0 | $ | 22.7 | ||||||||||
|
Cash flows provided by continuing operating activities
|
$ | 17.6 | $ | 54.1 | $ | 81.8 | $ | 39.0 | $ | 96.3 | ||||||||||
|
Order backlog (unaudited)
|
$ | 286.8 | $ | 211.2 | $ | 285.5 | $ | 398.4 | $ | 322.1 | ||||||||||
|
ITEM 7.
|
MANAGEMENT’S DISCUSSION AND ANALYSIS OF FINANCIAL CONDITION AND RESULTS OF OPERATIONS
|
Executive Overview
We are a global technology solutions provider for the food processing and air transportation industries. We design, manufacture, test and service technologically sophisticated systems and products for customers through our JBT FoodTech and JBT AeroTech segments. We have established a large installed base of food processing equipment as well as airport equipment and have built a strong global presence with manufacturing, sourcing, sales and service organizations located on six continents to support equipment that has been delivered to more than 100 countries.
We have developed close working relationships with our customers, which we believe enhances our competitive advantage, strengthens our market position and improves our results. We serve customers from around the world. During 2010, a significant portion of our total sales were to locations outside of the United States. We evaluate international markets and pursue opportunities that fit our technological capabilities and strategies.
The food processing and air transportation industries in which we operate are susceptible to significant changes in the strength of the global or regional economies. This impacts the economic health of companies who make capital commitments for our products and services. We focus on economic and industry-specific drivers and key risk factors affecting each of our businesses as we formulate our strategic plans and make decisions related to allocating capital and human resources. These factors include risks associated with the global economic outlook, product obsolescence, and the competitive environment.
As we evaluate our operating results, we consider performance indicators like segment revenue and operating profit in addition to the level of inbound orders and order backlog.
Separation from FMC Technologies
Prior to July 31, 2008, we were a wholly-owned subsidiary of FMC Technologies. On July 31, 2008, FMC Technologies was separated into two independent publicly-traded companies through the distribution of 100% of its ownership of JBT Corporation, containing the FoodTech and Airport Systems businesses, to its shareholders (the “Separation”).
Our capital structure and financial condition significantly changed at the date of the Separation. The financial statements prior to the Separation do not reflect the debt or interest expense JBT Corporation might have incurred if we were a stand-alone company.
28
CONSOLIDATED AND COMBINED RESULTS OF OPERATIONS
|
Year Ended December 31,
|
Favorable / (Unfavorable)
|
|||||||||||||||||||
|
(in millions)
|
2010
|
2009
|
2008
|
2010
vs.
2009
|
2009
vs.
2008
|
|||||||||||||||
|
Revenue
|
$ | 880.4 | $ | 841.6 | $ | 1,028.1 | $ | 38.8 | $ | (186.5 | ) | |||||||||
|
Cost of sales
|
649.5 | 621.2 | 776.3 | (28.3 | ) | $ | 155.1 | |||||||||||||
|
Gross profit
|
230.9 | 220.4 | 251.8 | 10.5 | (31.4 | ) | ||||||||||||||
|
Selling, general and administrative expense
|
147.8 | 147.8 | 152.9 | - | 5.1 | |||||||||||||||
|
Research and development expense
|
17.5 | 17.1 | 22.0 | (0.4 | ) | 4.9 | ||||||||||||||
|
Other (income) expense, net
|
(1.5 | ) | (2.2 | ) | 6.6 | (0.7 | ) | 8.8 | ||||||||||||
|
Operating income
|
67.1 | 57.7 | 70.3 | 9.4 | (12.6 | ) | ||||||||||||||
|
Net interest expense
|
(7.8 | ) | (8.8 | ) | (3.8 | ) | 1.0 | (5.0 | ) | |||||||||||
|
Income from continuing operations before income taxes
|
59.3 | 48.9 | 66.5 | 10.4 | (17.6 | ) | ||||||||||||||
|
Provision for income taxes
|
21.4 | 16.1 | 22.4 | (5.3 | ) | 6.3 | ||||||||||||||
|
Income from continuing operations
|
37.9 | 32.8 | 44.1 | 5.1 | (11.3 | ) | ||||||||||||||
|
(Loss) income from discontinued operations, net of income taxes
|
(0.6 | ) | - | 0.1 | (0.6 | ) | (0.1 | ) | ||||||||||||
|
Net income
|
$ | 37.3 | $ | 32.8 | $ | 44.2 | $ | 4.5 | $ | (11.4 | ) | |||||||||
2010 Compared With 2009
Total revenue increased by $38.8 million (approximately 5%) in 2010 compared to 2009 as a result of higher product sales. JBT AeroTech’s revenue increased by $30.5 million as a result of higher demand for our ground support equipment and gate equipment products. JBT FoodTech’s revenue in constant currency remained relatively unchanged as higher sales of freezing and chilling products and protein processing products were offset by lower sales of fruit processing products and in-container processing products. Favorable impact of foreign currency translation resulted in $5.8 million of higher revenue.
Gross profit increased by $10.5 million in 2010 compared to 2009. Higher sales volume and a slight improvement in gross profit margins resulted in an increase in gross profit of $8.8 million and $0.5 million, respectively. Savings in retirement benefit costs due to the freeze of the U.S. pension plan at the end of 2009 were partially offset by higher healthcare costs. Favorable impact of foreign currency translation resulted in higher gross profit of $1.1 million.
Operating income increased by $9.4 million in 2010 compared to 2009 while operating income margins improved from 6.9% to 7.6%. The increase in operating income was driven by higher gross profit. Additionally, we were able to better leverage selling, general and administrative expenses as these expenses decreased as a percentage of revenue from 17.6% to 16.8%. Research and development expenses remained relatively unchanged as a percentage of revenue. Gains on investments in our non-qualified deferred compensation plan, which are reported in other (income) expense, net, were $0.6 million lower in 2010 compared to 2009.
Net interest expense was $1.0 million lower in 2010 compared to 2009. The decrease in net interest expense was a result of a lower overall interest rate on our variable rate debt due to maturity of a $25 million interest rate swap on January 30, 2010. The interest rate swap previously fixed the interest rate on a portion of our borrowings under the credit facility at 4.9%.
Income tax expense for 2010 reflects an effective income tax rate of 36.1% compared to 32.9% for 2009. The difference in the rate is attributable to higher earnings in higher tax jurisdictions relative to the prior year and the absence of a comparable reversal of a valuation allowance on deferred tax assets recorded in 2009.
2009 Compared With 2008
Our total revenue decreased by $186.5 million (approximately 18%) in 2009 compared to 2008. Both of our segments were affected by the challenging industry and economic conditions that began in 2008. JBT AeroTech revenue decreased by $126.2 million, primarily due to a decline in sales volume of our ground support equipment. Excluding the unfavorable impact of foreign currency translation of $18.2 million, JBT FoodTech revenue decreased by $50.0 million, primarily due to a decline in sales volume of our freezing and chilling products and protein processing products in Europe and Latin America. Additionally, gains on foreign currency transactions primarily related to derivative instruments resulted in $8.0 million of higher revenue.
29
Gross profit decreased by $31.4 million in 2009 compared to 2008. The decrease in gross profit was driven by lower sales volume and unfavorable impact of foreign currency translation, resulting in lower gross profit of $39.8 million and $10.4 million, respectively. However, the decrease in gross profit was partially offset by improved gross profit margins due to a higher proportion of revenue from aftermarket parts and services along with product margin improvement in some of JBT AeroTech’s products. This resulted in $18.8 million of incremental gross profit, despite $3.9 million of charges incurred in 2009 related to our cost reduction programs.
Operating income decreased by $12.6 million in 2009 compared to 2008 while operating income margins improved slightly from 6.8% to 6.9%. The decrease in operating income was driven by lower gross profit. However, lower selling, general and administrative expenses and research and development expenses partially offset the decrease by $5.1 million and $4.9 million, respectively. Selling costs decreased as a result of lower sales volume while the other costs decreased due to a reduction in staffing levels in our operations and lower spending as a result of cost reduction programs. Additionally, other (income) expense, net had a favorable impact of $8.8 million as we recognized a gain of $1.7 million on investments in our non-qualified deferred compensation plan in 2009 compared to a loss of $3.2 million in 2008, and a gain of $0.5 million on foreign currency transactions compared to a loss of $3.3 million mostly allocated to us from our former parent in 2008.
Net interest expense was $5.0 million higher in 2009 compared to 2008. The expense in 2009 reflects the full year interest expense on the senior unsecured notes we issued and the credit facility we entered into in July 2008 in connection with the Separation, while the expense in 2008 reflects interest expense on the same debt for only the period after the Separation, as we did not have significant amounts of debt outstanding prior to the Separation.
Income tax expense for 2009 resulted in an effective income tax rate of 32.9%, compared to an effective rate of 33.7% for 2008. The decrease in the effective tax rate was driven by a reversal of a $1.1 million valuation allowance on deferred tax assets related to one of our foreign operations.
Changes in Retirement Benefits
In September 2009, we amended the retirement benefits offered to our employees in an attempt to reduce the future financial risk of our defined benefit pension plans and provide a competitive and sustainable retirement program that allows us to successfully attract and retain a skilled workforce. Effective January 1, 2010, we discontinued future benefit accruals for active non-union participants in our domestic defined benefit pension plans as of December 31, 2009 and froze future participation in our domestic defined benefit pension plans by non-union employees. Additionally, effective January 1, 2010, we enhanced our defined contribution savings plans by adding a 3% company non-elective contribution with immediate vesting to all eligible non-union employees in addition to the current company match (of up to 5%) that vests over time.
As a result of the amendments to our domestic defined benefit pension plans, in 2009 we recognized a curtailment gain of $0.8 million to recognize all previously unrecognized prior service benefits. Additionally, as a result of discontinuing future benefit accruals for active non-union employees, our projected benefit obligation as of December 31, 2009 was reduced by $25.6 million.
In October 2010, we announced to participants in the John Bean Technologies Corporation Savings and Investment Plan (the “Savings Plan”) that the JBT Corporation stock fund would be removed from the list of investment options available to participants in the Savings Plan, effective as of January 1, 2011. This measure is being instituted in order to promote greater diversity of participants’ retirement savings among a variety of Savings Plan investments. All amounts invested by Savings Plan participants in our common stock held under the Savings Plan will be transferred to other Savings Plan investments by December 31, 2011, either by voluntary participant-directed transfers or by automatic quarterly transfers to be effected by us in 2011 to the extent participants continue to hold JBT Corporation common stock under the Savings Plan. As of December 31, 2010, 444,771 shares of our common stock were issued to participants under the Savings Plan.
Outlook
We expect continued improvement in market conditions for most of our product lines, with improvements varying significantly by region. Our backlog at December 31, 2010 is significantly higher than it was at December 31, 2009, which provides some visibility into 2011. However, we remain concerned over continued high levels of global economic and political uncertainty as well as the impact of higher fuel and other commodity costs in 2011. Our full year effective tax rate for 2011 is expected to be approximately 34% to 36%.
30
OPERATING RESULTS OF BUSINESS SEGMENTS
|
Year Ended December 31,
|
Favorable / (Unfavorable)
|
|||||||||||||||||||
|
(in millions)
|
2010
|
2009
|
2008
|
2010
vs.
2009
|
2009
vs.
2008
|
|||||||||||||||
|
Revenue
|
||||||||||||||||||||
|
JBT FoodTech
|
$ | 520.8 | $ | 515.8 | $ | 584.0 | $ | 5.0 | $ | (68.2 | ) | |||||||||
|
JBT AeroTech
|
351.2 | 320.7 | 446.9 | 30.5 | (126.2 | ) | ||||||||||||||
|
Other revenue and intercompany eliminations
|
8.4 | 5.1 | (2.8 | ) | 3.3 | 7.9 | ||||||||||||||
|
Total revenue
|
$ | 880.4 | $ | 841.6 | $ | 1,028.1 | $ | 38.8 | $ | (186.5 | ) | |||||||||
|
Income before income taxes
|
||||||||||||||||||||
|
Segment operating profit:
|
||||||||||||||||||||
|
JBT FoodTech
|
$ | 55.8 | $ | 52.4 | $ | 61.1 | $ | 3.4 | $ | (8.7 | ) | |||||||||
|
JBT AeroTech
|
28.6 | 27.2 | 38.5 | 1.4 | (11.3 | ) | ||||||||||||||
|
Total segment operating profit
|
84.4 | 79.6 | 99.6 | 4.8 | (20.0 | ) | ||||||||||||||
|
Corporate items:
|
||||||||||||||||||||
|
Corporate expense
|
(17.3 | ) | (15.4 | ) | (15.0 | ) | (1.9 | ) | (0.4 | ) | ||||||||||
|
Other expense, net
|
- | (6.5 | ) | (14.3 | ) | 6.5 | 7.8 | |||||||||||||
|
Net interest expense
|
(7.8 | ) | (8.8 | ) | (3.8 | ) | 1.0 | (5.0 | ) | |||||||||||
|
Total corporate items
|
(25.1 | ) | (30.7 | ) | (33.1 | ) | 5.6 | 2.4 | ||||||||||||
|
Income from continuing operations before income taxes
|
59.3 | 48.9 | 66.5 | 10.4 | (17.6 | ) | ||||||||||||||
|
Provision for income taxes
|
21.4 | 16.1 | 22.4 | 5.3 | (6.3 | ) | ||||||||||||||
|
Income from continuing operations
|
37.9 | 32.8 | 44.1 | 5.1 | (11.3 | ) | ||||||||||||||
|
(Loss) income from discontinued operations, net of income taxes
|
(0.6 | ) | - | 0.1 | (0.6 | ) | (0.1 | ) | ||||||||||||
|
Net income
|
$ | 37.3 | $ | 32.8 | $ | 44.2 | $ | 4.5 | $ | (11.4 | ) | |||||||||
Segment operating profit is defined as total segment revenue less segment operating expenses. The following items have been excluded in computing segment operating profit: corporate staff expense, foreign currency related gains and losses, LIFO provisions, restructuring costs, certain employee benefit expenses, interest income and expense and income taxes. During the fourth quarter of 2010, we changed the method we use to measure segment operating profit by excluding restructuring costs. As a result, all prior year measurements of segment operating profit have been restated for comparative purposes. Restructuring costs included in other expense, net were:
|
(in millions)
|
2010
|
2009
|
2008
|
|||||||||
|
JBT FoodTech
|
$ | 0.8 | $ | 1.8 | $ | 0.9 | ||||||
|
JBT AeroTech
|
2.9 | 2.1 | - | |||||||||
|
Total
|
$ | 3.7 | $ | 3.9 | $ | 0.9 | ||||||
JBT FoodTech
2010 Compared With 2009
JBT FoodTech’s revenue of $520.8 million represented an increase of $5.0 million in 2010 compared to 2009. The increase in revenue was driven primarily by a favorable impact of foreign currency translation, resulting in $6.6 million of higher revenue. Despite smaller order sizes relative to prior year, sales of freezing and chilling products and protein processing products in all geographic regions increased by $34.6 million. However, this increase was offset by an unfavorable year-over-year comparison of sales of large orders of fruit processing products and in-container processing products. During 2009, we sold $38.5 million of large orders of fruit processing products and in-container processing products received in 2008 and early part of 2009.
JBT FoodTech’s operating profit of $55.8 million represented an increase of $3.4 million in 2010 compared to 2009. Operating profit margins increased from 10.2% to 10.7%. The increase in operating profit was driven primarily by an improvement in gross profit margins, which resulted in $7.3 million of higher profit. Gross profit margins improved due to higher proportion of higher margin smaller sized projects and aftermarket sales as well as lower expenses related to retirement benefits and non-recurring costs. A slight decrease in sales volume resulted in $0.5 million of lower profit. Additionally, higher selling, general and administrative, and research and development costs resulted in $3.4 million of lower profit.
31
2009 Compared With 2008
JBT FoodTech’s revenue of $515.8 million represented a decrease of $68.2 million in 2009 compared to 2008. Continued challenging economic conditions in Europe and Latin America affected sales of our JBT FoodTech products. Sales of our freezing and chilling products and protein processing products declined in Europe by $29.5 million and in Latin America by $31.0 million. However, sales of our freezing and chilling products and protein processing products in Asia increased by $7.8 million. Sales of our freezing and chilling products and protein processing products in North America increased by $8.0 million in the ready meals market and by $5.6 million in the poultry market driven by shipments of large orders in 2009, however these increases were offset by lower sales in the meat and other markets. Sales of our in-container and fruit processing product lines improved slightly compared to the prior year period due to completion of large projects. Unfavorable impact of foreign currency translation resulted in $18.2 million of lower revenue. The remaining difference was primarily due to favorable impact of foreign currency transactions.
JBT FoodTech’s operating profit of $52.4 million represented a decrease of $8.7 million in 2009 compared to 2008. Lower sales volume resulted in $15.7 million of lower profits. However, gross profit margins improved due to a higher proportion of revenue from aftermarket parts and services resulting in $2.9 million of incremental profits. Research and development costs decreased by $2.8 million while general and administrative costs decreased by $1.9 million primarily due to a cost reduction program we implemented in the first quarter of 2009. Selling costs decreased by $0.9 million primarily due to lower sales volume. The remaining difference was primarily due to an unfavorable impact of foreign currency translation.
JBT AeroTech
2010 Compared With 2009
JBT AeroTech’s revenue of $351.2 million represented an increase of $30.5 million in 2010 compared to 2009. The increase in revenue was a result of higher demand for our ground support equipment and gate equipment products. Revenue from ground support equipment sales increased by $26.6 million, while revenue from gate equipment product sales increased by $23.8 million. These increases in revenue were partially offset by lower sales of Halvorsen loaders due to completion of a U.S. Air Force production contract.
JBT AeroTech’s operating profit of $28.6 million represented an increase of $1.4 million in 2010 compared to 2009. Operating profit margin decreased from 8.5% to 8.1%. Higher sales volume resulted in an increase in profit of $7.1 million while lower costs primarily due to cost reduction initiatives implemented in 2009 resulted in an increase in profit of $2.1 million. Gross profit margins declined due to the lower proportion of revenue from Halvorsen loaders and competitive pricing pressure in Airport Services, which together resulted in a decrease in profit of $7.8 million.
2009 Compared With 2008
JBT AeroTech’s revenue of $320.7 million represented a decrease of $126.2 million in 2009 compared to 2008. Weak demand for our ground support equipment due to the global recession, combined with very strong results in 2008 driven by conversion of 2007 year-end order backlog, resulted in a decrease in revenue of $105.1 million. Lower sales of our gate equipment products resulted in a decrease in revenue of $24.5 million primarily driven by fewer shipments of pre-conditioned air units to the U.S. military. Higher sales of our Halvorsen loaders resulted in an increase in revenue of $4.7 million, but were mostly offset by an unfavorable impact of foreign currency translation.
JBT AeroTech’s operating profit of $27.2 million represented a decrease of $11.3 million in 2009 compared to 2008. Lower sales volume resulted in a decrease in profits of $24.7 million. However, gross profit margins improved by 2.4 percentage points due to a more favorable product mix resulting in $7.8 million of incremental gross profit. Selling costs decreased by $2.7 million primarily due to lower sales volume. Research and development costs decreased by $1.5 million while general and administrative costs decreased by $1.2 million primarily due to a cost reduction program we implemented in the first quarter of 2009.
Corporate Items
2010 Compared With 2009
Corporate items of $25.1 million represented a decrease of $5.6 million in 2010 compared to 2009. The decrease was driven by favorable pension expenses due to the freeze of the U.S. pension plan at the end of 2009, which resulted in $3.1 million of lower corporate items. Additionally, a decline in inventory levels required a reduction in the LIFO reserve resulting in $2.4 million of lower corporate items.
32
2009 Compared With 2008
Corporate items of $30.7 million represented a decrease of $2.4 million in 2009 compared to 2008. The decrease was driven by the impact of foreign currency transactions. In the third quarter of 2008, we elected to discontinue designating our new foreign currency derivative instruments as hedging instruments. Therefore, during 2009 all changes in fair value of derivative instruments not designated as hedging instruments were recognized in earnings. Foreign currency transactions resulted in $6.3 million of gains in 2009 compared to $5.8 million of losses in 2008. The gains in 2009 were driven by the weakening of the U.S. dollar primarily against the Brazilian real. The impact of foreign currency transactions was partially offset by a $5.0 million increase in interest expense. The interest expense in 2009 reflects the interest expense on the senior unsecured notes we issued and the credit facility we entered into in July 2008 in connection with the Separation. The expense in 2008 reflects interest expense on the senior unsecured notes and the credit facility for only the period after the Separation, as we did not have significant amounts of debt outstanding prior to the Separation. Additionally, we recognized $3.9 million of restructuring costs in 2009 compared to $0.9 million in 2008.
Inbound Orders and Order Backlog
Inbound orders represent the estimated sales value of confirmed customer orders received during the reporting period.
|
Inbound Orders
|
||||||||
|
Year Ended December 31,
|
||||||||
|
(In millions)
|
2010
|
2009
|
||||||
|
JBT FoodTech
|
$ | 527.5 | $ | 463.5 | ||||
|
JBT AeroTech
|
419.9 | 297.9 | ||||||
|
Other and intercompany eliminations
|
8.6 | 5.9 | ||||||
|
Total inbound orders
|
$ | 956.0 | $ | 767.3 | ||||
Order backlog is calculated as the estimated sales value of unfilled, confirmed customer orders at the reporting date.
|
Order Backlog
|
||||||||
|
December 31,
|
||||||||
|
(In millions)
|
2010
|
2009
|
||||||
|
JBT FoodTech
|
$ | 103.4 | $ | 96.7 | ||||
|
JBT AeroTech
|
183.4 | 114.7 | ||||||
|
Intercompany eliminations
|
- | (0.2 | ) | |||||
|
Total order backlog
|
$ | 286.8 | $ | 211.2 | ||||
Order backlog in our JBT FoodTech segment at December 31, 2010 increased by $6.7 million since year-end 2009 due to several large orders received in 2010. We expect to convert the entire JBT FoodTech backlog at December 31, 2010 into revenue during 2011.
Order backlog in our JBT AeroTech segment at December 31, 2010 increased by $68.7 million since year-end 2009 due to large orders received for gate equipment products and ground support equipment. We expect to convert approximately 82% of the JBT AeroTech backlog at December 31, 2010 into revenue during 2011.
Liquidity and Capital Resources
Our primary sources of liquidity are cash provided by operating activities and our credit facility. We believe cash flows from operations and the credit facility will be sufficient to satisfy our future working capital, research and development activities, capital expenditures, pension contributions and other financing requirements. Our ability to generate positive cash flows from operations is dependent on general economic conditions, competitive pressures, and other business and risk factors.
Cash flows for each of the years in the three-year period ended on December 31, 2010 were as follows:
|
(In millions)
|
2010
|
2009
|
2008
|
|||||||||
|
Cash provided by continuing operating activities
|
$ | 17.6 | $ | 54.1 | $ | 81.8 | ||||||
|
Cash required by continuing investing activities
|
(23.7 | ) | (24.8 | ) | (25.3 | ) | ||||||
|
Cash provided (required) by financing activities
|
4.9 | (60.2 | ) | (22.1 | ) | |||||||
|
Cash provided by discontinued operations
|
(0.1 | ) | - | 0.7 | ||||||||
|
Effect of foreign exchange rate changes on cash and cash equivalents
|
0.6 | 1.7 | (1.0 | ) | ||||||||
|
(Decrease) increase in cash and cash equivalents
|
$ | (0.7 | ) | $ | (29.2 | ) | $ | 34.1 | ||||
33
Cash flows provided by continuing operating activities in 2010 were $17.6 million, representing a $36.5 million decrease compared to 2009. The change in cash flows is primarily attributable to changes in working capital. Sales in the fourth quarter of 2010 were approximately $41 million higher than in the same quarter in 2009, resulting in significantly higher levels of trade receivables and accounts payable at year end. Part of the increase in trade receivables was due to approximately $25 million of higher unbilled receivables for long-term projects, such as those in JBT AeroTech. We strive to obtain advance payments for all projects. However, our billings in excess of revenue recognized were approximately $5 million lower as of December 31, 2010 compared to the same date in 2009. Additionally, we made a voluntary contribution of $10.2 million to our U.S. defined benefit plan in 2010 compared to a contribution of $14.0 million in 2009. Cash flows from continuing operating activities in 2009 were $27.7 million lower than in 2008 driven by an $11.3 million decrease in income from continuing operations and $15.4 million of higher pension plan contribution.
The majority of our investing activities support the maintenance and upgrading of our installed base of leased equipment. Our annual capital spending typically ranges from $20.0 million to $25.0 million.
Our financing activities in 2010 consisted primarily of $11.8 million of net proceeds from our credit facility partially offset by dividends paid to our shareholders. Our financing activities in 2009 consisted primarily of payments to reduce our debt by $53.4 million.
Financing Arrangements
We have a $225 million revolving credit facility with a consortium of financial institutions at December 31, 2010. Borrowings under the credit facility bear interest, at our option, at LIBOR or an alternative base rate, which is the greater of JPMorgan Chase, N.A.’s Prime Rate or Federal Funds Rate plus 50 basis points, plus a margin dependent on our leverage ratio. We are required to make periodic interest payments on the borrowed amounts and pay an annual facility fee ranging from 17.5 to 35 basis points, depending on our leverage ratio. The credit facility expires on July 31, 2013. As of December 31, 2010, we had $68.7 million drawn on the credit facility, approximately $28 million in letters of credit issued under the credit facility and approximately $128 million of additional available funds.
We had an interest rate swap which fixed the annual interest rate on a portion of our borrowings under the credit facility at 4.9%. For the period from July 31, 2008 to January 29, 2010, the interest rate swap fixed the interest rate on $50 million of our borrowings and for the period from January 30, 2010 to January 31, 2011, the interest rate swap fixed the interest on $25 million of our borrowings.
Additionally, we have $75 million of 6.66% senior unsecured notes outstanding. The senior unsecured notes are due on July 31, 2015 and require us to make semiannual interest payments.
Our credit agreement and notes include restrictive covenants that, if not met, could lead to a renegotiation of our credit lines, requirement to repay our borrowings and/or a significant increase in our cost of financing. At December 31, 2010, we were in compliance with all covenants of our contractual obligations as shown in the following table:
|
Debt Instrument / Covenant
|
Measurement
|
Result as of
December 31, 2010
|
|||
|
Revolving credit facility
|
|||||
|
Interest coverage ratio (1)
|
Not less than 3.5
|
12.3
|
|||
|
Leverage ratio (2)
|
Not greater than 3.0
|
1.6
|
|||
|
Capital expenditures (3)
|
Not greater than $33 million
|
$24.3 million
|
|||
|
Dividends paid
|
Not greater than $20 million
|
$8.1 million
|
|||
|
6.66% senior unsecured notes
|
|||||
|
Interest coverage ratio (1)
|
Not less than 2.75
|
12.3
|
|||
|
Leverage ratio (2)
|
Not greater than 3.25
|
1.6
|
|||
|
(1)
|
Interest coverage ratio is a comparison of the trailing twelve months Consolidated EBITDA, defined as net income plus interest expense plus income tax expense plus depreciation and amortization plus non-cash expenses and extraordinary, unusual and non-recurring items, to trailing twelve months interest expense.
|
|
(2)
|
Leverage ratio is a comparison of the total indebtedness, defined as total debt plus guarantees of indebtedness of others plus obligations under financial letters of credit issued against the credit facility, to the trailing twelve month Consolidated EBITDA, as defined above.
|
|
(3)
|
Capital expenditures are limited to $30 million plus 50% of the unutilized amount from prior year.
|
We expect to remain in compliance with all restrictive covenants in the foreseeable future. However, there can be no assurance that continued or increased volatility in the global economic conditions will not impair our ability to meet our restrictive covenants, or the volatility in the capital and credit markets will not impair our ability to access these markets on terms acceptable to us or at all.
34
Outlook
We plan to meet our cash requirements in future periods with cash generated from operations and borrowings under our credit facility. On February 23, 2011, the Board of Directors approved a quarterly cash dividend of $0.07 per share of outstanding common stock, or approximately $2.0 million. The dividend will be paid on March 25, 2011 to stockholders of record at the close of business on March 4, 2011. We estimate that we will contribute approximately $11.5 million in 2011 to our pension and other postretirement benefit plans, primarily reflecting discretionary contributions to our U.S. qualified pension plan.
We continue to evaluate acquisitions in the normal course of business which we expect to fund with cash generated from operations or borrowings under our credit agreements.
Contractual Obligations
The following is a summary of our contractual obligations at December 31, 2010:
|
Payments due by period
|
||||||||||||||||||||
|
(In millions)
|
Total
payments
|
Less than
1 year
|
1 - 3
years
|
3-5
years
|
After 5
years
|
|||||||||||||||
|
Long-term debt (a)
|
$ | 147.1 | $ | 1.7 | $ | 70.4 | $ | 75.0 | $ | - | ||||||||||
|
Operating leases
|
16.4 | 4.9 | 7.0 | 4.1 | 0.4 | |||||||||||||||
|
Unconditional purchase obligations (b)
|
29.2 | 27.8 | 1.4 | - | - | |||||||||||||||
|
Pension and other postretirement benefits (c)
|
11.5 | 11.5 | - | - | - | |||||||||||||||
|
Total contractual obligations
|
$ | 204.2 | $ | 45.9 | $ | 78.8 | $ | 79.1 | $ | 0.4 | ||||||||||
|
(a)
|
Our available long-term debt is dependent upon our compliance with covenants described in the previous section. Any violations of covenants or other events of default, which are not waived or cured, could have a material impact on our ability to maintain our committed financial arrangements.
|
|
(b)
|
In the normal course of business, we enter into agreements with our suppliers to purchase raw materials or services. These agreements include a requirement that our supplier provide products or services to our specifications and require us to make a firm purchase commitment to our supplier. As substantially all of these commitments are associated with purchases made to fulfill our customers’ orders, the costs associated with these agreements will ultimately be reflected in cost of sales on our statements of income.
|
|
(c)
|
We expect to make approximately $11.5 million in contributions to our pension and other postretirement benefit plans during 2011. This amount primarily reflects discretionary contributions to our U.S. qualified pension plan. Required contributions for future years depend on factors that cannot be determined at this time.
|
Off-Balance Sheet Arrangements
The following is a summary of other off-balance sheet arrangements at December 31, 2010:
|
Amount of commitment expiration per period
|
||||||||||||||||||||
|
(In millions)
|
Total
amount
|
Less than
1 year
|
1 - 3
years
|
3-5
years
|
After 5
years
|
|||||||||||||||
|
Letters of credit and bank guarantees
|
$ | 49.3 | $ | 45.1 | $ | 3.5 | $ | - | $ | 0.7 | ||||||||||
|
Surety bonds
|
57.1 | 56.2 | 0.9 | - | - | |||||||||||||||
|
Total other off-balance sheet arrangements
|
$ | 106.4 | $ | 101.3 | $ | 4.4 | $ | - | $ | 0.7 | ||||||||||
To provide required security regarding our performance on certain contracts, we provide letters of credit, surety bonds and bank guarantees, for which we are contingently liable. In order to obtain these financial instruments, we pay fees to various financial institutions in amounts competitively determined in the marketplace. Our ability to generate revenue from certain contracts is dependent upon our ability to obtain these off-balance sheet financial instruments.
Our off-balance sheet financial instruments may be renewed, revised or released based on changes in the underlying commitment. Historically, our commercial commitments have not been drawn upon to a material extent; consequently, management believes it is not likely that there will be claims against these commitments that would result in a negative impact on our key financial ratios or our ability to obtain financing.
Critical Accounting Estimates
We prepare our consolidated financial statements in conformity with U.S. generally accepted accounting principles. As such, we are required to make certain estimates, judgments and assumptions about matters that are inherently uncertain. On an ongoing basis, our management re-evaluates these estimates, judgments and assumptions for reasonableness because of the critical impact that these factors have on the reported amounts of assets and liabilities at the dates of the financial statements and the reported amounts of revenue and expenses during the periods presented. Management has discussed the development and selection of these critical accounting estimates with the Audit Committee of our Board of Directors and the Audit Committee has reviewed this disclosure. We believe that the following are the critical accounting estimates used in preparing our financial statements.
35
Inventory Valuation
Inventory is recorded at the lower of cost or net realizable value. In order to determine net realizable value, we evaluate each component of inventory on a regular basis to determine whether it is excess or obsolete. We record the decline in the carrying value of estimated excess or obsolete inventory as a reduction of inventory and as an expense included in cost of sales in the period in which it is identified. Our estimate of excess and obsolete inventory is a critical accounting estimate because it is highly susceptible to change from period to period. In addition, it requires management to make judgments about the future demand for inventory.
In order to quantify excess or obsolete inventory, we begin by preparing a candidate listing of the components of inventory that have not demonstrated usage within the most recent two-year period. This list is then reviewed with sales, production and materials management personnel to determine whether this list of potential excess or obsolete inventory items is accurate. Management considers as part of this evaluation whether there has been a change in the market for finished goods, whether there will be future demand for on-hand inventory items and whether there are components of inventory that incorporate obsolete technology. Then management assigns a reserve requirement, which is determined based on its assessment of cost recoverability, to the items on the candidate listing. As a result, our estimate of excess or obsolete inventory is sensitive to changes in assumptions about future demand for the inventory. Since the determination of the reserve requirement is based on management judgment rather than a formulaic approach, we are unable to quantify with a high level of precision the effect that a change in demand assumptions would have on management’s assessment of the excess and obsolete inventory reserve, although lower demand assumptions would generally result in an increase in excess and obsolete inventory.
Goodwill
Goodwill represents the excess of the cost of an acquired business over the amounts assigned to the net assets. Goodwill is not amortized but is tested for impairment at a reporting unit level on an annual basis or if an event occurs or circumstances change that would more likely than not reduce the fair value of a reporting unit below its carrying amount.
Significant judgment is applied when determining the fair value of a reporting unit. We use an income approach to determine the fair value. The income approach is based on discounted cash flows which are derived from internal forecasts for each respective reporting unit. Forecasting future income requires us to use a significant amount of judgment. In estimating future income, we use our internal operating budgets and long-range planning projections. We develop our budgets and long-range projections based on recent results, trends, economic and industry forecasts influencing our performance, our backlog, planned timing of new product launches, and customer sales commitments. We also apply judgment when selecting appropriate discount rates, identifying relevant market comparables, incorporating general economic and market conditions and selecting an appropriate control premium.
We completed our annual goodwill impairment test as of October 31, 2010 and determined there was no impairment. We currently believe that there is no significant risk of future material goodwill impairment in any of our reporting units.
Self-Insurance Reserves
We purchase third-party insurance for workers’ compensation, automobile, product and general liability claims that exceed a certain level. We are responsible for the payment of claims under these insured limits as well as claims under our self-insured healthcare plans. The obligations associated with the incurred losses are determined using actuarial estimates. These estimates are based on historical information along with certain assumptions about future events. Changes in assumptions for medical costs, environmental hazards, and legal actions, as well as changes in actual experience could cause these estimates to change which could potentially be material to our results of operation and financial condition.
Accounting for Income Taxes
In determining our current income tax provision, we assess temporary differences resulting from differing treatments of items for tax and accounting purposes. These differences result in deferred tax assets and liabilities, which are recorded in our consolidated balance sheets. When we maintain deferred tax assets, we must assess the likelihood that these assets will be recovered through adjustments to future taxable income. To the extent we believe recovery is not likely, we establish a valuation allowance. We record an allowance reducing the asset to a value we believe will be recoverable based on our expectation of future taxable income. We believe the accounting estimate related to the valuation allowance is a critical accounting estimate because it is highly susceptible to change from period to period as it requires management to make assumptions about our future income over the lives of the deferred tax assets, and the impact of increasing or decreasing the valuation allowance is potentially material to our results of operations.
36
Forecasting future income requires us to use a significant amount of judgment. In estimating future income, we use our internal operating budgets and long-range planning projections. We develop our budgets and long-range projections based on recent results, trends, economic and industry forecasts influencing our segments’ performance, our backlog, planned timing of new product launches, and customer sales commitments. Significant changes in the expected realizability of the net deferred tax assets would require that we adjust the valuation allowance, resulting in a change to net income.
As of December 31, 2010, we estimated that it is not likely that we will realize income tax deductions for certain uncollectible receivables and, therefore, we have provided a valuation allowance against the related deferred tax assets. We have estimated that it is likely that we will generate future taxable income in the U.S. and most foreign jurisdictions, and have therefore not provided a valuation allowance against most of our deferred tax assets.
Retirement Benefits
We provide most of our employees with certain retirement (pension) and postretirement (health care and life insurance) benefits. In order to measure the expense and obligations associated with these retirement benefits, management must make a variety of estimates, including discount rates used to value certain liabilities, expected return on plan assets set aside to fund these costs, employee turnover rates, retirement rates, mortality rates and other factors. We update these estimates on an annual basis or more frequently upon the occurrence of significant events. These accounting estimates bear the risk of change due to the uncertainty attached to the estimate as well as the fact that these estimates are difficult to measure. Different estimates used by management could result in our recognizing different amounts of expense over different periods of time.
We use third-party specialists to assist management in evaluating our assumptions as well as appropriately measuring the costs and obligations associated with these retirement benefits. The discount rate and expected return on plan assets are based primarily on investment yields available and the historical performance of our plan assets. They are critical accounting estimates because they are subject to management’s judgment and can materially affect net income.
For the years ended December 31, 2010, 2009 and 2008, pension costs were a benefit of $1.7 million and expense of $8.3 million and $6.4 million, respectively. Pension expense reported in the periods prior to the Separation includes an allocation of expense from FMC Technologies.
The discount rate used affects the periodic recognition of the interest cost component of net periodic pension cost. The discount rate is based on rates at which the pension benefit obligation could effectively be settled on a present value basis. To determine the weighted average discount rate, we review long-term, high quality corporate bonds at December 31 of each year and use a model that matches the projected benefit payments for our plans to coupons and maturities from high quality bonds. Significant changes in the discount rate, such as those caused by changes in the yield curve, the mix of bonds available in the market, the duration of selected bonds, and the timing of expected benefit payments may result in volatility in pension expense and pension liabilities.
Our pension expense is typically sensitive to changes in our estimate of discount rate. However, holding other assumptions constant, a 50 basis point reduction or increase in the discount rate would not significantly change the annual pension expense for 2010.
Net periodic pension cost includes an underlying expected long-term rate of asset return. Our estimate of the expected rate of return on plan assets is based primarily on the historical performance of plan assets, current market conditions, our asset allocation and long-term growth expectations. Our estimated long-term rate of asset return at December 31, 2010 was approximately 8.6%. The expected return on plan assets is recognized as part of the net periodic pension cost. The difference between the expected return and the actual return on plan assets is amortized over the expected remaining life of participants, so there is a lag time between the market’s performance and its impact on plan results.
Our pension expense is sensitive to changes in our estimate of expected rate of return on plan assets. Holding other assumptions constant, an increase or decrease of 50 basis points in the expected rate of return on plan assets would decrease or increase annual pension expense by approximately $1.1 million before taxes.
|
ITEM 7A.
|
QUANTITATIVE AND QUALITATIVE DISCLOSURES ABOUT MARKET RISK
|
We are subject to financial market risks, including fluctuations in foreign currency exchange rates and interest rates. In order to manage and mitigate our exposure to these risks, we may use derivative financial instruments in accordance with established policies and procedures. We do not use derivative financial instruments where the objective is to generate profits solely from trading activities. At December 31, 2010 and 2009, our derivative holdings consisted of foreign currency forward contracts, foreign currency instruments embedded in purchase and sale contracts and an interest rate swap agreement. We do not hedge foreign currency translation risk.
37
These forward-looking disclosures address potential impacts from market risks only as they affect our financial instruments. They do not include other potential effects which could impact our business as a result of changes in foreign currency exchange rates, interest rates, commodity prices or equity prices.
Foreign Currency Exchange Rate Risk
During 2010, our foreign subsidiaries generated approximately 37% of our revenue, driven by our operations in Sweden which generated approximately 14% of our revenue. Financial statements of our foreign subsidiaries for which the U.S. dollar is not the functional currency are translated into U.S. dollars. As a result, we are exposed to foreign currency translation risk.
When we sell or purchase products or services, transactions are frequently denominated in currencies other than an operation’s functional currency. When foreign currency exposures exist, we may enter into foreign exchange forward instruments with third parties to economically hedge foreign currency exposures. Our hedging policy reduces, but does not entirely eliminate, the impact of foreign currency exchange rate movements. We do not apply hedge accounting for our foreign currency forward instruments.
We economically hedge our recognized foreign currency assets and liabilities to reduce the risk that our earnings and cash flows will be adversely affected by fluctuations in foreign currency exchange rates. We expect any gains or losses in the hedging portfolio to be substantially offset by a corresponding gain or loss in the underlying exposures being hedged. We also economically hedge firmly committed anticipated transactions in the normal course of business. As these are not offset by an underlying balance sheet position being hedged, our earnings can be significantly impacted on a periodic basis by the change in unrealized value of these hedges.
We use a sensitivity analysis to measure the impact of an immediate 10% adverse movement in the foreign currency exchange rates. This calculation assumes that each exchange rate would change in the same direction relative to the U.S. dollar and all other variables are held constant. We expect that changes in the fair value of derivative instruments will offset the changes in fair value of the underlying assets and liabilities on the balance sheet. A 10% adverse movement in the foreign currency exchange rates would reduce the value of our derivative instruments for which we do not apply hedge accounting by approximately $6.9 million as of December 31, 2010. This amount would be reflected in our net income but would be significantly offset by the changes in the fair value of the underlying assets and liabilities.
Interest Rate Risk
Our debt instruments subject us to market risk associated with movements in interest rates. We had $68.9 million in variable rate debt outstanding at December 31, 2010. We have entered into a floating-to-fixed interest rate swap related to a portion of the variable rate debt. The swap provides for payment at an average fixed interest rate of 4.9% until its maturity on January 31, 2011. For the period from July 31, 2008 to January 29, 2010, the notional amount of the swap was $50 million. For the period from January 30, 2010 to January 31, 2011, the notional amount of the swap is $25 million.
We use a sensitivity analysis to measure the impact on fair value of the interest rate swap of an immediate adverse movement in the interest rates of 50 basis points. This analysis was based on a modeling technique that measures the hypothetical market value resulting from a 50 basis point change in interest rates. This adverse change in the applicable interest rates would result in an immaterial decrease in the net fair value of our interest rate swap at December 31, 2010. We account for the interest rate swap using hedge accounting where the fair value of the swap is recorded in other accumulated income and is amortized into income as variable interest expense is recorded.
At December 31, 2010 we had $43.9 million of unhedged variable rate debt. Using sensitivity analysis to measure the impact of a 10% adverse movement in the interest rate, or 16 basis points, would result in an immaterial increase to the annual interest expense.
38
|
ITEM 8.
|
FINANCIAL STATEMENTS AND SUPPLEMENTARY DATA
|
Report of Independent Registered Public Accounting Firm
The Board of Directors and Stockholders
John Bean Technologies Corporation:
We have audited the accompanying consolidated balance sheets of John Bean Technologies Corporation and subsidiaries as of December 31, 2010 and 2009, and the related consolidated and combined statements of income, changes in stockholders’ equity, and cash flows for each of the years in the three-year period ended December 31, 2010. These consolidated and combined financial statements are the responsibility of the Company’s management. Our responsibility is to express an opinion on these consolidated and combined financial statements based on our audits.
We conducted our audits in accordance with the standards of the Public Company Accounting Oversight Board (United States). Those standards require that we plan and perform the audit to obtain reasonable assurance about whether the financial statements are free of material misstatement. An audit includes examining, on a test basis, evidence supporting the amounts and disclosures in the financial statements. An audit also includes assessing the accounting principles used and significant estimates made by management, as well as evaluating the overall financial statement presentation. We believe that our audits provide a reasonable basis for our opinion.
In our opinion, the consolidated and combined financial statements referred to above present fairly, in all material respects, the financial position of John Bean Technologies Corporation and subsidiaries as of December 31, 2010 and 2009, and the results of their operations and their cash flows for each of the years in the three-year period ended December 31, 2010, in conformity with U.S. generally accepted accounting principles.
We also have audited, in accordance with the standards of the Public Company Accounting Oversight Board (United States), John Bean Technologies Corporation’s internal control over financial reporting as of December 31, 2010, based on criteria established in Internal Control – Integrated Framework issued by the Committee of Sponsoring Organizations of the Treadway Commission (COSO), and our report dated March 3, 2011 expressed an unqualified opinion on the effectiveness of the Company’s internal control over financial reporting.
/s/ KPMG LLP
Chicago, Illinois
March 3, 2011
39
JOHN BEAN TECHNOLOGIES CORPORATION
CONSOLIDATED AND COMBINED STATEMENTS OF INCOME
|
Year Ended December 31,
|
||||||||||||
|
(In millions, except per share data)
|
2010
|
2009
|
2008
|
|||||||||
|
Revenue:
|
||||||||||||
|
Product revenue
|
$ | 770.9 | $ | 720.3 | $ | 900.8 | ||||||
|
Service revenue
|
109.5 | 121.3 | 127.3 | |||||||||
|
Total revenue
|
880.4 | 841.6 | 1,028.1 | |||||||||
|
Operating expenses:
|
||||||||||||
|
Cost of products
|
567.6 | 534.0 | 683.9 | |||||||||
|
Cost of services
|
81.9 | 87.2 | 92.4 | |||||||||
|
Selling, general and administrative expense
|
147.8 | 147.8 | 152.9 | |||||||||
|
Research and development expense
|
17.5 | 17.1 | 22.0 | |||||||||
|
Other (income) expense, net
|
(1.5 | ) | (2.2 | ) | 6.6 | |||||||
|
Operating income
|
67.1 | 57.7 | 70.3 | |||||||||
|
Net interest expense
|
(7.8 | ) | (8.8 | ) | (3.8 | ) | ||||||
|
Income from continuing operations before income taxes
|
59.3 | 48.9 | 66.5 | |||||||||
|
Provision for income taxes
|
21.4 | 16.1 | 22.4 | |||||||||
|
Income from continuing operations
|
37.9 | 32.8 | 44.1 | |||||||||
|
Discontinued operations
|
||||||||||||
|
(Loss) income from discontinued operations, net of income taxes
|
(0.6 | ) | - | 0.2 | ||||||||
|
Loss on disposition of discontinued operations, net of income taxes
|
- | - | (0.1 | ) | ||||||||
|
(Loss) income from discontinued operations, net of income taxes
|
(0.6 | ) | - | 0.1 | ||||||||
|
Net income
|
$ | 37.3 | $ | 32.8 | $ | 44.2 | ||||||
|
Basic earnings per share:
|
||||||||||||
|
Income from continuing operations
|
$ | 1.34 | $ | 1.19 | $ | 1.60 | ||||||
|
(Loss) income from discontinued operations
|
(0.02 | ) | - | 0.01 | ||||||||
|
Net income
|
$ | 1.32 | $ | 1.19 | $ | 1.61 | ||||||
|
Diluted earnings per share:
|
||||||||||||
|
Income from continuing operations
|
$ | 1.30 | $ | 1.15 | $ | 1.59 | ||||||
|
Loss from discontinued operations
|
(0.02 | ) | - | - | ||||||||
|
Net income
|
$ | 1.28 | $ | 1.15 | $ | 1.59 | ||||||
|
Dividends declared per share
|
$ | 0.28 | $ | 0.28 | $ | 0.07 | ||||||
|
Weighted average shares outstanding:
|
||||||||||||
|
Basic
|
28.3 | 27.6 | 27.5 | |||||||||
|
Diluted
|
29.1 | 28.6 | 27.8 | |||||||||
The accompanying notes are an integral part of the consolidated and combined financial statements.
40
JOHN BEAN TECHNOLOGIES CORPORATION
CONSOLIDATED BALANCE SHEETS
|
December 31,
|
December 31,
|
|||||||
|
(In millions, except per share and number of shares)
|
2010
|
2009
|
||||||
|
Assets
|
||||||||
|
Current Assets:
|
||||||||
|
Cash and cash equivalents
|
$ | 13.7 | $ | 14.4 | ||||
|
Trade receivables, net of allowances of $4.8 and $5.1, respectively
|
192.7 | 136.6 | ||||||
|
Inventories
|
106.7 | 107.0 | ||||||
|
Prepaid expenses
|
5.1 | 4.5 | ||||||
|
Deferred income taxes
|
8.7 | 6.6 | ||||||
|
Other current assets
|
29.5 | 21.6 | ||||||
|
Total current assets
|
356.4 | 290.7 | ||||||
|
Investments
|
9.9 | 10.9 | ||||||
|
Property, plant and equipment, net of accumulated depreciation of $225.5 and $218.1, respectively
|
128.7 | 126.5 | ||||||
|
Goodwill
|
28.4 | 28.2 | ||||||
|
Intangible assets, net
|
19.9 | 20.8 | ||||||
|
Deferred income taxes
|
25.6 | 30.4 | ||||||
|
Other assets
|
13.3 | 12.9 | ||||||
|
Total Assets
|
$ | 582.2 | $ | 520.4 | ||||
|
Liabilities and Stockholders' Equity
|
||||||||
|
Current Liabilities:
|
||||||||
|
Accounts payable, trade and other
|
$ | 86.3 | $ | 65.9 | ||||
|
Advance and progress payments
|
52.4 | 56.8 | ||||||
|
Accrued payroll
|
34.4 | 31.3 | ||||||
|
Deferred income taxes
|
7.3 | 6.6 | ||||||
|
Other current liabilities
|
61.6 | 60.3 | ||||||
|
Total current liabilities
|
242.0 | 220.9 | ||||||
|
Long-term debt, less current portion
|
145.4 | 131.8 | ||||||
|
Accrued pension and other postretirement benefits, less current portion
|
73.0 | 77.1 | ||||||
|
Deferred income taxes
|
2.3 | 2.3 | ||||||
|
Other liabilities
|
26.5 | 26.5 | ||||||
|
Commitments and contingencies (Note 16)
|
||||||||
|
Stockholders' Equity:
|
||||||||
|
Preferred stock, $0.01 par value; 20,000,000 shares authorized; no shares issued
|
- | - | ||||||
|
Common stock, $0.01 par value; 120,000,000 shares authorized;
2010: 28,237,279 issued and 28,185,834 outstanding;
2009: 27,663,335 issued and 27,611,193 outstanding
|
0.3 | 0.3 | ||||||
|
Common stock held in treasury, at cost;
2010: 51,445 shares;
2009: 52,142 shares
|
(0.7 | ) | (0.7 | ) | ||||
|
Additional paid-in capital
|
59.1 | 53.5 | ||||||
|
Retained earnings
|
73.6 | 44.7 | ||||||
|
Accumulated other comprehensive loss
|
(39.3 | ) | (36.0 | ) | ||||
|
Total Stockholders' Equity
|
93.0 | 61.8 | ||||||
|
Total Liabilities and Stockholders' Equity
|
$ | 582.2 | $ | 520.4 | ||||
The accompanying notes are an integral part of the consolidated and combined financial statements.
41
JOHN BEAN TECHNOLOGIES CORPORATION
CONSOLIDATED AND COMBINED STATEMENTS OF CASH FLOWS
|
Year Ended December 31,
|
||||||||||||
| (In millions) |
2010
|
2009
|
2008
|
|||||||||
|
Cash Flows From Operating Activities:
|
||||||||||||
|
Net income
|
$ | 37.3 | $ | 32.8 | $ | 44.2 | ||||||
|
Loss (income) from discontinued operations, net of income taxes
|
0.6 | - | (0.1 | ) | ||||||||
|
Income from continuing operations
|
37.9 | 32.8 | 44.1 | |||||||||
|
Adjustments to reconcile income from continuing operations to cash
provided (required) by operating activities of continuing operations:
|
||||||||||||
|
Depreciation
|
19.5 | 19.1 | 20.5 | |||||||||
|
Amortization
|
3.4 | 3.5 | 5.0 | |||||||||
|
Stock-based compensation
|
7.3 | 7.9 | 8.4 | |||||||||
|
Pension and other postretirement benefits (income) expense
|
(2.1 | ) | 7.9 | 5.9 | ||||||||
|
Deferred income taxes
|
8.8 | 6.6 | (1.4 | ) | ||||||||
|
Other
|
(4.7 | ) | 3.8 | 10.7 | ||||||||
|
Changes in operating assets and liabilities, net of effects of acquisitions:
|
||||||||||||
|
Trade receivables, net
|
(54.6 | ) | 13.7 | 4.2 | ||||||||
|
Inventories
|
3.3 | 22.8 | 17.0 | |||||||||
|
Accounts payable, trade and other
|
19.1 | (3.4 | ) | (32.0 | ) | |||||||
|
Advance payments and progress billings
|
(4.8 | ) | (26.5 | ) | (0.4 | ) | ||||||
|
Accrued pension and other postretirement benefits, net
|
(13.0 | ) | (17.6 | ) | (4.4 | ) | ||||||
|
Other assets and liabilities, net
|
(2.5 | ) | (16.5 | ) | 4.2 | |||||||
|
Cash provided by continuing operating activities
|
17.6 | 54.1 | 81.8 | |||||||||
|
Net cash required by discontinued operating activities
|
(0.1 | ) | - | - | ||||||||
|
Cash provided by operating activities
|
17.5 | 54.1 | 81.8 | |||||||||
|
Cash Flows From Investing Activities:
|
||||||||||||
|
Acquisitions
|
(0.4 | ) | (6.7 | ) | (4.5 | ) | ||||||
|
Capital expenditures
|
(24.3 | ) | (19.8 | ) | (22.9 | ) | ||||||
|
Proceeds from disposal of assets
|
1.0 | 1.7 | 2.1 | |||||||||
|
Cash required by continuing investing activities
|
(23.7 | ) | (24.8 | ) | (25.3 | ) | ||||||
|
Cash provided by discontinued investing activities
|
- | - | 0.7 | |||||||||
|
Cash required by investing activities
|
(23.7 | ) | (24.8 | ) | (24.6 | ) | ||||||
|
Cash Flows From Financing Activities:
|
||||||||||||
|
Net proceeds from (payments on) credit facilities
|
11.8 | (53.3 | ) | 109.4 | ||||||||
|
Issuance of long-term debt, net of payments
|
2.9 | - | 75.0 | |||||||||
|
Distributions to former parent, net
|
- | - | (203.9 | ) | ||||||||
|
Purchase of stock held in treasury
|
- | - | (0.7 | ) | ||||||||
|
Dividends paid
|
(8.1 | ) | (7.7 | ) | (1.9 | ) | ||||||
| Other | (1.7 | ) | 0.8 | - | ||||||||
|
Cash provided (required) by financing activities
|
4.9 | (60.2 | ) | (22.1 | ) | |||||||
|
Effect of foreign exchange rate changes on cash and cash equivalents
|
0.6 | 1.7 | (1.0 | ) | ||||||||
|
(Decrease) increase in cash and cash equivalents
|
(0.7 | ) | (29.2 | ) | 34.1 | |||||||
|
Cash and cash equivalents, beginning of period
|
14.4 | 43.6 | 9.5 | |||||||||
|
Cash and cash equivalents, end of period
|
$ | 13.7 | $ | 14.4 | $ | 43.6 | ||||||
|
Supplemental Cash Flow Information:
|
||||||||||||
| Interest Paid | $ | 7.9 | $ | 8.6 | $ | 1.6 | ||||||
|
Income taxes paid
|
16.5 | 8.5 | 13.4 | |||||||||
The accompanying notes are an integral part of the consolidated and combined financial statements.
42
JOHN BEAN TECHNOLOGIES CORPORATION
CONSOLIDATED AND COMBINED STATEMENTS OF CHANGES IN STOCKHOLDERS’ EQUITY
| Accumulated | Comprehensive | |||||||||||||||||||||||||||||||||||
| Common | Other | Income | ||||||||||||||||||||||||||||||||||
| Common | Stock | Additional | Parent | Comprehensive | for the | |||||||||||||||||||||||||||||||
|
Stock Issued
|
Held in
|
Paid-In
|
Retained
|
Company
|
Income
|
Total
|
Year
|
|||||||||||||||||||||||||||||
|
(In millions)
|
Shares
|
Amount
|
Treasury
|
Capital
|
Earnings
|
Investment
|
(Loss)
|
Equity
|
Ended
|
|||||||||||||||||||||||||||
|
December 31, 2007
|
- | $ | - | $ | - | $ | - | $ | - | $ | 218.3 | $ | (4.1 | ) | $ | 214.2 | $ | 47.7 | ||||||||||||||||||
|
Net income
|
- | - | - | - | 22.1 | 22.1 | - | 44.2 | 44.2 | |||||||||||||||||||||||||||
|
Assumption of pension and other
postretirement benefit losses, net
of income taxes of $15.8
|
- | - | - | - | - | - | (24.7 | ) | (24.7 | ) | ||||||||||||||||||||||||||
|
Net distributions to former parent
|
- | - | - | - | - | (206.6 | ) | - | (206.6 | ) | ||||||||||||||||||||||||||
|
Issuance of common stock
|
27.6 | 0.3 | - | 38.6 | - | (38.9 | ) | - | - | |||||||||||||||||||||||||||
|
Purchase of treasury stock
|
(0.1 | ) | - | (0.8 | ) | - | - | - | - | (0.8 | ) | |||||||||||||||||||||||||
|
Common stock cash dividends
|
- | - | - | - | (1.9 | ) | - | - | (1.9 | ) | ||||||||||||||||||||||||||
|
Foreign currency translation adjustments
|
- | - | - | - | - | - | (2.2 | ) | (2.2 | ) | (2.2 | ) | ||||||||||||||||||||||||
|
Derivatives designated as hedges,
net of income taxes of $1.1
|
- | - | - | - | - | - | (1.8 | ) | (1.8 | ) | (1.8 | ) | ||||||||||||||||||||||||
|
Pension and other postretirement
liability adjustments, net of income
taxes of $23.6
|
- | - | - | - | - | - | (37.6 | ) | (37.6 | ) | (37.6 | ) | ||||||||||||||||||||||||
|
Stock-based compensation expense
|
- | - | - | 3.3 | - | 5.1 | - | 8.4 | ||||||||||||||||||||||||||||
|
December 31, 2008
|
27.5 | $ | 0.3 | $ | (0.8 | ) | $ | 41.9 | $ | 20.2 | $ | - | $ | (70.4 | ) | $ | (8.8 | ) | $ | 2.6 | ||||||||||||||||
|
Net income
|
- | - | - | - | 32.8 | - | - | 32.8 | $ | 32.8 | ||||||||||||||||||||||||||
|
Issuance of common stock
|
0.1 | - | - | 0.2 | - | - | - | 0.2 | ||||||||||||||||||||||||||||
|
Excess tax benefits on stock-based
payment arrangements
|
- | - | - | 0.9 | - | - | - | 0.9 | ||||||||||||||||||||||||||||
|
Dividends on stock-based
payment arrangements
|
- | - | - | - | (0.6 | ) | - | - | (0.6 | ) | ||||||||||||||||||||||||||
|
Net sales of common stock for
employee benefit trust, at cost
|
- | - | 0.1 | 0.1 | - | - | - | 0.2 | ||||||||||||||||||||||||||||
|
Common stock cash dividends
|
- | - | - | - | (7.7 | ) | - | - | (7.7 | ) | ||||||||||||||||||||||||||
|
Foreign currency translation adjustments
|
- | - | - | - | - | - | 12.3 | 12.3 | 12.3 | |||||||||||||||||||||||||||
|
Derivatives designated as hedges, net
of income taxes of $0.9
|
- | - | - | - | - | - | 1.5 | 1.5 | 1.5 | |||||||||||||||||||||||||||
|
Pension and other postretirement
liability adjustments, net of income
taxes of $13.2
|
- | - | - | - | - | - | 20.6 | 20.6 | 20.6 | |||||||||||||||||||||||||||
|
Stock-based compensation expense
|
- | - | - | 7.9 | - | - | - | 7.9 | ||||||||||||||||||||||||||||
|
Adjustments related to the Separation
from former parent
|
- | - | - | 2.5 | - | - | - | 2.5 | ||||||||||||||||||||||||||||
|
December 31, 2009
|
27.6 | $ | 0.3 | $ | (0.7 | ) | $ | 53.5 | $ | 44.7 | $ | - | $ | (36.0 | ) | $ | 61.8 | $ | 67.2 | |||||||||||||||||
|
Net income
|
- | - | - | - | 37.3 | - | - | 37.3 | $ | 37.3 | ||||||||||||||||||||||||||
|
Issuance of common stock
|
0.6 | - | - | - | - | - | - | - | ||||||||||||||||||||||||||||
|
Taxes withheld on issuance of
stock-based awards
|
- | - | - | (3.5 | ) | - | - | - | (3.5 | ) | ||||||||||||||||||||||||||
|
Excess tax benefits on stock-based
payment arrangements
|
- | - | - | 1.8 | - | - | - | 1.8 | ||||||||||||||||||||||||||||
|
Dividends on stock-based
payment arrangements
|
- | - | - | - | (0.5 | ) | - | - | (0.5 | ) | ||||||||||||||||||||||||||
|
Common stock cash dividends
|
- | - | - | - | (7.9 | ) | - | - | (7.9 | ) | ||||||||||||||||||||||||||
|
Foreign currency translation adjustments
|
- | - | - | - | - | - | 3.1 | 3.1 | 3.1 | |||||||||||||||||||||||||||
|
Derivatives designated as hedges,
net of income taxes of $0.0
|
- | - | - | - | - | - | 0.1 | 0.1 | 0.1 | |||||||||||||||||||||||||||
|
Pension and other postretirement
liability adjustments, net of income taxes of $4.3
|
- | - | - | - | - | - | (6.5 | ) | (6.5 | ) | (6.5 | ) | ||||||||||||||||||||||||
|
Stock-based compensation expense
|
- | - | - | 7.3 | - | - | - | 7.3 | ||||||||||||||||||||||||||||
|
December 31, 2010
|
28.2 | $ | 0.3 | $ | (0.7 | ) | $ | 59.1 | $ | 73.6 | $ | - | $ | (39.3 | ) | $ | 93.0 | $ | 34.0 | |||||||||||||||||
The accompanying notes are an integral part of the consolidated and combined financial statements.
43
JOHN BEAN TECHNOLOGIES CORPORATION
NOTES TO CONSOLIDATED AND COMBINED FINANCIAL STATEMENTS
NOTE 1. DESCRIPTION OF BUSINESS AND BASIS OF PRESENTATION
Description of Business—John Bean Technologies Corporation (“JBT Corporation,” the “Company” or “we”) designs, manufactures and services sophisticated machinery and systems for, and provides services to, customers in the food processing and air transportation industries. We have manufacturing operations worldwide and are strategically located to facilitate delivery of our products and services to our customers. We report our results through two business segments—JBT FoodTech and JBT AeroTech.
The Separation—In October 2007, FMC Technologies, Inc. (“FMC Technologies”) announced an intention to separate into two independent publicly-traded companies through the distribution of 100% of its FoodTech and Airport Systems businesses to the shareholders of FMC Technologies (the “Separation”).
In preparation for the Separation, FMC Technologies contributed all of the assets and liabilities of the FoodTech and Airport Systems businesses to JBT Corporation, a wholly-owned subsidiary of FMC Technologies. FMC Technologies accomplished the Separation through a distribution of .216 of a share of JBT Corporation common stock for every share of FMC Technologies common stock on July 31, 2008, to FMC Technologies shareholders of record as of July 22, 2008.
Basis of Presentation—The accompanying financial statements reflect the consolidated operations of JBT Corporation as an independent publicly-traded company subsequent to the Separation and a combined reporting entity comprising the assets and liabilities used in managing and operating the FoodTech and Airport Systems businesses of FMC Technologies for the periods prior to the Separation.
The financial statements for the periods prior to the Separation have been prepared in accordance with accounting principles generally accepted in United States (“GAAP”) on a carve-out basis from the consolidated financial statements of FMC Technologies using the historical results of operations and bases of the assets and liabilities of the transferred businesses and including allocations from FMC Technologies. This presentation incorporates the same principles used when preparing consolidated financial statements, including elimination of intercompany transactions. Allocated expenses include general and administrative services such as accounting, treasury, tax, legal, human resources, information technology and other corporate and infrastructure services. Many assets, liabilities and expenses could be specifically identified with our businesses or personnel and were directly allocated. To the extent amounts could not be specifically identified and allocated, we primarily used our proportion of FMC Technologies’ total revenue as a reasonable allocation method. Allocations have been determined on the basis of assumptions and estimates that management believes to be a reasonable reflection of our utilization of those services. These allocations and estimates, however, are not necessarily indicative of the assets, liabilities and expenses that would have resulted if we had operated as a separate entity in the past, or that may result in the future.
Upon the effectiveness of the Separation, we significantly changed our capital structure. The financial statements prior to the Separation do not reflect the debt or interest expense we might have incurred if we were a stand-alone entity. In addition, the financial statements may not be indicative of our consolidated financial position, operating results or cash flows in the future or what our financial position, operating results and cash flows would have been had we been a separate, stand-alone entity during the periods presented.
Reclassifications—Certain amounts in prior years' financial information have been reclassified to conform to the current year presentation.
NOTE 2. SUMMARY OF SIGNIFICANT ACCOUNTING POLICIES
Use of estimates—The preparation of financial statements in conformity with GAAP requires management to make estimates and assumptions that affect the reported amounts of assets and liabilities and disclosures of contingent assets and liabilities at the date of the financial statements and the reported amounts of revenue and expenses during the reporting period. Actual results could differ from those estimates. We base our estimates on historical experience and on other assumptions that we believe to be relevant under the circumstances.
Revenue recognition—Revenue is recognized when all of the following criteria are met:
|
•
|
there is evidence of a customer arrangement with a fixed or determinable fee,
|
|
|
|
•
|
delivery has occurred, and
|
|
|
•
|
there is reasonable assurance of collectibility.
|
Our standard agreements generally do not include customer acceptance provisions. However, if there is a customer acceptance provision, the associated revenue is deferred until we have satisfied the acceptance provision.
44
Certain of our product sales recorded in the JBT AeroTech segment relate to construction-type contracts and are recognized under the percentage of completion method. Under this method, revenue is recognized as work progresses on each contract. However, revenue recognition does not begin until a substantial portion of the labor hours are incurred to ensure that revenue is not accelerated for materials procurement. We primarily measure progress toward completion by the cost-to-cost method. Any expected losses are charged to earnings, in total, in the period the losses are identified.
Progress billings generally are issued contingent on completion of certain phases of the work as stipulated in the contract. Revenue in excess of progress billings on contracts amounted to $50.5 million and $ 25.8 million at December 31, 2010 and 2009, respectively. These unbilled receivables are reported in trade receivables on the consolidated balance sheets. Progress billings and cash collections in excess of revenue recognized on a contract are classified as advance and progress payments on the balance sheets. All unbilled trade payables are accrued in other current liabilities when revenue is recognized. Unbilled trade payables were $14.2 million and $11.3 million at December 31, 2010 and 2009, respectively.
Service revenue is recognized either when performance is complete or proportionately over the period of the underlying contract, depending on the type of contract. If current period revenue is dependent on future obligations, such revenue is deferred until performance is complete.
Some of our operating lease revenue is earned from full-service leases for which we are paid annual fixed rates plus, in some cases, payment based on production volumes. Revenue from production volumes is recognized when determinable and collectible.
Each customer arrangement is evaluated to determine the presence of multiple deliverables that represent separate elements of revenue recognition. For multiple-element revenue arrangements, such as the sale of equipment with a service agreement, we generally allocate the contract value to the various elements based on relative selling price for each element and recognize revenue consistent with the nature of each deliverable. Where separate deliverables are contractually contingent on future obligations, revenue is deferred until performance is complete for all contingent elements.
Cash and cash equivalents— Cash and cash equivalents consist of cash and highly liquid investments with original maturities of three months or less.
Trade receivables—We provide an allowance for doubtful accounts on trade receivables equal to the estimated uncollectible amounts. This estimate is based on historical collection experience and a specific review of each customer’s trade receivable balance.
Inventories—Inventories are stated at the lower of cost or net realizable value, which includes an estimate for excess and obsolete inventories. Inventory costs include those costs directly attributable to products, including all manufacturing overhead but excluding costs to distribute. Cost is determined on the last-in, first-out (“LIFO”) basis for all domestic inventories, except certain inventories relating to construction-type contracts, which are stated at the actual production cost incurred to date, reduced by the portion of these costs identified with revenue recognized. The first-in, first-out (“FIFO”) method is used to determine the cost for all other inventories.
Impairment of long-lived and intangible assets—Long-lived assets, including property, plant and equipment, identifiable intangible assets and capitalized software costs are reviewed for impairment whenever events or changes in circumstances indicate that the carrying amount of the long-lived asset may not be recoverable. The carrying amount of a long-lived asset is not recoverable if it exceeds the sum of the undiscounted cash flows expected to result from the use and eventual disposition of the asset. If it is determined that an impairment loss has occurred, the loss is measured as the amount by which the carrying amount of the long-lived asset exceeds its fair value.
Property, plant, and equipment—Property, plant, and equipment is recorded at cost. Depreciation for financial reporting purposes is provided principally on the straight-line basis over the estimated useful lives of the assets (land improvements—20 to 35 years, buildings—20 to 50 years; and machinery and equipment—3 to 20 years). Gains and losses are reflected in income upon the sale or retirement of assets. Expenditures that extend the useful lives of property, plant, and equipment are capitalized and depreciated over the estimated new remaining life of the asset.
Capitalized software costs—Other assets include the capitalized cost of internal use software (including Internet web sites). The assets are stated at cost less accumulated amortization and totaled $ 5.5 million and $ 6.5 million at December 31, 2010 and 2009, respectively. These software costs include significant purchases of software and internal and external costs incurred during the application development stage of software projects. These costs are amortized on a straight-line basis over the estimated useful lives of the assets. For internal use software, the useful lives range from three to ten years. For Internet web site costs, the estimated useful lives do not exceed three years.
45
Goodwill and other intangible assets—Goodwill is not subject to amortization but is tested for impairment on an annual basis (or more frequently if impairment indicators arise). We have established October 31 as the date of our annual test for impairment of goodwill. Impairment losses are calculated at the reporting unit level, and represent the excess of the carrying value of reporting unit goodwill over its implied fair value. The implied fair value of goodwill is determined by a two-step process. The first compares the fair value of the reporting unit (measured as the present value of expected future cash flows) to its carrying amount. If the fair value of the reporting unit is less than its carrying amount, a second step is performed. In this step, the fair value of the reporting unit is allocated to its assets and liabilities to determine the implied fair value of goodwill, which is used to measure the impairment loss.
Our acquired intangible assets are being amortized on a straight-line basis over their estimated useful lives, which generally range from 7 to 15 years. None of our acquired intangible assets have indefinite lives.
Income taxes—Income taxes are provided on income reported for financial statement purposes, adjusted for permanent differences between financial statement reporting and income tax regulations. Deferred tax assets and liabilities are measured using enacted tax rates for the expected future tax consequences of temporary differences between the carrying amounts and the tax bases of assets and liabilities. A valuation allowance is established whenever management believes that it is more likely than not that deferred tax assets may not be realizable.
A liability for uncertain tax positions is recorded whenever management believes it is more likely than not that the position will not be realized upon settlement. Interest and penalties related to underpayment of income taxes are classified as income tax expense.
Income taxes are not provided on the Company’s equity in undistributed earnings of foreign subsidiaries or affiliates when it is management’s intention that such earnings will remain invested in those companies. Taxes are provided on such earnings in the year in which the decision is made to repatriate the earnings.
For the periods prior to the Separation, our operating results were included in FMC Technologies’ consolidated U.S. and state income tax returns and in tax returns of certain FMC Technologies foreign subsidiaries. For the periods prior to the Separation, the provision for income taxes has been computed as if JBT Corporation was a stand-alone entity and filed separate tax returns. The provision was impacted by FMC Technologies’ tax structure and strategies, which were designed to optimize an overall tax position and not that of JBT Corporation as part of its multiple businesses. Deferred tax assets and liabilities were recognized for the expected tax consequences of temporary differences between the tax bases of assets and liabilities and their reported amounts.
Stock-based employee compensation—We measure compensation cost on restricted stock awards based on the market price at the grant date and the number of shares awarded. The compensation cost for each award is recognized ratably over the lesser of the stated vesting period or the period until the employee becomes retirement eligible, after taking into account estimated forfeitures. For the periods prior to the Separation, stock-based compensation represents the costs related to FMC Technologies’ share-based awards granted to employees of JBT Corporation.
Foreign currency—Financial statements of operations for which the U.S. dollar is not the functional currency are translated to the U.S. dollar prior to consolidation. Assets and liabilities are translated at the exchange rate in effect at the balance sheet date, while income statement accounts are translated at the average exchange rate for each period. For these operations, translation gains and losses are recorded as a component of accumulated other comprehensive loss in stockholders’ equity until the foreign entity is sold or liquidated.
Derivative financial instruments—Derivatives are recognized in the consolidated balance sheets at fair value, with classification as current or non-current based upon the maturity of the derivative instrument. We do not offset fair value amounts for derivative instruments held with the same counterparty. Changes in the fair value of derivative instruments are recorded in current earnings or deferred in accumulated other comprehensive income (loss), depending on the type of hedging transaction and whether a derivative is designated as, and is effective as, a hedge.
Hedge accounting is only applied when the derivative is deemed to be highly effective at offsetting changes in anticipated cash flows of the hedged item or transaction. Changes in fair value of derivatives that are designated as cash flow hedges are deferred in accumulated other comprehensive income (loss) until the underlying transactions are recognized in earnings. At such time related deferred hedging gains or losses are also recorded in operating earnings on the same line as the hedged item. Effectiveness is assessed at the inception of the hedge and on a quarterly basis. Effectiveness of forward contract cash flow hedges is assessed based solely on changes in fair value attributable to the change in the spot rate. The change in the fair value of the contract related to the change in forward rates is excluded from the assessment of hedge effectiveness. Changes in this excluded component of the derivative instrument, along with any ineffectiveness identified, are recorded in operating earnings as incurred. We document our risk management strategy and method for assessing hedge effectiveness at the inception of and throughout the term of each hedge.
46
We elected to discontinue the use of hedge accounting for all foreign currency derivative positions entered into after our Separation from FMC Technologies. Accordingly, the changes in fair value of these contracts are recognized in earnings as they occur and, to the extent derivatives economically hedge existing assets or liabilities as opposed to anticipated transactions, offset gains or losses on the remeasurement of the related asset or liability. In the consolidated statements of income, earnings from foreign currency derivatives related to sales and remeasurement of sales related assets, liabilities and contracts are recorded in revenue, while earnings from foreign currency derivatives related to purchases and remeasurement of purchase related assets, liabilities and contracts are recorded in cost of sales. These gains and losses are recorded in other expense, net in the reconciliation of segment operating profit to income before income taxes.
Cash flows from derivative contracts are reported in the consolidated and combined statements of cash flows in the same categories as the cash flows from the underlying transactions.
Recently issued accounting pronouncements— On January 1, 2010, we adopted the updated guidance related to revenue recognition for arrangements with multiple deliverables, which addresses the accounting for multiple-deliverable arrangements and provides guidance on whether multiple deliverables exist, how to separate deliverables and how to measure and allocate arrangement consideration between the identified units of accounting. We elected to adopt the updated guidance on a prospective basis for applicable transactions originating or modified after December 31, 2009. The adoption of the updated guidance did not have a material impact on our consolidated results of operations or financial position.
On January 1, 2010, we adopted the updated guidance related to fair value measurements and disclosures, which requires separate disclosure of significant transfers in and out of Level 1 and Level 2 fair value measurements and a separate description of the reasons for the transfers. In addition, in the reconciliation for fair value measurements using significant unobservable inputs, or Level 3, a separate disclosure is required of information about purchases, sales, issuances and settlements (that is, on a gross basis rather than one net number). The updated guidance also requires fair value measurement disclosures for each class of assets and liabilities and disclosures about the valuation techniques and inputs used to measure fair value. We have not yet adopted the guidance with respect to the activity in Level 3 fair value measurements as it is not effective until our first quarter of 2011. We have updated our disclosures to comply with the updated guidance, which did not have an impact on our consolidated results of operations or financial condition.
During the fourth quarter of 2010, we adopted the new disclosure guidance related to the credit quality of financing receivables and the allowance for credit losses. This guidance requires companies to provide more information about the credit quality of their financing receivables in the disclosures to financial statements including, but not limited to, significant purchases and sales of financing receivables, aging information and credit quality indicators. The adoption of this accounting guidance did not have an impact on our consolidated results of operations or financial position.
NOTE 3. DISCONTINUED OPERATIONS
We report businesses or asset groups as discontinued operations when we commit to a plan to divest the business or asset group and the sale of the business or asset group is deemed probable within the next 12 months. The consolidated and combined statements of income include the following in discontinued operations for the years ended on December 31 :
|
(In millions)
|
2010
|
2009
|
2008
|
|||||||||
|
Revenue
|
$ | - | $ | - | $ | 0.6 | ||||||
|
Loss before income taxes
|
(0.9 | ) | - | (0.1 | ) | |||||||
|
Income tax benefit
|
0.3 | - | 0.3 | |||||||||
|
Loss on disposition of discontinued operations, net of taxes
|
- | - | (0.1 | ) | ||||||||
|
(Loss) income from discontinued operations
|
$ | (0.6 | ) | $ | - | $ | 0.1 | |||||
The 2010 results include a settlement of a $0.9 million claim.
47
NOTE 4. INVENTORIES
Inventories as of December 31 consisted of the following:
|
(In millions)
|
2010
|
2009
|
||||||
|
Raw materials
|
$ | 65.8 | $ | 61.7 | ||||
|
Work in process
|
29.8 | 28.5 | ||||||
|
Finished goods
|
69.6 | 74.6 | ||||||
|
Gross inventories before LIFO reserves and valuation adjustments
|
165.2 | 164.8 | ||||||
|
LIFO reserves and valuation adjustments
|
(58.5 | ) | (57.8 | ) | ||||
|
Net inventories
|
$ | 106.7 | $ | 107.0 | ||||
Inventories accounted for under the LIFO method totaled $100.4 million and $103.7 million at December 31, 2010 and 2009, respectively. The current replacement costs of LIFO inventories exceeded their recorded values by $44.7 million and $46.3 million at December 31, 2010 and 2009, respectively. Certain inventory quantity reductions caused a liquidation of LIFO layers resulting in a benefit to our net income of $1.7 million and $0.3 million in 2010 and 2009, respectively.
NOTE 5. PROPERTY, PLANT AND EQUIPMENT
Property, plant and equipment as of December 31 consisted of the following:
|
(In millions)
|
2010
|
2009
|
||||||
|
Land and land improvements
|
$ | 7.0 | $ | 6.9 | ||||
|
Buildings
|
59.0 | 57.6 | ||||||
|
Machinery and equipment
|
280.4 | 274.3 | ||||||
|
Construction in process
|
7.8 | 5.8 | ||||||
| 354.2 | 344.6 | |||||||
|
Accumulated depreciation
|
(225.5 | ) | (218.1 | ) | ||||
|
Property, plant and equipment, net
|
$ | 128.7 | $ | 126.5 | ||||
NOTE 6. GOODWILL AND INTANGIBLE ASSETS
Goodwill—The changes in the carrying amount of goodwill by business segment was as follows:
|
(In millions)
|
JBT FoodTech
|
JBT AeroTech
|
Total
|
|||||||||
|
Balance as of January 1, 2009
|
$ | 18.7 | $ | 8.0 | $ | 26.7 | ||||||
|
Acquisitions
|
1.1 | - | 1.1 | |||||||||
|
Currency translation
|
0.4 | 0.1 | 0.5 | |||||||||
|
Adjustments
|
(0.1 | ) | - | (0.1 | ) | |||||||
|
Balance as of December 31, 2009
|
20.1 | 8.1 | 28.2 | |||||||||
|
Acquisitions
|
- | - | - | |||||||||
|
Currency translation
|
0.3 | (0.1 | ) | 0.2 | ||||||||
|
Adjustments
|
- | - | - | |||||||||
|
Balance as of December 31, 2010
|
$ | 20.4 | $ | 8.0 | $ | 28.4 | ||||||
Intangible assets—The components of intangible assets as of December 31 were as follows:
|
2010
|
2009
|
|||||||||||||||
|
(In millions)
|
Gross carrying
amount
|
Accumulated
amortization
|
Gross carrying
amount
|
Accumulated
amortization
|
||||||||||||
|
Customer lists
|
$ | 17.3 | $ | 8.2 | $ | 16.9 | $ | 7.4 | ||||||||
|
Patents and acquired technology
|
25.4 | 24.2 | 24.5 | 23.2 | ||||||||||||
|
Trademarks
|
15.7 | 6.3 | 15.3 | 5.8 | ||||||||||||
|
Other
|
1.2 | 1.0 | 1.3 | 0.8 | ||||||||||||
|
Total intangible assets
|
$ | 59.6 | $ | 39.7 | $ | 58.0 | $ | 37.2 | ||||||||
All of our acquired identifiable intangible assets are subject to amortization and, where applicable, foreign currency translation adjustments. We recorded amortization expense related to acquired intangible assets of $1.5, $1.7 million and $2.5 million during the years ended on December 31, 2010, 2009 and 2008, respectively. Annual amortization expense is expected to be $1.5 million in 2011, $1.4 million in 2012 and 2013 and $1.3 million in 2014 and 2015.
48
In 2009, we acquired U.K.-based Double D Food Engineering Ltd. (“Double D”) for $6.7 million. Double D designs, manufactures and services custom-built ovens for bakery and protein products. In connection with the acquisition, we recorded $1.1 million of goodwill and $3.4 million of intangible assets, reflecting primarily a customer list. Double D is included in the JBT FoodTech reporting segment.
NOTE 7. DEBT
On July 31, 2008, we issued 6.66% senior unsecured notes and entered into a $225 million, 5-year revolving credit facility. The senior unsecured notes are due on July 31, 2015 and require us to make semiannual interest payments. The note purchase agreement contains customary covenants including leverage and interest coverage ratios. The leverage ratio covenant restricts the amount of Consolidated Total Indebtedness we may have compared to Consolidated EBITDA, according to the terms defined in the note purchase agreement. The interest coverage ratio covenant restricts the amount of Consolidated Interest Expense we may have compared to Consolidated EBITDA, according to the terms defined in the note purchase agreement. The revolving credit facility similarly contains certain customary covenants including similar leverage and interest coverage ratios and also limits the annual amounts we may spend on dividends and capital expenditures. Borrowings under the revolving credit facility bear interest, at our option, at either the London Interbank Offered Rate or an alternative base rate, which is the greater of JPMorgan Chase Bank, N.A.’s Prime Rate and Federal Funds Rate plus 50 basis points, plus a margin dependent on our leverage ratio as defined in the credit agreement. We are required to make periodic interest payments on the borrowed amounts and pay an annual facility fee ranging from 17.5 to 35 basis points, depending on our leverage ratio. Borrowings on the revolving credit facility are shown as a long-term obligation on the consolidated balance sheets because we have both the ability and the intent to refinance these obligations on a long-term basis under the credit agreement. As of December 31, 2010, we are in compliance with all restrictive covenants and expect to remain in compliance in the foreseeable future. However, there can be no assurance that continued or increased volatility in the global economic conditions will not impair our ability to meet our restrictive covenants, or the volatility in the capital and credit markets will not impair our ability to access these markets on terms acceptable to us or at all.
Long-term debt —Long-term debt as of December 31 consisted of the following:
|
(In millions)
|
2010
|
2009
|
||||||
|
6.66% senior unsecured notes due July 31, 2015
|
$ | 75.0 | $ | 75.0 | ||||
|
Revolving credit facility, due 2013
|
68.7 | 56.8 | ||||||
|
4.5% Brazilian Real loan due December 31, 2012
|
3.2 | - | ||||||
|
Other
|
0.2 | 0.4 | ||||||
|
Total debt
|
147.1 | 132.2 | ||||||
|
Less: current portion
|
(1.7 | ) | (0.4 | ) | ||||
|
Long-term debt, less current portion
|
$ | 145.4 | $ | 131.8 | ||||
Maturities of total long-term debt as of December 31, 2010, are payable as follows: $1.7 million in 2011 and 2012, $68.7 million in 2013 and $75 million in 2015.
Interest rate swap—As of December 31, 2010, we had an interest rate swap which fixed the annual interest rate on a portion of our borrowings under the credit facility at 4.9%. For the period from July 31, 2008 to January 29, 2010, the interest rate swap fixed the interest rate on $50 million of our borrowings and for the period from January 30, 2010 to January 31, 2011, the interest rate swap fixed the interest on $25 million of our borrowings.
NOTE 8. INCOME TAXES
Domestic and foreign components of income before income taxes for the years ended on December 31 are shown below:
|
(In millions)
|
2010
|
2009
|
2008
|
|||||||||
|
Domestic
|
$ | 38.6 | $ | 17.4 | $ | 37.4 | ||||||
|
Foreign
|
20.7 | 31.5 | 29.1 | |||||||||
|
Income before income taxes
|
$ | 59.3 | $ | 48.9 | $ | 66.5 | ||||||
49
The provision for income taxes for the years ended on December 31 consisted of:
|
(In millions)
|
2010
|
2009
|
2008
|
|||||||||
|
Current:
|
||||||||||||
|
Federal
|
$ | 4.8 | $ | 1.8 | $ | 7.9 | ||||||
|
State
|
0.8 | 0.6 | 1.8 | |||||||||
|
Foreign
|
7.0 | 7.1 | 14.1 | |||||||||
|
Total current
|
12.6 | 9.5 | 23.8 | |||||||||
|
Deferred:
|
||||||||||||
|
Increase (decrease) in the valuation allowance for deferred tax assets
|
0.2 | (1.1 | ) | (0.6 | ) | |||||||
|
Other deferred tax expense (benefit), net
|
8.6 | 7.7 | (0.8 | ) | ||||||||
|
Total deferred
|
8.8 | 6.6 | (1.4 | ) | ||||||||
|
Provision for income taxes
|
$ | 21.4 | $ | 16.1 | $ | 22.4 | ||||||
Significant components of our deferred tax assets and liabilities at December 31 were as follows:
|
(In millions)
|
2010
|
2009
|
||||||
|
Deferred tax assets attributable to:
|
||||||||
|
Accrued pension and and other postretirement benefits
|
$ | 21.9 | $ | 22.7 | ||||
|
Accrued expenses and accounts receivable allowances
|
13.4 | 14.6 | ||||||
|
Net operating loss carryforwards
|
6.3 | 6.6 | ||||||
|
Inventories
|
6.8 | 5.3 | ||||||
|
Stock-based compensation
|
4.4 | 4.0 | ||||||
|
Foreign tax credit carryforward
|
3.4 | 3.2 | ||||||
|
Deferred tax asset
|
56.2 | 56.4 | ||||||
|
Valuation allowance
|
(2.0 | ) | (2.1 | ) | ||||
|
Deferred tax assets, net of valuation allowance
|
54.2 | 54.3 | ||||||
|
Deferred tax liabilities attributable to:
|
||||||||
|
Liquidation of subsidiary for income tax purposes
|
13.3 | 13.3 | ||||||
|
Property, plant and equipment, goodwill and other assets
|
13.9 | 12.6 | ||||||
|
Foreign exchange
|
2.3 | 0.3 | ||||||
|
Deferred tax liabilities
|
29.5 | 26.2 | ||||||
|
Net deferred tax assets
|
$ | 24.7 | $ | 28.1 | ||||
Net operating loss carryforwards are related to our foreign operations. At December 31, 2010, we had $16.7 million of net operating losses that are available to offset future taxable income in several foreign jurisdictions indefinitely, and $6.7 million of net operating losses that are available to offset future taxable income through 2031. Foreign tax credit carryforwards of $3.3 million at December 31, 2010 will expire between 2015 and 2018 if unused.
Included in our deferred tax assets at December 31, 2010, are tax benefits related to accrued expenses and accounts receivable allowances. A portion of the accrued expenses and accounts receivable allowances are due to uncollectible accounts receivable of a foreign operation for which it is more likely than not that we will not be able to realize a tax benefit. Therefore, we continue to carry a valuation allowance against the related deferred tax assets.
The effective income tax rate was different from the statutory U.S. federal income tax rate due to the following:
|
(In millions)
|
2010
|
2009
|
2008
|
|||||||||
|
Statutory U.S. federal tax rate
|
35 | % | 35 | % | 35 | % | ||||||
|
Net difference resulting from:
|
||||||||||||
|
Foreign earnings subject to different tax rates
|
(2 | ) | (4 | ) | (3 | ) | ||||||
|
Nondeductible expenses
|
2 | 2 | 1 | |||||||||
|
State income taxes
|
3 | 2 | 2 | |||||||||
|
Foreign tax credits
|
(2 | ) | (2 | ) | (1 | ) | ||||||
|
Change in valuation allowance
|
- | (2 | ) | - | ||||||||
|
Other
|
- | 2 | - | |||||||||
|
Total difference
|
1 | (2 | ) | (1 | ) | |||||||
|
Effective income tax rate
|
36 | % | 33 | % | 34 | % | ||||||
50
U.S. income taxes have not been provided on $70.6 million of undistributed earnings of foreign subsidiaries at December 31, 2010 as these amounts are considered permanently invested. A liability could arise if our intention to permanently invest such earnings were to change and amounts are distributed by such subsidiaries or if such subsidiaries are ultimately disposed. It is not practicable to estimate the additional income taxes related to the hypothetical distribution of permanently invested earnings.
During 2010, we recorded $0.4 million in unrecognized tax benefits as a result of tax positions taken in prior years. We did not have any unrecognized tax benefits prior to 2010. The entire balance would affect the effective tax rate, if ultimately recognized, and is recorded in other liabilities in the consolidated balance sheet as resolution is not anticipated in the next 12 months. As of December 31, 2010, amounts related to interest and penalties were less than $0.1 million.
We are a party to a Tax Sharing Agreement with FMC Technologies whereby we have agreed to indemnify FMC Technologies for any additional tax liability resulting from JBT Corporation businesses. We are not aware of any additional tax liability.
The following tax years remain subject to examination in the following jurisdictions:
|
United States
|
2008 – 2010
|
|
|
Sweden
|
2005 – 2010
|
|
|
Brazil
|
2008 – 2010
|
NOTE 9. PENSION AND POSTRETIREMENT AND OTHER BENEFIT PLANS
We sponsor qualified and nonqualified defined benefit pension plans that together cover substantially all of our U.S. employees. The plans provide defined benefits based on years of service and final average salary. In addition, we sponsor postretirement health care and life insurance benefit plans that cover some of our U.S. employees. The postretirement health care plans are contributory while the postretirement life insurance plans are noncontributory. Foreign-based employees are eligible to participate in JBT Corporation-sponsored or government sponsored benefit plans to which we contribute. We also sponsor a separate defined contribution plan that covers substantially all of our U.S. employees.
Prior to the Separation, our employees were eligible to participate in pension and other postretirement benefit plans sponsored by FMC Technologies. Accordingly, we accounted for pension and other postretirement benefit costs prior to the Separation under the multiemployer plan approach, and have recognized the pension and other postretirement costs allocated to us by FMC Technologies as expense, and recorded a corresponding contribution in parent company investment. Pension and other postretirement benefit costs were allocated to us based on the projected benefit obligation associated with JBT Corporation-specific employees. In conjunction with the Separation, certain pension and other postemployment benefit obligations and plan assets related to our employees and retirees were contributed to us.
On September 15, 2009, we amended our domestic defined benefit pension plans to discontinue future benefit accruals for active non-union participants after December 31, 2009. Additionally, the domestic defined benefit pension plans were amended to freeze any future participation in such plans by non-union employees as of January 1, 2010.
As a result of the amendments to our domestic defined benefit pension plans, we recognized in 2009 a curtailment gain of $0.8 million to recognize all previously unrecognized prior service benefits. Additionally, as a result of discontinuing future benefit accruals for active non-union employees, our projected benefit obligation as of December 31, 2009 was reduced by $25.6 million.
The funded status of our U.S. qualified and nonqualified pension plans, certain foreign pension plans and U.S. postretirement health care and life insurance benefit plans, together with the associated balances recognized in our consolidated financial statements as of December 31, 2010 and 2009, were as follows:
51
|
Other
|
||||||||||||||||
|
postretirement
|
||||||||||||||||
|
Pensions
|
benefits
|
|||||||||||||||
|
(In millions)
|
2010
|
2009
|
2010
|
2009
|
||||||||||||
|
Accumulated benefit obligation
|
$ | 270.0 | $ | 245.1 | ||||||||||||
|
Projected benefit obligation at January 1
|
$ | 250.7 | $ | 252.9 | $ | 7.3 | $ | 7.4 | ||||||||
|
Service cost
|
1.3 | 8.4 | 0.1 | 0.1 | ||||||||||||
|
Interest cost
|
14.2 | 15.1 | 0.4 | 0.4 | ||||||||||||
|
Actuarial loss (gain)
|
20.8 | 8.4 | 0.3 | (0.1 | ) | |||||||||||
|
Curtailment of US pension plans
|
- | (25.6 | ) | - | - | |||||||||||
|
Settlements
|
(0.9 | ) | (1.3 | ) | - | - | ||||||||||
|
Special termination benefits
|
- | 0.2 | - | - | ||||||||||||
|
Plan participants' contributions
|
0.2 | 0.2 | - | - | ||||||||||||
|
Benefits paid
|
(11.1 | ) | (9.3 | ) | (0.4 | ) | (0.5 | ) | ||||||||
|
Currency translation adjustments
|
- | 1.7 | - | - | ||||||||||||
|
Projected benefit obligation at December 31
|
$ | 275.2 | $ | 250.7 | $ | 7.7 | $ | 7.3 | ||||||||
|
Fair value of plan assets at January 1
|
$ | 178.8 | $ | 139.1 | $ | - | $ | - | ||||||||
|
Company contributions
|
12.7 | 16.4 | 0.4 | 0.5 | ||||||||||||
|
Actual return on plan assets
|
28.4 | 32.9 | - | - | ||||||||||||
|
Plan participants' contributions
|
0.2 | 0.2 | - | - | ||||||||||||
|
Benefits paid
|
(11.9 | ) | (10.6 | ) | (0.4 | ) | (0.5 | ) | ||||||||
|
Currency translation adjustments
|
(0.7 | ) | 0.8 | - | - | |||||||||||
|
Fair value of plan assets at December 31
|
$ | 207.5 | $ | 178.8 | $ | - | $ | - | ||||||||
|
Funded status of the plans (liability) at December 31
|
$ | (67.7 | ) | $ | (71.9 | ) | $ | (7.7 | ) | $ | (7.3 | ) | ||||
|
Current portion of accrued pension and other postretirement benefits*
|
$ | (1.9 | ) | $ | (1.6 | ) | $ | (0.5 | ) | $ | (0.5 | ) | ||||
|
Accrued pension and other postretirement benefits, net of current portion
|
(65.8 | ) | (70.3 | ) | (7.2 | ) | (6.8 | ) | ||||||||
|
Funded status recognized in the consolidated balance sheet at December 31, 2010 and 2009
|
$ | (67.7 | ) | $ | (71.9 | ) | $ | (7.7 | ) | $ | (7.3 | ) | ||||
|
Amounts recognized in accumulated other comprehensive (income) loss:
|
||||||||||||||||
|
Unrecognized actuarial loss (gain)
|
$ | 82.8 | $ | 73.2 | $ | (0.1 | ) | $ | (0.4 | ) | ||||||
|
Unrecognized prior service cost (credit)
|
0.5 | 0.5 | (2.0 | ) | (2.9 | ) | ||||||||||
|
Accumulated other comprehensive loss (income) at December 31
|
$ | 83.3 | $ | 73.7 | $ | (2.1 | ) | $ | (3.3 | ) | ||||||
|
Plans with underfunded or non-funded projected benefit obligation:
|
||||||||||||||||
|
Aggregate projected benefit obligation
|
$ | 275.2 | $ | 250.7 | $ | 7.7 | $ | 7.3 | ||||||||
|
Aggregate fair value of plan assets
|
207.5 | 178.8 | - | - | ||||||||||||
|
Plans with underfunded or non-funded accumulated benefit obligation:
|
||||||||||||||||
|
Aggregate accumulated benefit obligation
|
$ | 270.0 | $ | 245.1 | ||||||||||||
|
Aggregate fair value of plan assets
|
207.5 | 178.8 | ||||||||||||||
* Included in other current liabilities in the consolidated balance sheets.
52
Pension and other postretirement benefit costs for the years ended December 31 were as follows:
|
Other postretirement
|
||||||||||||||||||||||||
|
Pensions
|
benefits
|
|||||||||||||||||||||||
|
(In millions)
|
2010
|
2009
|
2008
|
2010
|
2009
|
2008
|
||||||||||||||||||
|
Service cost
|
$ | 1.3 | $ | 8.4 | $ | 4.4 | $ | 0.1 | $ | 0.1 | $ | 0.1 | ||||||||||||
|
Interest cost
|
14.2 | 15.1 | 8.1 | 0.4 | 0.4 | 0.2 | ||||||||||||||||||
|
Expected return on plan assets
|
(18.2 | ) | (17.5 | ) | (9.1 | ) | - | - | - | |||||||||||||||
|
Curtailment gain
|
- | (0.8 | ) | - | - | - | - | |||||||||||||||||
|
Settlement charge
|
0.4 | 0.5 | - | - | - | - | ||||||||||||||||||
|
Special termination benefit charge
|
- | 0.2 | - | - | - | - | ||||||||||||||||||
|
Amortization of prior service credit
|
- | (0.1 | ) | - | (0.9 | ) | (0.9 | ) | (0.5 | ) | ||||||||||||||
|
Amortization of net actuarial loss (gain)
|
0.6 | 2.5 | 0.2 | - | - | (0.1 | ) | |||||||||||||||||
|
Pre-Separation allocation from FMC Technologies
|
- | - | 2.8 | - | - | (0.2 | ) | |||||||||||||||||
|
Total (income) costs
|
$ | (1.7 | ) | $ | 8.3 | $ | 6.4 | $ | (0.4 | ) | $ | (0.4 | ) | $ | (0.5 | ) | ||||||||
The following table presents the pre-tax net changes in projected benefit obligations and plan assets recognized in other comprehensive income during 2010:
|
Other postretirement
|
||||||||
|
(In millions)
|
Pensions
|
benefits
|
||||||
|
Actuarial loss arising during the year
|
$ | 10.6 | $ | 0.3 | ||||
|
Amortization of net actuarial loss
|
(1.0 | ) | - | |||||
|
Amortization of prior service credit
|
- | 0.9 | ||||||
|
Total loss recognized in other comprehensive loss
|
$ | 9.6 | $ | 1.2 | ||||
The estimated net actuarial loss for the defined benefit pension plans that will be amortized from accumulated other comprehensive income into net periodic benefit cost over the next fiscal year is $1.5 million. The estimated prior service credit for the other postretirement benefit plans that will be amortized from accumulated other comprehensive income into net periodic benefit cost over the next fiscal year is $0.9 million. Prior service credits are amortized on a straight-line basis over the average remaining service period of employees eligible to receive benefits under the plan. Unrecognized actuarial losses are amortized on a straight-line basis over the average remaining lifetime of employees eligible to receive benefits under the frozen plans and over the average remaining service period of employees eligible to receive benefits under all other plans.
Key assumptions – The following weighted-average assumptions were used to determine the benefit obligations:
| Other postretirement | ||||||||||||||||
|
Pensions
|
benefits
|
|||||||||||||||
|
2010
|
2009
|
2010
|
2009
|
|||||||||||||
|
Discount rate
|
5.31 | % | 5.80 | % | 5.45 | % | 6.00 | % | ||||||||
|
Rate of compensation increase
|
3.45 | % | 3.48 | % | - | - | ||||||||||
The following weighted-average assumptions were used to determine net periodic benefit cost:
|
Other postretirement
|
||||||||||||||||||||||||
|
Pensions
|
benefits
|
|||||||||||||||||||||||
|
2010
|
2009
|
2008
|
2010
|
2009
|
2008
|
|||||||||||||||||||
|
Discount rate
|
5.81 | % | 6.05 | % | 6.51 | % | 6.00 | % | 6.35 | % | 6.75 | % | ||||||||||||
|
Rate of compensation increase
|
3.45 | % | 3.94 | % | 3.94 | % | - | - | - | |||||||||||||||
|
Expected rate of return on plan assets
|
8.58 | % | 8.60 | % | 8.55 | % | - | - | - | |||||||||||||||
The estimate of expected rate of return on plan assets is based primarily on the historical performance of plan assets, current market conditions and long-term growth expectations.
Assumed health care cost trend rates for future periods will not have an effect on the amounts reported for the postretirement health care plan since our benefit obligation under the plan was fully capped at the 2002 benefit level. Accordingly, a one percentage point change in the assumed health care cost trend rates would not have a significant effect on total service and interest costs or on our postretirement health care obligation under this plan.
Plan assets – Our pension investment strategy balances the requirements to generate returns, using higher-returning assets such as equity securities, with the need to control risk in the pension plan with less volatile assets, such as fixed-income securities. Risks include, among others, the likelihood of the pension plans becoming underfunded, thereby increasing their dependence on Company contributions. The assets are managed by professional investment firms and performance is evaluated against specific benchmarks. Our target asset allocations and actual allocation as of December 31, 2010 and 2009 were as follows:
53
|
Target
|
2010
|
2009
|
||||||||||
|
Equity
|
30% - 70 | % | 49 | % | 69 | % | ||||||
|
Fixed income
|
20% - 40 | % | 28 | % | 17 | % | ||||||
|
Real estate and other
|
10% - 30 | % | 20 | % | 8 | % | ||||||
|
Cash
|
0% - 10 | % | 3 | % | 6 | % | ||||||
| 100 | % | 100 | % | 100 | % | |||||||
Our actual pension plans’ asset allocations by level within the fair value hierarchy are presented in the following table:
|
As of December 31, 2010
|
As of December 31, 2009
|
|||||||||||||||||||||||||||||||
|
(In millions)
|
Total
|
Level 1
|
Level 2
|
Level 3
|
Total
|
Level 1
|
Level 2
|
Level 3
|
||||||||||||||||||||||||
|
Cash and cash equivalents
|
$ | 6.8 | $ | 6.8 | $ | - | $ | - | $ | 11.9 | $ | 11.9 | $ | - | $ | - | ||||||||||||||||
|
Equity securities
|
||||||||||||||||||||||||||||||||
|
Large cap (1)
|
60.6 | - | 60.6 | - | 79.8 | 49.8 | 30.0 | - | ||||||||||||||||||||||||
|
Small cap (2)
|
40.1 | 40.1 | - | - | 43.7 | 43.7 | - | - | ||||||||||||||||||||||||
|
Fixed income securities
|
||||||||||||||||||||||||||||||||
|
Government securities (3)
|
36.4 | - | 36.4 | - | 15.4 | - | 15.4 | - | ||||||||||||||||||||||||
|
Corporate bonds (4)
|
22.3 | 5.4 | 16.9 | - | 14.4 | 8.4 | 6.0 | - | ||||||||||||||||||||||||
|
Real estate and other investments (5)
|
41.3 | 30.9 | 10.4 | - | 13.6 | 8.7 | 4.9 | - | ||||||||||||||||||||||||
|
Total assets at fair value
|
$ | 207.5 | $ | 83.2 | $ | 124.3 | $ | - | $ | 178.8 | $ | 122.5 | $ | 56.3 | $ | - | ||||||||||||||||
|
(1)
|
Includes large cap equity securities and funds that invest primarily in large cap equity securities.
|
|
(2)
|
Includes small cap equity securities and funds that invest primarily in small cap equity securities.
|
|
(3)
|
Includes U.S. government securities and funds that invest primarily in U.S. government bonds, including treasury inflation protected securities.
|
|
(4)
|
Includes investment grade bonds, high yield bonds and mortgage-backed fixed income securities and funds that invest in such securities.
|
|
(5)
|
Includes funds that invest primarily in REITs, funds that invest in commodities and investments in insurance contracts held by one of our foreign pension plans.
|
The fair value of assets classified as Level 1 is based on unadjusted quoted prices in active markets for identical assets. The fair value of assets classified as Level 2 is based on quoted prices for similar assets or based on inputs either directly or indirectly observable as of the reporting date. Such inputs include net asset values reported at a minimum on a monthly basis by investment funds or contract values provided by the issuing insurance company. We are able to sell any of our investment funds with notice of no more than 30 days. For more information on a description of the fair value hierarchy, see Note 14.
Contributions— We expect to contribute approximately $11.5 million to our pension and other postretirement benefit plans in 2011. The pension contributions will be primarily for the U.S. qualified pension plan. All of the contributions are expected to be in the form of cash.
Estimated future benefit payments— The following table summarizes expected benefit payments from our various pension and postretirement benefit plans through 2020. Actual benefit payments may differ from expected benefit payments.
|
Other postretirement
|
||||||||
|
(In millions)
|
Pensions
|
benefits
|
||||||
|
2011
|
$ | 11.6 | $ | 0.6 | ||||
|
2012
|
12.9 | 0.6 | ||||||
|
2013
|
13.4 | 0.6 | ||||||
|
2014
|
15.1 | 0.7 | ||||||
|
2015
|
14.6 | 0.7 | ||||||
|
2016-2020
|
82.3 | 3.4 | ||||||
Savings Plans— Our U.S. and some international employees participate in defined contribution savings plans that we sponsor. These plans generally provide either a specified percent of pay or a matching contribution on participants’ voluntary contributions. Additionally, certain highly compensated employees participate in a non-qualified deferred compensation plan, which also allows for company matching contributions up to predetermined limits. Prior to the Separation, our employees participated in similar plans sponsored by FMC Technologies. Expenses from the defined contribution savings plans prior to the Separation were allocated to us by FMC Technologies. The expense for matching contributions, including allocated amounts, was $8.2 million, $4.4 million and $4.5 million in 2010, 2009 and 2008, respectively. As of December 31, 2010 and 2009, we had investments classified as trading securities for a non-qualified deferred compensation plan totaling $9.8 million, recorded at their fair market value. We recorded unrealized gains on these investments of $1.0 million and $1.9 million for the years ended December 31, 2010 and 2009, respectively, which are reported in other (income) expense, net in the consolidated statements of income.
54
NOTE 10. STOCK-BASED COMPENSATION
We recorded stock-based compensation expense for the years ended December 31 as follows:
|
(In millions)
|
2010
|
2009
|
2008
|
|||||||||
|
Stock-based compensation expense
|
$ | 7.3 | $ | 7.9 | $ | 8.4 | ||||||
|
Tax benefit recorded in consolidated and combined statements of income
|
$ | 2.5 | $ | 2.6 | $ | 3.2 | ||||||
For the period prior to the Separation, stock-based compensation expense includes an allocation of expense for awards granted to FMC Technologies’ corporate employees and directors.
Incentive Compensation and Stock Plan
As part of the Separation, we adopted the John Bean Technologies Corporation Incentive Compensation and Stock Plan (“Incentive Compensation Plan”). The Incentive Compensation Plan provides certain incentives and awards to our officers, employees, directors and consultants. The Incentive Compensation Plan allows our Board of Directors (the “Board”) to make various types of awards to non-employee directors and the Compensation Committee (the “Committee”) of the Board to make various types of awards to other eligible individuals. Awards that may be issued include common stock, stock options, stock appreciation rights, restricted stock and stock units.
Grants of common stock options may be incentive and/or nonqualified stock options. Under the Incentive Compensation Plan, the exercise price for options cannot be less than the market value of our common stock at the date of grant. Options vest in accordance with the terms of the award as determined by the Committee, which is generally after three years of service, and expire not later than 10 years after the grant date. Restricted stock grants specify any applicable performance goals, the time and rate of vesting and such other provisions as determined by the Committee. Restricted stock grants generally vest after three years of service. Additionally, most awards vest immediately upon a change of control as defined in the Incentive Compensation Plan agreement. A total of 3.7 million shares of our common stock are authorized to be issued under the Incentive Compensation Plan.
Restricted Stock Units—A summary of the nonvested restricted stock units of JBT Corporation as of December 31, 2010 and changes during the year are presented below:
|
Weighted-Average
|
||||||||
|
Grant-Date
|
||||||||
|
Shares
|
Fair Value
|
|||||||
|
Nonvested at December 31, 2009
|
1,991,713 | $ | 10.22 | |||||
|
Granted
|
371,894 | $ | 16.75 | |||||
|
Vested
|
(743,864 | ) | $ | 7.90 | ||||
|
Forfeited
|
(31,560 | ) | $ | 12.05 | ||||
|
Nonvested at December 31, 2010
|
1,588,183 | $ | 12.81 | |||||
We granted time-based restricted stock units that vest after three years. The fair value of these time-based awards was determined using the market value of our common stock on the grant date. Compensation cost is recognized over the lesser of the stated vesting period or the period until the employee reaches age 62, the retirement eligible age under the plan. We also granted restricted stock units with performance-based conditions. The vesting period for these awards is three years.
For current year performance-based awards, the issuance was dependent upon our performance relative to prior year with respect to earnings growth and return on investment for the year ending December 31, 2010. Based on results for the performance period, the issuance will be 98,681 shares at the vesting date in January 2013. Compensation cost has been measured for 2010 based on the actual outcome of the performance conditions.
The weighted average grant-date fair value of restricted stock units granted in 2009 was $11.00.
Stock Options—We have not granted any stock options. Outstanding options held by employees prior to the Separation remain outstanding and are all exercisable. The following is a summary of the stock options held by our employees as of December 31, 2010:
55
|
Weighted-
|
||||||||||||||||
|
Weighted-
|
Average
|
|||||||||||||||
|
Shares
|
Average
|
Remaining
|
Aggregate
|
|||||||||||||
|
Under
|
Exercise
|
Contractual
|
Intrinsic
|
|||||||||||||
|
(Intrinsic value in millions)
|
Option
|
Price
|
Term (Years)
|
Value
|
||||||||||||
|
Outstanding and exercisable at December 31, 2009
|
107,289 | $ | 2.53 | 3.3 | $ | 1.6 | ||||||||||
|
Exercised
|
(33,303 | ) | $ | 2.18 | ||||||||||||
|
Outstanding and exercisable at December 31, 2010
|
73,986 | $ | 2.69 | 2.8 | $ | 1.3 | ||||||||||
The aggregate intrinsic value reflects the value to the option holders, or the difference between the market price as of December 31, 2010 and the exercise price of the option, which would have been received by the option holders had all options been exercised as of that date. While the intrinsic value is representative of the value to be gained by the option holders, this value is not indicative of our compensation expense. Compensation expense on stock options was calculated on the date of grant using the fair value of the options, as determined by a Black-Scholes option pricing model and the number of options granted, reduced by estimated forfeitures. The total intrinsic value of options exercised was $0.5 million in 2010 and $0.9 million in 2009.
As of December 31, 2010, there was $5.6 million of unrecognized stock-based compensation expense for outstanding awards expected to be recognized over a weighted average period of 1.7 years.
NOTE 11. STOCKHOLDERS’ EQUITY
Capital stock—The following is a summary of our capital stock activity for the year ended on December 31, 2010:
|
Common
|
||||||||
|
Common
|
stock held in
|
|||||||
|
stock issued
|
treasury
|
|||||||
|
December 31, 2009
|
27,663,335 | 52,142 | ||||||
|
Options exercised
|
32,606 | (697 | ) | |||||
|
Stock awards
|
541,338 | - | ||||||
|
December 31, 2010
|
28,237,279 | 51,445 | ||||||
Treasury shares are accounted for using the cost method and are used for issuances under the Incentive Compensation Plan.
On July 31, 2008, our Board declared a dividend distribution to each recordholder of common stock of one Preferred Share Purchase Right for each share of common stock outstanding on that date. Each right entitles the holder to purchase, under certain circumstances related to a change in control of the Company, one one-hundredth of a share of Series A Junior Participating Preferred Stock, par value $0.01, at a price of $72 per share (subject to adjustment), subject to the terms and conditions of a Rights Agreement dated July 31, 2008. The rights expire on July 31, 2018, unless redeemed by us at an earlier date. The redemption price of $0.01 per right is subject to adjustment to reflect stock splits, stock dividends or similar transactions. We have reserved 1,500,000 shares of Series A Junior Participating Preferred Stock for possible issuance under the agreement.
Accumulated other comprehensive loss—Accumulated other comprehensive loss as of December 31 consisted of the following:
|
(In millions)
|
2010
|
2009
|
||||||
|
Cumulative foreign currency translation adjustments
|
$ | 11.1 | $ | 8.0 | ||||
|
Cumulative deferral of hedging net losses, net of tax of $0.3 in 2010 and 2009
|
(0.4 | ) | (0.5 | ) | ||||
|
Cumulative deferral of pension net losses, net of tax of $31.2 in 2010 and $26.9 in 2009
|
(50.0 | ) | (43.5 | ) | ||||
|
Accumulated other comprehensive loss
|
$ | (39.3 | ) | $ | (36.0 | ) | ||
NOTE 12. EARNINGS PER SHARE
Basic earnings per share (“EPS”) is computed by dividing net income by the weighted average number of common shares outstanding for the period. Diluted EPS reflects the assumed conversion of all dilutive securities.
As discussed in Note 1, in connection with the Separation, on July 31, 2008 FMC Technologies distributed to its shareholders 27.5 million shares of our common stock. This share amount is being utilized for the calculation of basic and diluted EPS for all periods presented prior to the Separation as our common stock was not traded prior to July 31, 2008, and there were no dilutive securities in the prior periods.
The following table sets forth the computation of basic and diluted EPS utilizing the income from continuing operations for the respective periods and our basic and dilutive shares outstanding:
56
|
(In millions, except per share data)
|
2010
|
2009
|
2008
|
|||||||||
|
Basic earnings per share:
|
||||||||||||
|
Income from continuing operations
|
$ | 37.9 | $ | 32.8 | $ | 44.1 | ||||||
|
Weighted average number of shares outstanding
|
28.3 | 27.6 | 27.5 | |||||||||
|
Basic earnings per share from continuing operations
|
$ | 1.34 | $ | 1.19 | $ | 1.60 | ||||||
|
Diluted earnings per share:
|
||||||||||||
|
Income from continuing operations
|
$ | 37.9 | $ | 32.8 | $ | 44.1 | ||||||
|
Weighted average number of shares outstanding
|
28.3 | 27.6 | 27.5 | |||||||||
|
Effect of dilutive securities:
|
||||||||||||
|
Options on common stock
|
0.0 | 0.1 | 0.1 | |||||||||
|
Restricted stock
|
0.8 | 0.9 | 0.2 | |||||||||
|
Total shares and dilutive securities
|
29.1 | 28.6 | 27.8 | |||||||||
|
Diluted earnings per share from continuing operations
|
$ | 1.30 | $ | 1.15 | $ | 1.59 | ||||||
NOTE 13. DERIVATIVE FINANCIAL INSTRUMENTS AND CREDIT RISK
Derivative financial instruments— We hold derivative financial instruments for the purpose of hedging foreign currency risks and interest rate risks of certain identifiable and anticipated transactions.
We manufacture and sell our products in a number of countries throughout the world and, as a result, are exposed to movements in foreign currency exchange rates. Our major foreign currency exposures involve the markets in Western Europe, South America and Asia. The purpose of our foreign currency hedging activities is to manage the economic impact of exchange rate volatility associated with anticipated foreign currency purchases and sales created in the normal course of business. We primarily utilize forward exchange contracts with maturities of less than 2 years. As of December 31, 2010, we held forward exchange contracts with an aggregate notional value of $319.0 million. Many of our sales and purchase contracts are written contemplating this risk and therefore contain embedded derivatives, which we consider part of our risk management policy.
Additionally, we have entered into an interest rate swap to hedge a portion of our variable rate debt described in Note 7.
Our policy is to hold derivatives only for the purpose of hedging risks and not for trading purposes where the objective is solely to generate profit. Generally, we enter into hedging relationships such that changes in the fair values or cash flows of items and transactions being hedged are expected to be offset by corresponding changes in the fair value of the derivatives.
The following table presents the fair value of derivative instruments included within the consolidated balance sheets:
|
As of December 31, 2010
|
As of December 31, 2009
|
|||||||||||||||
|
(In millions)
|
Asset
Derivatives (1)
|
Liability
Derivatives (2)
|
Asset
Derivatives (1)
|
Liability
Derivatives (2)
|
||||||||||||
|
Derivatives designated as hedging instruments:
|
||||||||||||||||
|
Interest rate swap contract
|
$ | - | $ | 0.2 | $ | - | $ | 1.2 | ||||||||
|
Foreign exchange contracts
|
- | 0.4 | 0.1 | - | ||||||||||||
|
Total derivatives designated as hedging instruments
|
- | 0.6 | 0.1 | 1.2 | ||||||||||||
|
Derivatives not designated as hedging instruments:
|
||||||||||||||||
|
Foreign exchange contracts
|
11.9 | 8.2 | 5.4 | 7.7 | ||||||||||||
|
Total derivatives not designated as hedging instruments
|
$ | 11.9 | $ | 8.2 | $ | 5.4 | $ | 7.7 | ||||||||
|
(1)
|
Included in other current assets and other assets in the consolidated balance sheets.
|
|
(2)
|
Included in other current liabilities and other liabilities in the consolidated balance sheets.
|
Refer to Note 14: Fair Value of Financial Instruments for a description of how financial instruments are valued.
57
The following table presents the effective portion of the gains and losses on derivative instruments affecting the consolidated statements of income:
|
Derivatives designated as cash flow hedges
|
Amount of Gain (Loss)
Recognized in OCI on Derivatives (1)
|
Location of Gain (Loss)
Reclassified from AOCI
into Income
|
Amount of Gain (Loss)
Reclassified from AOCI into Income (1)
|
||||||||||||||
|
(In millions)
|
2010
|
2009
|
2010
|
2009
|
|||||||||||||
|
Interest rate swap contract
|
$ | (0.1 | ) | $ | (1.0 | ) |
Net interest expense
|
$ | (0.7 | ) | $ | (1.4 | ) | ||||
|
Foreign exchange contracts
|
(0.4 | ) | 0.6 |
Revenue
|
- | (1.4 | ) | ||||||||||
|
Total
|
$ | (0.5 | ) | $ | (0.4 | ) | $ | (0.7 | ) | $ | (2.8 | ) | |||||
|
(1)
|
For the years ended December 31, 2010 and 2009, we recorded in other (expense) income, net an immaterial amount of ineffectiveness from cash flow hedges.
|
As of December 31, 2010, we do not expect to reclassify a significant amount from accumulated other comprehensive loss into earnings within the next 12 months. All forecasted transactions currently being hedged are expected to occur by 2013.
The following table presents the location and gain (loss) on derivatives, remeasurement of assets and liabilities in foreign currencies and net impact recognized in the consolidated statements of income:
|
Derivatives not designated as
hedging instruments under FAS 133
|
Location of Gain (Loss)
Recognized in Income on Derivatives
|
Amount of Gain (Loss)
Recognized in Income on Derivatives
|
|||||||||
|
(In millions)
|
2010
|
2009
|
|||||||||
|
Foreign exchange contracts
|
Revenue
|
$ | 12.2 | $ | 8.6 | ||||||
|
Foreign exchange contracts
|
Cost of sales
|
(1.6 | ) | (1.2 | ) | ||||||
|
Foreign exchange contracts
|
Other income (expense), net
|
0.3 | 0.5 | ||||||||
|
Total
|
10.9 | 7.9 | |||||||||
|
Remeasurement of assets and liabilities in foreign currencies
|
(3.2 | ) | (1.6 | ) | |||||||
|
Net gain on foreign currency transactions
|
$ | 7.7 | $ | 6.3 | |||||||
In the year ended December 31, 2008, we recorded a loss of $5.8 million related to foreign currency transactions, net of remeasurement of assets and liabilities, for instruments not designated as hedging instruments.
Credit risk — By their nature, financial instruments involve risk including credit risk for non-performance by counterparties. Financial instruments that potentially subject us to credit risk primarily consist of trade receivables and derivative contracts. We manage the credit risk on financial instruments by transacting only with financially secure counterparties, requiring credit approvals and credit limits, and monitoring counterparties’ financial condition. Our maximum exposure to credit loss in the event of non-performance by the counterparty is limited to the amount drawn and outstanding on the financial instrument. Allowances for losses are established based on collectibility assessments.
NOTE 14. FAIR VALUE OF FINANCIAL INSTRUMENTS
The fair value framework requires the categorization of assets and liabilities into a three level hierarchy based upon the assumptions (inputs) used to price the assets or liabilities. Level 1 provides the most reliable measure of fair value, whereas Level 3 generally requires significant management judgment. The three levels are defined as follows:
|
|
•
|
Level 1: Unadjusted quoted prices in active markets for identical assets and liabilities.
|
|
|
•
|
Level 2: Observable inputs other than those included in Level 1. For example, quoted prices for similar assets or liabilities in active markets or quoted prices for identical assets or liabilities in inactive markets.
|
|
|
•
|
Level 3: Unobservable inputs reflecting management’s own assumptions about the inputs used in pricing the asset or liability.
|
58
Financial assets and financial liabilities measured at fair value on a recurring basis are as follows:
|
As of December 31, 2010
|
As of December 31, 2009
|
|||||||||||||||||||||||||||||||
|
(In millions)
|
Total
|
Level 1
|
Level 2
|
Level 3
|
Total
|
Level 1
|
Level 2
|
Level 3
|
||||||||||||||||||||||||
|
Assets:
|
||||||||||||||||||||||||||||||||
|
Investments
|
$ | 9.9 | $ | 9.9 | $ | - | $ | - | $ | 10.9 | $ | 10.9 | $ | - | $ | - | ||||||||||||||||
|
Derivatives
|
11.9 | - | 11.9 | - | 5.5 | - | 5.5 | - | ||||||||||||||||||||||||
|
Total assets
|
$ | 21.8 | $ | 9.9 | $ | 11.9 | $ | - | $ | 16.4 | $ | 10.9 | $ | 5.5 | $ | - | ||||||||||||||||
|
Liabilities:
|
||||||||||||||||||||||||||||||||
|
Derivatives
|
$ | 8.8 | $ | - | $ | 8.8 | $ | - | $ | 8.9 | $ | - | $ | 8.9 | $ | - | ||||||||||||||||
Investments are valued based on quoted prices in active markets for identical assets or liabilities that we have the ability to access. We use the income approach to measure the fair value of derivative instruments on a recurring basis. This approach calculates the present value of the future cash flow by measuring the change from the derivative contract rate and the published market indicative currency and interest rates, multiplied by the contract notional values, and includes a factor of credit risk.
In addition to the methods and assumptions we use for the financial instruments recorded at fair value as discussed above, we used the following methods and assumptions to estimate the fair value for our other financial instruments which are not marked to market on a recurring basis. The carrying amounts of cash and cash equivalents, trade receivables and accounts payable, as well as amounts included in other current assets and other current liabilities that meet the definition of financial instruments, approximate fair values because of their short-term maturities.
The following are carrying values and estimated fair values of our debt financial instruments as of December 31:
|
2010
|
2009
|
|||||||||||||||
|
(In millions)
|
Carrying
Value
|
Estimated
Fair Value
|
Carrying
Value
|
Estimated
Fair Value
|
||||||||||||
|
6.66% senior unsecured notes due July 31, 2015
|
$ | 75.0 | $ | 84.8 | $ | 75.0 | $ | 83.8 | ||||||||
|
Revolving credit facility, due 2013
|
68.7 | 68.7 | 56.8 | 56.8 | ||||||||||||
|
4.5% Brazilian Real loan due December 31, 2012
|
3.2 | 2.8 | - | - | ||||||||||||
|
Other
|
0.2 | 0.2 | 0.4 | 0.4 | ||||||||||||
There is no active or observable market for our senior unsecured notes or our Brazilian Real loan. Therefore, the estimated fair value of the notes and the loan are based on discounted cash flows using current interest rates available for debt with similar terms and remaining maturities. The estimate of the all-in interest rate for discounting the notes and the loan are based on a broker quote for notes and a loan with similar terms. We do not have a rate adjustment for risk profile changes, covenant issues or credit rating changes, therefore the broker quote is deemed to be the closest approximation of current market rates. The carrying value of the remaining borrowings approximates their fair value due to their variable interest rates.
NOTE 15. TRANSACTIONS WITH FMC TECHNOLOGIES
Results of operations for the year ended December 31, 2008 include $12.6 million of allocations from FMC Technologies for providing us with the following services prior to the Separation: legal, tax, general accounting, communications, corporate development, benefits and human resources, information systems, payroll services, web hosting services and other public company costs.
In connection with our Separation from FMC Technologies, we entered into a separation and distribution agreement with FMC Technologies (the “Separation and Distribution Agreement”) and several ancillary agreements to complete the separation of our businesses from FMC Technologies. These agreements defined key provisions related to the Separation and the relationship between the two companies after the Separation.
NOTE 16. COMMITMENTS AND CONTINGENCIES
We are involved in legal proceedings arising in the ordinary course of business. Although the results of litigation cannot be predicted with certainty, we do not believe that the resolution of the proceedings that we are involved in, either individually or taken as a whole, will have a material adverse effect on our business, results of operations or financial condition.
59
Under the Separation and Distribution Agreement with FMC Technologies, we have assumed liabilities related to legal proceedings arising from our business prior to the Separation. As a result, although FMC Technologies will remain the named defendant, we will manage the litigation and indemnify FMC Technologies for costs, expenses and judgments arising from litigation. We do not believe that resolution of any existing litigation we have assumed will have a material effect on our results of operations, financial condition or liquidity.
Guarantees and Product Warranties—In the ordinary course of business with customers, vendors and others, we issue standby letters of credit, performance bonds, surety bonds and other guarantees. These financial instruments, which totaled approximately $94.5 million at December 31, 2010, represent guarantees of our future performance. We also have provided approximately $11.6 million of bank guarantees and letters of credit to secure a portion of our existing financial obligations. The majority of these financial instruments expire within two years; we expect to replace them through the issuance of new or the extension of existing letters of credit and surety bonds. In some instances, we guarantee a small portion of our customers’ financing arrangements and retain recourse to the equipment sold. As of December 31, 2010, the maximum future payment obligation of such guarantees was $1.3 million and the associated liability balance was $0.3 million. Historically, we have not made significant payments associated with guarantees of our customers’ financing arrangements.
We provide warranties of various lengths and terms to certain of our customers based on standard terms and conditions and negotiated agreements. We provide for the estimated cost of warranties at the time revenue is recognized for products where reliable, historical experience of warranty claims and costs exists. We also provide a warranty liability when additional specific obligations are identified. The obligation reflected in other current liabilities in the balance sheets is based on historical experience by product and considers failure rates and the related costs in correcting a product failure. Warranty cost and accrual information is as follows:
|
(In millions)
|
2010
|
2009
|
||||||
|
Balance at beginning of year
|
$ | 7.3 | $ | 9.8 | ||||
|
Expenses for new warranties
|
8.0 | 8.9 | ||||||
|
Adjustments to existing accruals
|
(0.1 | ) | (0.9 | ) | ||||
|
Claims paid
|
(7.2 | ) | (10.5 | ) | ||||
|
Balance at end of year
|
$ | 8.0 | $ | 7.3 | ||||
Leases—We lease office space, manufacturing facilities and various types of manufacturing and data processing equipment. Leases of real estate generally provide that we pay for repairs, property taxes and insurance. Substantially all leases are classified as operating leases for accounting purposes. Rent expense under operating leases amounted to $10.1 million, $8.6 million and $9.3 million in 2010, 2009 and 2008, respectively.
Future minimum lease payments under non-cancelable operating leases as of December 31, 2010, for the following fiscal years were:
|
(In millions)
|
Total
Amount
|
2011
|
2012
|
2013
|
2014
|
2015
|
After
2015
|
|||||||||||||||||||||
|
Operating lease obligations
|
$ | 16.4 | $ | 4.9 | $ | 4.1 | $ | 2.9 | $ | 2.1 | $ | 2.0 | $ | 0.4 | ||||||||||||||
Minimum future rental payments to be received under non-cancelable subleases totaled $1.3 million at December 31, 2010.
NOTE 17. BUSINESS SEGMENTS
Our determination of the two reportable segments was made on the basis of the Company’s strategic business units and the commonalities among the products and services within each segment, and corresponds to the manner in which management reviews and evaluates operating performance. Certain similar operating segments that meet applicable criteria established in the guidance for segment reporting have been combined.
Our reportable segments are:
|
•
|
JBT FoodTech—designs, manufactures and services technologically sophisticated food processing systems used for, among other things, fruit juice production, frozen food production, in-container food production and convenience food preparation by the food industry.
|
|
•
|
JBT AeroTech—designs, manufactures and services technologically sophisticated ground support equipment, airport gate equipment, automated systems and services for airport authorities, airlines, airfreight, ground handling companies, the military and other industries.
|
60
Total revenue by segment includes intersegment sales, which are made at prices that reflect, as nearly as practicable, the market value of the transaction. Segment operating profit is defined as total segment revenue less segment operating expenses. The following items have been excluded in computing segment operating profit: corporate staff expense, foreign currency related gains and losses, LIFO provisions, restructuring costs, certain employee benefit expenses, interest income and expense and income taxes. During the fourth quarter of 2010, we changed the method we use to measure segment operating profit by excluding restructuring costs. As a result, all prior year measurements of segment operating profit have been restated for comparative purposes.
Segment revenue and segment operating profit
|
(In millions)
|
2010
|
2009
|
2008
|
|||||||||
|
Revenue
|
||||||||||||
|
JBT FoodTech
|
$ | 520.8 | $ | 515.8 | $ | 584.0 | ||||||
|
JBT AeroTech
|
351.2 | 320.7 | 446.9 | |||||||||
|
Other revenue (1) and intercompany eliminations
|
8.4 | 5.1 | (2.8 | ) | ||||||||
|
Total revenue
|
$ | 880.4 | $ | 841.6 | $ | 1,028.1 | ||||||
|
Income before income taxes
|
||||||||||||
|
Segment operating profit:
|
||||||||||||
|
JBT FoodTech
|
$ | 55.8 | $ | 52.4 | $ | 61.1 | ||||||
|
JBT AeroTech
|
28.6 | 27.2 | 38.5 | |||||||||
|
Total segment operating profit
|
84.4 | 79.6 | 99.6 | |||||||||
|
Corporate items:
|
||||||||||||
|
Corporate expense (2)
|
(17.3 | ) | (15.4 | ) | (15.0 | ) | ||||||
|
Other expense, net (1)
|
- | (6.5 | ) | (14.3 | ) | |||||||
|
Net interest expense
|
(7.8 | ) | (8.8 | ) | (3.8 | ) | ||||||
|
Total corporate items
|
(25.1 | ) | (30.7 | ) | (33.1 | ) | ||||||
|
Income from continuing operations before income taxes
|
59.3 | 48.9 | 66.5 | |||||||||
|
Provision for income taxes
|
21.4 | 16.1 | 22.4 | |||||||||
|
Income from continuing operations
|
37.9 | 32.8 | 44.1 | |||||||||
|
(Loss) gain from discontinued operations, net of income taxes
|
(0.6 | ) | - | 0.1 | ||||||||
|
Net income
|
$ | 37.3 | $ | 32.8 | $ | 44.2 | ||||||
|
(1)
|
Other revenue comprises certain gains and losses on derivatives related to foreign exchange exposure. Other expense, net, generally includes stock-based compensation, other employee benefits, LIFO adjustments, restructuring costs, foreign exchange gains and losses, and the impact of unusual or strategic transactions not representative of segment operations. Restructuring costs included in other expense, net were:
|
|
(in millions)
|
2010
|
2009
|
2008
|
|||||||||
|
JBT FoodTech
|
$ | 0.8 | $ | 1.8 | $ | 0.9 | ||||||
|
JBT AeroTech
|
2.9 | 2.1 | - | |||||||||
|
Total
|
$ | 3.7 | $ | 3.9 | $ | 0.9 | ||||||
|
(2)
|
Corporate expense primarily includes corporate staff expenses.
|
61
Segment operating capital employed and segment assets
|
(In millions)
|
2010
|
2009
|
||||||
|
Segment operating capital employed (1):
|
||||||||
|
JBT FoodTech
|
$ | 194.9 | $ | 186.6 | ||||
|
JBT AeroTech
|
142.3 | 109.6 | ||||||
|
Total segment operating capital employed
|
337.2 | 296.2 | ||||||
|
Segment liabilities included in total segment operating capital employed (2)
|
213.2 | 197.1 | ||||||
|
Corporate (3)
|
31.8 | 27.1 | ||||||
|
Total assets
|
$ | 582.2 | $ | 520.4 | ||||
|
Segment assets:
|
||||||||
|
JBT FoodTech
|
$ | 343.8 | $ | 333.5 | ||||
|
JBT AeroTech
|
207.3 | 160.5 | ||||||
|
Intercompany eliminations
|
(0.7 | ) | (0.7 | ) | ||||
|
Total segment assets
|
550.4 | 493.3 | ||||||
|
Corporate (3)
|
31.8 | 27.1 | ||||||
|
Total assets
|
$ | 582.2 | $ | 520.4 | ||||
|
(1)
|
Management views segment operating capital employed, which consists of assets, net of its liabilities, as the primary measure of segment capital. Segment operating capital employed excludes debt, pension liabilities, income taxes and LIFO inventory reserves.
|
|
(2)
|
Segment liabilities included in total segment operating capital employed consist of trade and other accounts payable, advance progress payments, accrued payroll and other liabilities.
|
|
(3)
|
Corporate includes cash, LIFO inventory reserves, deferred income tax balances, derivatives, investments, property, plant and equipment not associated with a specific segment and pension assets.
|
Geographic segment information
Geographic segment sales were identified based on the location where our products and services were delivered. Geographic segment long-lived assets include investments; property, plant and equipment, net; goodwill; intangible assets, net; and certain other non-current assets.
|
(In millions)
|
2010
|
2009
|
2008
|
|||||||||
|
Revenue (by location of customers):
|
||||||||||||
|
United States
|
$ | 445.1 | $ | 412.5 | $ | 485.5 | ||||||
|
All other countries
|
435.3 | 429.1 | 542.6 | |||||||||
| Total revenue | $ | 880.4 | $ | 841.6 | $ | 1,028.1 | ||||||
|
(In millions)
|
2010
|
2009
|
2008
|
|||||||||
|
Long-lived assets:
|
||||||||||||
|
United States
|
$ | 114.4 | $ | 112.1 | $ | 109.4 | ||||||
|
Sweden
|
20.1 | 20.0 | 18.7 | |||||||||
|
Brazil
|
19.0 | 19.8 | 16.2 | |||||||||
|
All other countries
|
39.5 | 41.9 | 34.2 | |||||||||
| Total long-lived assets | $ | 193.0 | $ | 193.8 | $ | 178.5 | ||||||
Other business segment information
|
Research and
|
||||||||||||||||||||||||||||||||||||
|
Capital Expenditures
|
Depreciation and Amortization
|
Development Expense
|
||||||||||||||||||||||||||||||||||
|
(In millions)
|
2010
|
2009
|
2008
|
2010
|
2009
|
2008
|
2010
|
2009
|
2008
|
|||||||||||||||||||||||||||
|
JBT FoodTech
|
$ | 19.5 | $ | 17.9 | $ | 19.4 | $ | 19.1 | $ | 19.0 | $ | 22.6 | $ | 11.4 | $ | 10.1 | $ | 13.4 | ||||||||||||||||||
|
JBT AeroTech
|
1.0 | 1.4 | 2.5 | 2.9 | 2.9 | 2.4 | 6.1 | 7.0 | 8.6 | |||||||||||||||||||||||||||
|
Corporate
|
3.8 | 0.5 | 1.0 | 0.9 | 0.7 | 0.5 | - | - | - | |||||||||||||||||||||||||||
|
Total
|
$ | 24.3 | $ | 19.8 | $ | 22.9 | $ | 22.9 | $ | 22.6 | $ | 25.5 | $ | 17.5 | $ | 17.1 | $ | 22.0 | ||||||||||||||||||
62
NOTE 18. QUARTERLY INFORMATION (UNAUDITED)
|
(In millions, except per share data
|
2010
|
2009
|
||||||||||||||||||||||||||||||
|
and common stock prices)
|
4th Qtr.
|
3rd Qtr.
|
2nd Qtr.
|
1st Qtr.
|
4th Qtr.
|
3rd Qtr.
|
2nd Qtr.
|
1st Qtr.
|
||||||||||||||||||||||||
|
Revenue
|
$ | 286.6 | $ | 216.5 | $ | 208.3 | $ | 169.0 | $ | 246.0 | $ | 196.4 | $ | 230.2 | $ | 169.0 | ||||||||||||||||
|
Cost of sales
|
213.2 | 160.3 | 153.9 | 122.1 | 185.5 | 142.4 | 171.2 | 122.1 | ||||||||||||||||||||||||
|
Income from continuing operations
|
16.4 | 9.4 | 8.2 | 3.9 | 10.6 | 8.4 | 9.7 | 4.1 | ||||||||||||||||||||||||
|
(Loss) income from discontinued
|
||||||||||||||||||||||||||||||||
|
operations, net of tax
|
(0.6 | ) | - | (0.1 | ) | 0.1 | 0.1 | (0.1 | ) | - | - | |||||||||||||||||||||
|
Net income
|
$ | 15.8 | $ | 9.4 | $ | 8.1 | $ | 4.0 | $ | 10.7 | $ | 8.3 | $ | 9.7 | $ | 4.1 | ||||||||||||||||
|
Basic earnings per share:
|
||||||||||||||||||||||||||||||||
|
Income from continuing operations
|
$ | 0.58 | $ | 0.33 | $ | 0.29 | $ | 0.14 | $ | 0.39 | $ | 0.30 | $ | 0.35 | $ | 0.15 | ||||||||||||||||
|
Loss from discontinued operations,
net of tax
|
(0.02 | ) | - | - | - | - | - | - | - | |||||||||||||||||||||||
|
Net income
|
$ | 0.56 | $ | 0.33 | $ | 0.29 | $ | 0.14 | $ | 0.39 | $ | 0.30 | $ | 0.35 | $ | 0.15 | ||||||||||||||||
|
Diluted earnings per share:
|
||||||||||||||||||||||||||||||||
|
Income from continuing operations
|
$ | 0.56 | $ | 0.32 | $ | 0.28 | $ | 0.14 | $ | 0.37 | $ | 0.29 | $ | 0.34 | $ | 0.15 | ||||||||||||||||
|
Loss from discontinued operations,
net of tax |
(0.02 | ) | - | - | - | - | - | - | - | |||||||||||||||||||||||
|
Net income
|
$ | 0.54 | $ | 0.32 | $ | 0.28 | $ | 0.14 | $ | 0.37 | $ | 0.29 | $ | 0.34 | $ | 0.15 | ||||||||||||||||
|
Weighted average shares outstanding
|
||||||||||||||||||||||||||||||||
|
Basic (1)
|
28.3 | 28.3 | 28.2 | 28.2 | 27.7 | 27.7 | 27.6 | 27.5 | ||||||||||||||||||||||||
|
Diluted (1)
|
29.3 | 29.2 | 29.1 | 29.0 | 28.9 | 28.7 | 28.5 | 28.2 | ||||||||||||||||||||||||
|
Common stock price
|
||||||||||||||||||||||||||||||||
|
High
|
$ | 20.78 | $ | 16.62 | $ | 19.11 | $ | 18.49 | $ | 18.75 | $ | 19.00 | $ | 14.92 | $ | 11.47 | ||||||||||||||||
|
Low
|
$ | 16.07 | $ | 14.35 | $ | 15.12 | $ | 15.41 | $ | 16.01 | $ | 11.54 | $ | 9.63 | $ | 8.67 | ||||||||||||||||
|
(1)
|
Basic and diluted EPS are computed independently for each of the periods presented. Accordingly, the sum of the quarterly EPS amounts may not agree to the annual total.
|
NOTE 19. SUBSEQUENT EVENTS
On February 23, 2011, the Board of Directors approved a quarterly cash dividend of $0.07 per share of outstanding common stock. The dividend will be paid on March 25, 2011 to stockholders of record at the close of business on March 4, 2011.
63
Report of Independent Registered Public Accounting Firm
The Board of Directors and Stockholders
John Bean Technologies Corporation:
Under the date of March 3, 2011, we reported on the consolidated balance sheets of John Bean Technologies Corporation and subsidiaries as of December 31, 2010 and 2009, and the related consolidated and combined statements of income, changes in stockholders’ equity, and cash flows for each of the years in the three-year period ended December 31, 2010, which are included in the annual report on Form 10-K. In connection with our audits of the aforementioned consolidated and combined financial statements, we also audited the related consolidated and combined financial statement schedule, Schedule II – Valuation and Qualifying Accounts. This financial statement schedule is the responsibility of the Company’s management. Our responsibility is to express an opinion on this financial statement schedule based on our audits.
In our opinion, such financial statement schedule, when considered in relation to the basic consolidated and combined financial statements taken as a whole, presents fairly, in all material respects, the information set forth therein.
/s/ KPMG LLP
Chicago, Illinois
March 3, 2011
64
Schedule II—Valuation and Qualifying Accounts
|
(In thousands)
|
Additions
|
|||||||||||||||||||
|
Decription
|
Balance at
beginning
of period
|
charged to
costs and
expenses
|
charged to
other accounts (a)
|
Deductions
and other (b)
|
Balance at
end of period
|
|||||||||||||||
|
Year ended December 31, 2008:
|
||||||||||||||||||||
|
Allowance for doubtful accounts
|
$ | 6,200 | $ | 1,200 | $ | 1,148 | $ | 3,506 | $ | 5,042 | ||||||||||
|
Valuation allowance for deferred
|
||||||||||||||||||||
|
tax asset
|
$ | 3,838 | $ | - | $ | - | $ | 659 | $ | 3,179 | ||||||||||
|
Year ended December 31, 2009:
|
||||||||||||||||||||
|
Allowance for doubtful accounts
|
$ | 5,042 | $ | 1,490 | $ | 175 | $ | 1,629 | $ | 5,078 | ||||||||||
|
Valuation allowance for deferred
|
||||||||||||||||||||
|
tax asset
|
$ | 3,179 | $ | - | $ | - | $ | 1,091 | $ | 2,088 | ||||||||||
|
Year ended December 31, 2010:
|
||||||||||||||||||||
|
Allowance for doubtful accounts
|
$ | 5,078 | $ | 984 | $ | (79 | ) | $ | 1,180 | $ | 4,803 | |||||||||
|
Valuation allowance for deferred
|
||||||||||||||||||||
|
tax asset
|
$ | 2,088 | $ | 221 | $ | - | $ | 281 | $ | 2,028 | ||||||||||
(a) – “Additions charged to other accounts” includes translation adjustments and allowances acquired through business combinations.
(b) – “Deductions and other” includes translation adjustments, write-offs, net of recoveries, and reductions in the allowances credited to expense.
See accompanying Report of Independent Registered Public Accounting Firm.
65
|
ITEM 9.
|
CHANGES IN AND DISAGREEMENTS WITH ACCOUNTANTS ON ACCOUNTING AND FINANCIAL DISCLOSURE
|
None.
|
ITEM 9A.
|
CONTROLS AND PROCEDURES
|
|
(a)
|
Disclosure Controls and Procedures. As of the end of the period covered by this Annual Report on Form 10-K, we carried out an evaluation of the effectiveness of the design and operation of our disclosure controls and procedures. Based upon that evaluation, our Chief Executive Officer and Chief Financial Officer concluded that our disclosure controls and procedures were effective to ensure that information required to be disclosed by us in reports we file or submit under the Exchange Act is (1) recorded, processed, summarized and reported within the time periods specified in SEC rules and forms, and (2) accumulated and communicated to our management, including our Chief Executive Officer and Chief Financial Officer, to allow timely decisions regarding required disclosure.
|
|
(b)
|
Management’s Annual Report on Internal Control over Financial Reporting. Our management is responsible for establishing and maintaining adequate internal control over financial reporting, as such term is defined in Rule 13a-15(f) of the Exchange Act. Under the supervision and with the participation of our management, including our Chief Executive Officer and Chief Financial Officer, we conducted an evaluation of the effectiveness of our internal control over financial reporting based upon the framework in Internal Control – Integrated Framework issued by the Committee of Sponsoring Organizations of the Treadway Commission. Based on that evaluation, our management concluded that our internal control over financial reporting is effective as of December 31, 2010.
Attestation Report of the Registered Public Accounting Firm. KPMG LLP, an independent registered public accounting firm, has audited the consolidated financial statements included in this Annual Report on Form 10-K and, as part of their audit, has issued their report, included herein, on the effectiveness of our internal control over financial reporting.
|
|
(c)
|
Changes in Internal Control over Financial Reporting. There were no changes in our internal control over financial reporting identified during the last fiscal quarter that have materially affected, or are reasonably likely to materially affect, our internal control over financial reporting.
|
|
ITEM 9B.
|
OTHER INFORMATION
|
Not applicable.
66
Report of Independent Registered Public Accounting Firm
The Board of Directors and Stockholders
John Bean Technologies Corporation:
We have audited John Bean Technologies Corporation’s internal control over financial reporting as of December 31, 2010, based on criteria established in Internal Control – Integrated Framework issued by the Committee of Sponsoring Organizations of the Treadway Commission (COSO). John Bean Technologies Corporation’s management is responsible for maintaining effective internal control over financial reporting and for its assessment of the effectiveness of internal control over financial reporting, included in the accompanying Management’s Annual Report on Internal Control over Financial Reporting in Item 9A: Controls and Procedures. Our responsibility is to express an opinion on the Company’s internal control over financial reporting based on our audit.
We conducted our audit in accordance with the standards of the Public Company Accounting Oversight Board (United States). Those standards require that we plan and perform the audit to obtain reasonable assurance about whether effective internal control over financial reporting was maintained in all material respects. Our audit included obtaining an understanding of internal control over financial reporting, assessing the risk that a material weakness exists, and testing and evaluating the design and operating effectiveness of internal control based on the assessed risk. Our audit also included performing such other procedures as we considered necessary in the circumstances. We believe that our audit provides a reasonable basis for our opinion.
A company’s internal control over financial reporting is a process designed to provide reasonable assurance regarding the reliability of financial reporting and the preparation of financial statements for external purposes in accordance with generally accepted accounting principles. A company’s internal control over financial reporting includes those policies and procedures that (1) pertain to the maintenance of records that, in reasonable detail, accurately and fairly reflect the transactions and dispositions of the assets of the company; (2) provide reasonable assurance that transactions are recorded as necessary to permit preparation of financial statements in accordance with generally accepted accounting principles, and that receipts and expenditures of the company are being made only in accordance with authorizations of management and directors of the company; and (3) provide reasonable assurance regarding prevention or timely detection of unauthorized acquisition, use, or disposition of the company’s assets that could have a material effect on the financial statements.
Because of its inherent limitations, internal control over financial reporting may not prevent or detect misstatements. Also, projections of any evaluation of effectiveness to future periods are subject to the risk that controls may become inadequate because of changes in conditions, or that the degree of compliance with the policies or procedures may deteriorate.
In our opinion, John Bean Technologies Corporation maintained, in all material respects, effective internal control over financial reporting as of December 31, 2010, based on criteria established in Internal Control – Integrated Framework issued by the Committee of Sponsoring Organizations of the Treadway Commission.
We also have audited, in accordance with the standards of the Public Company Accounting Oversight Board (United States), the consolidated balance sheets of John Bean Technologies Corporation and subsidiaries as of December 31, 2010 and 2009, and the related consolidated and combined statements of income, changes in stockholders’ equity, and cash flows for each of the years in the three-year period ended December 31, 2010, and our report dated March 3, 2011 expressed an unqualified opinion on those consolidated and combined financial statements.
/s/ KPMG LLP
Chicago, Illinois
March 3, 2011
67
PART III
|
ITEM 10.
|
DIRECTORS, EXECUTIVE OFFICERS AND CORPORATE GOVERNANCE
|
We have a code of ethics entitled the “Code of Business Conduct and Ethics” that applies to our employees, including our principal executive and financial officers (including our principal executive officer, principal financial officer and principal accounting officer) as well as our directors. A copy of our Code of Business Conduct and Ethics may be found on our website at www.jbtcorporation.com under “Investor Relations – Corporate Governance” and is available in print to stockholders without charge by submitting a request to the Deputy General Counsel and Secretary of JBT Corporation, 70 West Madison Street, Suite 4400, Chicago, Illinois 60602.
We also elect to disclose the information required by Form 8-K, Item 5.05, “Amendments to the registrant’s code of ethics, or waiver of a provision of the code of ethics,” through our website, and such information will remain available on our website for at least a twelve-month period.
Information regarding our executive officers is presented in the section entitled “Executive Officers of the Registrant” in Part I of this Annual Report on Form 10-K.
Other information required by this Item can be found in the Proxy Statement for our 2011 Annual Meeting of Stockholders and is incorporated herein by reference.
|
ITEM 11.
|
EXECUTIVE COMPENSATION
|
Information required by this item can be found in the sections entitled “Director Compensation,” “Compensation Committee Interlocks and Insider Participation in Compensation Decisions” and “Executive Compensation” of the Proxy Statement for our 2011 Annual Meeting of Stockholders and is incorporated herein by reference.
|
ITEM 12.
|
SECURITY OWNERSHIP OF CERTAIN BENEFICIAL OWNERS AND MANAGEMENT AND RELATED STOCKHOLDER MATTERS
|
Information required by this item can be found in the sections entitled “Security Ownership of John Bean Technologies Corporation” of the Proxy Statement for our 2011 Annual Meeting of Stockholders and is incorporated herein by reference.
|
ITEM 13.
|
CERTAIN RELATIONSHIPS AND RELATED TRANSACTIONS, AND DIRECTOR INDEPENDENCE
|
Information required by this item can be found in the sections entitled “Transactions with Related Persons” and “Director Independence” of the Proxy Statement for our 2011 Annual Meeting of Stockholders and is incorporated herein by reference.
|
ITEM 14.
|
PRINCIPAL ACCOUNTANT FEES AND SERVICES
|
Information required by this item can be found in the section entitled “Ratification of Appointment of Independent Registered Public Accounting Firm” of the Proxy Statement for our 2011 Annual Meeting of Stockholders and is incorporated herein by reference.
68
PART IV
|
ITEM 15.
|
EXHIBITS AND FINANCIAL STATEMENT SCHEDULES
|
|
(a)
|
The following documents are filed as part of this Report:
|
|
|
1.
|
Financial Statements: The consolidated and combined financial statements required to be filed in this Annual Report on Form 10-K are listed below and appear on pages 45 through 71 herein:
|
INDEX TO CONSOLIDATED AND COMBINED FINANCIAL STATEMENTS
|
Report of Independent Registered Public Accounting Firm
|
39
|
|
Consolidated and Combined Statements of Income for the Years Ended December 31, 2010, 2009 and 2008
|
40
|
|
Consolidated Balance Sheets as of December 31, 2010 and 2009
|
41
|
|
Consolidated and Combined Statements of Cash Flows for the Years Ended December 31, 2010, 2009 and 2008
|
42
|
|
Consolidated and Combined Statements of Changes in Stockholders’ Equity for the Years Ended December 31, 2010, 2009 and 2008
|
43
|
|
Notes to Consolidated and Combined Financial Statements
|
44
|
|
|
2.
|
Financial Statement Schedule: Schedule II—Valuation and Qualifying Accounts is included in this Annual Report on Form 10-K on page 65. All other schedules are omitted because of the absence of conditions under which they are required or because information called for is shown in the consolidated and combined financial statements and notes thereto in Item 8 of this Annual Report on Form 10-K.
|
|
|
3.
|
Exhibits:
See Index of Exhibits below for a list of the exhibits being filed or furnished with or incorporated by reference to this Annual Report on Form 10-K.
|
INDEX OF EXHIBITS
|
Exhibit
Number
|
Exhibit Description
|
|
2.1
|
Separation and Distribution Agreement between FMC Technologies, Inc. and John Bean Technologies Corporation (“JBT Corporation”), incorporated by reference to Exhibit 2.1 to our Current Report on Form 8-K filed with the SEC on August 6, 2008.
|
|
2.1A
|
Amendment to Separation and Distribution Agreement between FMC Technologies, Inc. and John Bean Technologies Corporation, incorporated by reference to Exhibit 2.1 to our Current Report on Form 8-K filed with the SEC on November 4, 2010.
|
|
3.1
|
Amended and Restated Certificate of Incorporation of JBT Corporation, incorporated by reference to Exhibit 3.1 to our Annual Report on Form 10-K filed with the SEC on March 11, 2009.
|
|
3.2
|
Certificate of Designations of Series A Junior Participating Preferred Stock of JBT Corporation, incorporated by reference to Exhibit 3.1 to our Current Report on Form 8-K filed with the SEC on August 6, 2008.
|
|
3.3
|
Amended and Restated By-Laws of JBT Corporation, incorporated by reference to Exhibit 3.3 to our Annual Report on Form 10-K filed with the SEC on March 11, 2009.
|
|
3.4
|
First Amendment to Amended and Restated By-Laws of JBT Corporation, incorporated by reference to Exhibit 3.2 to our Quarterly Report on Form 10-Q filed with the SEC on May 8, 2009.
|
|
4.1
|
Specimen common stock certificate of JBT Corporation, incorporated by reference to Exhibit 4.1 to Amendment No. 3 to our Form 10 filed with the SEC on July 14, 2008.
|
|
4.2
|
Rights Agreement between JBT Corporation and National City Bank, as rights agent, incorporated by reference to Exhibit 4.2 to our Current Report on Form 8-K filed with the SEC on August 6, 2008.
|
|
4.3
|
Note Purchase Agreement between JBT Corporation, incorporated by reference to Exhibit 4.1 to our Current Report on Form 8-K filed with the SEC on August 6, 2008.
|
|
10.1
|
Credit Agreement, incorporated by reference to Exhibit 10.8 to our Current Report on Form 8-K filed with the SEC on August 6, 2008.
|
|
10.2
|
Tax Sharing Agreement between JBT Corporation and FMC Technologies, Inc. incorporated by reference to Exhibit 10.1 to our Current Report on Form 8-K filed with the SEC on August 6, 2008.
|
|
10.3
|
Trademark License Agreement between JBT Corporation and FMC Technologies, Inc., incorporated by reference to Exhibit 10.2 to our Current Report on Form 8-K filed with the SEC on August 6, 2008.
|
|
10.4
|
Trademark Assignment and Coexistence Agreement between JBT Corporation and FMC Technologies, Inc., incorporated by reference to Exhibit 10.3 to our Current Report on Form 8-K filed with the SEC on August 6, 2008.
|
|
10.5
|
John Bean Technologies Corporation Incentive Compensation and Stock Plan, incorporated by reference to Exhibit 10.4 to our Current Report on Form 8-K filed with the SEC on August 6, 2008.
|
69
|
10.5A
|
Form of Nonqualified Stock Option Agreement, incorporated by reference to Exhibit 10.4A to our Current Report on Form 8-K filed with the SEC on August 6, 2008.
|
|
10.5B
|
Form of [International] Nonqualified Stock Option Agreement, incorporated by reference to Exhibit 10.4B to our Current Report on Form 8-K filed with the SEC on August 6, 2008.
|
|
10.5C
|
Form of Long-Term Incentive Performance Share Restricted Stock Agreement, incorporated by reference to Exhibit 10.4C to our Current Report on Form 8-K filed with the SEC on August 6, 2008.
|
|
10.5D
|
Form of Key Managers Restricted Stock Agreement, incorporated by reference to Exhibit 10.4D to our Current Report on Form 8-K filed with the SEC on August 6, 2008.
|
|
10.5E
|
Form of Restricted Stock Agreement for Non-Employee Directors, incorporated by reference to Exhibit 10.4E to our Current Report on Form 8-K filed with the SEC on August 6, 2008.
|
|
10.5F
|
Form of Performance Units Award Agreement, incorporated by reference to Exhibit 10.4F to our Current Report on Form 8-K filed with the SEC on August 6, 2008.
|
|
10.5G
|
Form of Long-Term Incentive Restricted Stock Agreement, incorporated by reference to Exhibit 10.4G to our Current Report on Form 8-K filed with the SEC on August 6, 2008.
|
|
10.5H*
|
Form of Long-Term Incentive Restricted Stock Unit Agreement.
|
|
10.5I*
|
Form of Long-Term Incentive Performance Share Restricted Stock Unit Agreement.
|
|
10.6
|
Amendment No. 1 to John Bean Technologies Corporation Incentive Compensation and Stock Plan, incorporated by reference to Exhibit 10.2 to our Quarterly Report on Form 10-Q filed with the SEC on November 14, 2008.
|
|
10.6A
|
Amendment No. 2 to John Bean Technologies Corporation Incentive Compensation and Stock Plan, incorporated by reference to Exhibit 10.6A to our Current Report on Form 8-K filed with the SEC on March 1, 2010.
|
|
10.7
|
JBT Corporation Non-Qualified Savings and Investment Plan, incorporated by reference to Exhibit 10.5 to our Current Report on Form 8-K filed with the SEC on August 6, 2008.
|
|
10.7A
|
First Amendment of JBT Corporation Non-Qualified Savings and Investment Plan, incorporated by reference to Exhibit 10.1 to our Current Report on Form 8-K filed with the SEC on September 18, 2009.
|
|
10.7B
|
Second Amendment of JBT Corporation Non-Qualified Savings and Investment Plan, incorporated by reference to Exhibit 10.5 to our Quarterly Report on Form 10-Q filed with the SEC on November 6, 2009.
|
|
10.8
|
International Non-Qualified Savings and Investment Plan, incorporated by reference to Exhibit 10.6 to our Current Report on Form 8-K filed with the SEC on August 6, 2008.
|
|
10.9
|
JBT Corporation Salaried Employees’ Equivalent Retirement Plan, incorporated by reference to Exhibit 10.7 to our Current Report on Form 8-K filed with the SEC on August 6, 2008.
|
|
10.9A
|
First Amendment of JBT Corporation Salaried Employees’ Equivalent Retirement Plan, incorporated by reference to Exhibit 10.1 to our Current Report on Form 8-K filed with the SEC on September 15, 2009.
|
|
10.9B
|
Second Amendment of JBT Corporation Salaried Employees’ Equivalent Retirement Plan, incorporated by reference to Exhibit 10.6 to our Quarterly Report on Form 10-Q filed with the SEC on November 6, 2009.
|
|
10.10
|
Form of JBT Corporation Executive Severance Agreement, incorporated by reference to Exhibit 10.12 to our Annual Report on Form 10-K filed with the SEC on March 11, 2009.
|
|
10.11
|
JBT Corporation Employees’ Retirement Program - Part I Salaried and Nonunion Hourly Employees Retirement Program and Part II Union Hourly Employees’ Retirement Plan, incorporated by reference to Exhibit 10.5 to Amendment No. 3 to our Form 10/A filed with the SEC on July 3, 2008.
|
|
10.11A
|
First Amendment of JBT Corporation Employees’ Retirement Program - Part I Salaried and Nonunion Hourly Employees Retirement Program, incorporated by reference to Exhibit 10.2 to our Current Report on Form 8-K filed with the SEC on September 15, 2009.
|
|
10.11B
|
Second Amendment of JBT Corporation Employees’ Retirement Program - Part I Salaried and Nonunion Hourly Employees Retirement Plan, incorporated by reference to Exhibit 10.11B to our Annual Report on Form 10-K filed with the SEC on March 4, 2010.
|
|
10.11C
|
First Amendment of JBT Corporation Employees’ Retirement Program – Part II Union Hourly Employees Retirement Plan, incorporated by reference to Exhibit 10.11C to our Annual Report on Form 10-K filed with the SEC on March 4, 2010.
|
|
10.12
|
JBT Corporation Savings and Investment Plan, incorporated by reference to Exhibit 10.6 to Amendment No. 3 to our Form 10/A filed with the SEC on July 3, 2008.
|
|
10.12A
|
First Amendment of JBT Corporation Savings and Investment Plan, incorporated by reference to Exhibit 10.6.1 to our Quarterly Report on Form 10-Q filed with the SEC on August 5, 2009.
|
|
10.12B
|
Second Amendment of JBT Corporation Savings and Investment Plan, incorporated by reference to Exhibit 10.3 to our Current Report on Form 8-K filed with the SEC on September 15, 2009.
|
|
10.12C
|
Third Amendment of JBT Corporation Savings and Investment Plan, incorporated by reference to Exhibit 10.12A to our Annual Report on Form 10-K filed with the SEC on March 4, 2010.
|
|
10.12D
|
Fourth Amendment of JBT Corporation Savings and Investment Plan, incorporated by reference to Exhibit 10.12D to our Annual Report on Form 10-K filed with the SEC on March 4, 2010.
|
70
|
10.12E*
|
Fifth Amendment of JBT Corporation Savings and Investment Plan.
|
|
10.14
|
Executive Severance Plan, incorporated by reference to Exhibit 10.14 to our Annual Report on Form 10-K filed with the SEC on March 4, 2010.
|
|
21.1*
|
List of Subsidiaries of JBT Corporation.
|
|
23.1*
|
Consent of Independent Registered Public Accounting Firm.
|
|
31.1*
|
Certification of Principal Executive Officer Pursuant to Rule 13a-14(a).
|
|
31.2*
|
Certification of Principal Financial Officer Pursuant to Rule 13a-14(a).
|
|
32.1*
|
Certification of Principal Executive Officer Pursuant to 18 U.S.C. 1350, as adopted pursuant to Section 906 of the Sarbanes-Oxley Act of 2002.
|
|
32.2*
|
Certification of Principal Financial Officer Pursuant to 18 U.S.C. 1350, as adopted pursuant to Section 906 of the Sarbanes-Oxley Act of 2002.
|
* Filed herewith
71
SIGNATURES
Pursuant to the requirements of Section 13 or 15(d) of the Securities Exchange Act of 1934, the registrant has duly caused this report to be signed on its behalf by the undersigned, thereunto duly authorized.
|
John Bean Technologies Corporation
(Registrant)
|
|
|
By:
|
/s/ CHARLES H. CANNON, JR.
|
|
Charles H. Cannon, Jr.
|
|
|
President and Chief Executive Officer
(Principal Executive Officer)
|
|
Date: March 3, 2011
Pursuant to the requirements of the Securities Exchange Act of 1934, this report has been signed below by the following persons on behalf of the registrant and in the capacities and on the date indicated.
|
Signature
|
Title
|
Date
|
||
| /s/ CHARLES H. CANNON, JR. | President, Chief Executive Officer, | March 3, 2011 | ||
|
Charles H. Cannon, Jr.
|
Chairman and Director
(Principal Executive Officer)
|
|
||
| /s/ RONALD D. MAMBU | Vice President and | March 3, 2011 | ||
|
Ronald D. Mambu
|
Chief Financial Officer
(Principal Financial Officer)
|
|
||
| /s/ MEGAN J. DONNELLY | Chief Accounting Officer | March 3, 2011 | ||
|
Megan J. Donnelly
|
(Principal Accounting Officer)
|
|
||
| /s/ C. MAURY DEVINE | Director | March 3, 2011 | ||
|
. Maury Devine
|
|
|
||
| /s/ ALAN D. FELDMAN | Director | March 3, 2011 | ||
|
Alan D. Feldman
|
|
|
||
| / s/ JAMES E. GOODWIN | Director | March 3, 2011 | ||
|
James E. Goodwin
|
|
|
||
| /s/ POLLY B. KAWALEK | Director | March 3, 2011 | ||
|
Polly B. Kawalek
|
|
|
||
| /s/ JAMES M. RINGLER | Director | March 3, 2011 | ||
|
James M. Ringler
|
|
|
||
| /s/ JAMES R. THOMPSON | Director | March 3, 2011 | ||
|
James R. Thompson
|
|
|
72