Attached files
| file | filename |
|---|---|
| EX-99.1 - EX-99.1 - HD Supply Holdings, Inc. | a16-21311_1ex99d1.htm |
| 8-K - 8-K - HD Supply Holdings, Inc. | a16-21311_18k.htm |
Exhibit 99.2
Robert W. Baird & Co. 2016 Industrial Conference November 9th, 2016

Disclaimers Forward-Looking Statements and Preliminary Results This presentation includes “forward-looking statements” within the meaning of Section 27A of the Securities Act and Section 21E of the Exchange Act. Forward-looking statements are based on management’s beliefs and assumptions and information currently available to management and are subject to known and unknown risks and uncertainties, many of which may be beyond our control. We caution you that the forward-looking information presented in this presentation is not a guarantee of future results, and that actual results may differ materially from those made in or suggested by the forward-looking information contained in this presentation. In addition, forward-looking statements generally can be identified by the use of forward-looking terminology such as “may,” “plan,” “seek,” “comfortable with,” “will,” “expect,” “intend,” “estimate,” “anticipate,” “believe” or “continue” or the negative thereof or variations thereon or similar terminology. A number of important factors could cause actual events to differ materially from those contained in or implied by the forward-looking statements, including those “Risk factors” in HD Supply Holdings, Inc’s annual report on Form 10-K, for the fiscal year ended January 31, 2016, filed on March 18, 2016 and those described from time to time in our, and HD Supply, Inc.’s, other filings with the U.S. Securities and Exchange Commission, which can be found at the SEC’s website www.sec.gov. Any forward-looking information presented herein is made only as of the date of this presentation, and we do not undertake any obligation to update or revise any forward-looking information to reflect changes in assumptions, the occurrence of unanticipated events, or otherwise. Estimates for Net sales are preliminary estimates and are subject to risks and uncertainties, including, among others, changes in connection with quarter-end adjustments. Any variation between HD Supply’s actual results and the preliminary financial data set forth herein may be material. Non-GAAP Financial Measures HD Supply supplements its financial results that are determined in accordance with accounting principles generally accepted in the United States of America (“GAAP”) with non-GAAP measurements, including Adjusted EBITDA, Adjusted net income (loss), Adjusted net income (loss) per share, Net Debt and Free Cash Flow. This supplemental information should not be considered in isolation or as a substitute for the GAAP measurements. Additional information regarding Adjusted EBITDA, Adjusted net income (loss) per share referred to in this presentation is included at the end of this presentation under “Reconciliation of Non-GAAP Measures.”
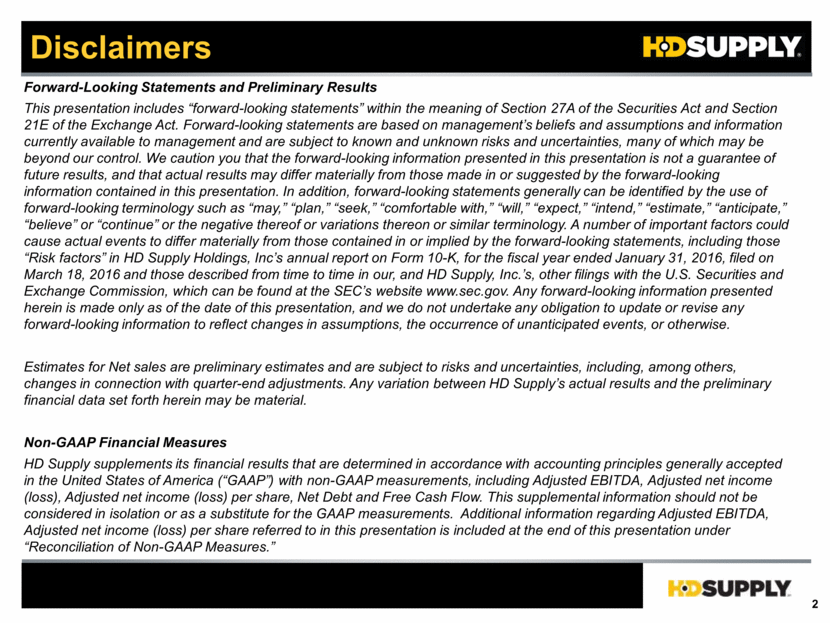
Company Overview Leading Industrial Distributor Specializing in MRO, Infrastructure and Construction $7.3 Billion of LTM Q2’16 Net Sales; $1.2 Billion of LTM Q2’16 Net Income; $918 Million of LTM Q2’16 Adjusted EBITDA1 (12.5% of Net Sales) Leading Industrial Distributor With #1 Positions2 in Large, Fragmented Markets Specialized Business Units Providing Diversity in Products, Customers and Vendor Relationships ~800,000 SKUs ~500,000 Customers Scale, National Presence and Local Market Expertise Drive Competitive Advantage ~500 Locations, 48 U.S. States, and 6 Canadian Provinces3 Combination of Distribution Center and Branch-Based Operating Models Talent with Deep, Relevant Experience Driving Speed and Precision National Footprint Net Sales by End Market4 Maintenance, Repair and Operations 36% Residential Construction 18% Non-Residential Construction 26% Infrastructure and Other 17% $7B 1 See Appendix Slide 10 for a Reconciliation of Net Income to Adjusted EBITDA 2 Management Estimates based on Market Data and Industry Knowledge; Market Size for 2015 3 As of Fiscal 2015 4 As of Fiscal 2015, Excludes Canada
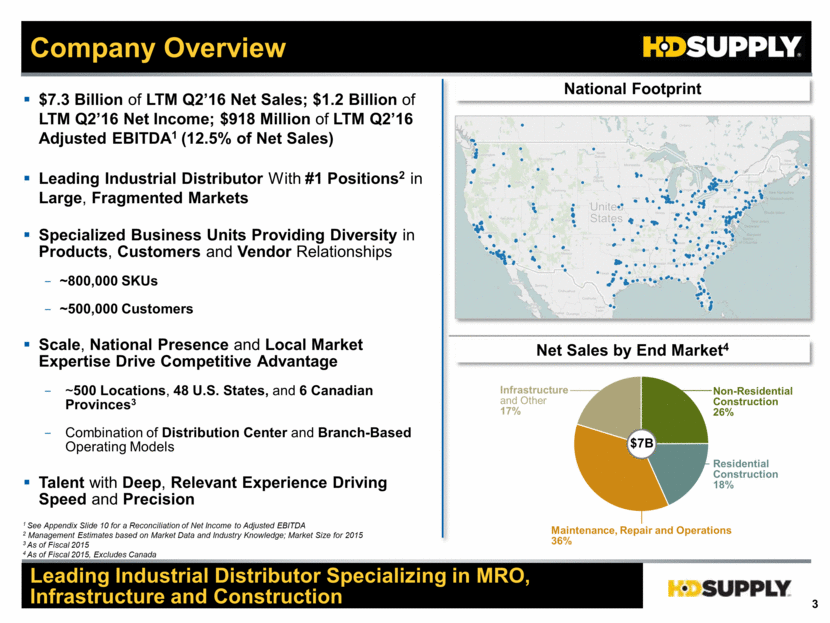
Execution Update Controllable Execution Facilities Maintenance Supply Chain On Track Cautious Optimism for End Market Outlook Despite Mixed Signals Focused on Controllable Execution +300 BPs Versus Market, 1.5x – 2.0x Operating Leverage1 One Team Culture Talent, Talent, Talent 1Operating Leverage is Defined as Adjusted EBITDA Growth Divided by Total Net Sales Growth
Q3’16 Performance Update Sales Adjusted EBITDA Adj. Net Income Per Diluted Share Preliminary Q3’16 Results $2,008M $0.82 – $0.832 1 EBITDA Reconciliation to GAAP on Slide.8 of the Appendix 2 Adj. Net Income Per Diluted Share Reconciliation to GAAP on Slide.9 of the Appendix 3 No reconciliation of the previously provided forecasted range for Adjusted EBITDA to Net income and Adjusted net income per diluted share to Net income per diluted share for the third quarter of fiscal 2016 is included because at the time of the forecast we were unable to quantify certain amounts that would be required to be included in the GAAP measure without unreasonable efforts. In addition, the company believes such reconciliations would imply a degree of precision that would be confusing or misleading to investors. Q3’16 Performance Consistent with Guidance Q3’16 Guidance3 $0.77 – $0.82 (as of Q2 Earnings Call) $258M – $268M $1,985M – $2,035M $263M – $264M1 Net Income $59M – $60M N/A Net Income Per Diluted Share $0.29 – $0.30 N/A
Appendix
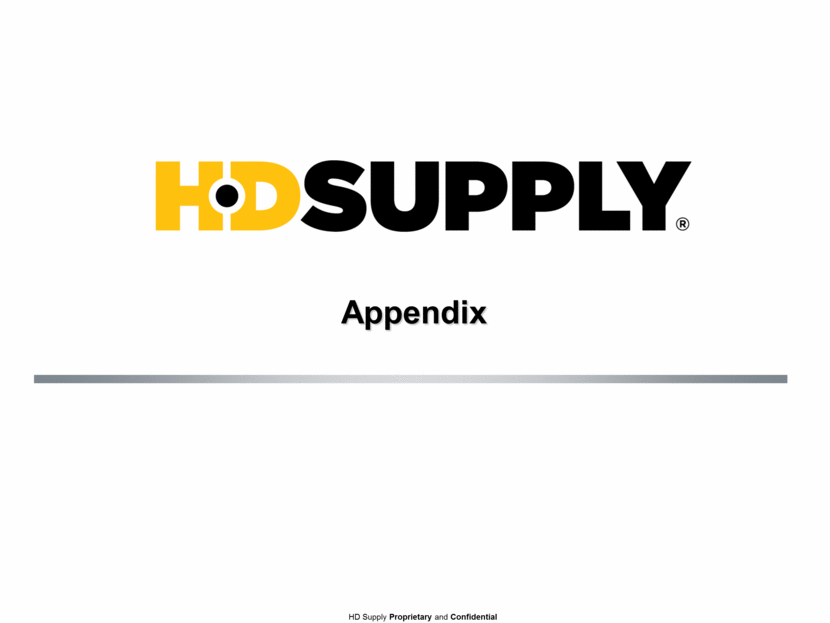
Reconciliation of Non-GAAP Measures: Preliminary Net Income to Adj. EBITDA 1 Depreciation and amortization includes amounts recorded within Cost of sales in the Consolidated Statements of Operations. 2 Represents the loss on extinguishment of debt including the premium paid to redeem the debt as well as the write-off of unamortized deferred financing costs and other assets or liabilities associated with such debt. 3 Represents the costs incurred for strategic alignment of our workforce. These costs include severance, relocation costs and other related costs. Preliminary Net income Less loss from discontinued operations, net of tax Preliminary Income from continuing operations Provision for Income Taxes Interest Expense, net Depreciation and amortization1 Loss on extinguishment and modification of debt2 Restructuring Charge3 Stock-based compensation Preliminary Adjusted EBITDA ($ in millions) October 30, 2016 $ 59 - $ 60 (4) $ 63 – $ 64 65 43 – 44 25 58 - 59 4 4 $ 263 - $ 264 3 Months Ended
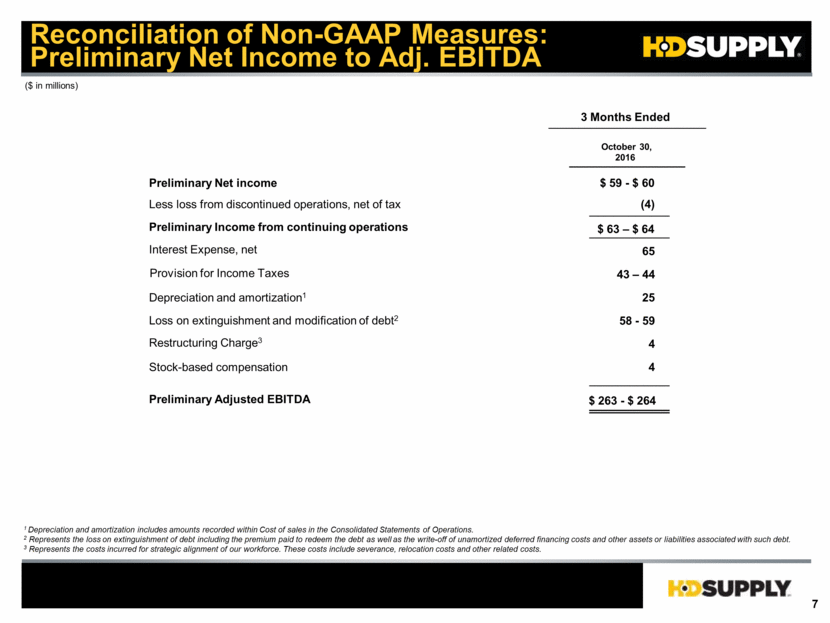
Reconciliation of Non-GAAP Measures: Preliminary Net Income to Adj. Net Income 1 Represents the loss on extinguishment of debt including the premium paid to redeem the debt as well as the write-off of unamortized deferred financing costs and other assets or liabilities associated with such debt. 2 Represents the costs incurred for strategic alignment of our workforce. These costs include severance, relocation costs and other related costs. Preliminary Net income Less loss from discontinued operations, net of tax Preliminary Income from continuing operations Less: Cash income taxes Plus: Provision for income taxes Plus: Amortization of acquisition-related intangible assets (other than software) Plus: Loss on extinguishment & modification of debt1 Restructuring Charge2 Preliminary Adjusted Net Income (in millions, except per share amounts) October 30, 2016 $ 59 - $ 60 (4) $ 63 – $ 64 43 – 44 (6) – (7) 4 58 - 59 4 $ 166 - $ 168 3 Months Ended Preliminary Diluted weighted average common shares outstanding Preliminary Adjusted net income per share – diluted ~202 $ 0.82 - $ 0.83
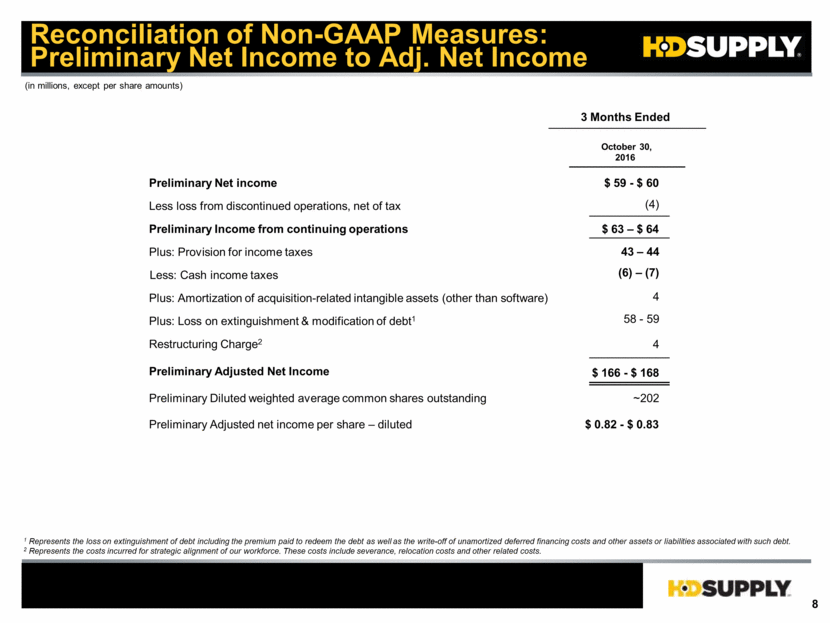
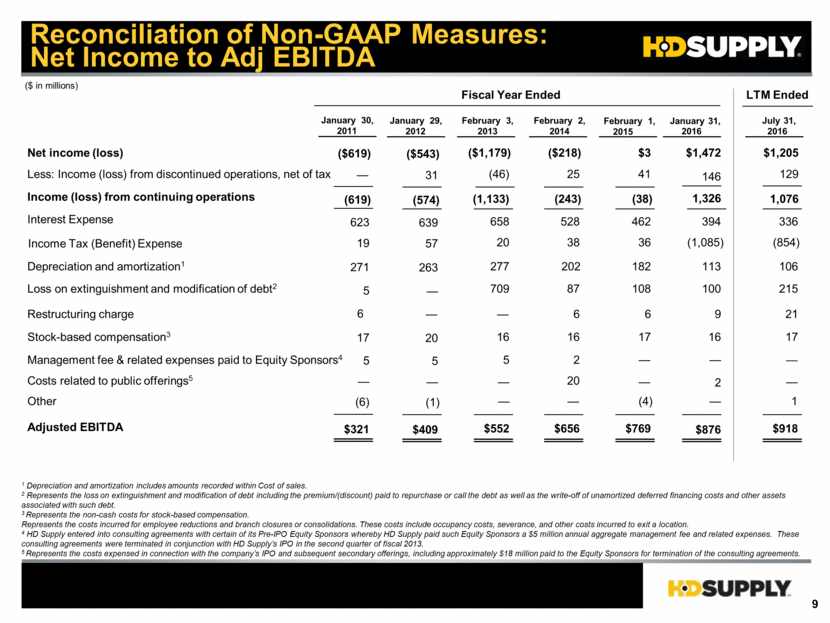
Reconciliation of Non-GAAP Measures: Net Income to Adj EBITDA 1 Depreciation and amortization includes amounts recorded within Cost of sales. 2 Represents the loss on extinguishment and modification of debt including the premium/(discount) paid to repurchase or call the debt as well as the write-off of unamortized deferred financing costs and other assets associated with such debt. 3 Represents the non-cash costs for stock-based compensation. Represents the costs incurred for employee reductions and branch closures or consolidations. These costs include occupancy costs, severance, and other costs incurred to exit a location. 4 HD Supply entered into consulting agreements with certain of its Pre-IPO Equity Sponsors whereby HD Supply paid such Equity Sponsors a $5 million annual aggregate management fee and related expenses. These consulting agreements were terminated in conjunction with HD Supply’s IPO in the second quarter of fiscal 2013. 5 Represents the costs expensed in connection with the company’s IPO and subsequent secondary offerings, including approximately $18 million paid to the Equity Sponsors for termination of the consulting agreements. Net income (loss) Less: Income (loss) from discontinued operations, net of tax Income (loss) from continuing operations Income Tax (Benefit) Expense Interest Expense Depreciation and amortization1 Loss on extinguishment and modification of debt2 Restructuring charge Stock-based compensation3 Management fee & related expenses paid to Equity Sponsors4 Costs related to public offerings5 Other Adjusted EBITDA ($ in millions) Fiscal Year Ended July 31, 2016 $1,205 129 1,076 336 (854) 106 215 21 17 — $918 LTM Ended February 3, 2013 ($218) 25 (243) 528 38 202 6 16 2 20 $656 January 29, 2012 ($1,179) (46) (1,133) 658 20 277 709 16 — $552 5 February 2, 2014 $3 41 (38) 462 36 182 108 17 $769 (4) February 1, 2015 87 6 — — — — — ($543) 31 (574) 639 57 263 20 — $409 5 — — (1) — 1 January 31, 2016 $1,472 146 1,326 394 (1,085) 113 100 9 16 — $876 — 2 January 30, 2011 ($619) — (619) 623 19 271 17 — $321 5 6 5 (6)
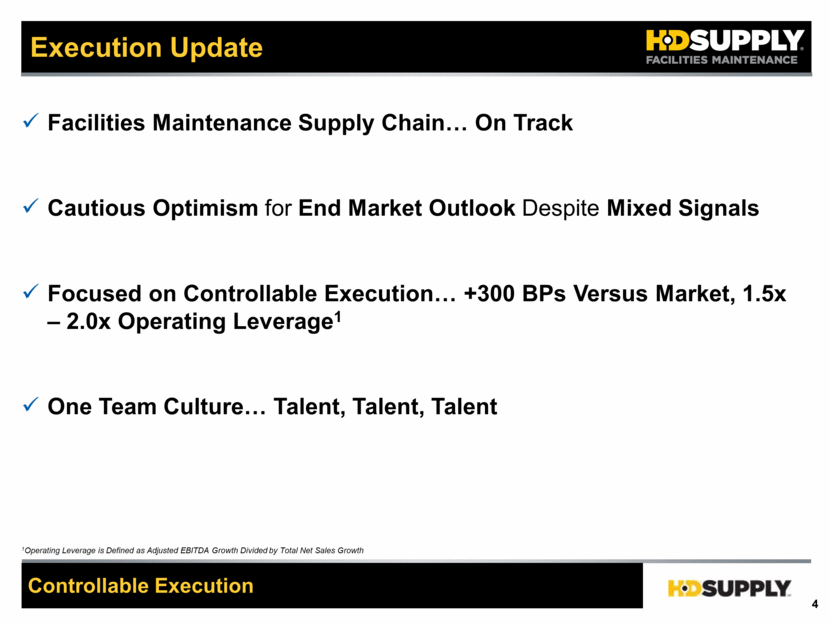
Historical Financial Performance Strong Growth, Operating Leverage ($ in millions) 1 See Appendix Slide 10 for a Reconciliation of Net Income to Adjusted EBITDA 2 Net Sales Growth, Adj. EBITDA Growth and Operating Leverage Exclude the Impact of the 53rd Week in 2012 3 Note: All Periods Adjusted for Sale of Discontinued Operations. VPY = Versus Prior Year 4 Operating Leverage is Defined as Adjusted EBITDA Growth Divided by Total Net Sales Growth . Adj. EBITDA1 Net Sales GM % Adj. EBITDA % VPY %3 ’10A 31.9% $321M 7.3% $4,397 n/a n/a 32.1% ’11A $409M 8.4% $4,848 27% 10% ’12A2 32.4% $552M 9.8% $5,629 32% 14% ’13A2 33.0% $656M 10.7% $6,103 21% 10% 22% CAGR ’15A 33.5% $876M 12.3% $7,123 14% 7% Adj. EBITDA VPY% ’14A 32.8% $769M 11.5% $6,682 17% 10% LTM Q2’16 33.7% $918M 12.5% $7,323 11% 6% 2.7x n/a 2.3x 2.0x 1.8x 2.1x Op. Leverage4 1.9x Net Income ($619) ($543) ($1,179) ($218) $1,472 $3 $1,205
