Attached files
| file | filename |
|---|---|
| EX-99.1 - EX-99.1 - Multi Packaging Solutions International Ltd | mpsx_8kex991.htm |
| 8-K - 8-K - Multi Packaging Solutions International Ltd | mpsx_8kcurrentfolio.htm |
Exhibit 99.2
|
|
Solutions that Protect and Promote the World’s Great Brands 1Q 2017 Earnings Webcast |
|
|
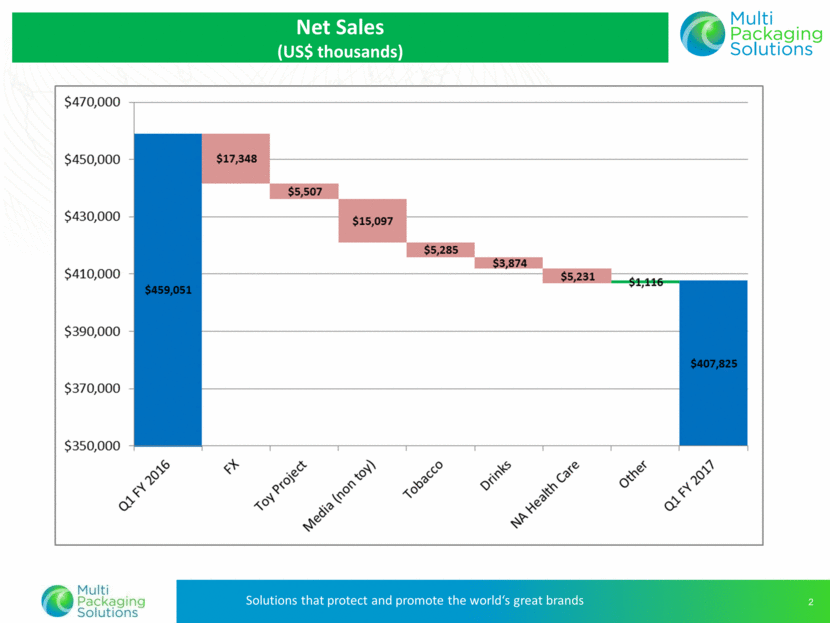
Net Sales (US$ thousands) |
|
|
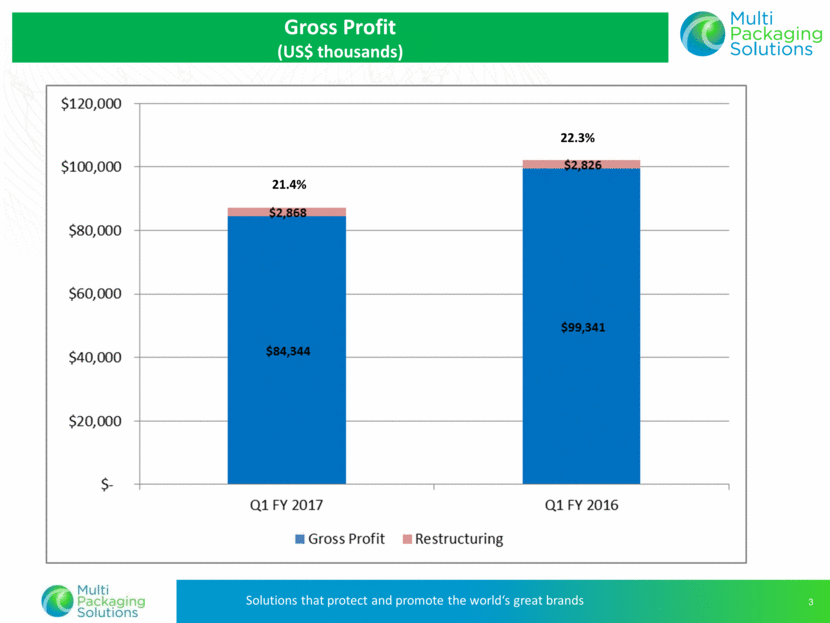
Gross Profit (US$ thousands) 21.4% 22.3% |
|
|
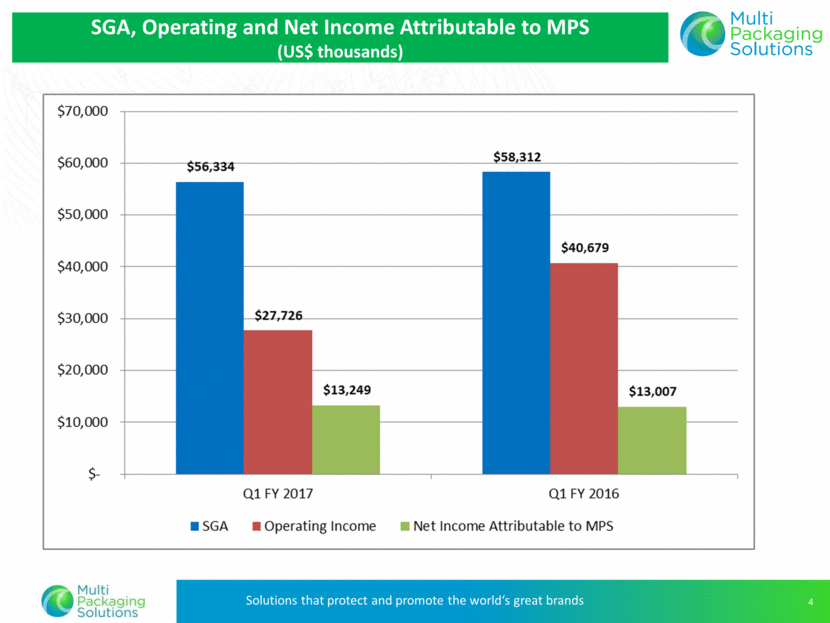
SGA, Operating and Net Income Attributable to MPS (US$ thousands) |
|
|
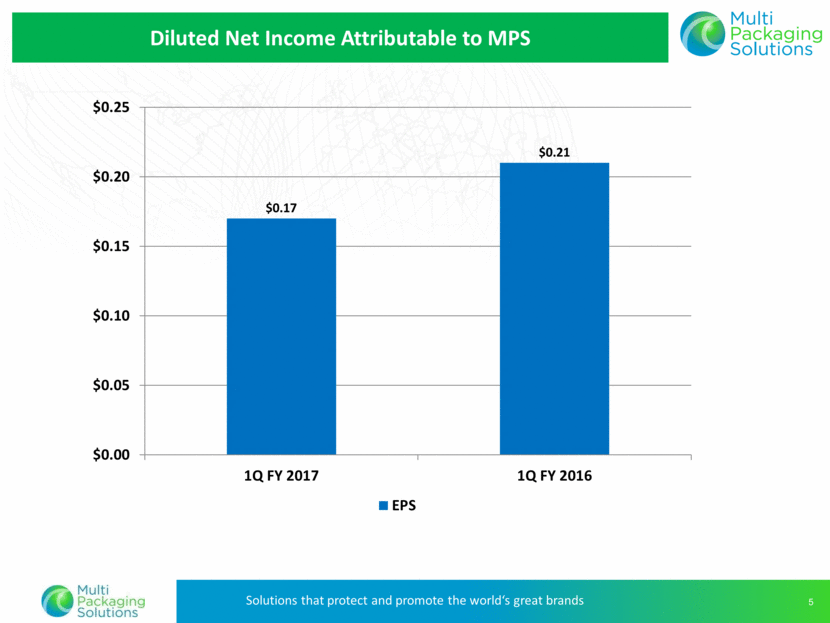
Diluted Net Income Attributable to MPS $0.17 $0.21 $0.00 $0.05 $0.10 $0.15 $0.20 $0.25 1Q FY 2017 1Q FY 2016 EPS |
|
|
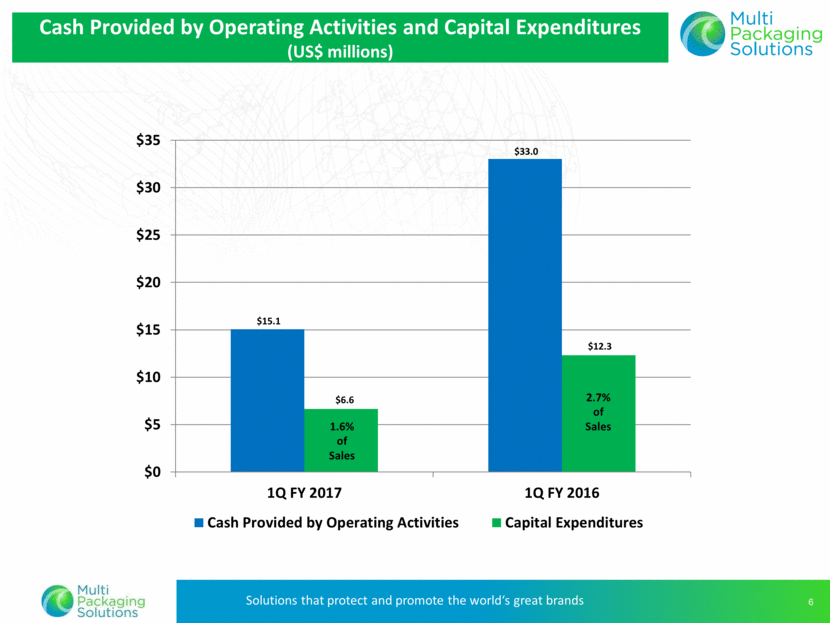
1.6% of Sales 2.7% of Sales Cash Provided by Operating Activities and Capital Expenditures (US$ millions) $15.1 $33.0 $6.6 $12.3 $0 $5 $10 $15 $20 $25 $30 $35 1Q FY 2017 1Q FY 2016 Cash Provided by Operating Activities Capital Expenditures |
|
|
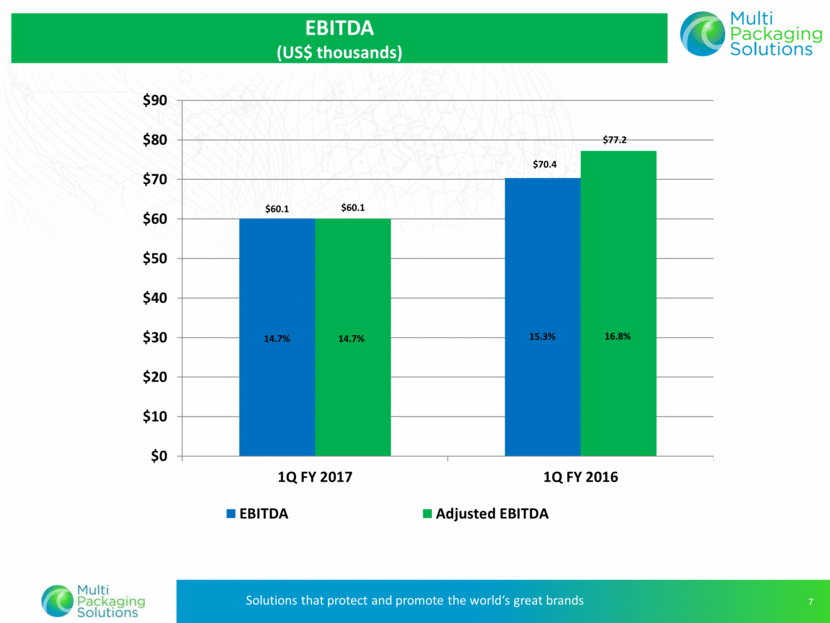
15.3% 14.7% 16.8% EBITDA (US$ thousands) 14.7% $60.1 $70.4 $60.1 $77.2 $0 $10 $20 $30 $40 $50 $60 $70 $80 $90 1Q FY 2017 1Q FY 2016 EBITDA Adjusted EBITDA |
|
|
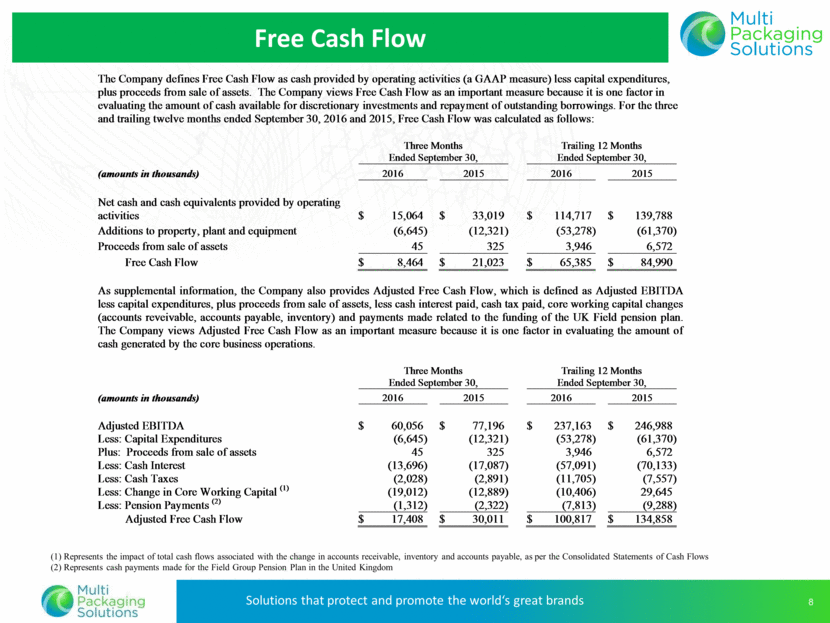
Free Cash Flow (1) Represents the impact of total cash flows associated with the change in accounts receivable, inventory and accounts payable, as per the Consolidated Statements of Cash Flows (2) Represents cash payments made for the Field Group Pension Plan in the United Kingdom The Compa ny defines Free Cash Flow as cash provided by operating activities (a GAAP measure) less capital expenditures, plus proceeds from sale of assets. The Company views Free Cash Flow as an important measure because it is one factor in evaluating the amount of cash available for discretionary investments and repayment of outstanding borrowings. For the three and trailing twelve months ended September 30, 2016 and 2015, Free Cash Flow was calculated as follows: Three Months Ended September 30, Trailing 12 Months Ended September 30, (amounts in thousands) 2016 2015 2016 2015 Net cash and cash equivalents provided by operating activities $ 15,064 $ 33,019 $ 114,717 $ 139,788 Additions to property, plant and equipment (6,645) (12,321) (53,278) (61,370) Proceeds from sale of assets 45 325 3,946 6,572 Free Cash Flow $ 8,464 $ 21,023 $ 65,385 $ 84,990 As supplemental information, the Company also provides Adjusted Free Cash Flow, which is def ined as Adjusted EBITDA less capital expenditures , plus proceeds from sale o f assets , less cash interest paid, cash tax paid, core working capital changes (accounts reveivable, accounts payable, inventory) and payments made related to the funding of the UK Field pension plan. The Company views Adjusted Free Cash Flow as an important measure because it is one factor in evaluating the amount of cash generated by the core business operations. Three Months Ended September 30, Trailing 12 Months Ended September 30, (amounts in thousands) 2016 2015 2016 2015 Adjusted EBITDA $ 60,056 $ 77,196 $ 237,163 $ 246,988 Less: Capital Expenditures (6,645) (12,321) (53,278) (61,370) Plus: Proceeds from sale of assets 45 325 3,946 6,572 Less: Cash Interest (13,696) (17,087) (57,091) (70,133) Less: Cash Taxes (2,028) (2,891) (11,705) (7,557) Less: Change in Core Working Capital (1) (19,012) (12,889) (10,406) 29,645 Less: Pension Payments (2) (1,312) (2,322) (7,813) (9,288) Adjusted Free Cash Flow $ 17,408 $ 30,011 $ 100,817 $ 134,858 |
|
|
Solutions that Protect and Promote the World’s Great Brands 1Q 2017 Earnings Webcast Appendix Depreciation and Amortization Non GAAP Adjusted EBITDA to Net Income Reconciliation Non GAAP Adjusted Income Reconciliation Debt Summary Net Sales by Geography and End Market |
|
|
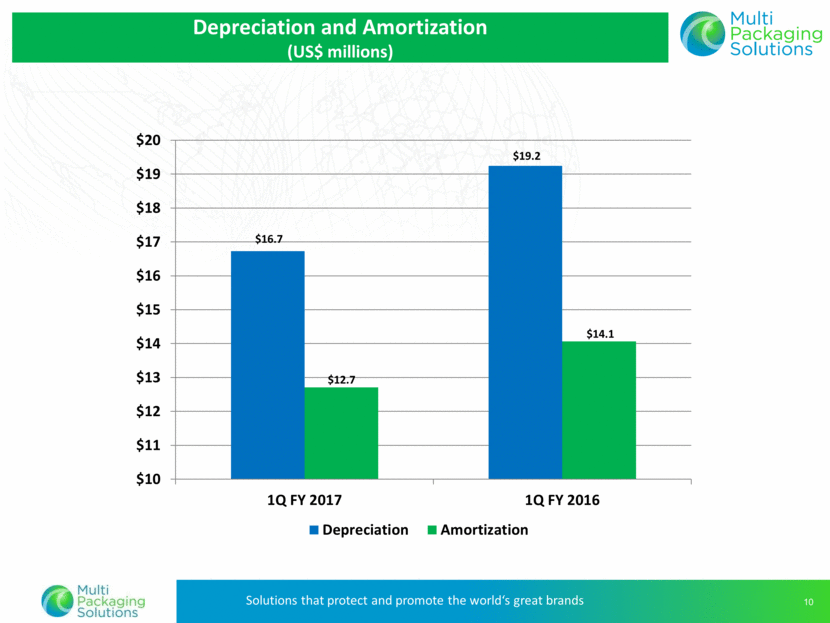
Depreciation and Amortization (US$ millions) $16.7 $19.2 $12.7 $14.1 $10 $11 $12 $13 $14 $15 $16 $17 $18 $19 $20 1Q FY 2017 1Q FY 2016 Depreciation Amortization |
|
|
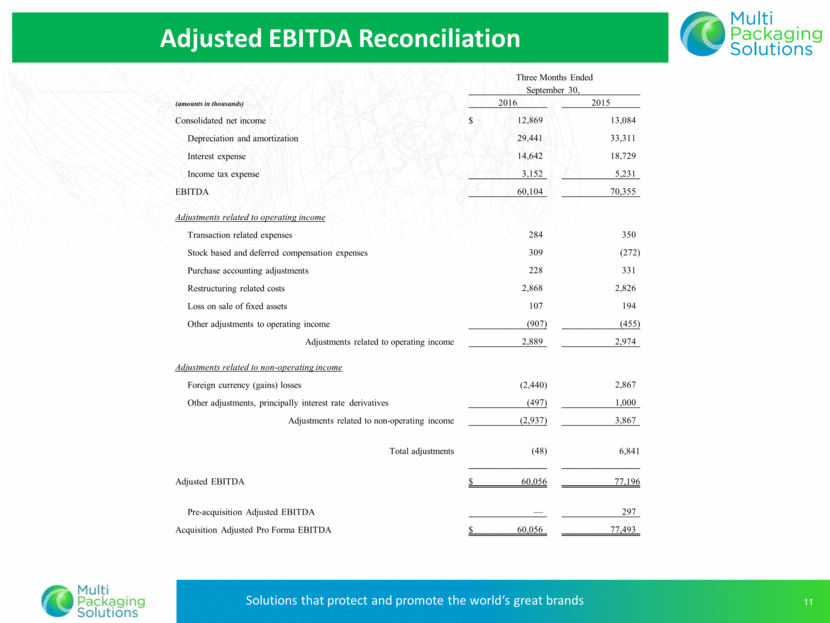
Adjusted EBITDA Reconciliation Three Months Ended September 30, (amounts in thousands) 2016 2015 Consolidated net income $ 12,869 13,084 Depreciation and amortization 29,441 33,311 Interest expense 14,642 18,729 Income tax expense 3,152 5,231 EBITDA 60,104 70,355 Adjustments related to operating income Transaction related expenses 284 350 Stock based and deferred compensation expenses 309 (272) Purchase accounting adjustments 228 331 Restructuring related costs 2,868 2,826 Loss on sale of fixed assets 107 194 Other adjustments to operating income (907) (455) Adjustments related to operating income 2,889 2,974 Adjustments related to non-operating income Foreign currency (gains) losses (2,440) 2,867 Other adjustments, principally interest rate derivatives (497) 1,000 Adjustments related to non-operating income (2,937) 3,867 Total adjustments (48) 6,841 Adjusted EBITDA $ 60,056 77,196 Pre-acquisition Adjusted EBITDA — 297 Acquisition Adjusted Pro Forma EBITDA $ 60,056 77,493 |
|
|
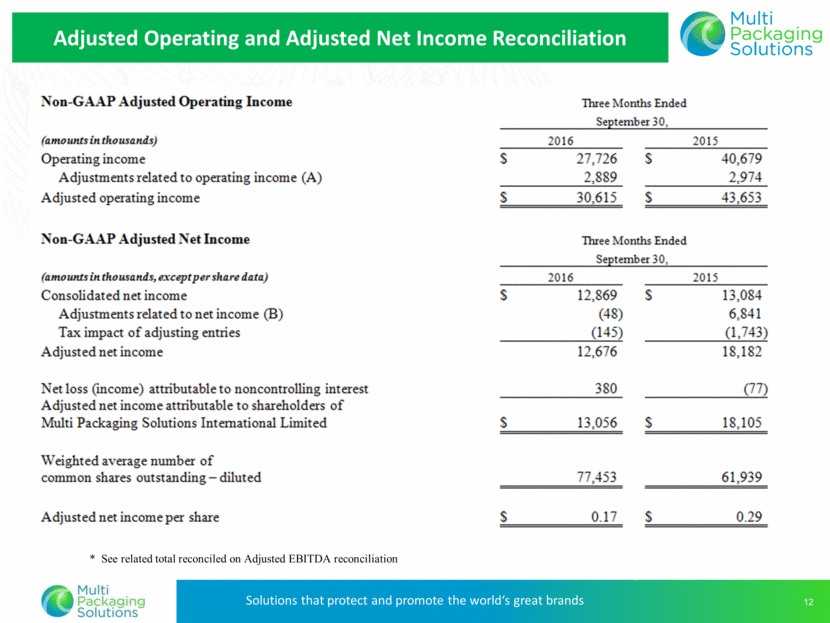
Adjusted Operating and Adjusted Net Income Reconciliation * See related total reconciled on Adjusted EBITDA reconciliation |
|
|
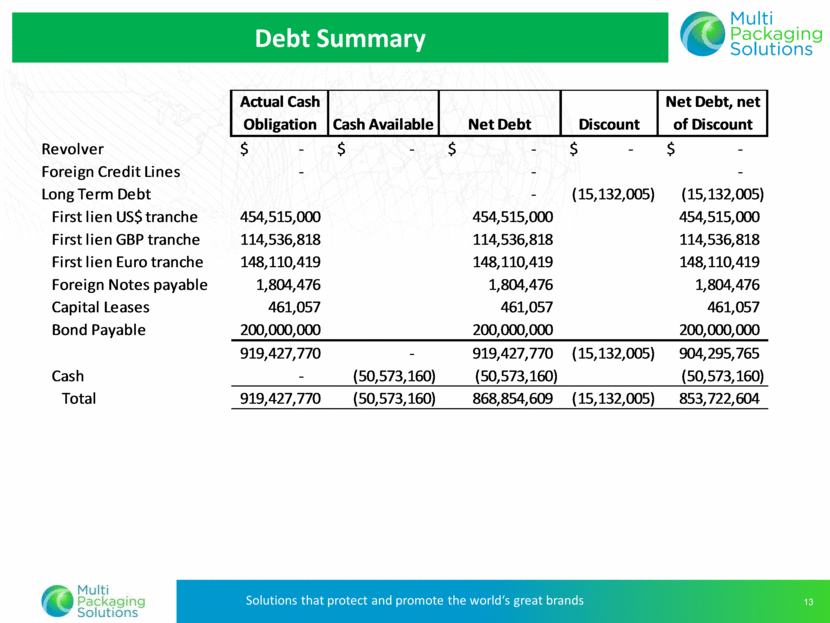
Debt Summary Actual Cash Obligation Cash Available Net Debt Discount Net Debt, net of Discount Revolver - $ - $ - $ - $ - $ Foreign Credit Lines - - - Long Term Debt - (15,132,005) (15,132,005) First lien US$ tranche 454,515,000 454,515,000 454,515,000 First lien GBP tranche 114,536,818 114,536,818 114,536,818 First lien Euro tranche 148,110,419 148,110,419 148,110,419 Foreign Notes payable 1,804,476 1,804,476 1,804,476 Capital Leases 461,057 461,057 461,057 Bond Payable 200,000,000 200,000,000 200,000,000 919,427,770 - 919,427,770 (15,132,005) 904,295,765 Cash - (50,573,160) (50,573,160) (50,573,160) Total 919,427,770 (50,573,160) 868,854,609 (15,132,005) 853,722,604 |
|
|
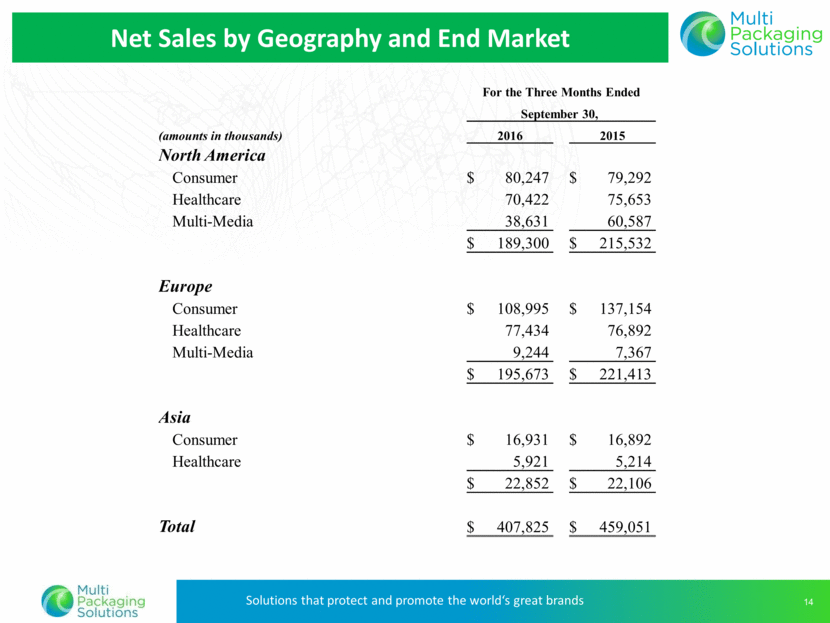
Net Sales by Geography and End Market For the Three Months Ended September 30, (amounts in thousands) 2016 2015 North America Consumer $ 80,247 $ 79,292 Healthcare 70,422 75,653 Multi-Media 38,631 60,587 $ 189,300 $ 215,532 Europe Consumer $ 108,995 $ 137,154 Healthcare 77,434 76,892 Multi-Media 9,244 7,367 $ 195,673 $ 221,413 Asia Consumer $ 16,931 $ 16,892 Healthcare 5,921 5,214 $ 22,852 $ 22,106 Total $ 407,825 $ 459,051 |
|
|
Solutions that Protect and Promote the World’s Great Brands 1Q 2017 Earnings Webcast Thank you for your interest in Multi Packaging Solutions |

