Attached files
| file | filename |
|---|---|
| EX-99.1 - CAROLINA FINANCIAL CORP | e00586_ex99-1.htm |
| 8-K - CAROLINA FINANCIAL CORP | e00586_caro-8k.htm |
Investor Presentation N A S D A Q : C A RO November 8, 201 6 Acquisition of Greer Bancshares Incorporated by Carolina Financial Corporation (CARO)
2 Disclaimer Certain statements in this presentation contain “forward - looking statements” within the meaning of the Private Securities Litigation Reform Act of 1995 , such as statements relating to future plans and expectations, and are thus prospective . Such forward - looking statements include but are not limited to statements with respect to plans, objectives, expectations, and intentions and other statements that are not historical facts, and other statements identified by words such as “believes,” “expects,” “anticipates,” “estimates,” “intends,” “plans,” “targets,” and “projects,” as well as similar expressions . Such statements are subject to risks, uncertainties, and other factors which could cause actual results to differ materially from future results expressed or implied by such forward - looking statements . Although we believe that the assumptions underlying the forward - looking statements are reasonable, any of the assumptions could prove to be inaccurate . Therefore, we can give no assurance that the results contemplated in the forward - looking statements will be realized . The inclusion of this forward - looking information should not be construed as a representation by Carolina Financial Corporation (“Carolina Financial” or the “Company”) or any person that such future events, plans, or expectations will occur or be achieved . In addition to factors previously disclosed in the reports filed by Carolina Financial with the Securities and Exchange Commission (the “SEC”), additional risks and uncertainties may include, but are not limited to : ( 1 ) competitive pressures among depository and other financial institutions may increase significantly and have an effect on pricing, spending, third - party relationships and revenues ; ( 2 ) the strength of the United States economy in general and the strength of the local economies in which we conduct operations may be different than expected resulting in, among other things, a deterioration in the credit quality or a reduced demand for credit, including the resultant effect on the Company’s loan portfolio and allowance for loan losses ; ( 3 ) the rate of delinquencies and amounts of charge - offs, the level of allowance for loan loss, the rates of loan growth, or adverse changes in asset quality in our loan portfolio, which may result in increased credit risk - related losses and expenses ; ( 4 ) the risk that the preliminary financial information reported herein and our current preliminary analysis will be different when our review is finalized ; ( 5 ) changes in the U . S . legal and regulatory framework including, but not limited to, the Dodd - Frank Act and regulations adopted thereunder ; ( 6 ) adverse conditions in the stock market, the public debt market and other capital markets (including changes in interest rate conditions) could have a negative impact on the Company . Additional factors that could cause our results to differ materially from those described in the forward - looking statements can be found in the reports (such as our Annual Report on Form 10 - K, Quarterly Reports on Form 10 - Q and Current Reports on Form 8 - K) filed with the SEC and available at the SEC’s Internet site (http : //www . sec . gov) . All subsequent written and oral forward - looking statements concerning the Company or any person acting on its behalf is expressly qualified in its entirety by the cautionary statements above . We do not undertake any obligation to update any forward - looking statement to reflect circumstances or events that occur after the date the forward - looking statements are made .
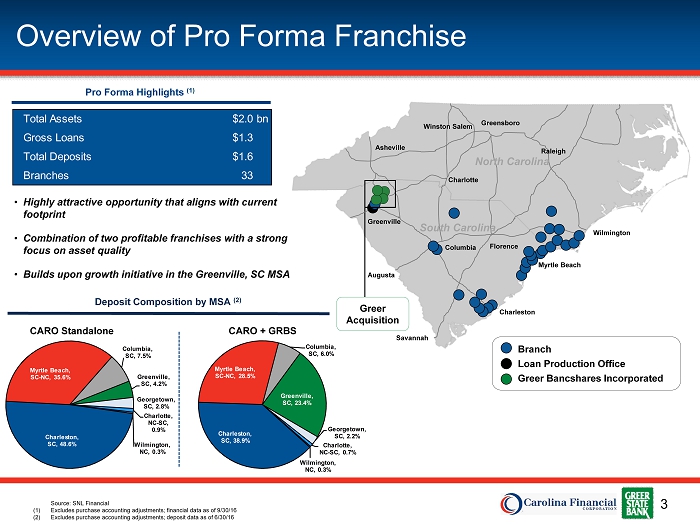
3 Augusta Savannah Overview of Pro Forma Franchise Branch Loan Production Office Greer Bancshares Incorporated Greer Acquisition Source: SNL Financial (1) Excludes purchase accounting adjustments; financial data as of 9/30/16 (2) Excludes purchase accounting adjustments; deposit data as of 6/30/16 Pro Forma Highlights (1 ) Deposit Composition by MSA (2) CARO Standalone CARO + GRBS • Highly attractive opportunity that aligns with current footprint • Combination of two profitable franchises with a strong focus on asset quality • Builds upon growth initiative in the Greenville, SC MSA Total Assets $2.0bn Gross Loans $1.3 Total Deposits $1.6 Branches 33 Charleston, SC, 48.6% Myrtle Beach, SC - NC, 35.6% Columbia, SC, 7.5% Greenville, SC, 4.2% Georgetown, SC, 2.8% Charlotte, NC - SC, 0.9% Wilmington, NC, 0.3% Charleston, SC, 38.9% Myrtle Beach, SC - NC, 28.5% Columbia, SC, 6.0% Greenville, SC, 23.4% Georgetown, SC, 2.2% Charlotte, NC - SC, 0.7% Wilmington, NC, 0.3% Asheville Charlotte Raleigh Greensboro Winston Salem Myrtle Beach Wilmington Charleston North Carolina South Carolina Greenville Columbia Florence
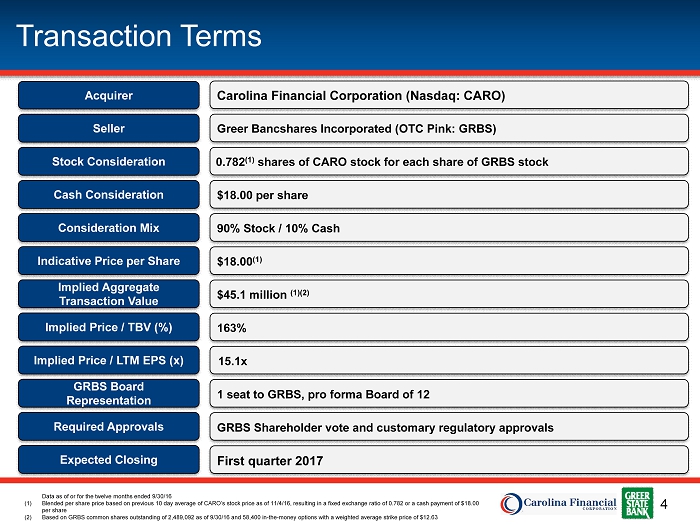
4 1 1 1 1 1 1 1 1 1 1 Transaction Terms Consideration Mix Implied Price / TBV (%) Required Approvals $45.1 million (1)(2) 90% Stock / 10% Cash GRBS Shareholder vote and customary regulatory approvals Implied Aggregate Transaction Value GRBS Board Representation Expected Closing First quarter 2017 1 seat to GRBS, pro forma Board of 12 163% $18.00 (1) Indicative Price per Share 0.782 (1) shares of CARO stock for each share of GRBS stock Stock Consideration Greer Bancshares Incorporated (OTC Pink: GRBS) Seller Carolina Financial Corporation (Nasdaq: CARO) Acquirer 1 Cash Consideration $18.00 per share 1 Implied Price / LTM EPS (x) 15.1x Data as of or for the twelve months ended 9/30/16 (1) Blended per share price based on previous 10 day average of CARO’s stock price as of 11/4/16, resulting in a fixed exchange ratio of 0.782 or a cash payment of $18.00 per share (2) Based on GRBS common shares outstanding of 2,489,092 as of 9/30/16 and 58,400 in - the - money options with a weighted average strike price of $ 12.63
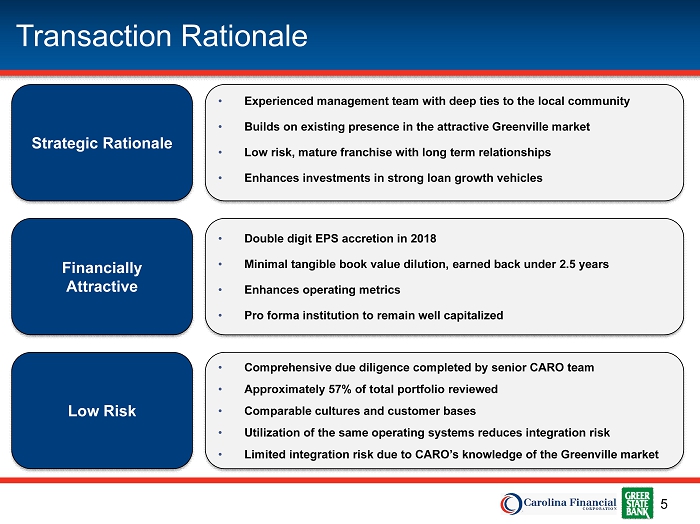
5 • Double digit EPS accretion in 2018 • Minimal tangible book value dilution, earned back under 2.5 years • Enhances operating metrics • Pro forma institution to remain well capitalized • Comprehensive due diligence completed by senior CARO team • Approximately 57% of total portfolio reviewed • Comparable cultures and customer bases • Utilization of the same operating systems reduces integration risk • Limited integration risk due to CARO’s knowledge of the Greenville market • Experienced management team with deep ties to the local community • Builds on existing presence in the attractive Greenville market • Low risk, mature franchise with long term relationships • Enhances investments in strong loan growth vehicles Transaction Rationale Low Risk Financially Attractive Strategic Rationale
6 Key Factors in a Successful M&A Transaction Conservative and Achievable Results Retention of Key Employees with Minimal Turnover Material, Immediate and Lasting EPS Accretion TBV Earnback Period under 2.5 years x x x x Well Capitalized Pro Forma Company x
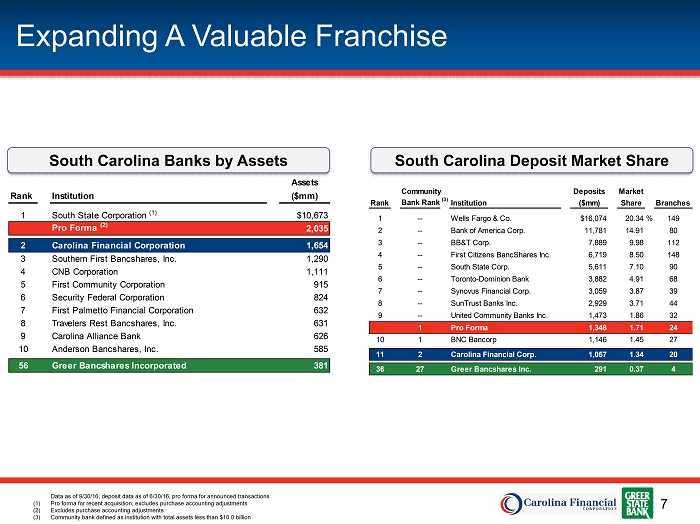
7 Expanding A Valuable Franchise Data as of 9/30/16; deposit data as of 6/30/16, pro forma for announced transactions (1) Pro forma for recent acquisition; excludes purchase accounting adjustments (2) Excludes purchase accounting adjustments (3) Community bank defined as institution with total assets less than $10.0 billion Community Deposits Market Rank Bank Rank (3) Institution ($mm) Share Branches 1 -- Wells Fargo & Co. $16,074 20.34% 149 2 -- Bank of America Corp. 11,781 14.91 80 3 -- BB&T Corp. 7,889 9.98 112 4 -- First Citizens BancShares Inc. 6,719 8.50 148 5 -- South State Corp. 5,611 7.10 90 6 -- Toronto-Dominion Bank 3,882 4.91 68 7 -- Synovus Financial Corp. 3,059 3.87 39 8 -- SunTrust Banks Inc. 2,929 3.71 44 9 -- United Community Banks Inc. 1,473 1.86 32 1 Pro Forma 1,348 1.71 24 10 1 BNC Bancorp 1,146 1.45 27 11 2 Carolina Financial Corp. 1,057 1.34 20 36 27 Greer Bancshares Inc. 291 0.37 4 Assets Rank Institution ($mm) 1 South State Corporation (1) $10,673 Pro Forma (2) 2,035 2 Carolina Financial Corporation 1,654 3 Southern First Bancshares, Inc. 1,290 4 CNB Corporation 1,111 5 First Community Corporation 915 6 Security Federal Corporation 824 7 First Palmetto Financial Corporation 632 8 Travelers Rest Bancshares, Inc. 631 9 Carolina Alliance Bank 626 10 Anderson Bancshares, Inc. 585 56 Greer Bancshares Incorporated 381 South Carolina Banks by Assets South Carolina Deposit Market Share
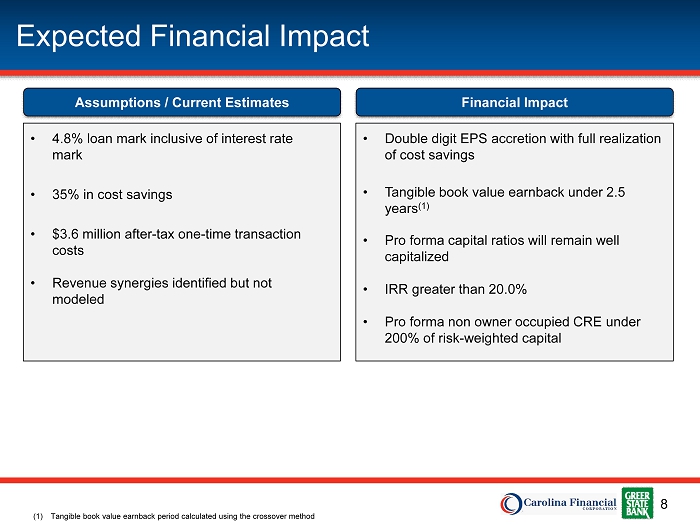
8 Expected Financial Impact (1) Tangible book value earnback period calculated using the crossover method Assumptions / Current Estimates Financial Impact • 4.8% loan mark inclusive of interest rate mark • 35% in cost savings • $3.6 million after - tax one - time transaction costs • Revenue synergies identified but not modeled • Double digit EPS accretion with full realization of cost savings • Tangible book value earnback under 2.5 years (1) • Pro forma capital ratios will remain well capitalized • IRR greater than 20.0% • Pro forma non owner occupied CRE under 200% of risk - weighted capital
9 Credit Due Diligence Credit Due Diligence Process • Experienced credit review team of CARO bankers, comprised of CARO senior management • Reviewed 57% of Greer’s loan portfolio o 100% of loans greater than $300 thousand o 100% of relationships greater than $300 thousand o 100% of non accrual loans o 90% of remaining watchlist and criticized loans • Greer has 3 OREO properties totaling $42 thousand as of 9/30/16
10 Summary Data as of 9/30/16; deposit market share data as of 6/30/16 (1) Community bank defined as an institution with total assets less than $10.0 billion • Creates significant franchise value – #2 institution headquartered in South Carolina, by asset size o Pro Forma assets greater than $2.0 billion at close – #9 deposit market share in South Carolina o #1 community bank (1) – Enhanced products and services • Carolina Financial will have strong banking teams in five of the fastest growing markets in the Southeast • Complimentary community banking cultures • Financially attractive combination
11 Appendix
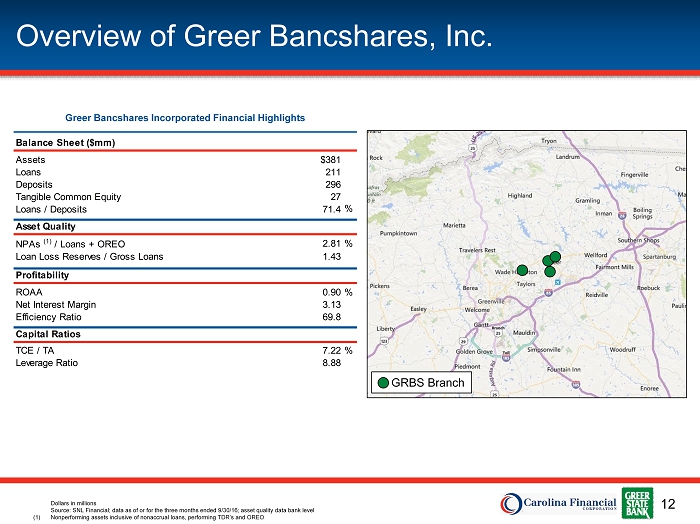
12 Overview of Greer Bancshares, Inc. Balance Sheet ($mm) Assets $381 Loans 211 Deposits 296 Tangible Common Equity 27 Loans / Deposits 71.4 % Asset Quality NPAs (1) / Loans + OREO 2.81% Loan Loss Reserves / Gross Loans 1.43 Profitability ROAA 0.90% Net Interest Margin 3.13 Efficiency Ratio 69.8 Capital Ratios TCE / TA 7.22% Leverage Ratio 8.88 Greer Bancshares Incorporated Financial Highlights Dollars in millions Source: SNL Financial; data as of or for the three months ended 9/30/16; asset quality data bank level (1) Nonperforming assets inclusive of nonaccrual loans, performing TDR’s and OREO GRBS Branch
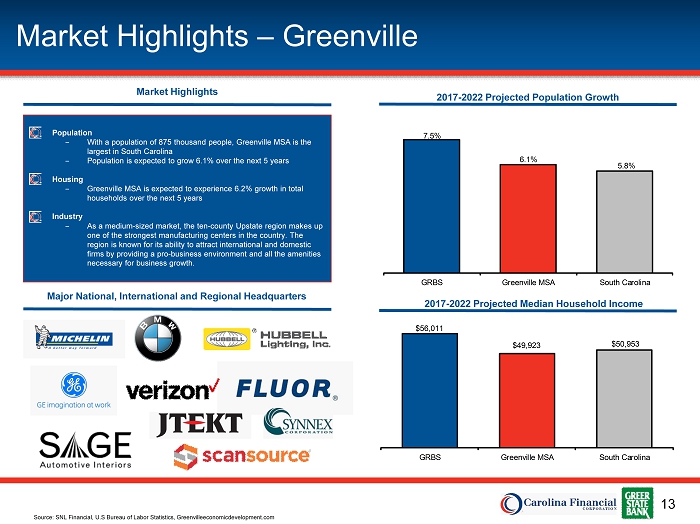
13 Market Highlights – Greenville Market Highlights Population ‒ With a population of 875 thousand people, Greenville MSA is the largest in South Carolina ‒ Population is expected to grow 6.1% over the next 5 years Housing ‒ Greenville MSA is expected to experience 6.2% growth in total households over the next 5 years Industry ‒ As a medium - sized market, the ten - county Upstate region makes up one of the strongest manufacturing centers in the country. The region is known for its ability to attract international and domestic firms by providing a pro - business environment and all the amenities necessary for business growth. Source: SNL Financial, U.S Bureau of Labor Statistics, Greenvilleeconomicdevelopment.com Major National, International and Regional Headquarters 2017 - 2022 Projected Population Growth 7.5% 6.1% 5.8% GRBS Greenville MSA South Carolina 2017 - 2022 Projected Median Household Income $56,011 $49,923 $50,953 GRBS Greenville MSA South Carolina
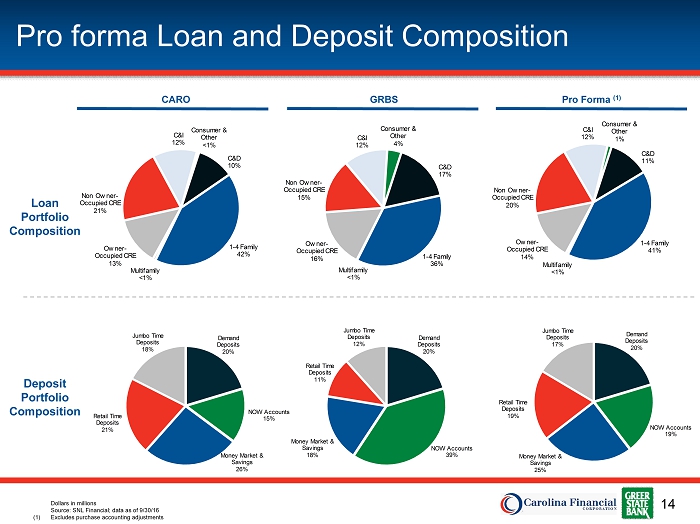
14 C&D 10% 1 - 4 Family 42% Multifamily <1% Owner - Occupied CRE 13% Non Owner - Occupied CRE 21% C&I 12% Consumer & Other <1% C&D 17% 1 - 4 Family 36% Multifamily <1% Owner - Occupied CRE 16% Non Owner - Occupied CRE 15% C&I 12% Consumer & Other 4% C&D 11% 1 - 4 Family 41% Multifamily <1% Owner - Occupied CRE 14% Non Owner - Occupied CRE 20% C&I 12% Consumer & Other 1% Pro forma Loan and Deposit Composition CARO GRBS Pro Forma (1) Demand Deposits 20% NOW Accounts 15% Money Market & Savings 26% Retail Time Deposits 21% Jumbo Time Deposits 18% Demand Deposits 20% NOW Accounts 39% Money Market & Savings 18% Retail Time Deposits 11% Jumbo Time Deposits 12% Demand Deposits 20% NOW Accounts 19% Money Market & Savings 25% Retail Time Deposits 19% Jumbo Time Deposits 17% Loan Portfolio Composition Deposit Portfolio Composition Dollars in millions Source: SNL Financial; data as of 9/30/16 (1) Excludes purchase accounting adjustments