Attached files
| file | filename |
|---|---|
| 8-K - SHENANDOAH TELECOMMUNICATIONS COMPANY 8-K 11-7-2016 - SHENANDOAH TELECOMMUNICATIONS CO/VA/ | form8k.htm |
Exhibit 99.1

November 7, 2016 3Q 2016Earnings Conference Call
Safe Harbor Statement This presentation includes “forward-looking statements” within the meaning of Section 27A of the Securities Act and Section 21E of the Securities Exchange Act of 1934, as amended, regarding, among other things, our business strategy, our prospects and our financial position. These statements can be identified by the use of forward-looking terminology such as “believes,” “estimates,” “expects,” “intends,” “may,” “will,” “should,” “could,” or “anticipates” or the negative or other variation of these similar words, or by discussions of strategy or risks and uncertainties. These statements are based on current expectations of future events. If underlying assumptions prove inaccurate or unknown risks or uncertainties materialize, actual results could vary materially from the Company’s expectations and projections. Important factors that could cause actual results to differ materially from such forward-looking statements include, without limitation, risks related to the following: Increasing competition in the communications industry; andA complex and uncertain regulatory environment.A further list and description of these risks, uncertainties and other factors can be found in the Company’s SEC filings which are available online at www.sec.gov, www.shentel.com or on request from the Company. The Company does not undertake to update any forward-looking statements as a result of new information or future events or developments.
Use of Non-GAAP Financial Measures Included in this presentation are certain non-GAAP financial measures that are not determined in accordance with US generally accepted accounting principles. These financial performance measures are not indicative of cash provided or used by operating activities and exclude the effects of certain operating, capital and financing costs and may differ from comparable information provided by other companies, and they should not be considered in isolation, as an alternative to, or more meaningful than measures of financial performance determined in accordance with US generally accepted accounting principles. These financial performance measures are commonly used in the industry and are presented because Shentel believes they provide relevant and useful information to investors. Shentel utilizes these financial performance measures to assess its ability to meet future capital expenditure and working capital requirements, to incur indebtedness if necessary, return investment to shareholders and to fund continued growth. Shentel also uses these financial performance measures to evaluate the performance of its businesses and for budget planning purposes.

Chris FrenchPresident and CEO
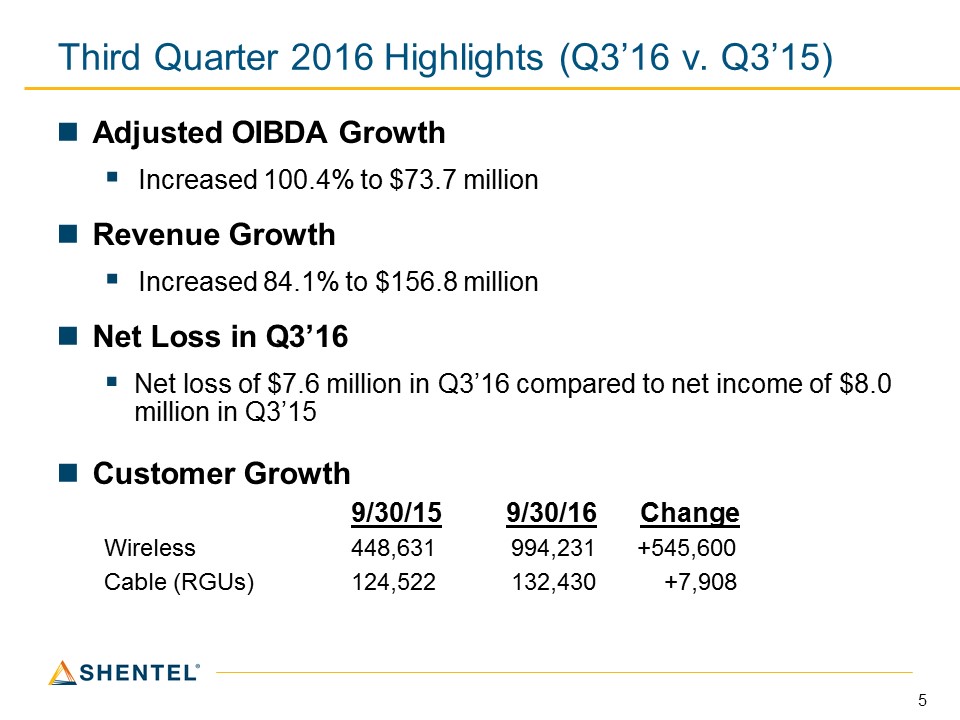
Third Quarter 2016 Highlights (Q3’16 v. Q3’15) Adjusted OIBDA Growth Increased 100.4% to $73.7 millionRevenue Growth Increased 84.1% to $156.8 millionNet Loss in Q3’16Net loss of $7.6 million in Q3’16 compared to net income of $8.0 million in Q3’15Customer Growth 9/30/15 9/30/16 ChangeWireless 448,631 994,231 +545,600Cable (RGUs) 124,522 132,430 +7,908
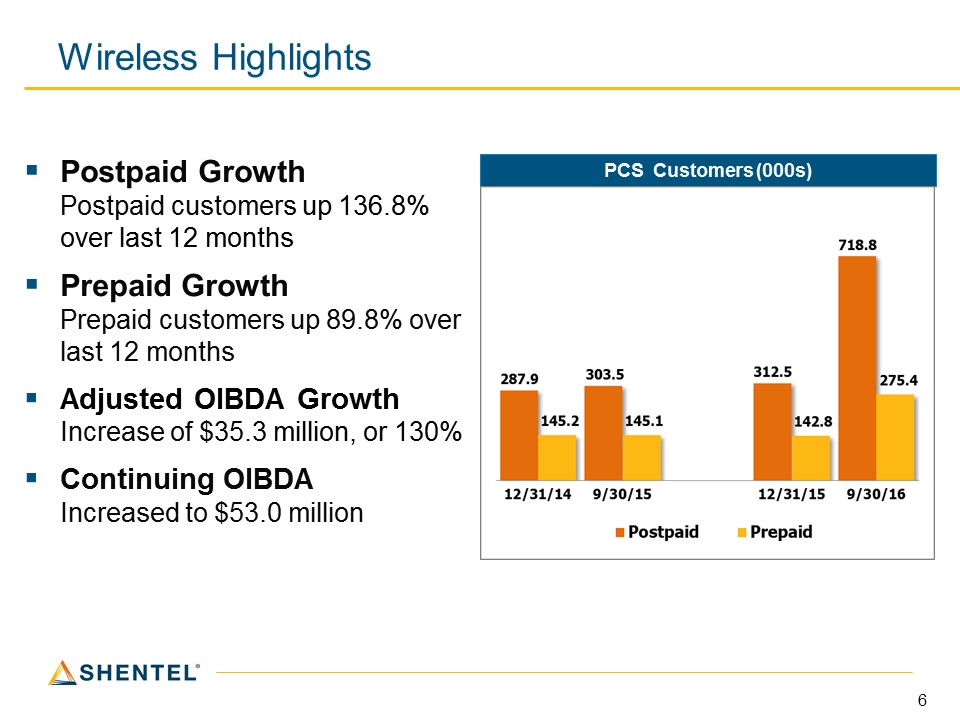
Wireless Highlights PCS Customers (000s) Postpaid Growth Postpaid customers up 136.8% over last 12 monthsPrepaid GrowthPrepaid customers up 89.8% over last 12 monthsAdjusted OIBDA GrowthIncrease of $35.3 million, or 130%Continuing OIBDA Increased to $53.0 million
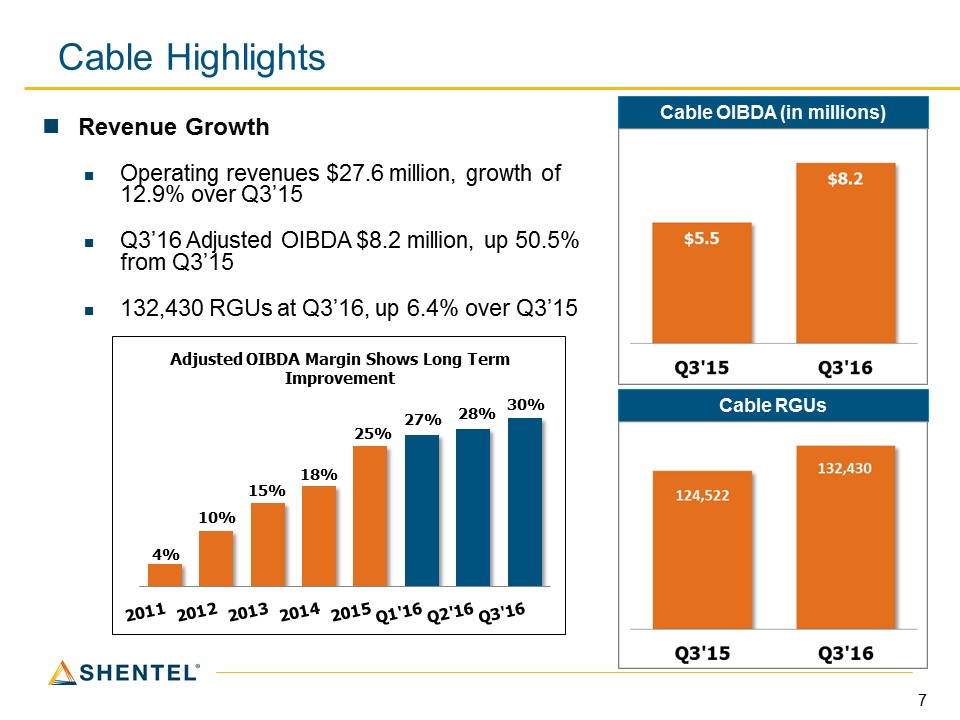
Cable Highlights Revenue GrowthOperating revenues $27.6 million, growth of 12.9% over Q3’15Q3’16 Adjusted OIBDA $8.2 million, up 50.5% from Q3’15132,430 RGUs at Q3’16, up 6.4% over Q3’15 Cable OIBDA (in millions) Cable RGUs
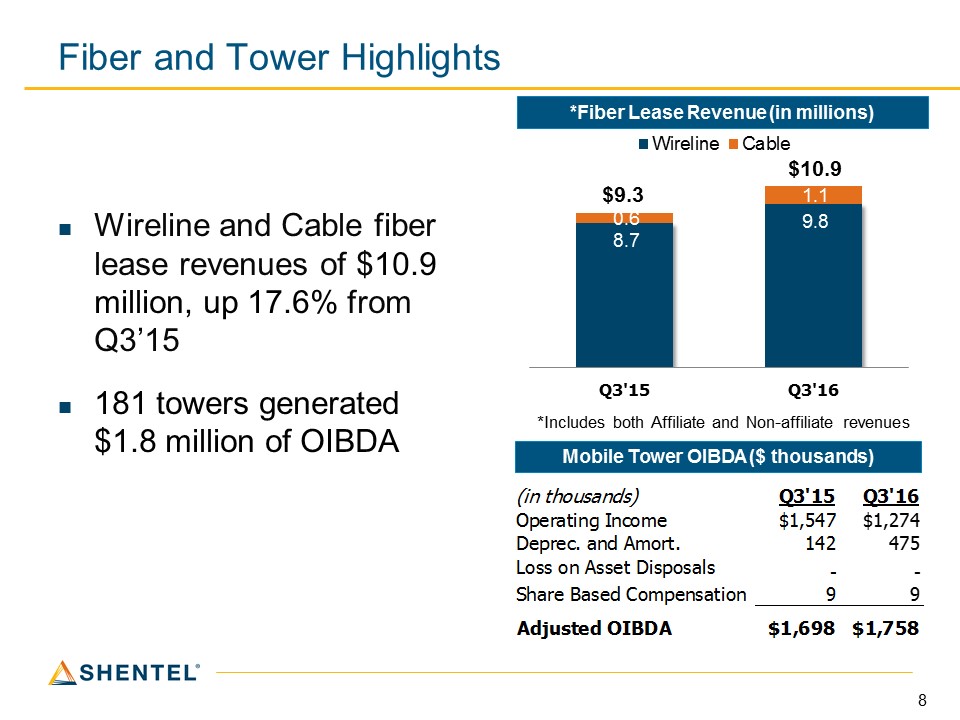
Fiber and Tower Highlights Wireline and Cable fiber lease revenues of $10.9 million, up 17.6% from Q3’15181 towers generated $1.8 million of OIBDA *Fiber Lease Revenue (in millions) Mobile Tower OIBDA ($ thousands) *Includes both Affiliate and Non-affiliate revenues
Adele SkolitsVP of Finance and CFO
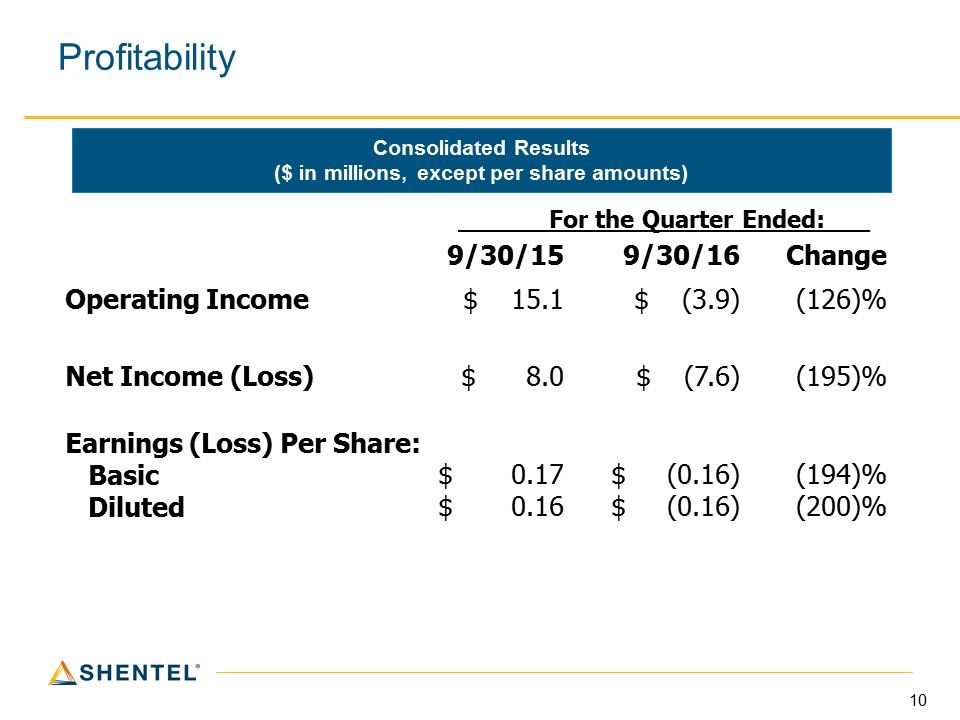
Profitability Consolidated Results($ in millions, except per share amounts) 9/30/15 9/30/16 Change Operating Income $ 15.1 $ (3.9) (126)% Net Income (Loss) $ 8.0 $ (7.6) (195)% Earnings (Loss) Per Share: Basic Diluted $ 0.17$ 0.16 $ (0.16) $ (0.16) (194)%(200)% For the Quarter Ended:___
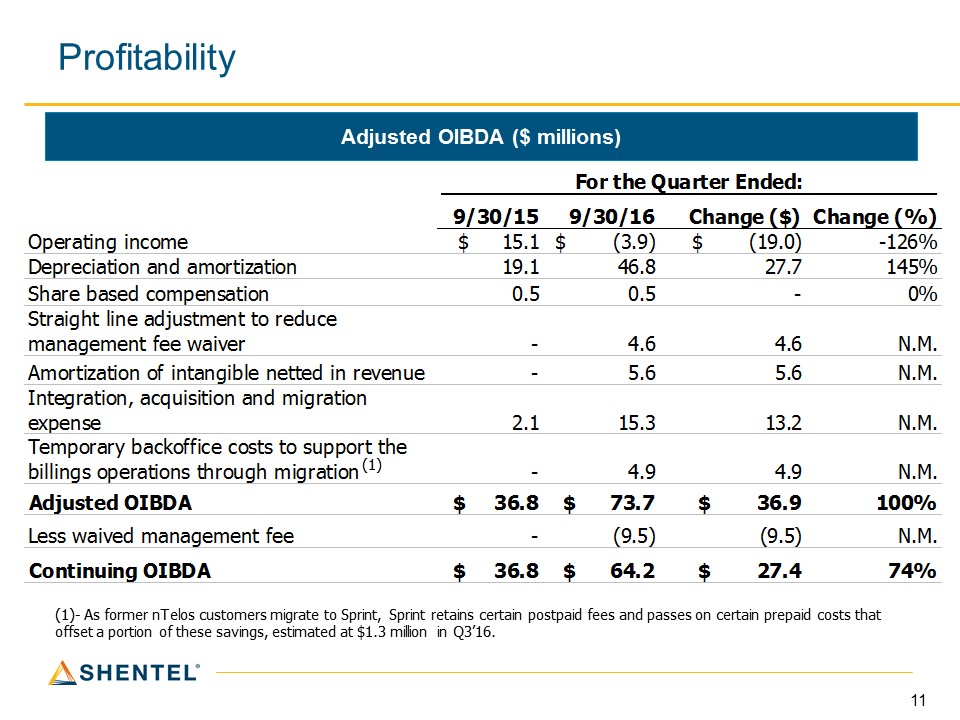
Profitability Adjusted OIBDA ($ millions) (1)- As former nTelos customers migrate to Sprint, Sprint retains certain postpaid fees and passes on certain prepaid costs that offset a portion of these savings, estimated at $1.3 million in Q3’16. (1)
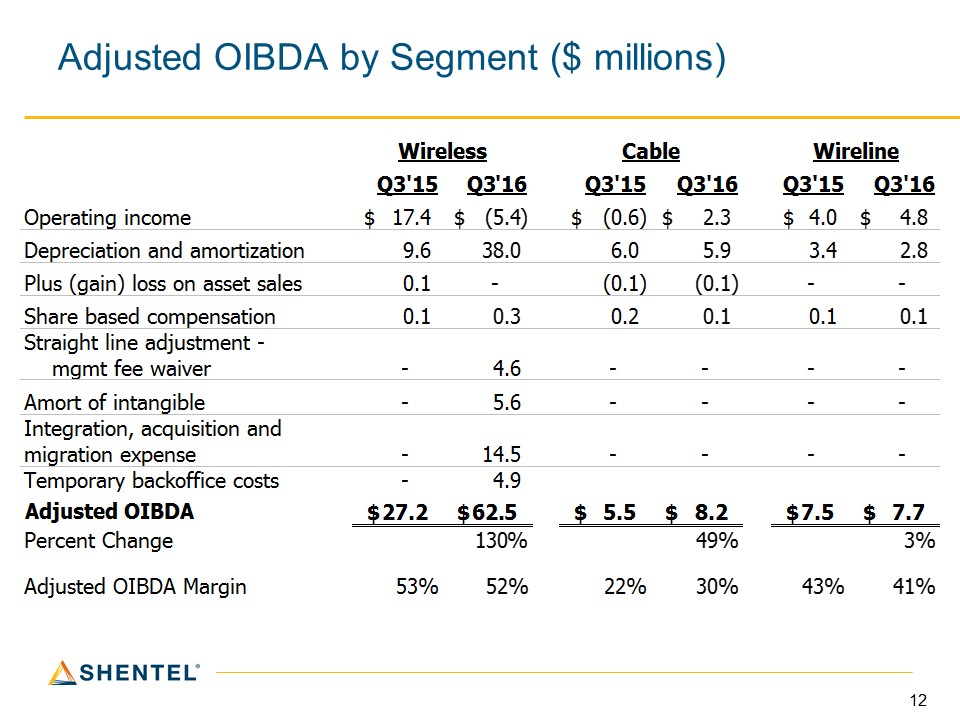
Adjusted OIBDA by Segment ($ millions)
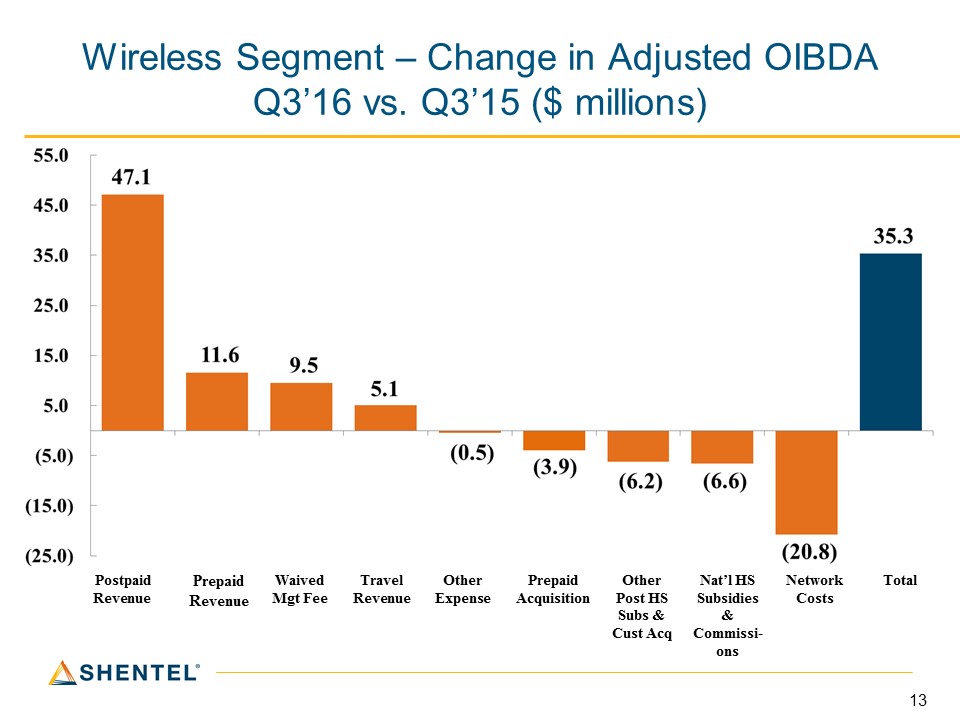
Wireless Segment – Change in Adjusted OIBDA Q3’16 vs. Q3’15 ($ millions) Postpaid Revenue Prepaid Revenue Waived Mgt Fee Travel Revenue Other Expense Prepaid Acquisition Other Post HS Subs & Cust Acq Nat’l HS Subsidies & Commissi-ons Network Costs Total

Cable Segment – Change in Adjusted OIBDA Q3’16 vs. Q3’15 ($ millions)

Earle MacKenzieEVP and COO
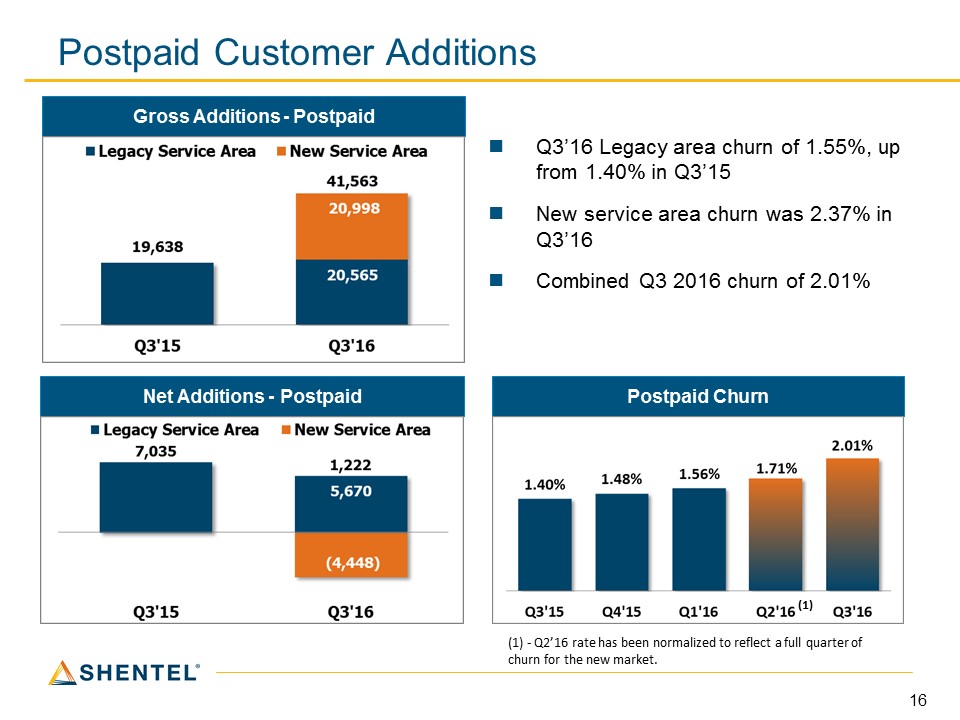
Postpaid Customer Additions Net Additions - Postpaid Gross Additions - Postpaid Q3’16 Legacy area churn of 1.55%, up from 1.40% in Q3’15New service area churn was 2.37% in Q3’16Combined Q3 2016 churn of 2.01% Postpaid Churn (1) (1) - Q2’16 rate has been normalized to reflect a full quarter of churn for the new market.
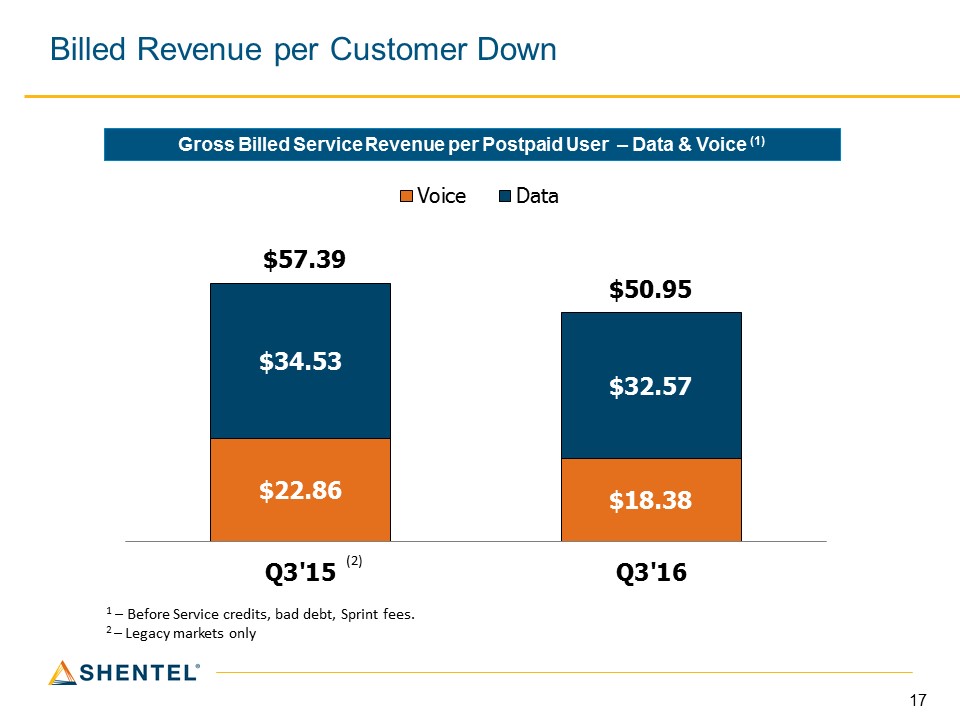
Billed Revenue per Customer Down Gross Billed Service Revenue per Postpaid User – Data & Voice (1) 1 – Before Service credits, bad debt, Sprint fees.2 – Legacy markets only (2)

PCS Prepaid Statistics Gross Additions (000s) Cumulative Customers (000s)
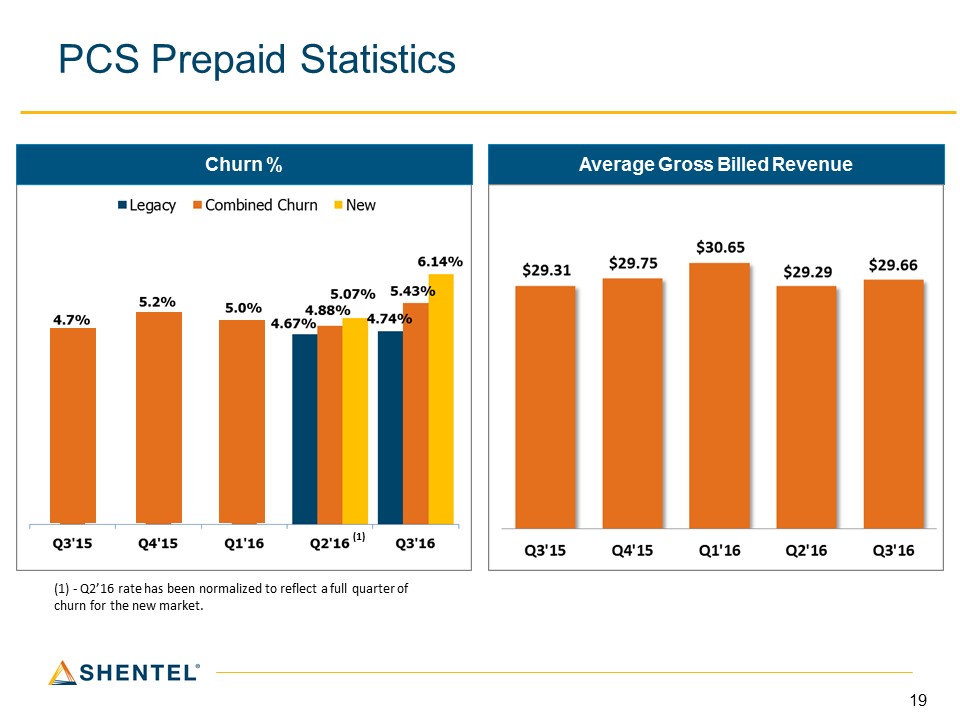
PCS Prepaid Statistics Churn % Average Gross Billed Revenue (1) - Q2’16 rate has been normalized to reflect a full quarter of churn for the new market. (1)

Network Enhancements – nTelos Footprint 220 363 186 148
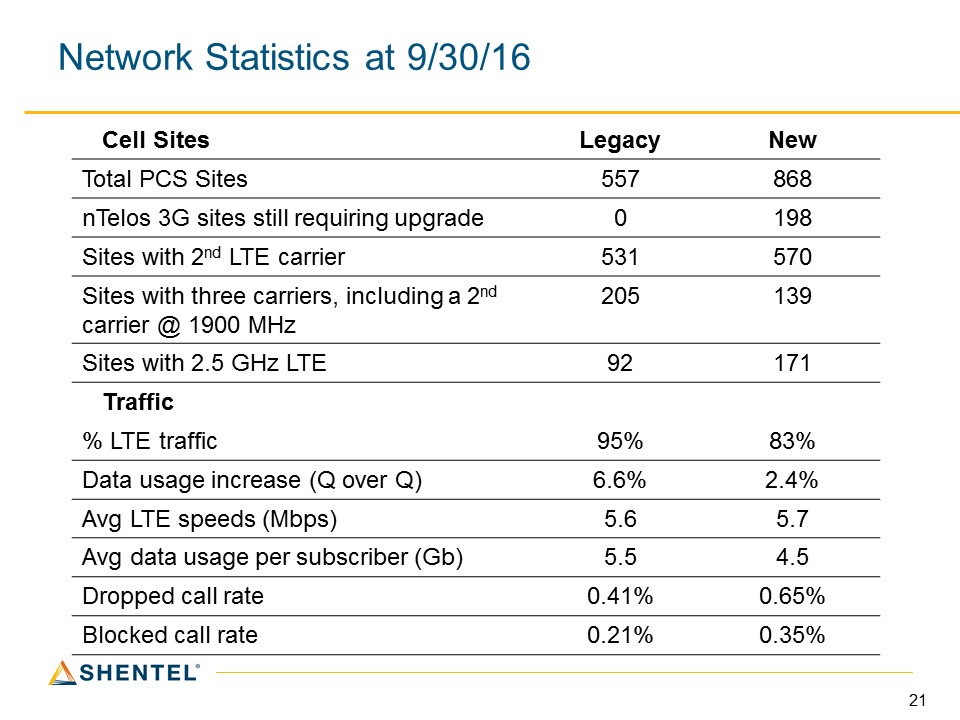
Network Statistics at 9/30/16 Cell Sites Legacy New Total PCS Sites 557 868 nTelos 3G sites still requiring upgrade 0 198 Sites with 2nd LTE carrier 531 570 Sites with three carriers, including a 2nd carrier @ 1900 MHz 205 139 Sites with 2.5 GHz LTE 92 171 Traffic % LTE traffic 95% 83% Data usage increase (Q over Q) 6.6% 2.4% Avg LTE speeds (Mbps) 5.6 5.7 Avg data usage per subscriber (Gb) 5.5 4.5 Dropped call rate 0.41% 0.65% Blocked call rate 0.21% 0.35%
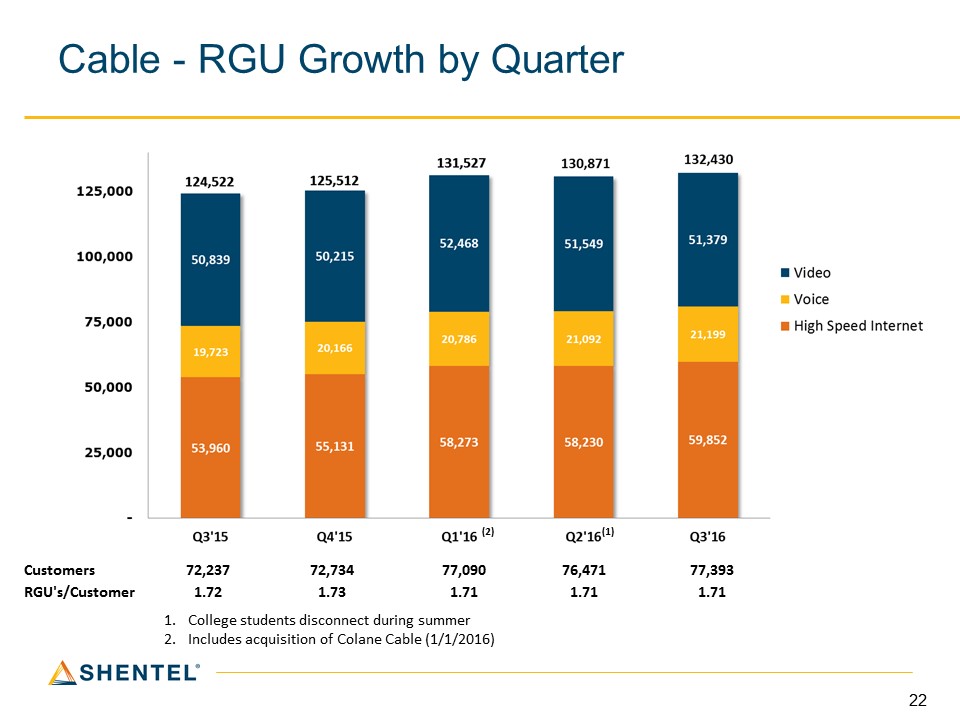
Cable - RGU Growth by Quarter Customers 72,237 72,734 77,090 76,471 77,393 RGU's/Customer 1.72 1.73 1.71 1.71 1.71 College students disconnect during summerIncludes acquisition of Colane Cable (1/1/2016) (1) (2)
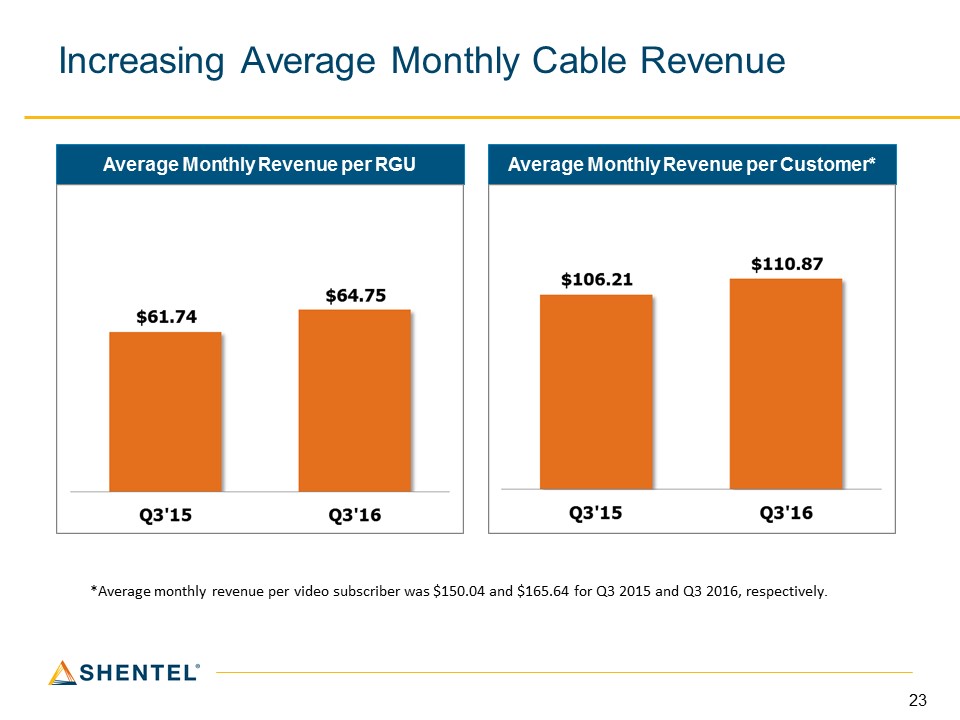
Increasing Average Monthly Cable Revenue Average Monthly Revenue per RGU Average Monthly Revenue per Customer* *Average monthly revenue per video subscriber was $150.04 and $165.64 for Q3 2015 and Q3 2016, respectively.

Key Operational Results – Cable (1)- Excludes cable operations in Shenandoah County, VA which are included in the Wireline segment. (2)- Wireline segment includes approximately 16k homes passed, 5.3k video customers, and 0.9k cable modem customers (2)
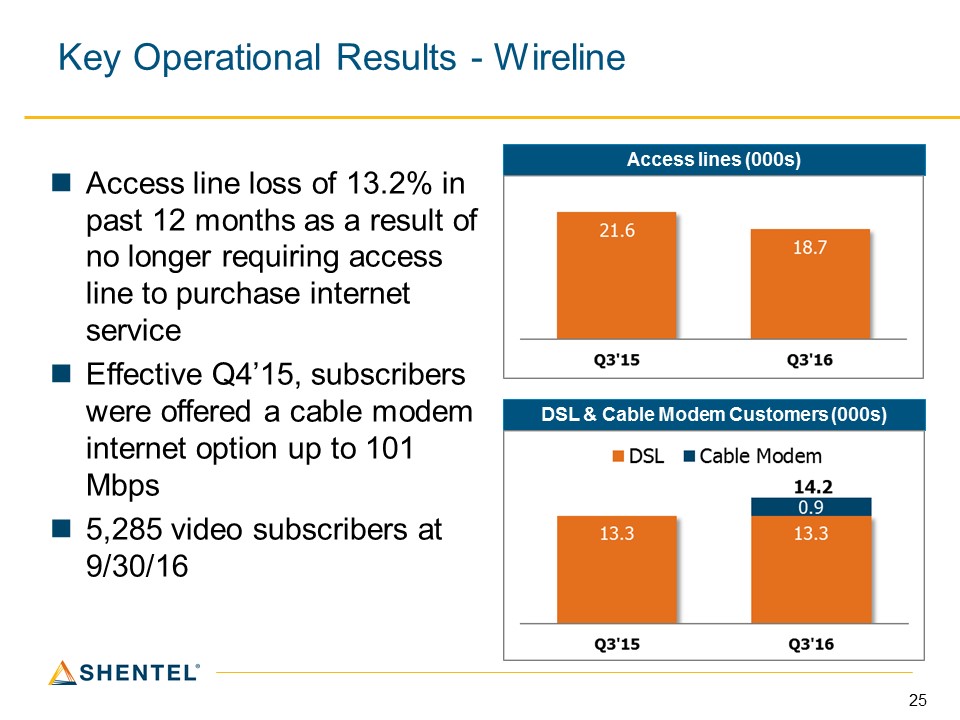
Key Operational Results - Wireline Access line loss of 13.2% in past 12 months as a result of no longer requiring access line to purchase internet serviceEffective Q4’15, subscribers were offered a cable modem internet option up to 101 Mbps5,285 video subscribers at 9/30/16 Access lines (000s) DSL & Cable Modem Customers (000s)
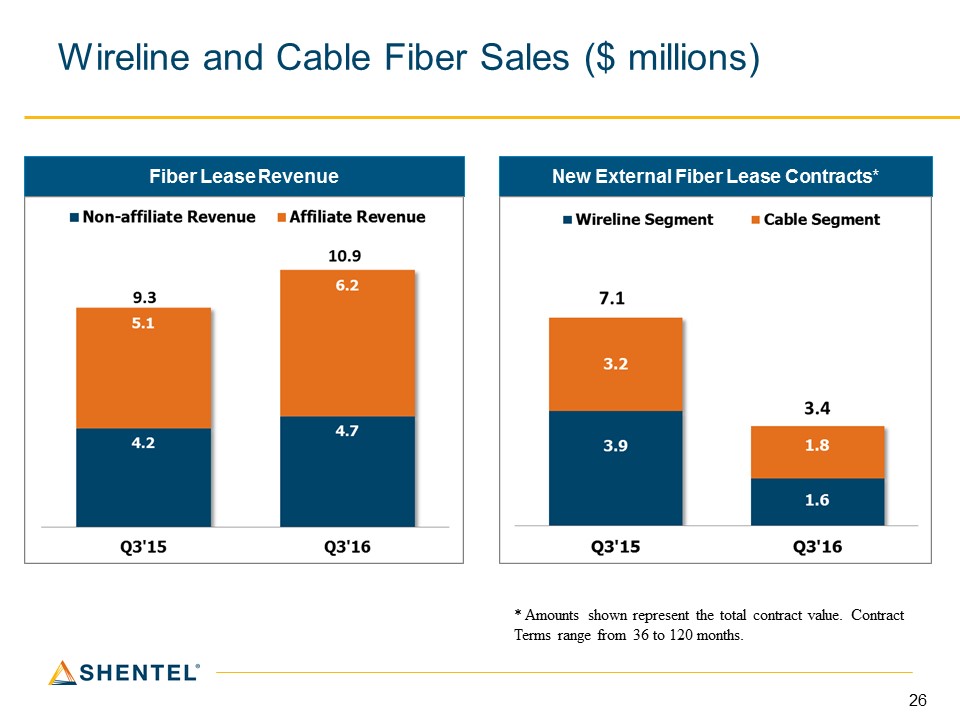
Wireline and Cable Fiber Sales ($ millions) Fiber Lease Revenue New External Fiber Lease Contracts* * Amounts shown represent the total contract value. Contract Terms range from 36 to 120 months.

Investing in the Future Capex Spending ($ millions) 2016 Capex Spending:56% Upgrades and Expansion of nTelos network15% Network Expansion14% Additional Network Capacity8% Network Maintenance7% Success-Based

Q&A
Appendix

Non-GAAP Financial Measures – Billed Revenue per Prepaid & Postpaid Subscriber Calculation of Billed revenue per subscriber = Gross billed revenue / Average subscribers / 3 months
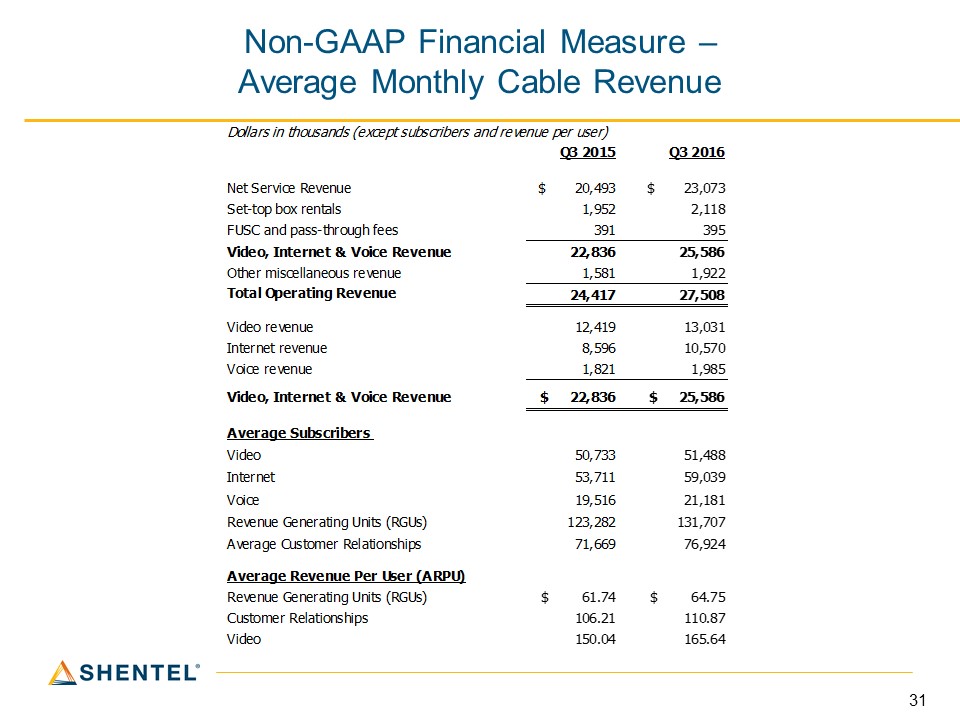
Non-GAAP Financial Measure – Average Monthly Cable Revenue

Key Operational Results – Mobile Company Mobile Tower Revenue ($ millions) Towers and Leases