Attached files
| file | filename |
|---|---|
| 8-K - 8-K - Atlantic Capital Bancshares, Inc. | acb-form8xkinvestorpresent.htm |

1
Atlantic Capital Bancshares, Inc. (ACBI)
Investor Presentation
November 3, 2016

Forward-Looking Statements
This presentation contains forward-looking statements within the meaning of section 27A of the Securities Act of 1933, as amended, and
section 21E of the Securities Exchange Act of 1934, as amended. These forward-looking statements reflect our current views with respect
to, among other things, future events and our financial performance. These statements are often, but not always, made through the use of
words or phrases such as “may,” “should,” “could,” “predict,” “potential,” “believe,” “will likely result,” “expect,” “continue,” “will,” “anticipate,”
“seek,” “estimate,” “intend,” “plan,” “projection,” “would” and “outlook,” or the negative version of those words or other comparable of a
future or forward-looking nature. These forward-looking statements are not historical facts, and are based on current expectations,
estimates and projections about our industry, management’s beliefs and certain assumptions made by management, many of which, by
their nature, are inherently uncertain and beyond our control. Accordingly, we caution you that any such forward-looking statements are not
guarantees of future performance and are subject to risks, assumptions and uncertainties that are difficult to predict. Although we believe
that the expectations reflected in these forward-looking statements are reasonable as of the date made, actual results may prove to be
materially different from the results expressed or implied by the forward-looking statements.
The following risks, among others, could cause actual results to differ materially from the anticipated results or other expectations
expressed in the forward-looking statements: (1) the expected growth opportunities and cost savings from the transaction with First Security
Group, Inc. (“First Security”) may not be fully realized or may take longer to realize than expected; (2) revenues following the transaction
with First Security and recent branch sales may be lower than expected as a result of deposit attrition, increased operating costs, customer
loss or business disruption; (3) diversion of management time on merger related issues; (4) changes in asset quality and credit risk; (5) the
cost and availability of capital; (6) customer acceptance of the combined company’s products and services; (7) customer borrowing,
repayment, investment and deposit practices; (8) the introduction, withdrawal, success and timing of business initiatives; (9) the impact,
extent, and timing of technological changes; (10) severe catastrophic events in our geographic area; (11) a weakening of the economies in
which the combined company will conduct operations may adversely affect its operating results; (12) the U.S. legal and regulatory
framework, including those associated with the Dodd-Frank Wall Street Reform and Consumer Protection Act could adversely affect the
operating results of the combined company; (13) the interest rate environment may compress margins and adversely affect net interest
income; (14) changes in trade, monetary and fiscal policies of various governmental bodies and central banks could affect the economic
environment in which we operate; (15) our ability to determine accurate values of certain assets and liabilities; (16) adverse behaviors in
securities, public debt, and capital markets, including changes in market liquidity and volatility; (17) our ability to anticipate interest rate
changes correctly and manage interest rate risk presented through unanticipated changes in our interest rate risk position and/or short- and
long-term interest rates; (18) unanticipated changes in our liquidity position, including but not limited to our ability to enter the financial
markets to manage and respond to any changes to our liquidity position; (19) adequacy of our risk management program; (20) increased
costs associated with operating as a public company; (21) competition from other financial services companies in the companies’ markets
could adversely affect operations; and (22) other factors described in Atlantic Capital’s reports filed with the Securities and Exchange
Commission and available on the SEC’s website (www.sec.gov).
2

Non-GAAP Financial Information
Statements included in this presentation include non-GAAP financial measures and should be read long with the accompanying tables,
which provide a reconciliation of non-GAAP financial measures to GAAP financial measures. Atlantic Capital management uses non-GAAP
financial measures, including: (i) operating net income; (ii) operating non-interest expense; (iii) operating provision for loan losses, (iv)
taxable equivalent net interest margin, (v) efficiency ratio (vi) operating return on assets; (vii) operating return on equity: (viii) tangible
common equity and (ix) deposits excluding deposits assumed in branch sales, in its analysis of the Company's performance.
Management believes that non-GAAP financial measures provide a greater understanding of ongoing performance and operations, and
enhance comparability with prior periods. Non-GAAP financial measures should not be considered as an alternative to any measure of
performance or financial condition as determined in accordance with GAAP, and investors should consider Atlantic Capital’s performance
and financial condition as reported under GAAP and all other relevant information when assessing the performance or financial condition of
the Company. Non-GAAP financial measures have limitations as analytical tools, and investors should not consider them in isolation or as a
substitute for analysis of the results or financial condition as reported under GAAP. Non-GAAP financial measures may not be comparable
to non-GAAP financial measures presented by other companies.
3

Proprietary & Confidential
Overview
Atlantic Capital was organized in 2006 and completed an initial equity capital raise of
$125 million in 2007
Focused on banking:
• Small to mid-sized enterprises with revenues up to $250 million
• Highly-select group of institutional caliber commercial real estate developers and
investors
• Principals of our commercial clients, professionals and their practices
Differentiated by providing superior expertise, competitive capabilities, and high
touch service delivery
Completed acquisition of First Security on October 31, 2015
• Public market liquidity and value by listing shares on NASDAQ
• Geographic diversification into Eastern Tennessee
• Business mix diversification
Sold 7 offices in Eastern Tennessee as part of repositioning of First Security’s retail
business
• Closed in 2nd quarter of 2016
• Closed 2 additional offices in the 3rd quarter of 2016
4

Proprietary & Confidential
Atlantic Capital Strategy
Become a premier southeastern business and
private banking company
Investing in people and
capabilities to accelerate
organic growth and build
profitability
Results are evidence of
meaningful progress
Attractive interest rate risk
position
Completed acquisition of First
Security on October 31, 2015
Ongoing evaluation of new
market expansion through
mergers and acquisitions and
de novo entry
Patient and disciplined
approach with focus on
shareholder value
Accelerated Organic Growth Strategic Expansion
5
Proprietary & Confidential
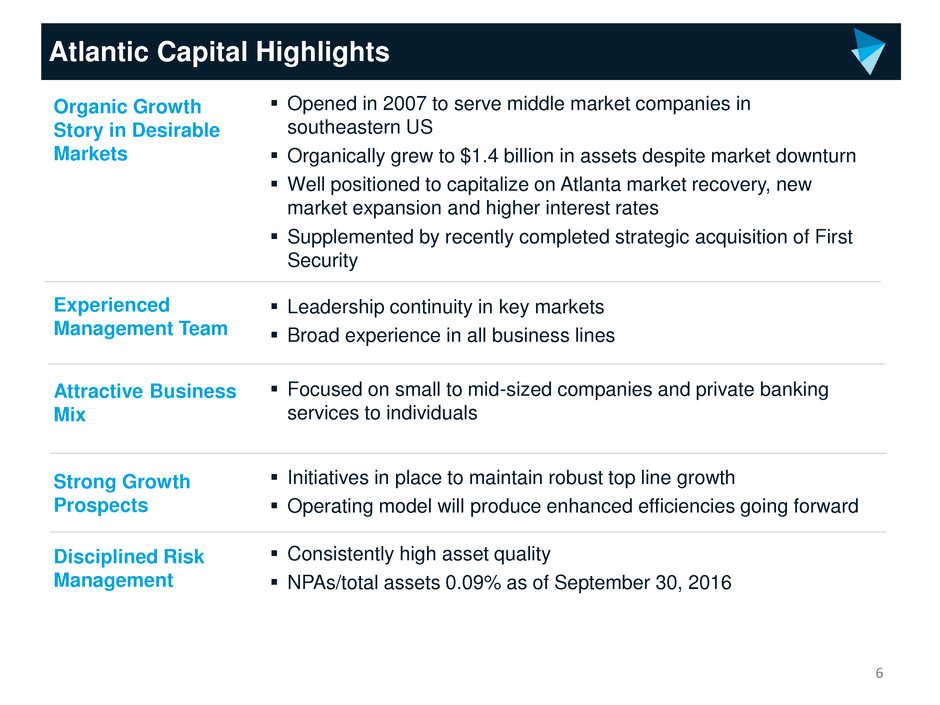
Atlantic Capital Highlights
Opened in 2007 to serve middle market companies in
southeastern US
Organically grew to $1.4 billion in assets despite market downturn
Well positioned to capitalize on Atlanta market recovery, new
market expansion and higher interest rates
Supplemented by recently completed strategic acquisition of First
Security
Leadership continuity in key markets
Broad experience in all business lines
Focused on small to mid-sized companies and private banking
services to individuals
Initiatives in place to maintain robust top line growth
Operating model will produce enhanced efficiencies going forward
Consistently high asset quality
NPAs/total assets 0.09% as of September 30, 2016
Organic Growth
Story in Desirable
Markets
Experienced
Management Team
Attractive Business
Mix
Strong Growth
Prospects
Disciplined Risk
Management
6

Legacy ACB
Loans Held for Investment
$1,046
$1,791
$1,887
$1,942 $2,008
Financial Highlights
Total loans held for investment increased $66 million, or 3.4%, to $2.01 billion from
June 30, 2016 and 12.1% from December 31, 2015
Total deposits increased $31 million, or 1.4%, to $2.19 billion from June 30, 2016
Dollars in millions
*excluding deposits sold in branch sales. This is a non-GAAP financial measure. Please see “Non-GAAP Reconciliation” on page 21 for more details.
Deposits* Total Assets
7
Combined Bank
$1,382
$2,639 $2,725
$2,808
$2,761
$1,129
$2,049
$2,085
$2,158 $2,189
Q3
2015
Q4
2015
Q1
2016
Q2
2016
Q3
2016
Q3
2015
Q4
2015
Q1
2016
Q2
2016
Q3
2016
Q3
2015
Q4
2015
Q1
2016
Q2
2016
Q3
2016

$0.13
$0.44
$0.38
$0.55
$0.62
$0.14 $0.15 $0.16
Q1 Q2 Q3
2016 2016 2016
Financial Highlights
Dollars in thousands
*Operating noninterest income, operating diluted earnings and efficiency ratio are non-GAAP financial measures that exclude merger-related expenses
and net gain on sale of branches. Please see “Non-GAAP Reconciliation” on page 21 for more details.
$2,797 $2,888
$3,875
$5,342
$9,399
$4,420
$4,995
$4,002
64.2%
73.5% 75.9%
69.1% 68.8%
75.2% 72.0% 71.6%
2011 2012 2013 2014 2015
8
2.99%
2.75% 2.75%
2.85%
2.98%
3.26%
3.05%
3.12%
3.00%
3.12%
3.00%
Q1 Q2 Q3
2016 2016 2016
2011 2012 2013 2014 2015
excludes purchase accounting adjustments
Diluted Earnings Per Share – Operating* Net Interest Margin
Operating Noninterest Income* Efficiency Ratio*
Q1 Q2 Q3
2016 2016 2016
2011 2012 2013 2014 2015
2011 2012 2013 2014 2015
Q1 Q2 Q3
2016 2016 2016

1.43%
-0.32%
0.02%
-0.01%
0.05%
0.35%
0.00% 0.06%
0.71%
0.43%
0.36%
0.12%
0.40%
0.08% 0.07% 0.09%
Financial Highlights
1.39% 1.44%
1.32%
1.10% 1.06%
0.93% 0.95% 0.92%
9
Non-Performing Assets / Total Assets Non-Performing Loans / Total Loans
Net Charge Offs / Total Average Loans Allowance for Loan Losses / Total Loans
0.79%
0.49%
0.36%
0.00%
0.45%
0.02% 0.05% 0.04%
YTD 2016:
0.13%
Q1 Q2 Q3
2016 2016 2016
2011 2012 2013 2014 2015 Q1 Q2 Q3
2016 2016 2016
Q1 Q2 Q3
2016 2016 2016
Q1 Q2 Q3
2016 2016 2016
2011 2012 2013 2014 2015
2011 2012 2013 2014 2015 2011 2012 2013 2014 2015
Asset Sensitivity
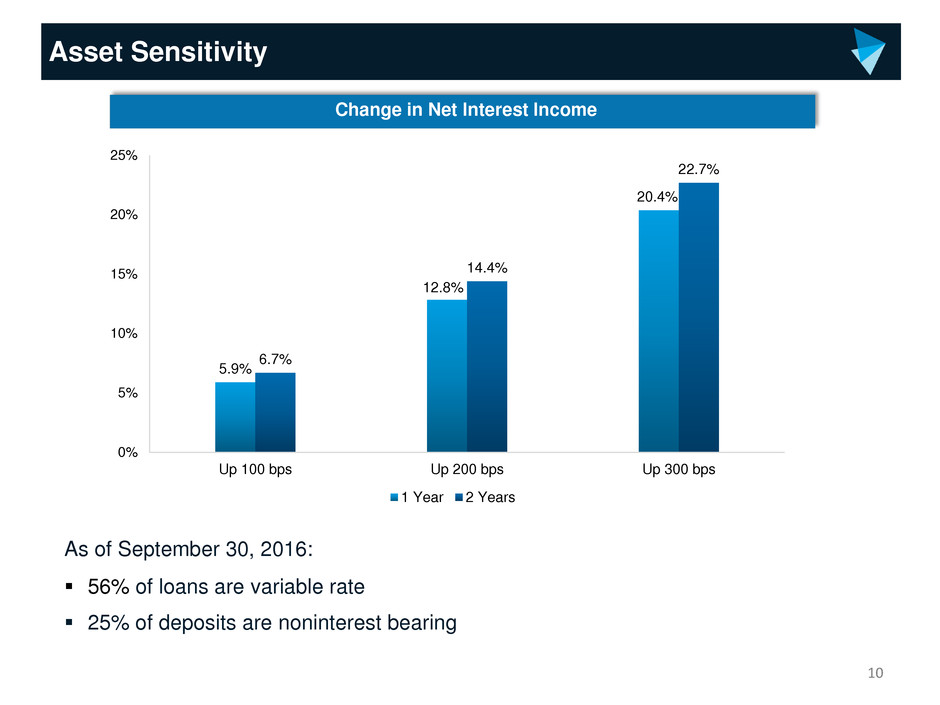
Change in Net Interest Income
10
5.9%
12.8%
20.4%
6.7%
14.4%
22.7%
0%
5%
10%
15%
20%
25%
Up 100 bps Up 200 bps Up 300 bps
1 Year 2 Years
As of September 30, 2016:
56% of loans are variable rate
25% of deposits are noninterest bearing
Diversified Loan Mix
Dollars in thousands
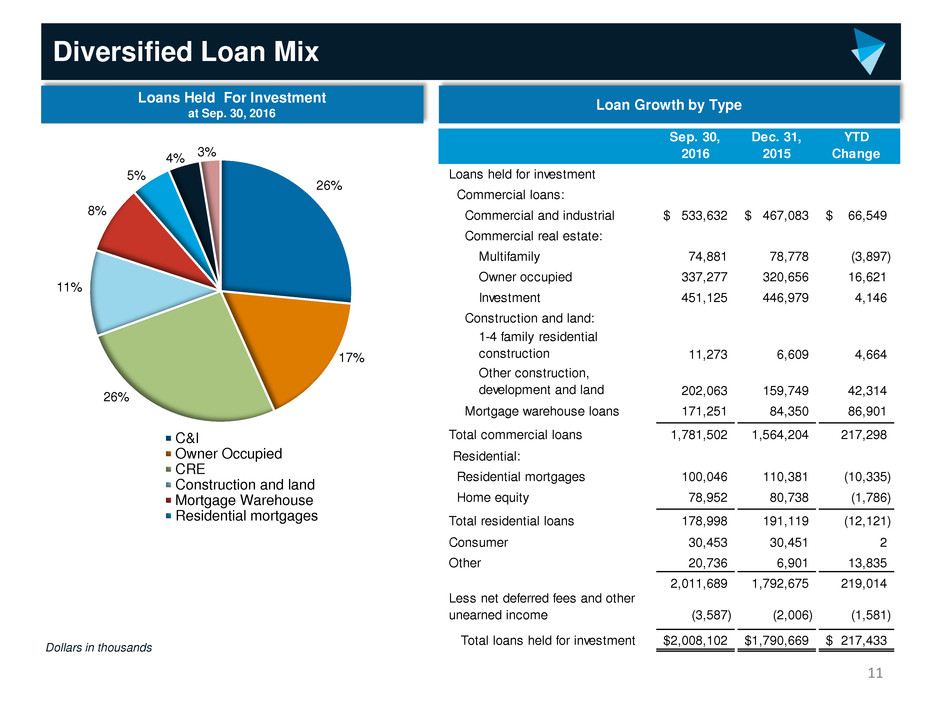
Loans Held For Investment
at Sep. 30, 2016
11
Loan Growth by Type
Sep. 30,
2016
Dec. 31,
2015
YTD
Change
Loans held for investment
Commercial loans:
Commercial and industrial 533,632$ 467,083$ 66,549$
Commercial real estate:
Multifamily 74,881 78,778 (3,897)
Owner occupied 337,277 320,656 16,621
Investment 451,125 446,979 4,146
Construction and land:
1-4 family residential
construction 11,273 6,609 4,664
Other construction,
development and land 202,063 159,749 42,314
Mortgage warehouse loans 171,251 84,350 86,901
Total commercial loans 1,781,502 1,564,204 217,298
Residential:
Residential mortgages 100,046 110,381 (10,335)
Home equity 78,952 80,738 (1,786)
Total residential loans 178,998 191,119 (12,121)
Consumer 30,453 30,451 2
Other 20,736 6,901 13,835
2,011,689 1,792,675 219,014
(3,587) (2,006) (1,581)
Total loans held for investment 2,008,102$ 1,790,669$ 217,433$
Less net deferred fees and other
unearned income
C&I
Owner Occupied
CRE
Construction and land
Mortgage Warehouse
Residential mortgages
26%
17%
11%
8%
5%
4%
26%
3%
Attractive Deposit Mix
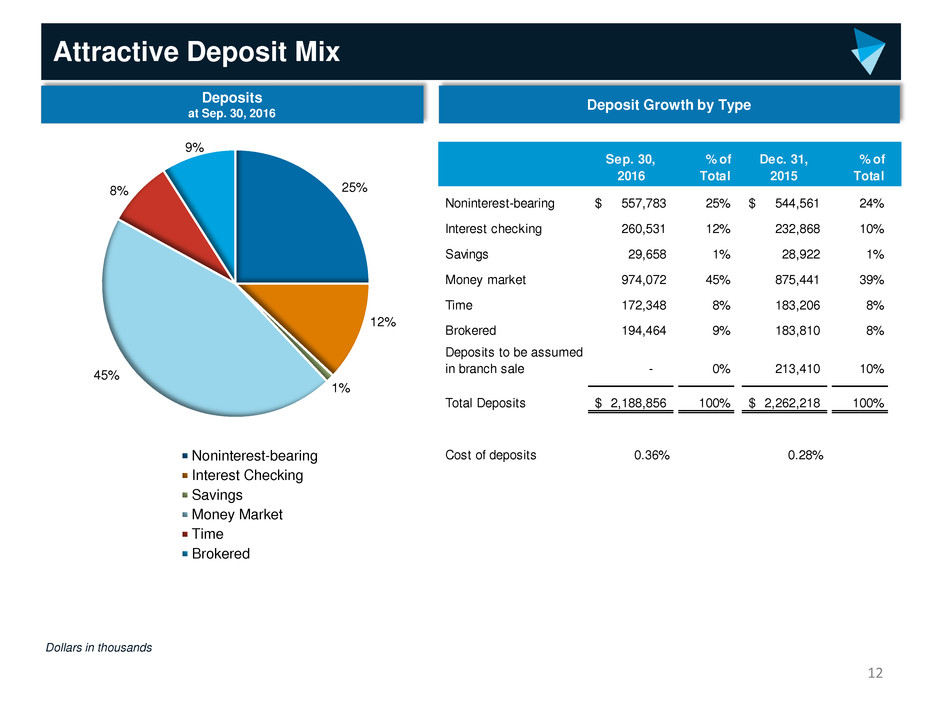
25%
12%
1%
45%
8%
9%
Noninterest-bearing
Interest Checking
Savings
Money Market
Time
Brokered
12
Sep. 30,
2016
% of
Total
Dec. 31,
2015
% of
Total
Noninterest-bearing 557,783$ 25% 544,561$ 24%
Interest checking 260,531 12% 232,868 10%
Savings 29,658 1% 28,922 1%
Money market 974,072 45% 875,441 39%
Time 172,348 8% 183,206 8%
Brokered 194,464 9% 183,810 8%
Deposits to be assumed
in branch sale - 0% 213,410 10%
Total Deposits 2,188,856$ 100% 2,262,218$ 100%
Cost of deposits 0.36% 0.28%
Deposits
at Sep. 30, 2016
Deposit Growth by Type
Dollars in thousands

First Security Acquisition Rationale
NASDAQ listing
Significant new capital including DTA, equity private placement at premium to
TBV, and subordinated notes
More diverse shareholder base
18 offices providing core funding along commercially attractive I-75 corridor
Atlanta: High density of small businesses and commercial enterprises
Chattanooga/Knoxville: Diversified manufacturing and service economies
Atlantic Capital’s Strengths: C&I, CRE and Private Banking; Corporate
Treasury and Private Banking Deposits
First Security’s Strengths: Small Business and Specialty Commercial
Lending; Small Business and Retail Deposit Channel
Integration plan ensures management continuity with local market presence
and significant domain expertise
Significant cost saving and revenue enhancement opportunities
Retains a significant portion of First Security NOLs
Sustains robust loan origination trends and opportunities in strategic markets
Sound credit quality profile limits balance sheet risk
Complementary interest rate risk positions
Public Company
Value and Liquidity
For Shareholders
Geographic
Expansion
Broader Business
Mix
Compelling
Financial
Opportunity
13

Creates a leading middle market commercial bank operating throughout the southeast
Attractive Market Demographics
Knoxville, TN MSA
• Total Population 2014: Approximately 855,000
• 2014-2019 Population Growth: 3.1% projected
• Median Household Income 2014: $44,405
• Total Deposits in Market: Approximately $14.7 billion
Source: Nielsen, SNL Financial
14
Atlanta-Sandy Springs-Roswell, GA MSA
• Total Population 2014: Approximately 5.6 million
• 2014-2019 Population Growth: 6.4% projected
• Median Household Income 2014: $52,533
• Total Deposits in Market: Approximately $130 billion
Charlotte, NC
• Total Population 2014: Approximately 544,000
• 2014-2019 Population Growth: 4.0% projected
• Median Household Income 2014: $41,704
• Total Deposits in Market: Approximately $8.5 billion
Chattanooga, TN-GA MSA includes Dalton
and Cleveland
• Total Population 2014: Approximately 544,000
• 2014-2019 Population Growth: 4.0% projected
• Median Household Income 2014: $41,704
• Total Deposits in Market: Approximately $8.5 billion
In 3rd quarter of 2016, announced intention
to open a corporate office in Charlotte, NC

2016 Priorities
15
Complete integration of the acquired First Security businesses including the
realization of estimated cost savings
Continue the trajectory of growth and profit improvement in legacy Atlantic
Capital businesses
Reposition legacy First Security businesses for improved performance
Consider further geographic expansion, particularly de novo or team lift-out
opportunities in other attractive metropolitan markets

The New Atlantic Capital
Three attractive growth markets
Focus on corporate, business and private banking
Solid relationship deposit funding
Sound credit quality
Positioned for interest rate increase
Pursuing disciplined strategic expansion
with a focus on shareholder value
Organic
Growth
Strategic
Opportunities
16

APPENDIX

Management Biographies
Name and Title Age Experience
Patrick Oakes
Executive Vice President &
Chief Financial Officer
48 • Former Chief Financial Officer of Square 1 Financial, Inc.
• Former Executive Vice President and Chief Financial Officer of Encore Bancshares, Inc.
• Former Senior Vice President and Treasurer for Sterling Bancshares, Inc.
• Chartered Financial Analyst
Douglas Williams
Chief Executive Officer
58 • Chief Executive Officer of Atlantic Capital since its inception
• Former Managing Director and Head of Wachovia Corporation’s International Corporate Finance Group
• Held numerous roles within Wachovia, including Executive Vice President and Head of the Global
Corporate Banking Division; Chief Risk Officer for all corporate, institutional, and wholesale banking
activities; Executive Vice President and Co-Head of Wachovia’s Capital Markets Division and Executive
Vice President and Head of Wachovia’s US Corporate Banking Division
• Chairman of the Community Depository Institutions Advisory Council (CDIAC) of the Federal Reserve
Bank of Atlanta and its representative to the CDIAC of the Federal Reserve Board of Governors
• Serves on the Boards of the Metro Atlanta Chamber of Commerce, the Georgia Chamber of Commerce,
and the YMCA of Metropolitan Atlanta and the High Museum of Art and is a Member of the Buckhead
Coalition
Michael Kramer
President,
Chief Operating Officer
58 • Chief Executive Officer and President of First Security since December and Chief Executive Officer of
FSGBank since 2011
• Former Managing Director of Ridley Capital Group
• Former Director, Chief Executive Officer and President of Ohio Legacy Corporation
• Former Chief Operating Officer and Chief Technology Officer of Integra Bank Corporation
• Serves on the Boards of Chattanooga Chamber of Commerce, Chattanooga United Way, The
Tennessee Bankers Association and the Chattanooga Young Life Committee
18

ACBI Historical Balance Sheet
19
September 30, June 30, December 31, September 30,
(in thousands, except share and per share data) 2016 2016 2015 2015
ASSETS
Cash and due from banks $ 44,563 $ 40,309 $ 45,848 $ 33,477
Interest-bearing deposits in banks 75,750 239,387 130,900 90,695
Other short-term investments 23,159 20,548 26,137 36,629
Cash and cash equivalents 143,472 300,244 202,885 160,801
Securities available-for-sale 348,484 328,370 346,221 127,168
Other investments 26,370 22,575 8,034 3,011
Loans held for sale 46,600 29,061 95,465 –
Loans held for investment 2,008,102 1,942,137 1,790,669 1,046,437
Less: allowance for loan losses (18,534) (18,377) (18,905) (11,862)
Loans held for investment, net 1,989,568 1,923,760 1,771,764 1,034,575
Branch premises held for sale 5,201 – 7,200 –
Premises and equipment, net 15,213 21,770 23,145 3,138
Bank owned life insurance 61,766 61,378 60,608 30,479
Goodwill and intangible assets, net 30,071 31,674 35,232 1,259
Other real estate owned 1,727 951 1,982 27
Other assets 92,772 88,039 86,244 21,240
Total assets $ 2,761,244 $ 2,807,822 $ 2,638,780 $ 1,381,698
LIABILITIES AND SHAREHOLDERS' EQUITY
Deposits:
Noninterest-bearing demand $ 557,783 $ 592,043 $ 544,561 $ 328,065
Interest-bearing checking 260,531 231,091 232,868 135,350
Savings 29,658 30,839 28,922 321
Money market 974,072 913,094 875,441 550,879
Time 172,348 178,615 183,206 15,434
Brokered deposits 194,464 212,623 183,810 98,559
Deposits to be assumed in branch sale – – 213,410 –
Total deposits 2,188,856 2,158,305 2,262,218 1,128,608
Federal funds purchased and securities sold under agreements to repurchase – 14,047 11,931 –
Federal Home Loan Bank borrowings 170,000 240,000 – 43,000
Long-term debt 49,324 49,281 49,197 49,226
Other liabilities 44,601 42,123 27,442 11,055
Total liabilities 2,452,781 2,503,756 2,350,788 1,231,889
SHAREHOLDERS' EQUITY
Preferred stock, no par value; 10,000,000 shares authorized; no shares issued and outstanding
as of September 30, 2016, June 30, 2016, December 31, 2015, and September 30, 2015 – – – –
Common stock, no par value; 100,000,000 shares authorized;
24,950,099, 24,750,163, 24,425,546, and 13,562,125 shares issued and outstanding as of
September 30, 2016, June 30, 2016, December 31, 2015, and September 30, 2015, 290,835 289,353 286,367 136,941
Retained earnings 14,927 11,219 3,141 11,302
Accumulated other comprehensive income (loss) 2,701 3,494 (1,516) 1,566
Total shareholders’ equity 308,463 304,066 287,992 149,809
TOTAL LIABILITIES AND SHAREHOLDERS' EQUITY $ 2,761,244 $ 2,807,822 $ 2,638,780 $ 1,381,698
Atlantic Capital Bancshares, Inc.
Consolidated Balance Sheets (unaudited)

ACBI Historical Income Statement
($ in thousands)
20
Atlantic Capital Bancshares, Inc.
Consolidated Statements of Income (unaudited)
(in thousands except per share data)
September
30, 2016
June 30,
2016
March 31,
2016
December
31, 2015
September
30, 2015
September
30, 2016
September
30, 2015
INTEREST INCOME
Loans, including fees $ 20,511 $ 20,282 $ 19,625 $ 16,688 $ 9,423 $ 60,418 $ 27,874
Investment securities - available-for-sale 1,293 1,327 1,601 1,224 664 4,221 2,077
Interest and dividends on other interest‑earning assets 491 507 273 328 247 1,271 776
Total interest income 22,295 22,116 21,499 18,240 10,334 65,910 30,727
INTEREST EXPENSE
Interest on deposits 1,956 1,841 1,673 1,355 751 5,470 2,262
Interest on Federal Home Loan Bank advances 133 147 44 7 52 324 283
Interest on federal funds purchased and securities sold under
agreements to repurchase 37 87 67 10 20 191 69
Interest on long-term debt 815 832 810 841 17 2,457 17
Other – – 38 79 – 38 –
Total interest expense 2,941 2,907 2,632 2,292 840 8,480 2,631
NET INTEREST INCOME BEFORE PROVISION FOR LOAN LOSSES 19,354 19,209 18,867 15,948 9,494 57,430 28,096
Provision for loan losses 463 777 368 7,623 (137) 1,608 412
NET INTEREST INCOME AFTER PROVISION FOR LOAN LOSSES 18,891 18,432 18,499 8,325 9,631 55,822 27,684
NONINTEREST INCOME
Service charges 1,270 1,392 1,498 1,265 521 4,160 1,348
Gains on sale of securities available-for-sale – 11 33 – 10 44 10
Gains on sale of other assets 71 31 48 103 – 150 –
Mortgage income 632 447 339 163 – 1,418 –
Trust income 361 386 314 192 – 1,061 –
Derivatives income 69 98 65 89 67 232 215
Bank owned life insurance 424 398 393 365 227 1,215 1,794
SBA lending activities 959 1,204 880 904 745 3,043 2,006
TriNet lending activities – 761 383 – – 1,144 –
Gains on sale of branches – 3,885 – – – 3,885 –
Other noninterest income 216 267 467 379 159 950 566
Total noninterest income 4,002 8,880 4,420 3,460 1,729 17,302 5,939
NONINTEREST EXPENSE
Salaries and employee benefits 10,059 10,420 10,555 9,661 4,859 31,034 14,437
Occupancy 1,235 1,274 1,100 907 419 3,609 1,263
Equipment and software 862 724 686 608 243 2,272 687
Professional services 442 760 748 1,020 208 1,950 613
Postage, printing and supplies 61 159 169 115 21 389 63
Communications and data processing 617 694 916 555 313 2,227 986
Marketing and business development 269 317 267 197 90 853 213
FDIC premiums 415 493 398 273 161 1,306 516
Merger and conversion costs 579 1,210 749 7,172 718 2,538 1,982
Amortization of intangibles 520 668 762 526 – 1,950 –
Other noninterest expense 2,237 2,224 1,916 2,205 639 6,377 1,934
Total noninterest expense 17,296 18,943 18,266 23,239 7,671 54,505 22,694
INCOME (LOSS) BEFORE PROVISION FOR INCOME TAXES 5,597 8,369 4,653 (11,454) 3,689 18,619 10,929
Provision for income taxes 1,889 3,222 1,722 (3,293) 1,463 6,833 4,087
NET INCOME (LOSS) $ 3,708 $ 5,147 $ 2,931 $ (8,161) $ 2,226 $ 11,786 $ 6,842
Net income (loss) per common share‑basic $ 0.15 $ 0.21 $ 0.12 $ (0.40) $ 0.16 $ 0.48 $ 0.51
Net income (loss) per common share‑diluted $ 0.15 $ 0.20 $ 0.12 $ (0.40) $ 0.16 $ 0.47 $ 0.49
Weighted average shares - basic 24,891,822 24,644,755 24,485,900 20,494,895 13,562,125 24,674,953 13,527,195
Weighted average shares - diluted 25,260,280 25,158,694 24,993,597 21,004,577 13,904,395 25,106,250 13,866,312
Nine months endedThree months ended
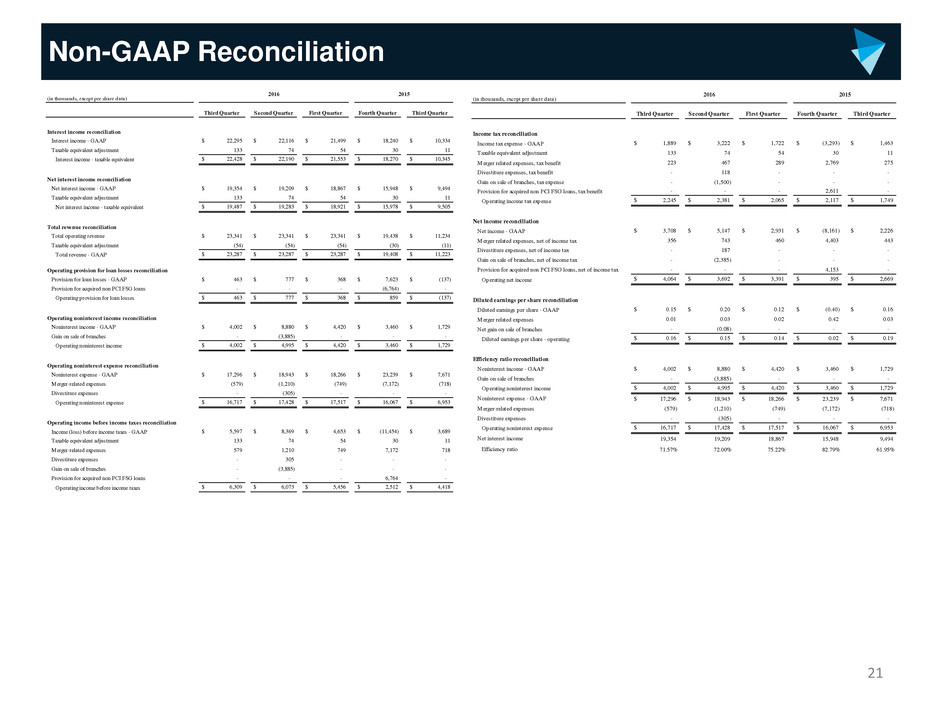
Non-GAAP Reconciliation
21
(in thousands, except per share data)
Third Quarter Second Quarter First Quarter Fourth Quarter Third Quarter
Income tax reconciliation
Income tax expense - GAAP $ 1,889 $ 3,222 $ 1,722 $ (3,293) $ 1,463
Taxable equivalent adjustment 133 74 54 30 11
Merger related expenses, tax benefit 223 467 289 2,769 275
Divestiture expenses, tax benefit - 118 - - -
Gain on sale of branches, tax expense - (1,500) - - -
Provision for acquired non PCI FSG loans, tax benefit - - - 2,611 -
Operating income tax expense $ 2,245 $ 2,381 $ 2,065 $ 2,117 $ 1,749
Net income reconciliation
Net income - GAAP $ 3,708 $ 5,147 $ 2,931 $ (8,161) $ 2,226
Merger related expenses, net of income tax 356 743 460 4,403 443
Divestiture expenses, net of income tax - 187 - - -
Gain on sale of branches, net of income tax - (2,385) - - -
Provision for acquired non PCI FSG loans, net of income tax - - - 4,153 -
Operating net income $ 4,064 $ 3,692 $ 3,391 $ 395 $ 2,669
Diluted earnings per share reconciliation
Diluted earnings per share - GAAP $ 0.15 $ 0.20 $ 0.12 $ (0.40) $ 0.16
Merger related expenses 0.01 0.03 0.02 0.42 0.03
Net gain on sale of branches - (0.08) - - -
Diluted earnings per share - operating $ 0.16 $ 0.15 $ 0.14 $ 0.02 $ 0.19
Efficiency ratio reconciliation
Noninterest income - GAAP $ 4,002 $ 8,880 $ 4,420 $ 3,460 $ 1,729
Gain on sale of branches - (3,885) - - -
Operating noninterest income $ 4,002 $ 4,995 $ 4,420 $ 3,460 $ 1,729
Noninterest expense - GAAP $ 17,296 $ 18,943 $ 18,266 $ 23,239 $ 7,671
Merger-related expenses (579) (1,210) (749) (7,172) (718)
Divestiture expenses - (305) - - -
Operating noninterest expense $ 16,717 $ 17,428 $ 17,517 $ 16,067 $ 6,953
Net interest income 19,354 19,209 18,867 15,948 9,494
Efficiency ratio 71.57% 72.00% 75.22% 82.79% 61.95%
2016 2015
(in thousands, except per share data)
Third Quarter Second Quarter First Quarter Fourth Quarter Third Quarter
Interest income reconciliation
Interest income - GAAP $ 22,295 $ 22,116 $ 21,499 $ 18,240 $ 10,334
Taxable equivalent adjustment 133 74 54 30 11
Interest income - taxable equivalent $ 22,428 $ 22,190 $ 21,553 $ 18,270 $ 10,345
Net interest income reconciliation
Net interest income - GAAP $ 19,354 $ 19,209 $ 18,867 $ 15,948 $ 9,494
Taxable equivalent adjustment 133 74 54 30 11
Net interest income - taxable equivalent $ 19,487 $ 19,283 $ 18,921 $ 15,978 $ 9,505
Total revenue reconciliation
Total operating revenue $ 23,341 $ 23,341 $ 23,341 $ 19,438 $ 11,234
Taxable equivalent adjustment (54) (54) (54) (30) (11)
Total revenue - GAAP $ 23,287 $ 23,287 $ 23,287 $ 19,408 $ 11,223
Operating provision for loan losses reconciliation
Provision for loan losses - GAAP $ 463 $ 777 $ 368 $ 7,623 $ (137)
Provision for acquired non PCI FSG loans - - - (6,764) -
Operating provision for loan losses $ 463 $ 777 $ 368 $ 859 $ (137)
Operating noninterest income reconciliation
Noninterest income - GAAP $ 4,002 $ 8,880 $ 4,420 $ 3,460 $ 1,729
Gain on sale of branches - (3,885) - - -
Operating noninterest income $ 4,002 $ 4,995 $ 4,420 $ 3,460 $ 1,729
Operating noninterest expense reconciliation
Noninterest expense - GAAP $ 17,296 $ 18,943 $ 18,266 $ 23,239 $ 7,671
Merger-related expenses (579) (1,210) (749) (7,172) (718)
Divestiture expenses - (305) - - -
Operating noninterest expense $ 16,717 $ 17,428 $ 17,517 $ 16,067 $ 6,953
Operating income before incom taxes reconciliation
Income (loss) before income taxes - GAAP $ 5,597 $ 8,369 $ 4,653 $ (11,454) $ 3,689
Taxable equivalent adjustment 133 74 54 30 11
Merger-related expenses 579 1,210 749 7,172 718
Divestiture expenses - 305 - - -
Gain on sale of branches - (3,885) - - -
Provision for acquired non PCI FSG loans - - - 6,764 -
Operating income before income taxes $ 6,309 $ 6,073 $ 5,456 $ 2,512 $ 4,418
2016 2015
