Attached files
| file | filename |
|---|---|
| 8-K - FORM 8-K - Square, Inc. | d234919d8k.htm |
Exhibit 99.1

BANG
Seattle, Washington
Q3 2016 Shareholder Letter
SQUARE.COM/INVESTORS
Third Quarter 2016 Highlights
| • | For the third consecutive quarter, we beat all our guided metrics and are raising 2016 guidance. |
| • | We continue to show year-over-year improvements in our key profitability metrics, building on the milestone achieved in the second quarter. |
| • | We are making our services faster and easier to use, launching Scheduled Deposit and Register Card on File, and improving our EMV transaction speed to 4.2 seconds. |
| • | We grew GPV from larger sellers 55% year over year and maintained our transaction revenue margin, demonstrating that larger sellers continue to come to Square for best-in-class services. |
Third Quarter 2016 Key Results
A reconciliation of non-GAAP metrics used in this letter to their nearest GAAP equivalents is provided at the end of this letter.
Adjusted EBITDA margin is calculated as Adjusted EBITDA divided by Adjusted Revenue.
2
| To Our Shareholders: | NOVEMBER 1, 2016 | |
|
We are pleased with our performance in the third quarter, demonstrated by continued revenue growth at scale and ongoing improvements in operating efficiency.
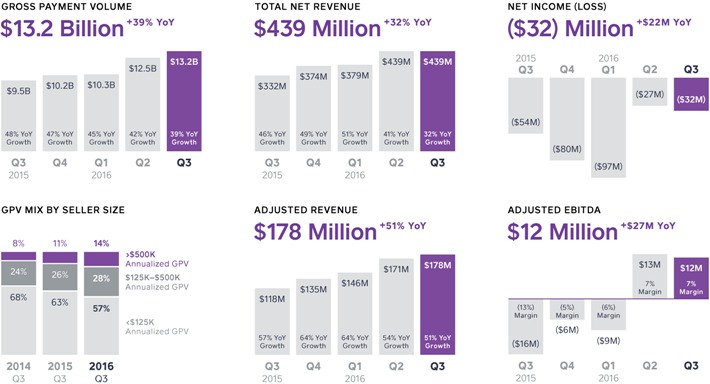
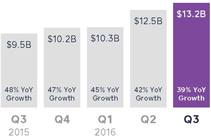
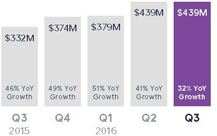
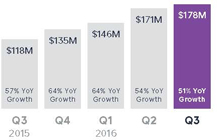
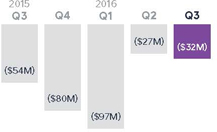
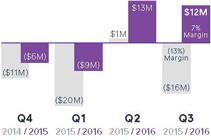
Gross Payment Volume (GPV) for the third quarter was $13.2 billion, up 39% year over year. Total net revenue was $439 million, up 32% year over year. Adjusted Revenue was $178 million, up 51% year over year. Net loss was $32 million, an improvement of $22 million on a year-over-year basis, and we achieved positive Adjusted EBITDA of $12 million. Third-quarter Adjusted EBITDA margin of 7% is an improvement of 20 points or $27 million on a year-over-year basis.
We launched several new features to make our services faster and easier to use.
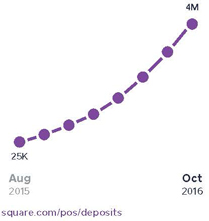
We recognize that time is valuable to sellers and buyers, which is why we prioritize speed and ease of use in our services. This quarter, we launched Scheduled Deposit to make it easier for our sellers to access their funds whenever they need them. A seller can now “set it and forget it” by selecting specific days of the week (including weekends and holidays) on which she would like to receive her funds instantly. Scheduled Deposit is an enhancement to Instant Deposit, which has been popular with sellers. Since the launch of Instant Deposit just over a year ago through this October, over 200,000 sellers have completed nearly 4 million instant deposits.
We launched Register Card on File to provide sellers the ability to safely store and charge their customers’ cards in Square Register. This enables sellers to create a faster and more seamless checkout experience at the point of sale for their most loyal customers. This feature was highly requested by our sellers.
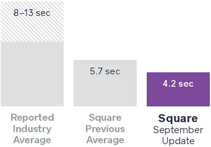
Our focus on speed also extends to our hardware design. The first anniversary of the EMV liability shift passed on October 1, and slow EMV processing speeds remain top of mind for buyers and sellers alike. Our integrated hardware, software, and payment processing put us in a unique position to make the checkout process faster. In September, we rolled out |
CUMULATIVE INSTANT DEPOSITS
|
3
| an update to our contactless and chip reader that improved average EMV transaction speed by 25% to 4.2 seconds from 5.7 seconds, compared to reported industry averages of 8 to 13 seconds. Our all-in-one system also allows Square sellers to begin accepting EMV chip-enabled cards in a matter of minutes—so our sellers’ customers won’t encounter the dreaded tape-covered chip card slot. This is important as over 70% of cards processed on Square are now EMV enabled.
This quarter, we also launched our contactless and chip reader in Australia. We estimate that nearly 80% of our sellers in Australia were not previously using a traditional card acceptance terminal, highlighting that existing payment solutions did not meet their business needs.
GPV from larger sellers grew 55% year over year; larger sellers continue to come to Square for best-in-class services.
GPV from larger sellers, whom we define as those who generate more than $125,000 in annualized GPV, grew 55% year over year, representing 43% of GPV in the third quarter of 2016. We continue to grow GPV from larger sellers and maintain overall transaction revenue margin for several reasons. First, as demonstrated by positive dollar-based retention across our entire seller base, many sellers grow when they join Square. Second, larger sellers switch to Square for the benefits of our entire ecosystem, including fully-featured point of sale software and capabilities such as APIs (Build with Square), mobility of hardware, and customer service. In fact, we believe leading with our unique capabilities and brand—not price—is what drives larger sellers to select Square.
For example, Casey Nickole first used Square to accept payments as a hair stylist in Seattle. When she opened her own business, BANG, she initially switched to another processor based on her bank’s referral, which quoted a lower headline rate. However, Casey quickly became frustrated because the point of sale did not communicate with her other business systems. This lack of integration created “two sets of everything” and required enormous amounts of Casey’s time to reconcile. She switched back to Square to run her entire business within one ecosystem, and she now uses Customer Engagement to attract more customers and Square Capital to buy equipment. Today, Casey’s business is thriving with 40 employees and three locations—BANG SLU, BANG PIKE, and BANG BARBER—throughout Seattle. |
EMV TRANSACTION SPEEDS
Reported industry average speeds: The New York Times, The Wall Street Journal | |
|
“The toolbox of information that Square has created enables me to make decisions based on my daily operations. I can now make sure that everything is being done in a really quick way that allows me to keep growing, progressing, and pushing forward.”
CASEY NICKOLE Owner of BANG bangseattle.com |

4
| Given the significant expansion of our ecosystem, educating larger sellers about new capabilities is key, and we have evolved our marketing strategy accordingly. We recognize that larger sellers tend to have more complex needs, and we’ve made changes to our website onboarding process to allow sellers to self-identify their sales volume, industry, and other characteristics. Based on these inputs, we can determine when it is appropriate to allow a seller to self-onboard, or when to dedicate a sales representative to provide more details on the breadth and flexibility of our solutions. | ||
|
JAKE is a luxury clothing and lifestyle retailer in San Francisco that selected Square over other providers primarily for our customer service and the elegance of our hardware. Our customer service team worked closely with JAKE to enable the company to run its entire business on Square—whether it’s using Appointments, Loyalty, and Invoices to manage customer relationships or Employee Management and Payroll to manage staff. With the help of Square Capital, JAKE recently moved into a new location that doubled its previous square footage. JAKE remains with Square for the ongoing outreach, communication, and feedback loop that Square maintains with both its sellers and the small business community.
Both BANG and JAKE have used Square Capital to grow their businesses. In fact, we celebrated a Square Capital milestone in September, surpassing $1 billion in total originations since launch in 2014. For the third quarter, we processed over 35,000 business loans totaling $208 million, an increase of approximately 70% year over year, while maintaining low loss rates at approximately 4%. We remain focused on the long-term opportunity of Square Capital and will thoughtfully explore new growth channels, while continuing to provide a great seller experience.
We are reaching even more sellers and meaningfully expanding our addressable market through Build with Square.
Opening our ecosystem to third-party partners is good for both our sellers and our business. This allows us to reach more sellers with individualized |
“The great thing about Square is that it really removes the friction. It keeps me focused on servicing the clients, and that’s what I love. If I can make clothes every day and leave Square to do the rest, then that’s a great day.”
JAKE WALL Cofounder of JAKE jake.clothing |

5
| needs who want flexibility in their business solutions. Additionally, enabling integrations with third-party apps keeps sellers on our system, even as they become larger sellers.
In March of this year, we launched Build with Square, our developer platform (APIs) that provides sellers with the ability to build and operate a fully customized point of sale while processing payments with Square. We believe this flexibility is especially important to larger sellers, who tend to have more sophisticated needs. Approximately half of our E-commerce API and Register API GPV currently comes from larger sellers.
This quarter, we expanded the capabilities of our Register API to integrate with TouchBistro and Vend, two point-of-sale solutions in the restaurant and retail verticals, respectively. This integration allows sellers to continue using the industry-specific tools they want while also having access to all the services in our ecosystem, like Instant Deposit and Customer Engagement. These partnerships better position Square to target hundreds of thousands of restaurants and retail stores in the U.S. that generate over $1 trillion in annual sales.
Financial Discussion
Gross Payment Volume (GPV)
In the third quarter of 2016, we processed $13.2 billion in GPV, an increase of 39% from the third quarter of 2015. We continue to benefit from positive dollar-based retention from our existing sellers, in addition to meaningful contribution from new sellers. Of note, we saw continued momentum from our larger sellers, whose GPV grew 55% on a year-over-year basis and now accounts for 43% of total GPV in the third quarter of 2016.
Revenue
Total net revenue, which includes revenue from Starbucks, was $439 million in the third quarter of 2016, up 32% compared to the third quarter of 2015. Adjusted Revenue, which excludes revenue from Starbucks and transaction |
BUILD WITH SQUARE square.com/developers
“Over $1 trillion in annual sales” represents total annual receipts from full-service restaurants and high-ticket and high-inventory retailers generating revenue of $500K–$20M annually, based on 2012 U.S. Census data.
GROSS PAYMENT VOLUME
|

6
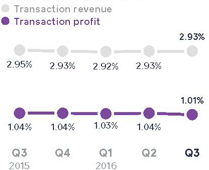
| costs, was $178 million in the third quarter of 2016, an increase of 51% from the third quarter of 2015. Transaction revenue was $388 million in the third quarter of 2016, up 38% from the third quarter of 2015. Transaction revenue as a percentage of GPV was 2.93% in the third quarter of 2016, a slight decline compared to the prior year period of 2.95%.
Software and data product revenue was $35 million in the third quarter of 2016, up 140% from the third quarter of 2015, driven by growth in Square Capital, Caviar, and Instant Deposit revenue. Revenue from Instant Deposit was driven by strong volume growth from our sellers and the rollout of Instant Deposit for Square Cash this quarter. Since the acquisition of Caviar in August of 2014, weekly order volume has grown more than 11x, and the average annualized GPV of a seller that uses both Square and Caviar is greater than $500,000.
Hardware revenue in the quarter was $8 million, up 94% from the third quarter of 2015, as sales of our contactless and chip reader remain strong. The reader also brings new sellers into our ecosystem, a testament to the product’s functionality. Hardware costs in the quarter were $16 million, increasing 174% on a year-over-year basis as a result of product mix and approximately $2 million related to inventory reserves, revaluations, and write-offs.
Lastly, in the third quarter of 2016, Starbucks transaction revenue was $7 million and transaction profit was $3 million, a benefit from previously renegotiated Starbucks processing rates. Starbucks’ transition off of our infrastructure is nearly complete, and we expect to see only nominal revenue and transaction profit related to Starbucks in the fourth quarter.
Operating Expenses/Earnings
GAAP operating expenses were $182 million in the third quarter of 2016, up 23% year over year and 3% on a sequential basis. Non-GAAP operating expenses were up 13% year over year as we continue to show leverage as we scale.
Product development expenses grew 28% year over year on a GAAP basis and 14% year over year on a non-GAAP basis in the third quarter of |
TOTAL NET REVENUE
ADJUSTED REVENUE
A reconciliation of non-GAAP metrics used in this letter to their nearest GAAP equivalents is provided at the end of this letter. Adjusted EBITDA margin is calculated as Adjusted EBITDA divided by Adjusted Revenue.
AS A PERCENTAGE OF GPV:
|
7
| 2016. These results reflect increases in engineering, design, and product personnel. Sales and marketing expenses grew 19% year over year on a GAAP basis and 15% year over year on a non-GAAP basis in the third quarter of 2016. Growth in personnel costs, as well as costs related to our Square Cash peer-to-peer service, caused sales and marketing expenses to increase on a year-over-year basis. Paid marketing expenses were stable over the same time frame. Our general and administrative expenses include personnel cost across functions such as Finance, Legal, Risk, and Support. These expenses grew 38% year over year on a GAAP basis and 28% year over year on a non-GAAP basis in the third quarter of 2016. The year-over-year increase was due primarily to increased personnel for functions such as customer support and risk. | TRANSACTION LOSS AS A PERCENTAGE OF GPV
| |
|
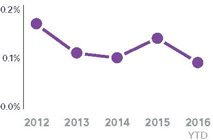
Transaction, loan, and advance losses were $13 million in the third quarter of 2016. Transaction losses as a percentage of GPV for the third quarter of 2016 were in line with our 0.1% historic average.
GAAP net loss was $32 million in the third quarter of 2016. On a GAAP basis, net loss per share, basic and diluted, was $0.09 for the third quarter of 2016, compared to $0.35 in the third quarter of 2015. We had 344 million weighted-average shares outstanding as of the third quarter of 2016.
Adjusted EBITDA was $12 million in the third quarter of 2016, compared to a loss of $16 million in the third quarter of 2015, a margin improvement of 20 points year over year. This Adjusted EBITDA improvement reflects strong topline growth paired with improving operational efficiency.
Balance Sheet/Cash Flow
We ended the third quarter of 2016 with $530 million in cash, cash equivalents, and investments in marketable securities, up from $423 million reported at the end of the second quarter of 2016. The increase in our cash balances was driven by positive Adjusted EBITDA and cash proceeds from exercised employee stock options, as well as favorable working capital trends. |
NET INCOME (LOSS)
| |
|
ADJUSTED EBITDA 20-point margin improvement YoY
Adjusted EBITDA margin is calculated as Adjusted EBITDA divided by Adjusted Revenue. |
8
Guidance
| Q4 2016
|
Current FY 2016
|
Previous FY 2016
| ||||||||
| Total Net Revenue |
$438M to $443M | $1.695B to $1.700B | $1.630B to $1.670B | |||||||
| Adjusted Revenue |
$182M to $185M | $677M to $680M | $655M to $670M | |||||||
| Adjusted EBITDA |
$16M to $18M | $31M to $33M | $18M to $24M | |||||||
| Based on the year-to-date performance, we are raising our expectations for the fourth quarter and full year. For the fourth quarter of 2016, we expect total net revenue to be in the range of $438 million to $443 million. As a reminder, Starbucks’ transition off of Square will affect total net revenue, and we expect to see only nominal revenue contribution related to Starbucks in the fourth quarter. We expect fourth-quarter Adjusted Revenue to be in the range of $182 million to $185 million, and Adjusted EBITDA to be in the range of $16 million to $18 million. At the midpoint, this is a 14 point year-over-year improvement in Adjusted EBITDA margin.
For 2016, our total net revenue is expected to be in the range of $1.695 billion to $1.700 billion. We expect Adjusted Revenue to be in the range of $677 million to $680 million, representing 50% year-over-year growth at the midpoint. We expect Adjusted EBITDA to be in the range of $31 million to $33 million, implying a 14 point year-over-year margin improvement. |
||
|
We have not reconciled Adjusted EBITDA guidance to GAAP net loss because we do not provide guidance on GAAP net loss or the reconciling items that are between Adjusted EBITDA and GAAP net loss, such as share-based compensation expense, as a result of the uncertainty regarding, and the potential variability of, these items. Accordingly, a reconciliation of the non-GAAP financial measure guidance to the corresponding GAAP measure is not available without unreasonable effort, though we have provided a reconciliation of GAAP to non-GAAP financial measures in the financial statement tables at the end of this letter. It is important to note that the actual amount of such reconciling items would have a significant impact if they were included in our Adjusted EBITDA and Adjusted EBITDA margin.
|
9
| Earnings Webcast
Square (NYSE:SQ) will host a conference call and earnings webcast at 2:00 p.m. Pacific time/5:00 p.m. Eastern time today, November 1, 2016, to discuss these financial results. The domestic dial-in for the call is (877) 313-8511. The Conference ID is 71152110. To listen to a live audio webcast, please visit Square’s Investor Relations website at square.com/investors. A replay will be available on the same website following the call.
We will release financial results for the fourth quarter and full year of 2016 on February 22, 2017, after the market closes, and will also host a conference call and earnings webcast at 2:00 p.m. Pacific time/5:00 p.m. Eastern time on the same day to discuss those financial results. |
MEDIA CONTACT press@squareup.com
INVESTOR RELATIONS CONTACT ir@squareup.com |

|

| |
| Jack Dorsey | Sarah Friar | |
| CEO | CFO |
10
|
|
“We can’t risk having something not work. It has to be reliable, and Square is always reliable. We know when a new service comes out, when a new opportunity arises, they’re going to deliver, and that’s what we need from a partner.
“I think Square is going to help us grow in many ways that we haven’t even discovered yet.”
Nathan Johnson Cofounder of JAKE jake.clothing |

SAFE HARBOR STATEMENT
This letter contains forward-looking statements within the meaning of the Safe Harbor provisions of the Private Securities Litigation Reform Act of 1995. All statements other than statements of historical fact could be deemed forward-looking, including, but not limited to, statements regarding the future performance of Square, Inc. and its consolidated subsidiaries (the Company); the Company’s expected financial results for future periods, including with respect to total net revenue, Adjusted Revenue, and Adjusted EBITDA; future growth in the Company’s businesses, including with respect to Square Capital; the anticipated nominal revenue and transaction profit from Starbucks; the Company’s ability to successfully manage its acquisitions and dispositions of assets; the Company’s expectations regarding scale and profitability; and management’s statements related to business strategy, plans, and objectives for future operations. In some cases, forward-looking statements can be identified by terms such as “may,” “will,” “appears,” “should,” “expects,” “plans,” “anticipates,” “could,” “intends,” “target,” “projects,” “contemplates,” “believes,” “estimates,” “predicts,” “potential,” or “continue,” or the negative of these words or other similar terms or expressions that concern our expectations, strategy, plans, or intentions. Such statements are subject to a number of risks, uncertainties, and assumptions, and investors are cautioned not to place undue reliance on these statements. Actual results could differ materially from those expressed or implied, and reported results should not be considered as an indication of future performance.
Risks that contribute to the uncertain nature of the forward-looking statements include, among others, the Company’s ability to deal with the substantial and increasingly intense competition in its industry; changes to the rules and practices of payment card networks and acquiring processors; the effect of evolving regulations and oversight related to the Company’s provision of payments services and other financial services; the effect of management changes and business initiatives; and changes in political, business, and economic conditions; as well as other risks listed or described from time to time in the Company’s filings with the Securities and Exchange Commission (the SEC), including our Annual Report on Form 10-K for the fiscal year ended December 31, 2015, and Quarterly Reports on Form 10-Q for the fiscal quarters ended March 31, 2016, and June 30, 2016, each of which are on file with the SEC and available on the investor relations page of the Company’s website. Except as required by law, the Company assumes no obligation to update any of the statements in this letter.
KEY OPERATING METRICS AND NON-GAAP FINANCIAL MEASURES
To supplement our financial information presented in accordance with generally accepted accounting principles in the United States (GAAP), we consider certain operating and financial measures that are not prepared in accordance with GAAP, including Gross Payment Volume, Adjusted Revenue, Adjusted EBITDA, and Adjusted EBITDA margin. Each of these metrics and measures excludes the effect of our amended payment processing agreement with Starbucks, under which Starbucks agreed to pay increased processing rates to us for as long as it continues to process transactions with us. As of September 30, 2016, Starbucks has almost completed its previously announced transition to another payment processor. As a result, we believe it is useful to exclude Starbucks activity to clearly show the impact Starbucks has had on our financial results historically, to provide insight into the impact of the expected termination of the Starbucks agreement on our revenues going forward, to facilitate period-to-period comparisons of our business, and to facilitate comparisons of our performance to that of other payment processors. Our agreements with other sellers, including Starbucks, generally provide both those sellers and us the unilateral right to terminate such agreements at any time, without fine or penalty. Furthermore, we generally do not enter into long-term contractual agreements with sellers.
We define Gross Payment Volume (GPV) as the total dollar amount of all card payments processed by sellers using Square, net of refunds. GPV excludes card payments processed for Starbucks. Additionally, GPV excludes non-revenue generating activity related to our Square Cash peer-to-peer payments service.
Adjusted Revenue is a non-GAAP financial measure that we define as our total net revenue less transaction costs, adjusted to eliminate the effect of activity under our payment processing agreement with Starbucks. As described above, Starbucks has almost completed its previously announced transition to another payment processor, and we believe that providing Adjusted Revenue metrics that exclude the impact of our agreement with Starbucks is useful to investors. We believe it is useful to exclude transaction costs from Adjusted Revenue as this is a primary metric used by management to measure our business performance, and it affords greater comparability to other payment processing companies. Adjusted Revenue has limitations as a financial measure, should be considered as supplemental in nature, and is not meant as a substitute for the related financial information prepared in accordance with GAAP.
Adjusted EBITDA is a non-GAAP financial measure that represents our net loss, adjusted to eliminate the effect of Starbucks transaction revenue, Starbucks transaction costs, and the litigation settlement with Robert E. Morley, before interest income and expense, provision or benefit for income taxes, depreciation, amortization, share-based compensation expense, other income and expense, the gain or loss on the sale of property and equipment, and impairment of intangible assets. We have included Adjusted EBITDA because it is a key measure used by our management to evaluate our operating performance, generate future operating plans, and make strategic decisions, including those relating to operating expenses and the allocation of internal resources. Accordingly, we believe that Adjusted EBITDA provides useful information to investors and others in understanding and evaluating our operating results in the same manner as our management and board of directors. In addition, it provides a useful measure for period-to-period comparisons of our business, as it removes the effect of certain non-cash items and certain variable charges. Adjusted EBITDA has limitations as a financial measure, should be considered as supplemental in nature, and is not meant as a substitute for the related financial information prepared in accordance with GAAP.
These non-GAAP financial measures should not be considered in isolation from, or as a substitute for, financial information prepared in accordance with GAAP. These non-GAAP financial measures are not based on any standardized methodology prescribed by GAAP and are not necessarily comparable to similarly titled measures presented by other companies.
12
| Consolidated Statements of Operations | UNAUDITED | |
| In thousands, except per share data |
| THREE MONTHS ENDED | NINE MONTHS ENDED | |||||||||||||||
| Sep 30, 2016 | Sep 30, 2015 | Sep 30, 2016 | Sep 30, 2015 | |||||||||||||
| Revenue: |
||||||||||||||||
| Transaction revenue |
$ | 388,347 | $ | 280,955 | $ | 1,053,664 | $ | 751,929 | ||||||||
| Starbucks transaction revenue |
7,164 | 32,332 | 78,869 | 95,199 | ||||||||||||
| Software and data product revenue |
35,320 | 14,694 | 88,833 | 35,628 | ||||||||||||
| Hardware revenue |
8,171 | 4,207 | 35,438 | 10,002 | ||||||||||||
|
|
|
|
|
|
|
|
||||||||||
| Total net revenue |
439,002 | 332,188 | 1,256,804 | 892,758 | ||||||||||||
|
|
|
|
|
|
|
|
||||||||||
| Cost of revenue: |
||||||||||||||||
| Transaction costs |
254,061 | 182,007 | 683,194 | 479,937 | ||||||||||||
| Starbucks transaction costs |
4,528 | 41,410 | 69,810 | 118,542 | ||||||||||||
| Software and data product costs |
12,524 | 5,593 | 31,701 | 13,820 | ||||||||||||
| Hardware costs |
15,689 | 5,726 | 56,444 | 16,636 | ||||||||||||
| Amortization of acquired technology |
1,886 | 1,142 | 6,142 | 2,886 | ||||||||||||
|
|
|
|
|
|
|
|
||||||||||
| Total cost of revenue |
288,688 | 235,878 | 847,291 | 631,821 | ||||||||||||
|
|
|
|
|
|
|
|
||||||||||
| Gross profit |
150,314 | 96,310 | 409,513 | 260,937 | ||||||||||||
|
|
|
|
|
|
|
|
||||||||||
| Operating expenses: |
||||||||||||||||
| Product development |
70,418 | 55,020 | 203,648 | 140,452 | ||||||||||||
| Sales and marketing |
46,754 | 39,259 | 124,470 | 107,170 | ||||||||||||
| General and administrative |
52,075 | 37,820 | 198,966 | 97,743 | ||||||||||||
| Transaction, loan, and advance losses |
12,885 | 16,005 | 38,201 | 40,840 | ||||||||||||
| Amortization of acquired customer assets |
164 | 423 | 703 | 1,373 | ||||||||||||
|
|
|
|
|
|
|
|
||||||||||
| Total operating expenses |
182,296 | 148,527 | 565,988 | 387,578 | ||||||||||||
|
|
|
|
|
|
|
|
||||||||||
| Operating loss |
(31,982) | (52,217) | (156,475) | (126,641) | ||||||||||||
|
|
|
|
|
|
|
|
||||||||||
| Interest (income) and expense, net |
(183) | 137 | (243) | 995 | ||||||||||||
| Other (income) and expense, net |
294 | 644 | (690) | 1,390 | ||||||||||||
|
|
|
|
|
|
|
|
||||||||||
| Loss before income tax |
(32,093) | (52,998) | (155,542) | (129,026) | ||||||||||||
|
|
|
|
|
|
|
|
||||||||||
| Provision for income taxes |
230 | 932 | 881 | 2,502 | ||||||||||||
|
|
|
|
|
|
|
|
||||||||||
| Net loss |
$ | (32,323) | $ | (53,930) | $ | (156,423) | $ | (131,528) | ||||||||
|
|
|
|
|
|
|
|
||||||||||
| Net loss per share: |
||||||||||||||||
| Basic |
$ | (0.09) | $ | (0.35) | $ | (0.46) | $ | (0.88) | ||||||||
|
|
|
|
|
|
|
|
||||||||||
| Diluted |
$ | (0.09) | $ | (0.35) | $ | (0.46) | $ | (0.88) | ||||||||
|
|
|
|
|
|
|
|
||||||||||
| Weighted-average shares used to compute net loss per share: |
||||||||||||||||
| Basic |
343,893 | 152,334 | 336,593 | 149,058 | ||||||||||||
|
|
|
|
|
|
|
|
||||||||||
| Diluted |
343,893 | 152,334 | 336,593 | 149,058 | ||||||||||||
|
|
|
|
|
|
|
|
||||||||||
13
| Consolidated Balance Sheets | UNAUDITED In thousands, except share and per share data |
| Assets | Sep 30, 2016 | Dec 31, 2015 | ||||||||
| Current assets: | ||||||||||
| Cash and cash equivalents |
$ | 437,900 | $ | 470,775 | ||||||
| Short-term investments |
76,427 | — | ||||||||
| Restricted cash |
13,559 | 13,537 | ||||||||
| Settlements receivable |
233,812 | 142,727 | ||||||||
| Loans held for sale |
28,817 | 604 | ||||||||
| Merchant cash advance receivable, net |
8,268 | 36,473 | ||||||||
| Other current assets |
44,244 | 41,447 | ||||||||
|
|
|
|
||||||||
| Total current assets | 843,027 | 705,563 | ||||||||
|
|
|
|
||||||||
| Property and equipment, net | 89,957 | 87,222 | ||||||||
| Goodwill | 56,699 | 56,699 | ||||||||
| Acquired intangible assets, net | 20,252 | 26,776 | ||||||||
| Long-term investments | 15,478 | — | ||||||||
| Restricted cash | 23,137 | 14,686 | ||||||||
| Other assets | 3,658 | 3,826 | ||||||||
|
|
|
|
||||||||
| Total assets | $ | 1,052,208 | 894,772 | |||||||
|
|
|
|
||||||||
| Liabilities and Stockholders’ Equity | ||||||||||
| Current liabilities: | ||||||||||
| Accounts payable |
$ | 13,719 | $ | 18,869 | ||||||
| Customers payable |
364,434 | 224,811 | ||||||||
| Accrued transaction losses |
21,428 | 17,176 | ||||||||
| Accrued expenses |
41,943 | 44,401 | ||||||||
| Other current liabilities |
44,500 | 28,945 | ||||||||
|
|
|
|
||||||||
| Total current liabilities | 486,024 | 334,202 | ||||||||
|
|
|
|
||||||||
| Other liabilities | 55,795 | 52,522 | ||||||||
|
|
|
|
||||||||
| Total liabilities | 541,819 | 386,724 | ||||||||
|
|
|
|
||||||||
| Stockholders’ equity: | ||||||||||
| Preferred stock, $0.0000001 par value: 100,000,000 shares authorized at September 30, 2016 and December 31, 2015. None issued and outstanding at September 30, 2016 and December 31, 2015. |
— | — | ||||||||
| Common stock, $0.0000001 par value: 1,000,000,000 Class A shares authorized at September 30, 2016 and December 31, 2015; 162,988,864 and 31,717,133 issued and outstanding at September 30, 2016 and December 31, 2015, respectively. 500,000,000 Class B shares authorized at both September 30, 2016 and December 31, 2015; 188,328,922 and 303,232,312 issued and outstanding at September 30, 2016 and December 31, 2015, respectively. |
— | — | ||||||||
| Additional paid-in capital |
1,274,248 | 1,116,882 | ||||||||
| Accumulated deficit |
(764,072) | (607,649) | ||||||||
| Accumulated other comprehensive income (loss) |
213 | (1,185) | ||||||||
|
|
|
|
||||||||
| Total stockholders’ equity | 510,389 | 508,048 | ||||||||
|
|
|
|
||||||||
| Total liabilities and stockholders’ equity | $ | 1,052,208 | $ | 894,772 | ||||||
|
|
|
|
||||||||
14
| Consolidated Statements of Cash Flows | UNAUDITED In thousands |
| NINE MONTHS ENDED | ||||||||||
| Cash Flows from Operating Activities | Sep 30, 2016 | Sep 30, 2015 | ||||||||
| Net loss | $ | (156,423) | $ | (131,528) | ||||||
| Adjustments to reconcile net loss to net cash provided by operating activities: | ||||||||||
| Depreciation and amortization |
27,817 | 18,526 | ||||||||
| Share-based compensation |
104,899 | 49,486 | ||||||||
| Starbucks share-based instruments |
— | 1,485 | ||||||||
| Provision for transaction losses |
36,875 | 32,967 | ||||||||
| Provision for (reduction in) uncollectible merchant cash advances |
509 | 4,616 | ||||||||
| Deferred provision for income taxes |
(104) | (207) | ||||||||
| Loss on disposal of property and equipment |
(88) | 240 | ||||||||
| Changes in operating assets and liabilities: |
||||||||||
| Settlements receivable |
(91,390) | (40,729) | ||||||||
| Purchase of loans held for sale |
(421,243) | — | ||||||||
| Proceeds from sales and principal payments of loans held for sale |
393,221 | — | ||||||||
| Merchant cash advance receivable |
27,696 | (18,725) | ||||||||
| Other current assets |
(3,011) | (4,457) | ||||||||
| Other assets |
145 | 1,102 | ||||||||
| Accounts payable |
(867) | 2,048 | ||||||||
| Customers payable |
139,105 | 89,446 | ||||||||
| Charge-offs and recoveries to accrued transaction losses |
(32,623) | (25,415) | ||||||||
| Accrued expenses |
86 | 13,950 | ||||||||
| Other current liabilities |
15,255 | 1,524 | ||||||||
| Other noncurrent liabilities |
2,376 | 8,801 | ||||||||
|
|
|
|
||||||||
| Net cash provided by operating activities |
42,235 | 3,130 | ||||||||
|
|
|
|
||||||||
| Cash Flows from Investing Activities | ||||||||||
| Purchase of marketable securities |
(139,103) | — | ||||||||
| Proceeds from maturities of marketable securities |
26,268 | — | ||||||||
| Proceeds from sale of marketable securities |
20,962 | — | ||||||||
| Purchase of property and equipment |
(19,674) | (30,724) | ||||||||
| Payment for acquisition of intangible assets |
(400) | (110) | ||||||||
| Change in restricted cash |
(8,473) | (252) | ||||||||
| Business acquisitions (net of cash acquired) |
— | (4,500) | ||||||||
|
|
|
|
||||||||
| Net cash used in investing activities |
(120,420) | (35,586) | ||||||||
|
|
|
|
||||||||
| Cash Flows from Financing Activities | ||||||||||
| Principal payments on debt |
— | (30,000) | ||||||||
| Payments of offering costs related to initial public offering |
(5,530) | — | ||||||||
| Proceeds from issuances of common stock from the exercise of options and employee stock purchase plan |
48,304 | 12,209 | ||||||||
|
|
|
|
||||||||
| Net cash provided by (used in) financing activities |
42,774 | (17,791) | ||||||||
|
|
|
|
||||||||
| Effect of foreign exchange rate changes on cash and cash equivalents |
2,536 | (970) | ||||||||
|
|
|
|
||||||||
| Net decrease in cash and cash equivalents
|
|
(32,875)
|
|
|
(51,217)
|
| ||||
| Cash and cash equivalents, beginning of period | 470,775 | 225,300 | ||||||||
|
|
|
|
||||||||
| Cash and cash equivalents, end of period | $ | 437,900 | $ | 174,083 | ||||||
|
|
|
|
||||||||
15
| Key Operating Metrics and Non-GAAP Financial Measures | UNAUDITED | |
| In thousands, except GPV |
|
THREE MONTHS ENDED |
NINE MONTHS ENDED | |||||||||||||||
| Sep 30, 2016 | Sep 30, 2015 | Sep 30, 2016 | Sep 30, 2015 | |||||||||||||
| Gross Payment Volume (GPV) (in millions) | $ | 13,248 | $ | 9,540 | $ | 35,989 | $ | 25,450 | ||||||||
| Adjusted Revenue | $ | 177,777 | $ | 117,849 | $ | 494,741 | $ | 317,622 | ||||||||
| Adjusted EBITDA | $ | 11,623 | $ | (15,776) | $ | 15,094 | $ | (35,046) | ||||||||
|
Adjusted Revenue Reconciliation |
UNAUDITED | |||||||||||||||
| In thousands | ||||||||||||||||
|
THREE MONTHS ENDED |
NINE MONTHS ENDED | |||||||||||||||
| Sep 30, 2016 | Sep 30, 2015 | Sep 30, 2016 | Sep 30, 2015 | |||||||||||||
| Total net revenue | $ | 439,002 | $ | 332,188 | $ | 1,256,804 | $ | 892,758 | ||||||||
| Less: Starbucks transaction revenue | 7,164 | 32,332 | 78,869 | 95,199 | ||||||||||||
| Less: Transaction costs | 254,061 | 182,007 | 683,194 | 479,937 | ||||||||||||
|
|
|
|
|
|
|
|
||||||||||
| Adjusted Revenue |
$ | 177,777 | $ | 117,849 | $ | 494,741 | $ | 317,622 | ||||||||
|
|
|
|
|
|
|
|
||||||||||
|
Adjusted EBITDA Reconciliation |
UNAUDITED | |||||||||||||||
| In thousands | ||||||||||||||||
|
THREE MONTHS ENDED |
NINE MONTHS ENDED | |||||||||||||||
| Sep 30, 2016 | Sep 30, 2015 | Sep 30, 2016 | Sep 30, 2015 | |||||||||||||
| Net loss | $ | (32,323) | $ | (53,930) | $ | (156,423) | $ | (131,528) | ||||||||
| Starbucks transaction revenue | (7,164) | (32,332) | (78,869) | (95,199) | ||||||||||||
| Starbucks transaction costs | 4,528 | 41,410 | 69,810 | 118,542 | ||||||||||||
| Share-based compensation expense | 36,779 | 20,793 | 104,899 | 49,486 | ||||||||||||
| Depreciation and amortization | 9,681 | 6,570 | 27,817 | 18,526 | ||||||||||||
| Litigation settlement expense | — | — | 48,000 | — | ||||||||||||
| Interest (income) and expense | (183) | 137 | (243) | 995 | ||||||||||||
| Other (income) and expense | 294 | 644 | (690) | 1,390 | ||||||||||||
| Provision for income taxes | 230 | 932 | 881 | 2,502 | ||||||||||||
| Loss (gain) on sale of property and equipment | (219) | — | (88) | 240 | ||||||||||||
|
|
|
|
|
|
|
|
||||||||||
| Adjusted EBITDA |
$ | 11,623 | $ | (15,776) | $ | 15,094 | $ | (35,046) | ||||||||
|
|
|
|
|
|
|
|
||||||||||
16
| Non-GAAP Operating Expenses | UNAUDITED | |||||||||||||||
|
|
In thousands
|
| ||||||||||||||
| THREE MONTHS ENDED | NINE MONTHS ENDED | |||||||||||||||
| Sep 30, 2016 | Sep 30, 2015 | Sep 30, 2016 | Sep 30, 2015 | |||||||||||||
| Operating expenses | $ | (182,296) | $ | (148,527) | $ | (565,988) | $ | (387,578) | ||||||||
| Share-based compensation | 36,779 | 20,793 | 104,899 | 49,486 | ||||||||||||
| Depreciation and amortization | 7,230 | 5,428 | 19,992 | 15,639 | ||||||||||||
| Litigation settlement expense | — | — | 48,000 | — | ||||||||||||
| Loss (gain) on sale of fixed assets | (219) | — | (88) | 240 | ||||||||||||
|
|
|
|
|
|
|
|
||||||||||
| Non-GAAP operating expenses |
$ | (138,506) | $ | (122,306) | $ | (393,185) | $ | (322,213) | ||||||||
|
|
|
|
|
|
|
|
||||||||||
| Product development | $ | (70,418) | $ | (55,020) | $ | (203,648) | $ | (140,452) | ||||||||
| Share-based compensation | 23,949 | 13,938 | 70,064 | 33,287 | ||||||||||||
| Depreciation and amortization | 3,282 | 3,171 | 9,551 | 9,107 | ||||||||||||
| Loss (gain) on sale of fixed assets | (169) | — | — | — | ||||||||||||
|
|
|
|
|
|
|
|
||||||||||
| Non-GAAP product development |
$ | (43,356) | $ | (37,911) | $ | (124,033) | $ | (98,058) | ||||||||
|
|
|
|
|
|
|
|
||||||||||
| Sales and marketing | $ | (46,754) | $ | (39,259) | $ | (124,470) | $ | (107,170) | ||||||||
| Share-based compensation | 3,697 | 1,750 | 9,963 | 4,524 | ||||||||||||
| Depreciation and amortization | 5 | 3 | 13 | 7 | ||||||||||||
| Loss (gain) on sale of fixed assets | 14 | — | 32 | — | ||||||||||||
|
|
|
|
|
|
|
|
||||||||||
| Non-GAAP sales and marketing |
$ | (43,038) | $ | (37,506) | $ | (114,462) | $ | (102,639) | ||||||||
|
|
|
|
|
|
|
|
||||||||||
| General and administrative | $ | (52,075) | $ | (37,820) | $ | (198,966) | $ | (97,743) | ||||||||
| Share-based compensation | 9,133 | 5,105 | 24,872 | 11,675 | ||||||||||||
| Depreciation and amortization | 3,943 | 2,254 | 10,428 | 6,525 | ||||||||||||
| Litigation settlement expense | — | — | 48,000 | — | ||||||||||||
| Loss (gain) on sale of fixed assets | (64) | — | (120) | 240 | ||||||||||||
|
|
|
|
|
|
|
|
||||||||||
| Non-GAAP general and administrative |
$ | (39,063) | $ | (30,461) | $ | (115,786) | $ | (79,303) | ||||||||
|
|
|
|
|
|
|
|
||||||||||
|
Depreciation and Amortization by Function |
UNAUDITED | |||||||||||||||
|
|
In thousands
|
| ||||||||||||||
| THREE MONTHS ENDED | NINE MONTHS ENDED | |||||||||||||||
| Sep 30, 2016 | Sep 30, 2015 | Sep 30, 2016 | Sep 30, 2015 | |||||||||||||
| Cost of revenue | $ | 2,451 | $ | 1,142 | $ | 7,825 | $ | 2,887 | ||||||||
| Product development | 3,282 | 3,171 | 9,551 | 9,107 | ||||||||||||
| Sales and marketing | 5 | 3 | 13 | 7 | ||||||||||||
| General and administrative | 3,943 | 2,254 | 10,428 | 6,525 | ||||||||||||
|
|
|
|
|
|
|
|
||||||||||
| Total depreciation and amortization |
$ | 9,681 | $ | 6,570 | $ | 27,817 | $ | 18,526 | ||||||||
|
|
|
|
|
|
|
|
||||||||||
17