Attached files
| file | filename |
|---|---|
| EX-99.5 - EX-99.5 - Lumen Technologies, Inc. | d272595dex995.htm |
| EX-99.4 - EX-99.4 - Lumen Technologies, Inc. | d272595dex994.htm |
| EX-99.3 - EX-99.3 - Lumen Technologies, Inc. | d272595dex993.htm |
| EX-99.1 - EX-99.1 - Lumen Technologies, Inc. | d272595dex991.htm |
| 8-K - 8-K - Lumen Technologies, Inc. | d272595d8k.htm |
CenturyLink to Acquire Level 3 Creates Second Largest Domestic Communications Provider Serving Global Enterprise Customers October 31, 2016 Exhibit 99.2
Except for the historical and factual information contained herein, the matters set forth in this presentation, including statements regarding the expected timing and benefits of the proposed transaction, such as efficiencies, cost savings, enhanced revenues, growth potential, market profile and financial strength, and the competitive ability and position of the combined company, and other statements identified by words such as “will,” “estimates,” “expects,” “projects,” “plans,” “intends” and similar expressions, are forward-looking statements within the meaning of the “safe harbor” provisions of the Private Securities Litigation Reform Act of 1995. These forward-looking statements are subject to a number of risks, uncertainties and assumptions, many of which are beyond our control. Actual events and results may differ materially from those anticipated, estimated or projected if one or more of these risks or uncertainties materialize, or if underlying assumptions prove incorrect. Factors that could affect actual results include but are not limited to: the ability of the parties to timely and successfully receive the required approvals of regulatory agencies and their respective shareholders; the possibility that the anticipated benefits from the proposed transaction cannot be fully realized or may take longer to realize than expected; the possibility that costs or difficulties related to the integration of Level 3’s operations with those of CenturyLink will be greater than expected; the ability of the combined company to retain and hire key personnel; the effects of competition from a wide variety of competitive providers, including lower demand for CenturyLink’s legacy offerings; the effects of new, emerging or competing technologies, including those that could make the combined company’s products less desirable or obsolete; the effects of ongoing changes in the regulation of the communications industry, including the outcome of regulatory or judicial proceedings relating to intercarrier compensation, interconnection obligations, access charges, universal service, broadband deployment, data protection and net neutrality; adverse changes in CenturyLink’s or the combined company’s access to credit markets on favorable terms, whether caused by changes in its financial position, lower debt credit ratings, unstable markets or otherwise; the combined company’s ability to effectively adjust to changes in the communications industry, and changes in the composition of its markets and product mix; possible changes in the demand for, or pricing of, the combined company’s products and services, including the combined company’s ability to effectively respond to increased demand for high-speed broadband service; the combined company’s ability to successfully maintain the quality and profitability of its existing product and service offerings and to introduce new offerings on a timely and cost-effective basis; the adverse impact on the combined company’s business and network from possible equipment failures, service outages, security breaches or similar events impacting its network; the combined company’s ability to maintain favorable relations with key business partners, suppliers, vendors, landlords and financial institutions; the ability of the combined company to utilize net operating losses in amounts projected; changes in the future cash requirements of the combined company; and other risk factors and cautionary statements as detailed from time to time in each of CenturyLink’s and Level 3’s reports filed with the U.S. Securities and Exchange Commission (the “SEC”). There can be no assurance that the proposed acquisition or any other transaction described above will in fact be consummated in the manner described or at all. You should be aware that new factors may emerge from time to time and it is not possible for us to identify all such factors nor can we predict the impact of each such factor on the proposed transaction or the combined company. You should not place undue reliance on these forward looking statements, which speak only as of the date of this document. Unless legally required, CenturyLink and Level 3 undertake no obligation and each expressly disclaim any such obligation, to update publicly any forward-looking statements, whether as a result of new information, future events or otherwise. Forward-Looking Statements
CenturyLink and Level 3 plan to file a joint proxy statement/prospectus with the SEC. INVESTORS ARE URGED TO READ THE JOINT PROXY STATEMENT/PROSPECTUS WHEN IT BECOMES AVAILABLE BECAUSE IT WILL CONTAIN IMPORTANT INFORMATION. You will be able to obtain the joint proxy statement/prospectus and the filings that will be incorporated by reference in the joint proxy statement/prospectus, as well as other filings containing information about CenturyLink and Level 3, free of charge, at the website maintained by the SEC at www.sec.gov. Copies of the joint proxy statement/prospectus and the filings with the SEC that will be incorporated by reference in the joint proxy statement/prospectus can also be obtained, free of charge, by directing a request to CenturyLink, 100 CenturyLink Drive, Monroe, Louisiana 71203, Attention: Corporate Secretary, or to Level 3, 1025 Eldorado Boulevard, Broomfield, Colorado 80021, Attention: Investor Relations. Participants in the Solicitation The respective directors and executive officers of CenturyLink and Level 3 and other persons may be deemed to be participants in the solicitation of proxies in respect of the proposed transaction. Information regarding CenturyLink’s directors and executive officers is available in its proxy statement filed with the SEC by CenturyLink on April 5, 2016, and information regarding Level 3’s directors and executive officers is available in its proxy statement filed with the SEC by Level 3 on April 7, 2016. These documents can be obtained free of charge from the sources indicated above. Other information regarding the interests of the participants in the proxy solicitation will be included in the joint proxy statement/prospectus and other relevant materials to be filed with the SEC when they become available. This communication is not intended to and does not constitute an offer to sell or the solicitation of an offer to sell or the solicitation of an offer to buy any securities, nor shall there be any sale of securities in any jurisdiction in which such offer, solicitation or sale would be unlawful prior to registration or qualification under the securities laws of any such jurisdiction. No offer of securities shall be made except by means of a prospectus meeting the requirements of Section 10 of the Securities Act of 1933, as amended. Additional Information
Glen Post Chief Executive Officer & President, CenturyLink Jeff Storey President & Chief Executive Officer, Level 3 Stewart Ewing Executive Vice President & Chief Financial Officer, CenturyLink Sunit Patel Executive Vice President & Chief Financial Officer, Level 3 Call Participants
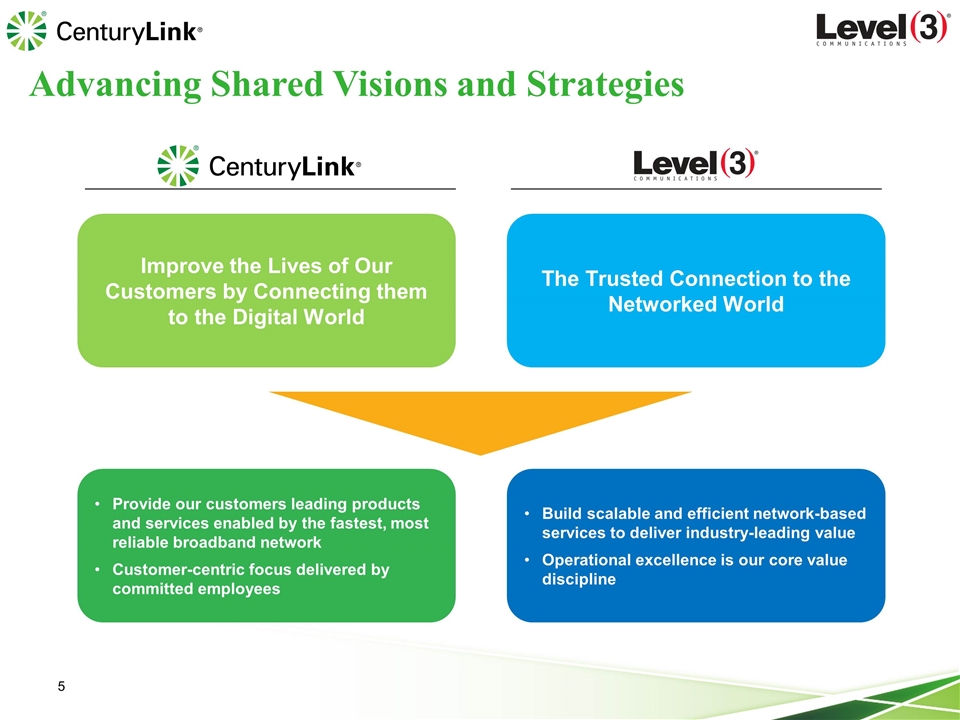
Improve the Lives of Our Customers by Connecting them to the Digital World The Trusted Connection to the Networked World Provide our customers leading products and services enabled by the fastest, most reliable broadband network Customer-centric focus delivered by committed employees Build scalable and efficient network-based services to deliver industry-leading value Operational excellence is our core value discipline Advancing Shared Visions and Strategies

Transaction Overview
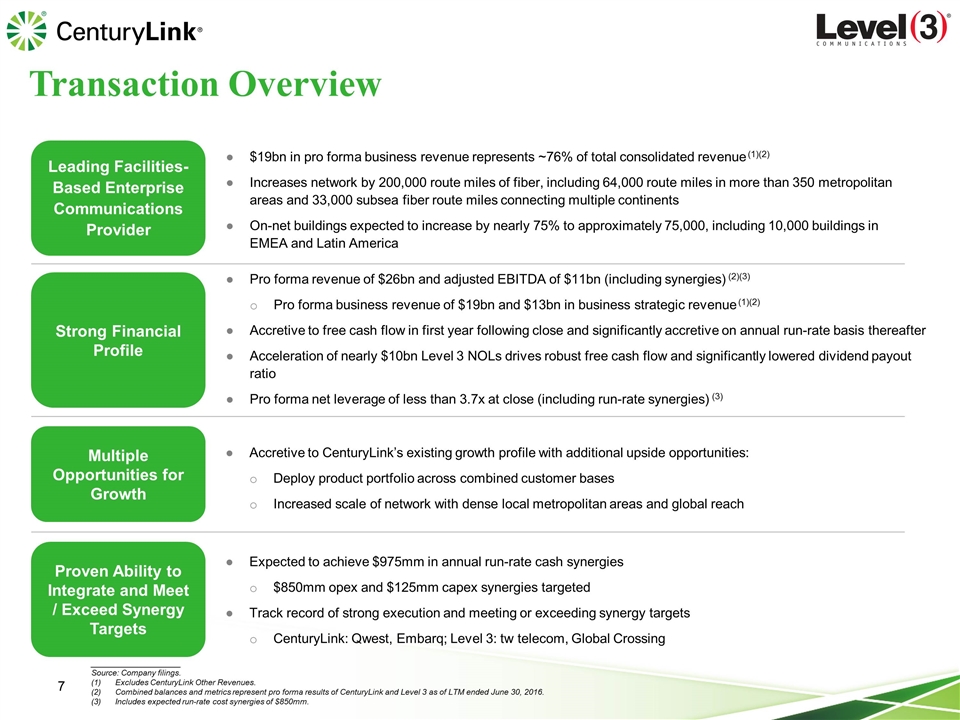
Leading Facilities-Based Enterprise Communications Provider Strong Financial Profile Multiple Opportunities for Growth Proven Ability to Integrate and Meet / Exceed Synergy Targets $19bn in pro forma business revenue represents ~76% of total consolidated revenue (1)(2) Increases network by 200,000 route miles of fiber, including 64,000 route miles in more than 350 metropolitan areas and 33,000 subsea fiber route miles connecting multiple continents On-net buildings expected to increase by nearly 75% to approximately 75,000, including 10,000 buildings in EMEA and Latin America Pro forma revenue of $26bn and adjusted EBITDA of $11bn (including synergies) (2)(3) Pro forma business revenue of $19bn and $13bn in business strategic revenue (1)(2) Accretive to free cash flow in first year following close and significantly accretive on annual run-rate basis thereafter Acceleration of nearly $10bn Level 3 NOLs drives robust free cash flow and significantly lowered dividend payout ratio Pro forma net leverage of less than 3.7x at close (including run-rate synergies) (3) Accretive to CenturyLink’s existing growth profile with additional upside opportunities: Deploy product portfolio across combined customer bases Increased scale of network with dense local metropolitan areas and global reach Expected to achieve $975mm in annual run-rate cash synergies $850mm opex and $125mm capex synergies targeted Track record of strong execution and meeting or exceeding synergy targets CenturyLink: Qwest, Embarq; Level 3: tw telecom, Global Crossing ____________________ Source: Company filings. Excludes CenturyLink Other Revenues. Combined balances and metrics represent pro forma results of CenturyLink and Level 3 as of LTM ended June 30, 2016. Includes expected run-rate cost synergies of $850mm. Transaction Overview
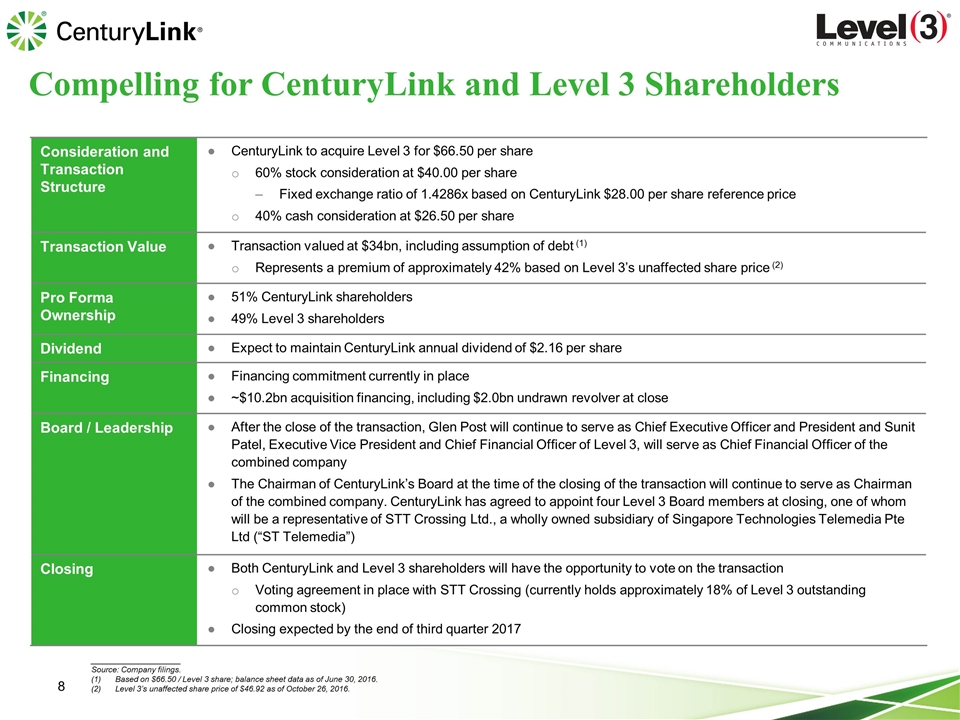
Consideration and Transaction Structure CenturyLink to acquire Level 3 for $66.50 per share 60% stock consideration at $40.00 per share Fixed exchange ratio of 1.4286x based on CenturyLink $28.00 per share reference price 40% cash consideration at $26.50 per share Transaction Value Transaction valued at $34bn, including assumption of debt (1) Represents a premium of approximately 42% based on Level 3’s unaffected share price (2) Pro Forma Ownership 51% CenturyLink shareholders 49% Level 3 shareholders Dividend Expect to maintain CenturyLink annual dividend of $2.16 per share Financing Financing commitment currently in place ~$10.2bn acquisition financing, including $2.0bn undrawn revolver at close Board / Leadership After the close of the transaction, Glen Post will continue to serve as Chief Executive Officer and President and Sunit Patel, Executive Vice President and Chief Financial Officer of Level 3, will serve as Chief Financial Officer of the combined company The Chairman of CenturyLink’s Board at the time of the closing of the transaction will continue to serve as Chairman of the combined company. CenturyLink has agreed to appoint four Level 3 Board members at closing, one of whom will be a representative of STT Crossing Ltd., a wholly owned subsidiary of Singapore Technologies Telemedia Pte Ltd (“ST Telemedia”) Closing Both CenturyLink and Level 3 shareholders will have the opportunity to vote on the transaction Voting agreement in place with STT Crossing (currently holds approximately 18% of Level 3 outstanding common stock) Closing expected by the end of third quarter 2017 ____________________ Source: Company filings. Based on $66.50 / Level 3 share; balance sheet data as of June 30, 2016. Level 3’s unaffected share price of $46.92 as of October 26, 2016. Compelling for CenturyLink and Level 3 Shareholders
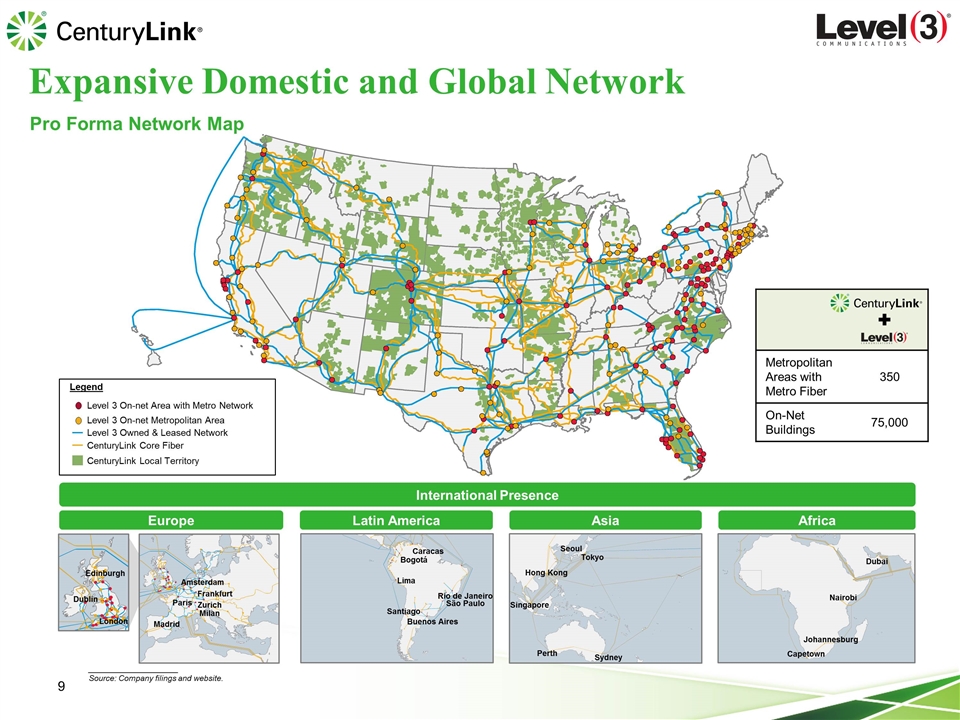
Expansive Domestic and Global Network London Paris Frankfurt Dublin Edinburgh Madrid Amsterdam Zurich Milan Europe Hong Kong Singapore Seoul Tokyo Sydney Perth Asia Johannesburg Capetown Nairobi Dubai Africa Rio de Janeiro São Paulo Lima Santiago Buenos Aires Caracas Bogotá Latin America International Presence ____________________ Source: Company filings and website. Legend Level 3 On-net Area with Metro Network Level 3 On-net Metropolitan Area Level 3 Owned & Leased Network CenturyLink Core Fiber CenturyLink Local Territory Pro Forma Network Map Metropolitan Areas with Metro Fiber 350 On-Net Buildings 75,000
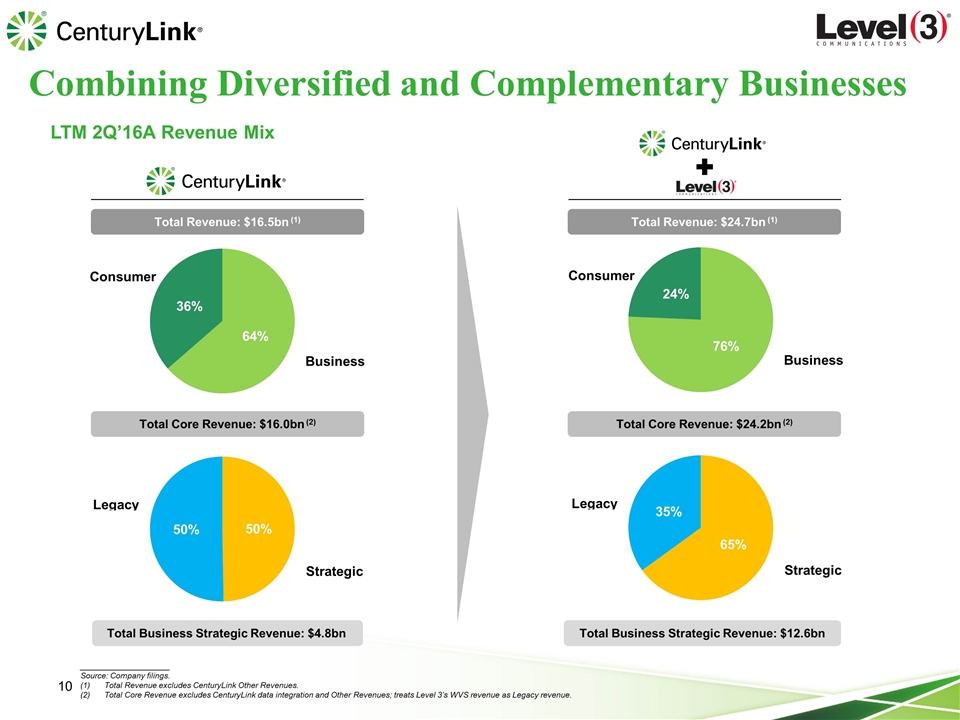
Combining Diversified and Complementary Businesses LTM 2Q’16A Revenue Mix ____________________ Source: Company filings. Total Revenue excludes CenturyLink Other Revenues. Total Core Revenue excludes CenturyLink data integration and Other Revenues; treats Level 3’s WVS revenue as Legacy revenue. Total Revenue: $16.5bn (1) Total Revenue: $24.7bn (1) Total Core Revenue: $16.0bn (2) Total Core Revenue: $24.2bn (2) Total Business Strategic Revenue: $4.8bn Total Business Strategic Revenue: $12.6bn
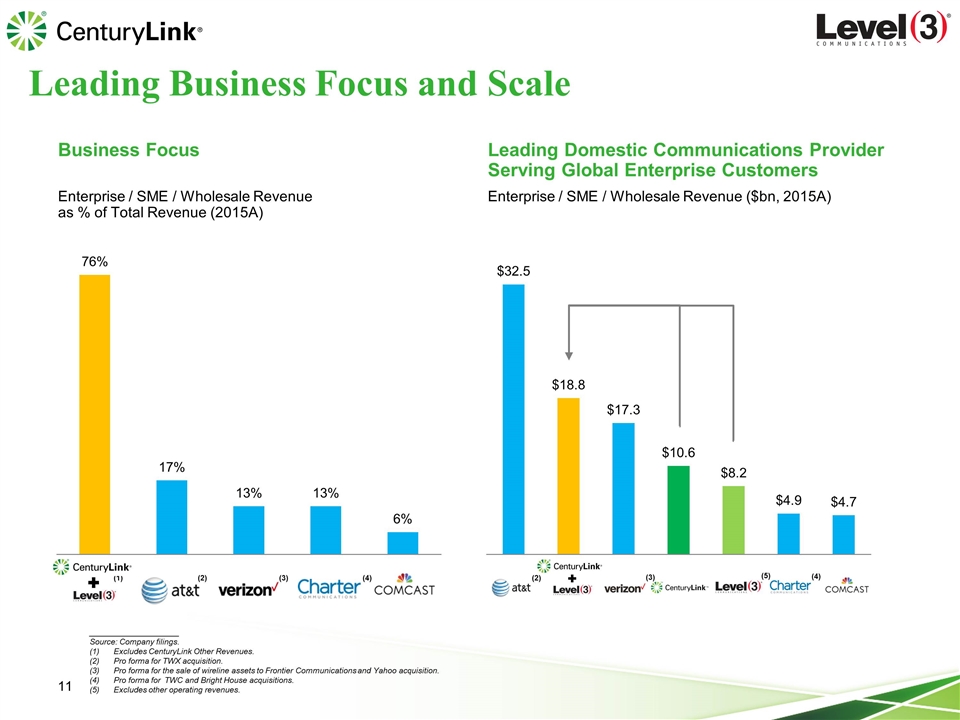
____________________ Source: Company filings. Excludes CenturyLink Other Revenues. Pro forma for TWX acquisition. Pro forma for the sale of wireline assets to Frontier Communications and Yahoo acquisition. Pro forma for TWC and Bright House acquisitions. Excludes other operating revenues. Business Focus Enterprise / SME / Wholesale Revenue as % of Total Revenue (2015A) (3) Leading Domestic Communications Provider Serving Global Enterprise Customers Enterprise / SME / Wholesale Revenue ($bn, 2015A) (2) (4) (2) (4) (1) (3) (5) Leading Business Focus and Scale
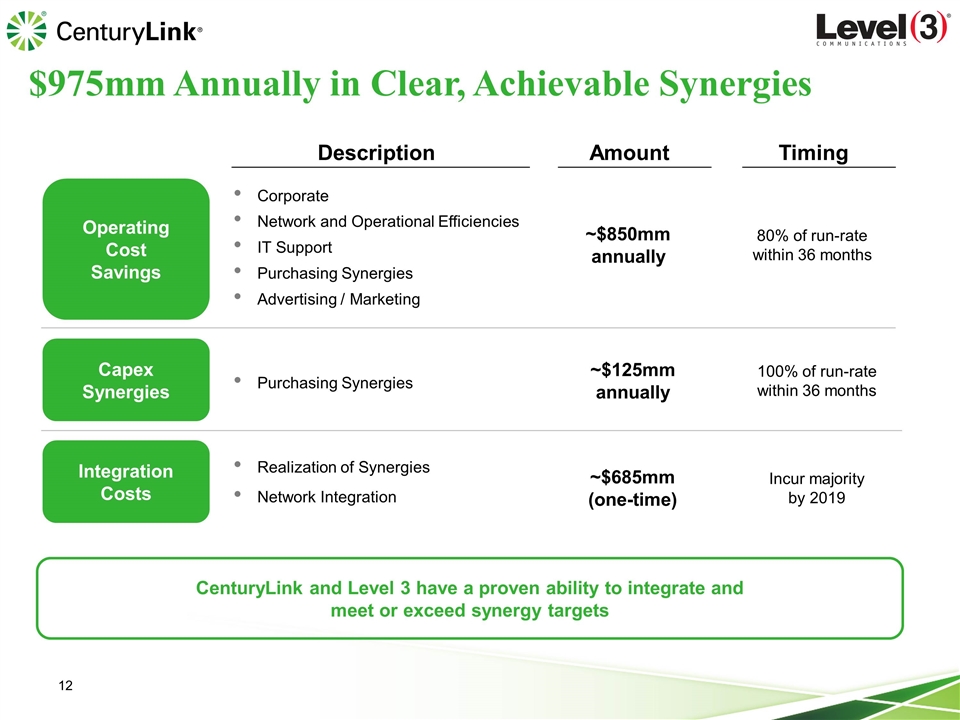
~$685mm (one-time) Operating Cost Savings Capex Synergies Integration Costs Corporate Network and Operational Efficiencies IT Support Purchasing Synergies Advertising / Marketing Purchasing Synergies Realization of Synergies Network Integration ~$850mm annually ~$125mm annually Description Amount CenturyLink and Level 3 have a proven ability to integrate and meet or exceed synergy targets Incur majority by 2019 80% of run-rate within 36 months 100% of run-rate within 36 months Timing $975mm Annually in Clear, Achievable Synergies
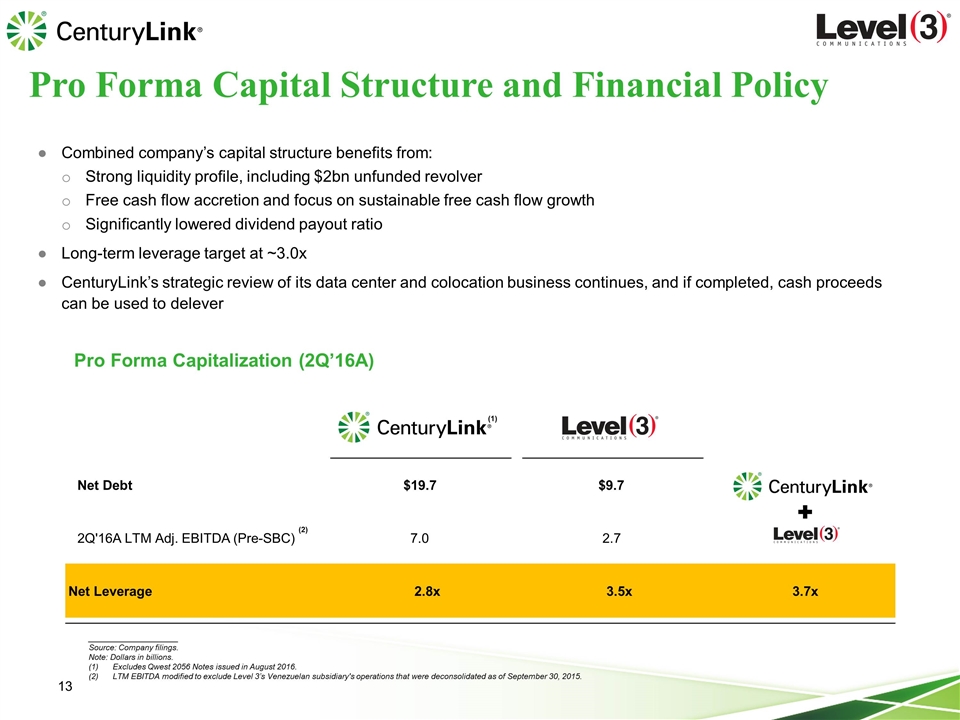
____________________ Source: Company filings. Note: Dollars in billions. Excludes Qwest 2056 Notes issued in August 2016. LTM EBITDA modified to exclude Level 3’s Venezuelan subsidiary's operations that were deconsolidated as of September 30, 2015. Pro Forma Capitalization (2Q’16A) Combined company’s capital structure benefits from: Strong liquidity profile, including $2bn unfunded revolver Free cash flow accretion and focus on sustainable free cash flow growth Significantly lowered dividend payout ratio Long-term leverage target at ~3.0x CenturyLink’s strategic review of its data center and colocation business continues, and if completed, cash proceeds can be used to delever (1) (2) Pro Forma Capital Structure and Financial Policy Net Debt $19.7 $9.7 2Q'16A LTM Adj. EBITDA (Pre-SBC) 7.0 2.7 Net Leverage 2.8x 3.5x 3.7x
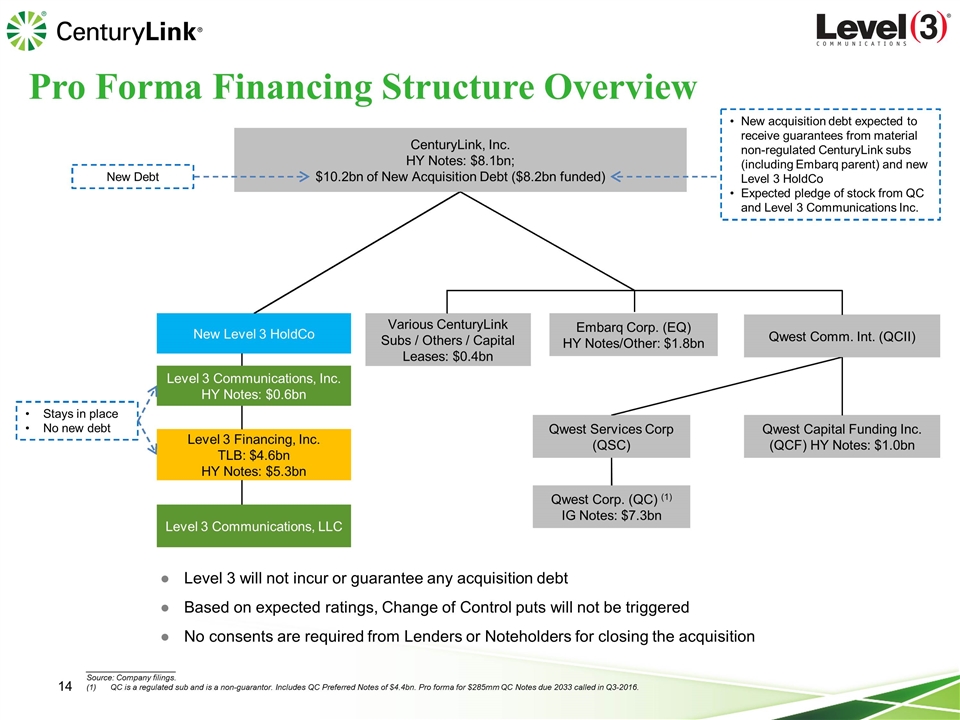
Pro Forma Financing Structure Overview ____________________ Source: Company filings. QC is a regulated sub and is a non-guarantor. Includes QC Preferred Notes of $4.4bn. Pro forma for $285mm QC Notes due 2033 called in Q3-2016. Level 3 Financing, Inc. TLB: $4.6bn HY Notes: $5.3bn Qwest Comm. Int. (QCII) Qwest Capital Funding Inc. (QCF) HY Notes: $1.0bn Qwest Corp. (QC) (1) IG Notes: $7.3bn Qwest Services Corp (QSC) Level 3 Communications, LLC CenturyLink, Inc. HY Notes: $8.1bn; $10.2bn of New Acquisition Debt ($8.2bn funded) Various CenturyLink Subs / Others / Capital Leases: $0.4bn Embarq Corp. (EQ) HY Notes/Other: $1.8bn New Level 3 HoldCo Level 3 Communications, Inc. HY Notes: $0.6bn Stays in place No new debt Level 3 will not incur or guarantee any acquisition debt Based on expected ratings, Change of Control puts will not be triggered No consents are required from Lenders or Noteholders for closing the acquisition New Debt New acquisition debt expected to receive guarantees from material non-regulated CenturyLink subs (including Embarq parent) and new Level 3 HoldCo Expected pledge of stock from QC and Level 3 Communications Inc.
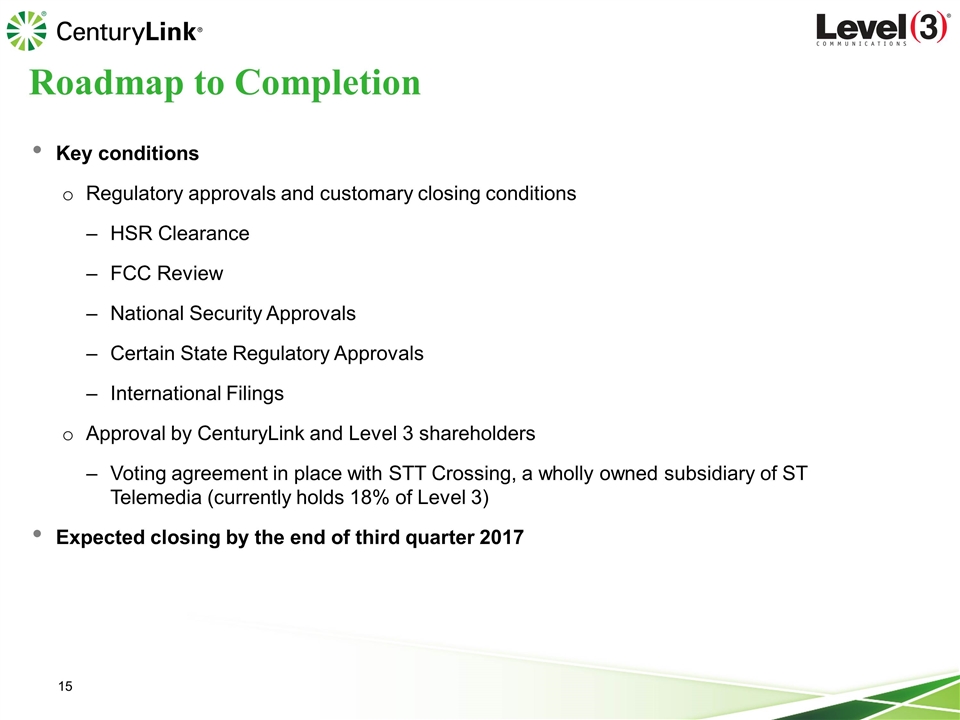
Key conditions Regulatory approvals and customary closing conditions HSR Clearance FCC Review National Security Approvals Certain State Regulatory Approvals International Filings Approval by CenturyLink and Level 3 shareholders Voting agreement in place with STT Crossing, a wholly owned subsidiary of ST Telemedia (currently holds 18% of Level 3) Expected closing by the end of third quarter 2017 Roadmap to Completion
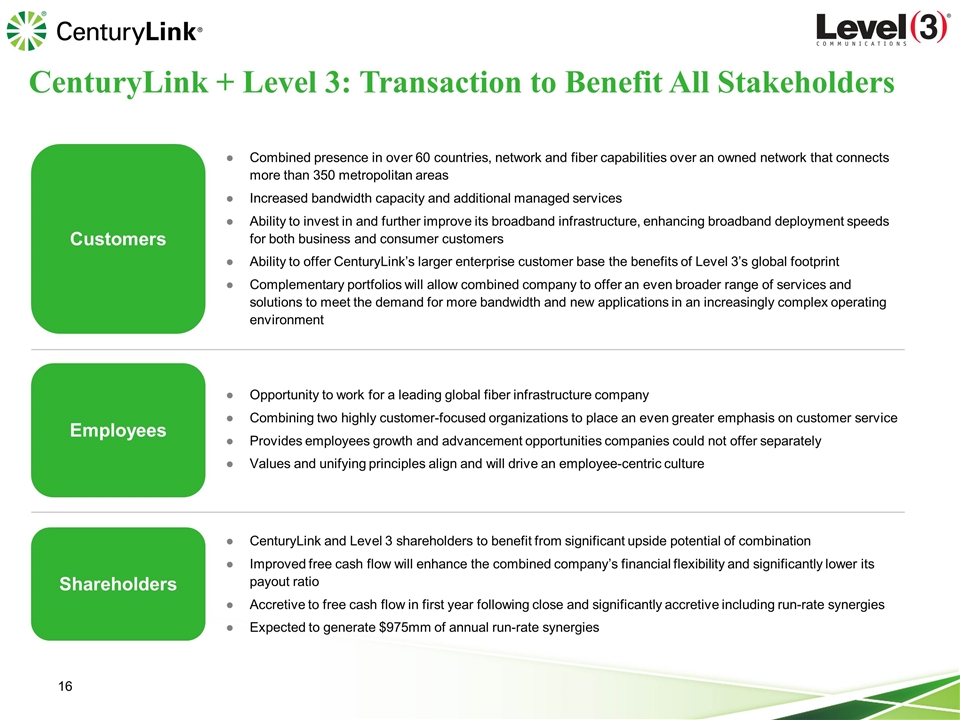
Customers Combined presence in over 60 countries, network and fiber capabilities over an owned network that connects more than 350 metropolitan areas Increased bandwidth capacity and additional managed services Ability to invest in and further improve its broadband infrastructure, enhancing broadband deployment speeds for both business and consumer customers Ability to offer CenturyLink’s larger enterprise customer base the benefits of Level 3’s global footprint Complementary portfolios will allow combined company to offer an even broader range of services and solutions to meet the demand for more bandwidth and new applications in an increasingly complex operating environment Employees Opportunity to work for a leading global fiber infrastructure company Combining two highly customer-focused organizations to place an even greater emphasis on customer service Provides employees growth and advancement opportunities companies could not offer separately Values and unifying principles align and will drive an employee-centric culture Shareholders CenturyLink and Level 3 shareholders to benefit from significant upside potential of combination Improved free cash flow will enhance the combined company’s financial flexibility and significantly lower its payout ratio Accretive to free cash flow in first year following close and significantly accretive including run-rate synergies Expected to generate $975mm of annual run-rate synergies CenturyLink + Level 3: Transaction to Benefit All Stakeholders
CenturyLink 3Q16 Results & Guidance Overview
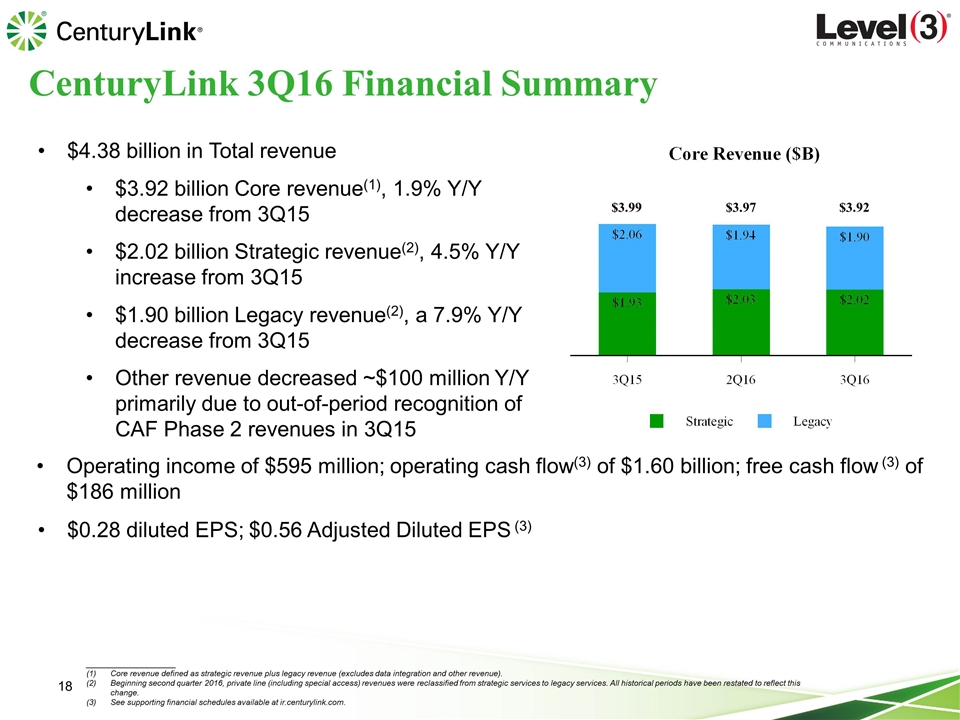
$4.38 billion in Total revenue $3.92 billion Core revenue(1), 1.9% Y/Y decrease from 3Q15 $2.02 billion Strategic revenue(2), 4.5% Y/Y increase from 3Q15 $1.90 billion Legacy revenue(2), a 7.9% Y/Y decrease from 3Q15 Other revenue decreased ~$100 million Y/Y primarily due to out-of-period recognition of CAF Phase 2 revenues in 3Q15 Operating income of $595 million; operating cash flow(3) of $1.60 billion; free cash flow (3) of $186 million $0.28 diluted EPS; $0.56 Adjusted Diluted EPS (3) $3.99 $3.97 $3.92 ____________________ Core revenue defined as strategic revenue plus legacy revenue (excludes data integration and other revenue). Beginning second quarter 2016, private line (including special access) revenues were reclassified from strategic services to legacy services. All historical periods have been restated to reflect this change. See supporting financial schedules available at ir.centurylink.com. CenturyLink 3Q16 Financial Summary
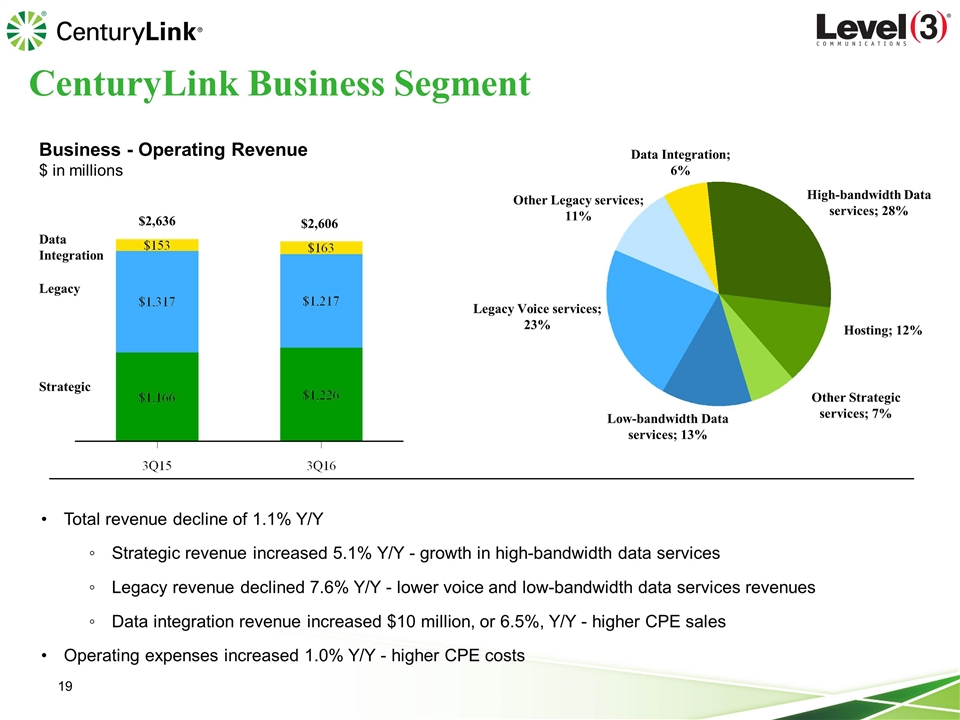
Total revenue decline of 1.1% Y/Y Strategic revenue increased 5.1% Y/Y - growth in high-bandwidth data services Legacy revenue declined 7.6% Y/Y - lower voice and low-bandwidth data services revenues Data integration revenue increased $10 million, or 6.5%, Y/Y - higher CPE sales Operating expenses increased 1.0% Y/Y - higher CPE costs Business - Operating Revenue $ in millions $2,636 $2,606 Data Integration; 6% Other Legacy services; 11% Legacy Voice services; 23% Low-bandwidth Data services; 13% Other Strategic services; 7% Hosting; 12% High-bandwidth Data services; 28% Data Integration Legacy Strategic CenturyLink Business Segment
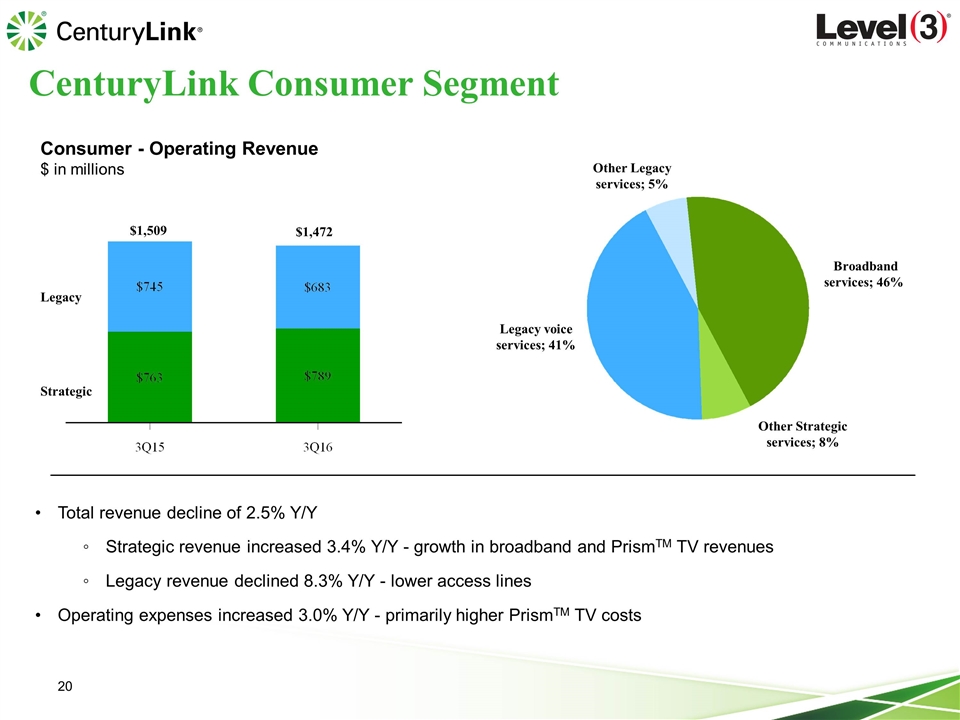
Total revenue decline of 2.5% Y/Y Strategic revenue increased 3.4% Y/Y - growth in broadband and PrismTM TV revenues Legacy revenue declined 8.3% Y/Y - lower access lines Operating expenses increased 3.0% Y/Y - primarily higher PrismTM TV costs Consumer - Operating Revenue $ in millions $1,509 $1,472 Broadband services; 46% Other Strategic services; 8% Legacy voice services; 41% Other Legacy services; 5% Legacy Strategic CenturyLink Consumer Segment
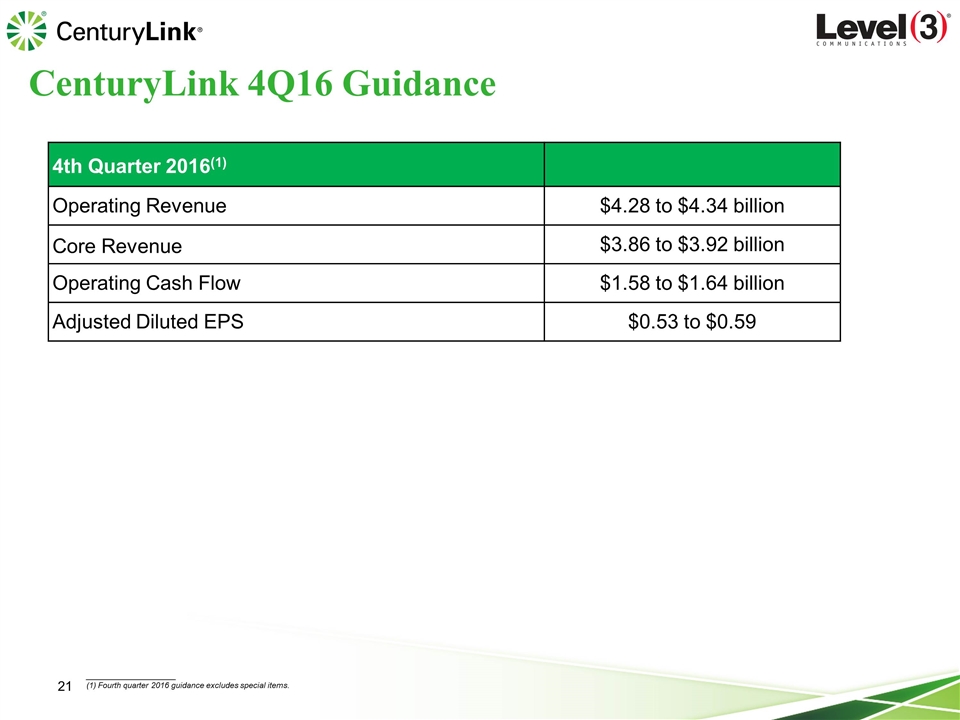
4th Quarter 2016(1) Operating Revenue $4.28 to $4.34 billion Core Revenue $3.86 to $3.92 billion Operating Cash Flow $1.58 to $1.64 billion Adjusted Diluted EPS $0.53 to $0.59 CenturyLink 4Q16 Guidance ____________________ Fourth quarter 2016 guidance excludes special items.
Level 3 3Q16 Results
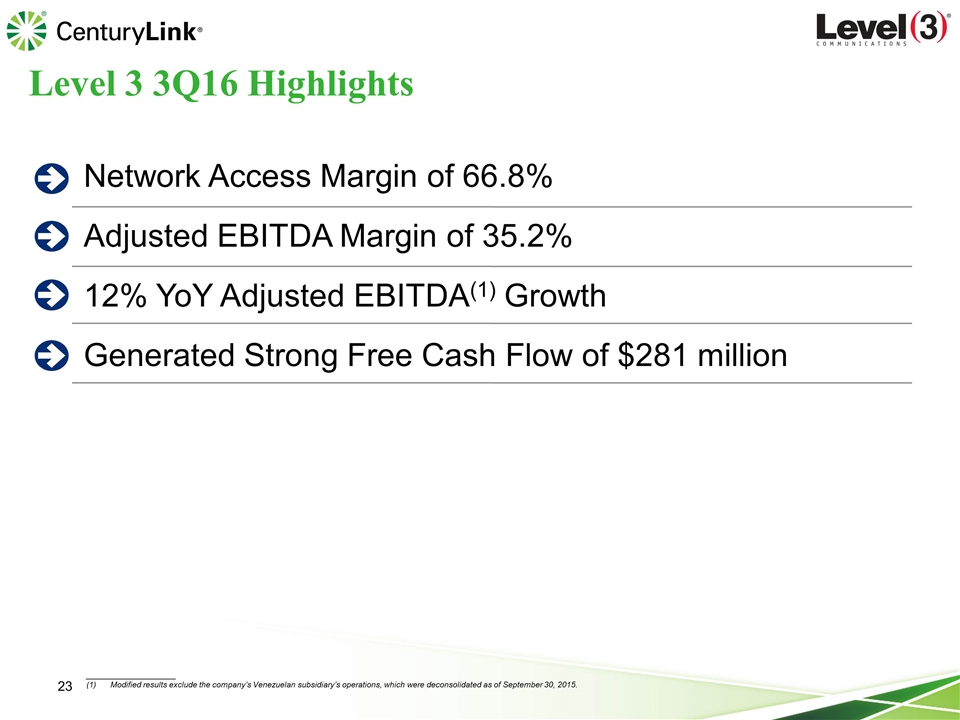
____________________ Modified results exclude the company’s Venezuelan subsidiary’s operations, which were deconsolidated as of September 30, 2015. Level 3 3Q16 Highlights Network Access Margin of 66.8% Adjusted EBITDA Margin of 35.2% 12% YoY Adjusted EBITDA(1) Growth Generated Strong Free Cash Flow of $281 million
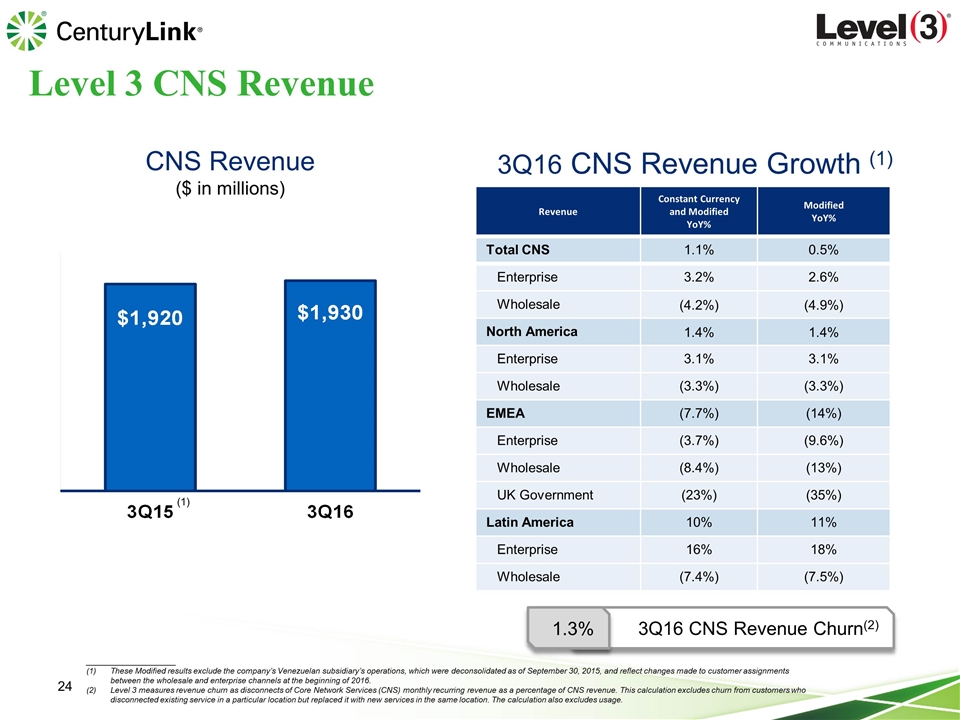
____________________ These Modified results exclude the company’s Venezuelan subsidiary’s operations, which were deconsolidated as of September 30, 2015, and reflect changes made to customer assignments between the wholesale and enterprise channels at the beginning of 2016. Level 3 measures revenue churn as disconnects of Core Network Services (CNS) monthly recurring revenue as a percentage of CNS revenue. This calculation excludes churn from customers who disconnected existing service in a particular location but replaced it with new services in the same location. The calculation also excludes usage. Level 3 CNS Revenue CNS Revenue ($ in millions) 3Q16 CNS Revenue Growth (1) Revenue Constant Currency and Modified YoY% Modified YoY% Total CNS 1.1% 0.5% Enterprise 3.2% 2.6% Wholesale (4.2%) (4.9%) North America 1.4% 1.4% Enterprise 3.1% 3.1% Wholesale (3.3%) (3.3%) EMEA (7.7%) (14%) Enterprise (3.7%) (9.6%) Wholesale (8.4%) (13%) UK Government (23%) (35%) Latin America 10% 11% Enterprise 16% 18% Wholesale (7.4%) (7.5%) 3Q16 CNS Revenue Churn(2) 1.3% (1)
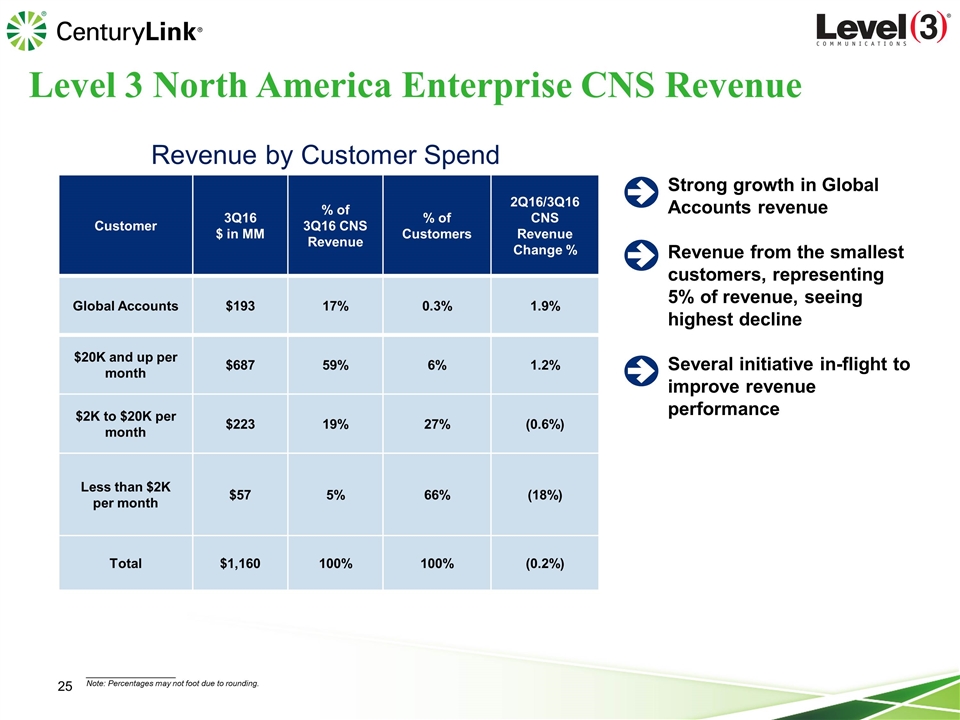
____________________ Note: Percentages may not foot due to rounding. Level 3 North America Enterprise CNS Revenue Customer 3Q16 $ in MM % of 3Q16 CNS Revenue % of Customers 2Q16/3Q16 CNS Revenue Change % Global Accounts $193 17% 0.3% 1.9% $20K and up per month $687 59% 6% 1.2% $2K to $20K per month $223 19% 27% (0.6%) Less than $2K per month $57 5% 66% (18%) Total $1,160 100% 100% (0.2%) Strong growth in Global Accounts revenue Revenue from the smallest customers, representing 5% of revenue, seeing highest decline Several initiative in-flight to improve revenue performance Revenue by Customer Spend
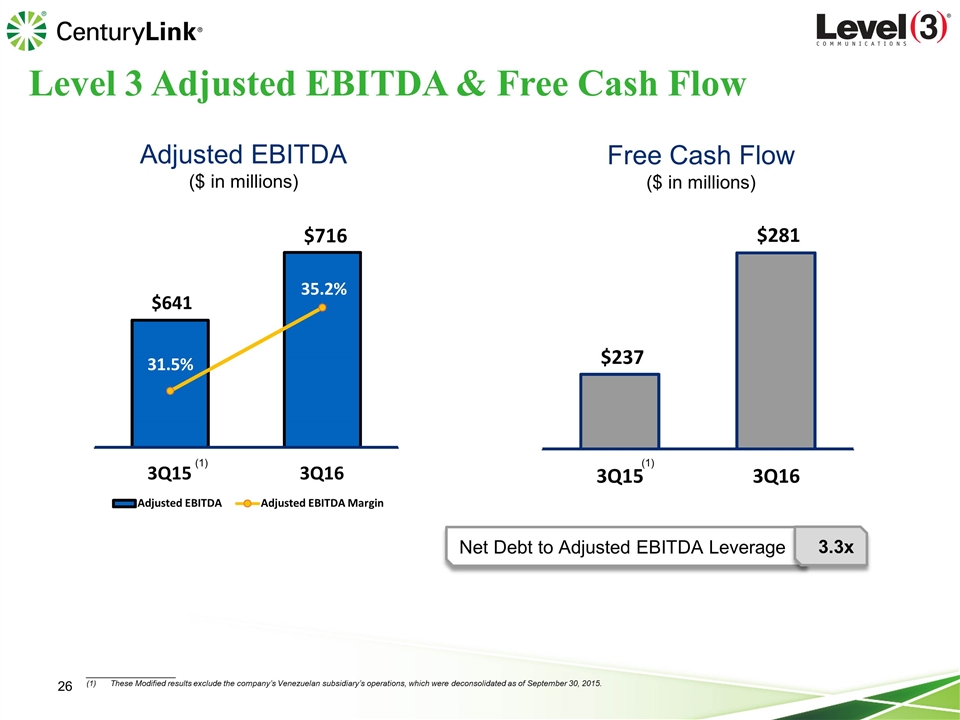
____________________ These Modified results exclude the company’s Venezuelan subsidiary’s operations, which were deconsolidated as of September 30, 2015. Level 3 Adjusted EBITDA & Free Cash Flow Net Debt to Adjusted EBITDA Leverage 3.3x Adjusted EBITDA ($ in millions) Free Cash Flow ($ in millions) (1) (1) $641 $716 31.5% 35.2% 3Q15 3Q16 Adjusted EBITDA Adjusted EBITDA Margin $237 $281 3Q15 3Q16

Q&A
