Attached files
| file | filename |
|---|---|
| EX-99.1 - EXHIBIT 99.1 - BENCHMARK ELECTRONICS INC | ex99_1.htm |
| 8-K - FORM 8-K - BENCHMARK ELECTRONICS INC | form8-k.htm |
Exhibit 99.2

design develop deliver advanced technology Q3 - 2016 Earnings Presentation October 20, 2016
design develop deliver advanced technology 2 Forward - Looking Statements This document contains forward - looking statements within the scope of the Securities Act of 1933 and the Securities Exchange Act of 1934. The words “expect,” “estimate,” “anticipate,” “predict” and similar expressions, and the negatives thereof, often identify forward - looking statements, which are not limited to historical facts. F orward - looking statements include, among other things: guidance for the fourth quarter of 2016 relating to sales; statements , express or implied, concerning future operating results or margins, the ability to generate sales and income or cash flow; and Benchmark’s business and growth strategies and expected growth and performance. Although Benchmark believes these statements are based upon reasonable assumptions, they involve risks and uncertainties relating to operations , markets and the business environment generally. If one or more of these risks or uncertainties materializes, or underlying assumptions prove incorrect, actual outcomes may vary materially from those indicated. All forward - looking statements included in this document are based upon information available to the Company as of the date of this document, and it assumes no obligation to update them. Readers are advised to consult further disclosures on related subjects, particularly in Item 1A, “Risk Factors”, of the Company’s annual report on Form 10 - K for the year ended December 31, 2015, in its other filings with the Securities and Exchange Commission and in its press releases. Non - GAAP Financial Information This document includes certain financial measures, such as operating margin, that exclude items and therefore are not in accordance with generally accepted accounting principles (“GAAP”). A detailed reconciliation between GAAP results and results excluding special items (“non - GAAP”) is included in the Appendix of this document. Management discloses non - GAAP information to provide investors with additional information to analyze the Company’s performance and underlying trends. Management uses non - GAAP measures of net income and earnings per share that exclude certain items in order to better assess operating performance and help investors compare results with our previous guidance. This document also references “free cash flow”, which the Company defines as cash flow from operations less additions to property, plant and equipment and purchased software.

design develop deliver advanced technology 3 CEO Update

design develop deliver advanced technology 4 Third Quarter 2016 Summary Revenue and operating margins within guidance ▪ Strong demand in Test & Instrumentation market ▪ Delays in Telco product ramps ▪ Modest improvement in gross margins even with revenue declines Good progress on working capital management ▪ Achieved 80 - day cash conversion target ▪ Actions aligned for further improvement Strong cash flows and 37 th consecutive quarter of buybacks ▪ Generated operating cash flows of $70 million ▪ Returned $12M of domestic cash through buybacks
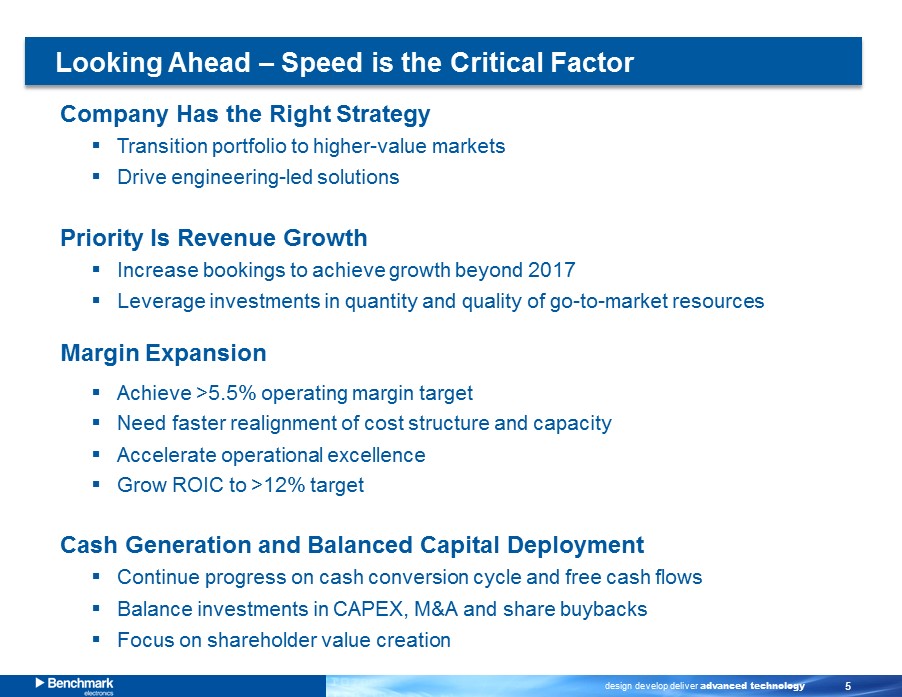
design develop deliver advanced technology 5 Looking Ahead – Speed is the Critical Factor Company Has the Right Strategy ▪ Transition portfolio to higher - value markets ▪ Drive engineering - led solutions Priority Is Revenue G rowth ▪ Increase bookings to achieve growth beyond 2017 ▪ Leverage i nvestments in quantity and quality of go - to - market resources Margin Expansion ▪ Achieve >5.5% operating margin target ▪ Need faster realignment of cost structure and capacity ▪ Accelerate operational excellence ▪ Grow ROIC to >12% target Cash Generation and Balanced Capital Deployment ▪ Continue progress on cash conversion cycle and free cash flows ▪ Balance investments in CAPEX, M&A and share buybacks ▪ Focus on shareholder value creation

design develop deliver advanced technology 6 Q3 2016 Financial Highlights
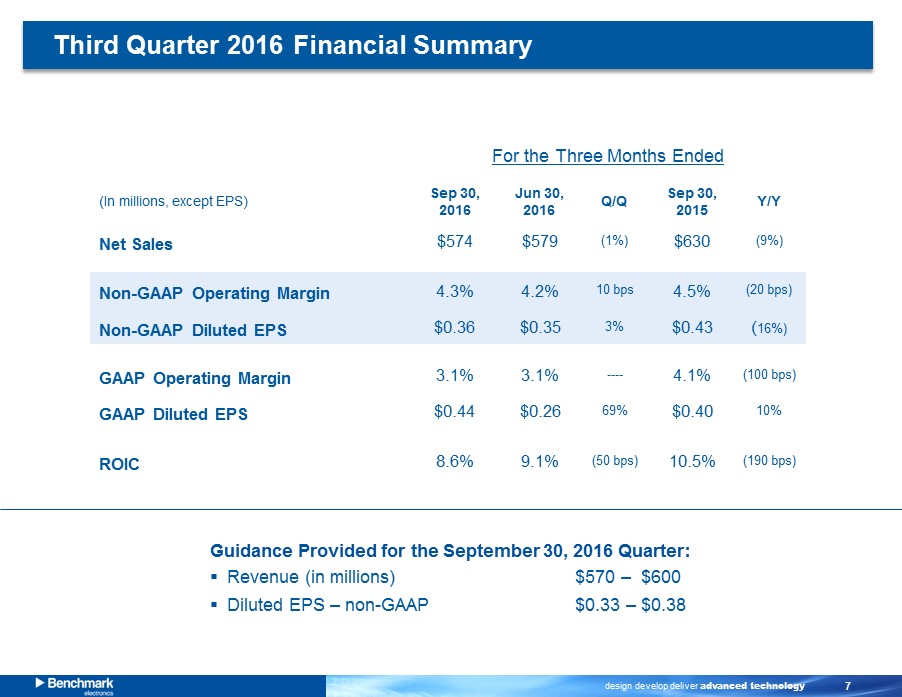
design develop deliver advanced technology 7 (In millions, except EPS) Sep 30 , 2016 Jun 30 , 2016 Q/Q Sep 30 , 2015 Y/Y Net Sales $574 $579 (1%) $630 (9%) Non - GAAP Operating Margin 4.3% 4.2% 10 bps 4.5% (20 bps) Non - GAAP Diluted EPS $0.36 $0.35 3% $0.43 ( 16%) GAAP Operating Margin 3.1% 3.1% ---- 4.1% (100 bps) GAAP Diluted EPS $0.44 $0.26 69% $0.40 10% ROIC 8.6% 9.1% (50 bps) 10.5% (190 bps) For the Three Months Ended Guidance Provided for the September 30, 2016 Quarter: ▪ Revenue (in millions) $570 – $600 ▪ Diluted EPS – non - GAAP $0.33 – $0.38 Third Quarter 2016 Financial Summary
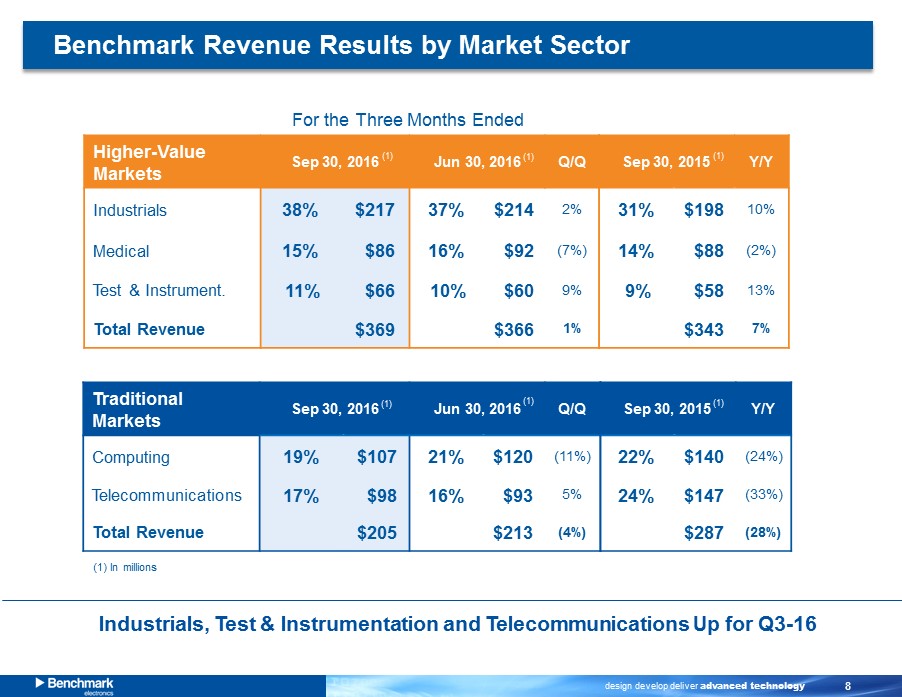
design develop deliver advanced technology 8 Higher - Value Markets Sep 30 , 2016 Jun 30 , 2016 Q/Q Industrials 38% $217 37% $214 2% Medical 15% $86 16% $92 (7%) Test & Instrument. 11% $66 10% $60 9% Total Revenue $369 $366 1% Traditional Markets Sep 30 , 2016 Jun 30 , 2016 Q/Q Computing 19% $107 21% $120 (11%) Telecommunication s 17% $98 16% $93 5% Total Revenue $205 $213 (4%) Benchmark Revenue Results by Market Sector For the Three Months Ended Industrials, Test & Instrumentation and Telecommunications Up for Q3 - 16 (1) (1) (1) In millions (1) (1) Sep 30 , 2015 Y/Y 31% $198 10% 14% $88 (2%) 9% $58 13% $343 7% Sep 30 , 2015 Y/Y 22% $140 (24%) 24% $147 (33%) $287 (28%) (1) (1)

design develop deliver advanced technology 9 28.3 30.1 21.9 24.3 24.7 4.5% 4.8% 4.0% 4.2% 4.3% 0.0% 1.0% 2.0% 3.0% 4.0% 5.0% 6.0% 7.0% 0.0 10.0 20.0 30.0 40.0 50.0 60.0 Q3-15 Q4-15 Q1-16 Q2-16 Q3-16 630 626 549 579 574 8.7% 9.1% 9.2% 9.1% 9.2% 1.0% 3.0% 5.0% 7.0% 9.0% 11.0% 13.0% 15.0% 0 200 400 600 800 1,000 1,200 1,400 Q3-15 Q4-15 Q1-16 Q2-16 Q3-16 10.2% 10.5% 10.2% 9.6% 9.1% 8.6% 0.0% 2.0% 4.0% 6.0% 8.0% 10.0% 12.0% 14.0% 16.0% 18.0% 20.0% Q2-15 Q3-15 Q4-15 Q1-16 Q2-16 Q3-16 Revenue & Gross Margin ($ M ) Key Business Trends Return on Invested Capital (LTM) ROIC = [(Non - GAAP income from operations plus stock compensation )*( 1 - Tax Rate )] ÷ [ Average Invested Capital less Average Cash for last 5 quarters] Non - GAAP Operating Margin 26.2 26.8 28.5 28.5 28.1 4.2% 4.3% 5.2% 4.9% 4.9% 0.0% 1.0% 2.0% 3.0% 4.0% 5.0% 6.0% 7.0% 8.0% 0.0 10.0 20.0 30.0 40.0 50.0 60.0 70.0 Q3-15 Q4-15 Q1-16 Q2-16 Q3-16 SG&A ($M)
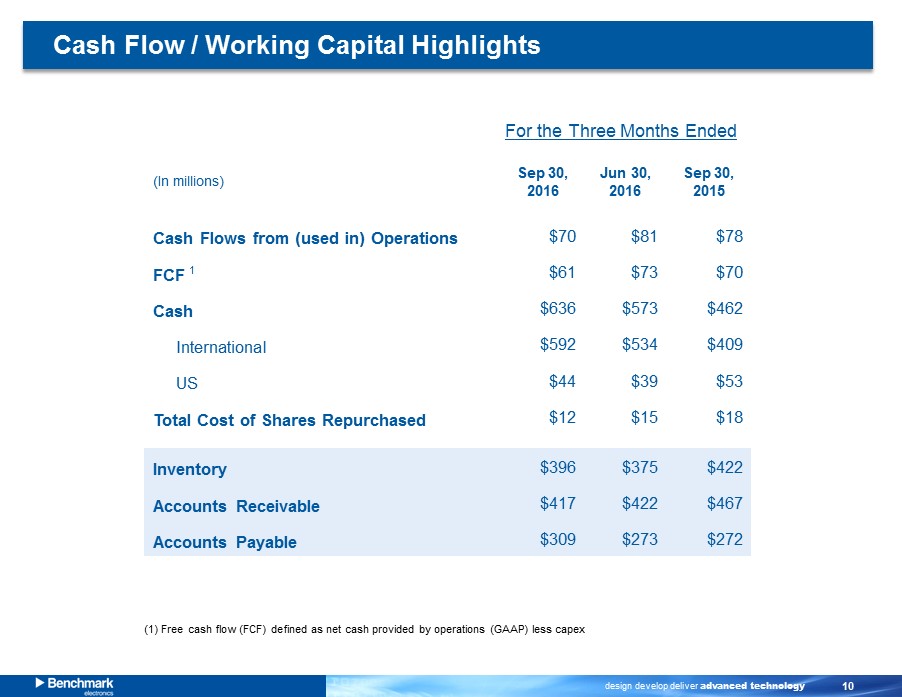
design develop deliver advanced technology 10 (In millions) Sep 30 , 2016 Jun 30 , 2016 Sep 30, 2015 Cash Flows from (used in) Operations $70 $81 $78 FCF $61 $73 $70 Cash $636 $573 $462 International $592 $534 $409 US $44 $39 $53 Total Cost of Shares Repurchased $12 $15 $18 Inventory $396 $375 $422 Accounts Receivable $417 $422 $467 Accounts Payable $309 $273 $272 Cash Flow / Working Capital Highlights For the Three Months Ended (1) Free cash flow (FCF) defined as net cash provided by operations (GAAP) less capex 1

design develop deliver advanced technology 11 Working Capital Update We are committed to a 75 - day target exiting the year 99 91 90 94 99 83 80 75 30 50 70 90 110 Q1-15 Q2-15 Q3-15 Q4-15 Q1-16 Q2-16 Q3-16 Q4-16 Target Accounts Receivable Days Accounts Payable Days Inventory Days Q1-15 Q2-15 Q3-15 Q4-15 Q1-16 Q2-16 Q3-16 Accounts Receivable Days 71 68 67 69 68 66 65 Accounts Payable Days 39 43 43 40 39 47 53 Inventory Days 67 66 66 65 70 64 68 Cash Conversion Cycle 99 91 90 94 99 83 80

design develop deliver advanced technology 12 Share Repurchases 37 th Consecutive Quarter of Stock Repurchases $531 million returned to shareholders since 2007 $94 m illion remaining on authorized purchase plan Inception to 2016 2011 - 2016 Last 3 Years $US Stock Repurchases (M ) $531 $298 $164 Buyback % of FCF 52% 53% 42% 56.3 47.1 41.2 43.8 68.4 56.9 59.8 56.6 54.8 54.2 52.1 50.1 0.0 10.0 20.0 30.0 40.0 50.0 60.0 70.0 0 10 20 30 40 50 60 70 80 90 100 2011 2012 2013 2014 2015 LTM Q3-16 Share Repurchases Shares Outstanding

design develop deliver advanced technology 13 New Business Wins by Segment ▪ 29 manufacturing and 20 engineering project awards ▪ Estimated annual revenue run rate between $110 - 135 million ▪ Continued new business wins in targeted markets Estimated Annual Revenue from New Business Wins Third Quarter 2016 New Business Wins $115 $120 $120 $125 $125 $118 $123 $- $10 $20 $30 $40 $50 $60 $70 $80 $90 $100 $110 $120 $130 $140 $150 $160 Q1-15 Q2-15 Q3-15 Q4-15 Q1-16 Q2-16 Q3-16 $ (USD M)

design develop deliver advanced technology 14 Guidance Net Sales (in millions) $590 – $610 Operating Margin – non - GAAP* 4.4% – 4.8% Interest Expense (in millions) $2.3 Effective Tax Rate 22% Diluted EPS – GAAP $0.33 – $0.37 Diluted EPS – non - GAAP* $0.39 – $0.43 * The above guidance excludes the impact of amortization of intangible assets and estimated restructuring charges – See Appendix 1 Fourth Quarter 2016 Guidance
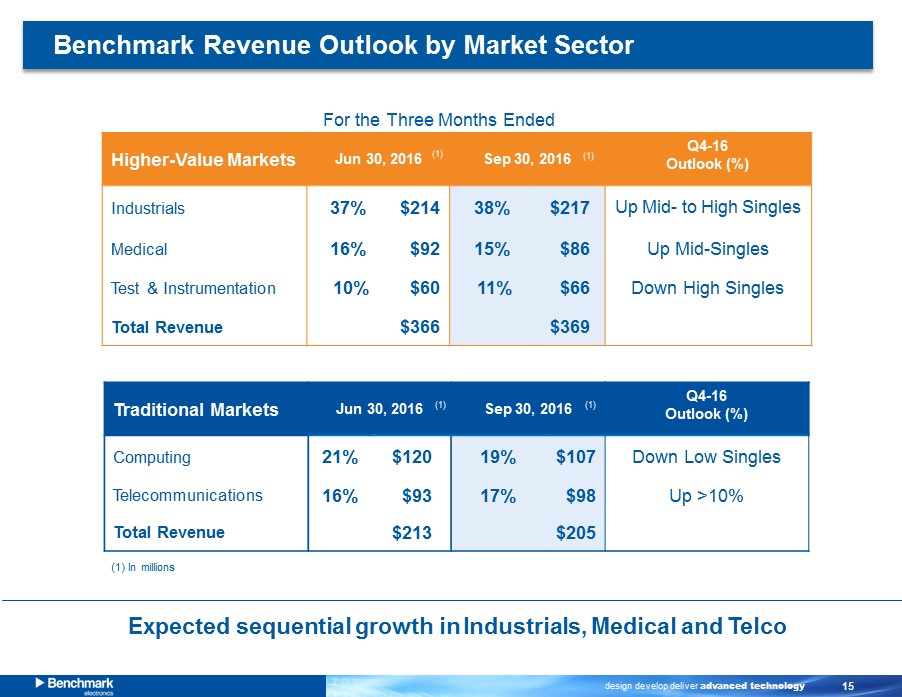
design develop deliver advanced technology 15 Higher - Value Markets Jun 30 , 2016 Sep 30 , 2016 Q4 - 16 Outlook (%) Industrials 37% $214 38% $217 Up Mid - to High Singles Medical 16% $92 15% $86 Up Mid - Singles Test & Instrumentation 10% $60 11% $66 Down High Singles Total Revenue $366 $369 Traditional Markets Jun 30 , 2016 Sep 30 , 2016 Q4 - 16 Outlook (%) Computing 21% $120 19% $107 Down Low Singles Telecommunication s 16% $93 17% $98 Up >10% Total Revenue $213 $205 Benchmark Revenue Outlook by Market Sector For the Three Months Ended Expected sequential growth in Industrials, Medical and Telco (1) (1) (1) In millions (1) (1)
design develop deliver advanced technology 16 Appendix
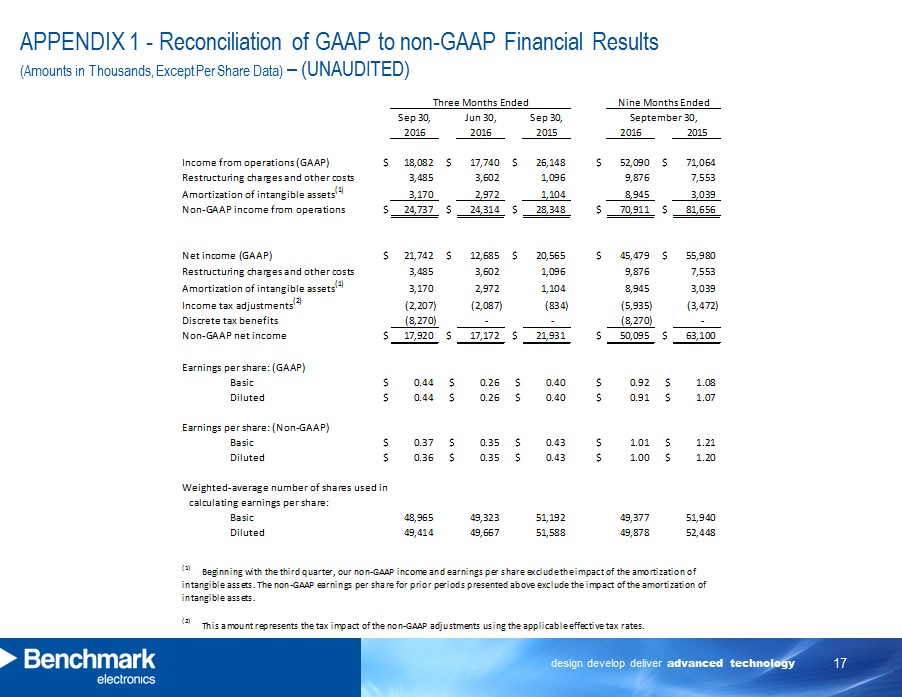
design develop deliver advanced technology 17 APPENDIX 1 - Reconciliation of GAAP to non - GAAP Financial Results (Amounts in Thousands, Except Per Share Data) – (UNAUDITED) Sep 30, Jun 30, Sep 30, 2016 2016 2015 2016 2015 $ 18,082 $ 17,740 $ 26,148 $ 52,090 $ 71,064 3,485 3,602 1,096 9,876 7,553 3,170 2,972 1,104 8,945 3,039 $ 24,737 $ 24,314 $ 28,348 $ 70,911 $ 81,656 $ 21,742 $ 12,685 $ 20,565 $ 45,479 $ 55,980 3,485 3,602 1,096 9,876 7,553 3,170 2,972 1,104 8,945 3,039 (2,207) (2,087) (834) (5,935) (3,472) (8,270) - - (8,270) - $ 17,920 $ 17,172 $ 21,931 $ 50,095 $ 63,100 Basic $ 0.44 $ 0.26 $ 0.40 $ 0.92 $ 1.08 Diluted $ 0.44 $ 0.26 $ 0.40 $ 0.91 $ 1.07 Basic $ 0.37 $ 0.35 $ 0.43 $ 1.01 $ 1.21 Diluted $ 0.36 $ 0.35 $ 0.43 $ 1.00 $ 1.20 Basic 48,965 49,323 51,192 49,377 51,940 Diluted 49,414 49,667 51,588 49,878 52,448 (2) This amount represents the tax impact of the non-GAAP adjustments using the applicable effective tax rates. (1) Beginning with the third quarter, our non-GAAP income and earnings per share exclude the impact of the amortization of intangible assets. The non-GAAP earnings per share for prior periods presented above exclude the impact of the amortization of intangible assets. calculating earnings per share: Non-GAAP income from operations Non-GAAP net income Earnings per share: (GAAP) Earnings per share: (Non-GAAP) Restructuring charges and other costs Discrete tax benefits Weighted-average number of shares used in Income tax adjustments (2) Amortization of intangible assets (1) Income from operations (GAAP) Net income (GAAP) Nine Months EndedThree Months Ended September 30, Restructuring charges and other costs Amortization of intangible assets (1)