Attached files
| file | filename |
|---|---|
| EX-99.1 - EX-99.1 - Virtu KCG Holdings LLC | d255015dex991.htm |
| 8-K - FORM 8-K - Virtu KCG Holdings LLC | d255015d8k.htm |
KCG Holdings, Inc. (KCG) 3rd Quarter 2016 Earnings Presentation October 20, 2016 Exhibit 99.2
Safe Harbor Certain statements contained herein and the documents incorporated by reference containing the words "believes," "intends," "expects," "anticipates," and words of similar meaning, may constitute forward-looking statements as defined in the Private Securities Litigation Reform Act of 1995. These "forward-looking statements" are not historical facts and are based on current expectations, estimates and projections about KCG's industry, management's beliefs and certain assumptions made by management, many of which, by their nature, are inherently uncertain and beyond our control. Any forward-looking statement contained herein speaks only as of the date on which it is made. Accordingly, readers are cautioned that any such forward-looking statements are not guarantees of future performance and are subject to certain risks, uncertainties and assumptions that are difficult to predict including, without limitation, risks associated with: (i) the inability to manage trading strategy performance and grow revenue and earnings; (ii) the receipt of additional payments from the sale of KCG Hotspot that are subject to certain contingencies; (iii) changes in market structure, legislative, regulatory or financial reporting rules, including the increased focus by Congress, federal and state regulators, the SROs and the media on market structure issues, and in particular, the scrutiny of high frequency trading, alternative trading systems, market fragmentation, colocation, access to market data feeds, and remuneration arrangements such as payment for order flow and exchange fee structures; (iv) past or future changes to KCG's organizational structure and management; (v) KCG's ability to develop competitive new products and services in a timely manner and the acceptance of such products and services by KCG's customers and potential customers; (vi) KCG's ability to keep up with technological changes; (vii) KCG's ability to effectively identify and manage market risk, operational and technology risk, cybersecurity risk, legal risk, liquidity risk, reputational risk, counterparty and credit risk, international risk, regulatory risk, and compliance risk; (viii) the cost and other effects of material contingencies, including litigation contingencies, and any adverse judicial, administrative or arbitral rulings or proceedings; (ix) the effects of increased competition and KCG's ability to maintain and expand market share; (x) the announced plan to relocate KCG's global headquarters from Jersey City, NJ to New York, NY; and (xi) KCG's ability to complete the sale or disposition of any or all of the assets or businesses that are classified as held for sale. The list above is not exhaustive. Because forward looking statements involve risks and uncertainties, the actual results and performance of KCG may materially differ from the results expressed or implied by such statements. Given these uncertainties, readers are cautioned not to place undue reliance on such forward-looking statements. Unless otherwise required by law, KCG also disclaims any obligation to update its view of any such risks or uncertainties or to announce publicly the result of any revisions to the forward-looking statements made herein. Readers should carefully review the risks and uncertainties disclosed in KCG's reports with the U.S. Securities and Exchange Commission ("SEC"), including those detailed in "Risk Factors" in Part I, Item 1A of KCG's Annual Report on Form10-K for the year ended December 31, 2015, "Legal Proceedings" in Part I, Item 3, under "Certain Factors Affecting Results of Operations" in "Management's Discussion and Analysis of Financial Condition and Results of Operations" in Part II, Item 7, in "Quantitative and Qualitative Disclosures About Market Risk" in Part II, Item 7A, and in other reports or documents KCG files with, or furnishes to, the SEC from time to time. This information should be read in conjunction with KCG's Consolidated Financial Statements and the Notes thereto contained in its Annual Report on Form 10-K, Quarterly Report on Form 10-Q, and in other reports or documents KCG files with, or furnishes to, the SEC from time to time to time. For additional disclosures, please see https://www.kcg.com/legal/global-disclosures.
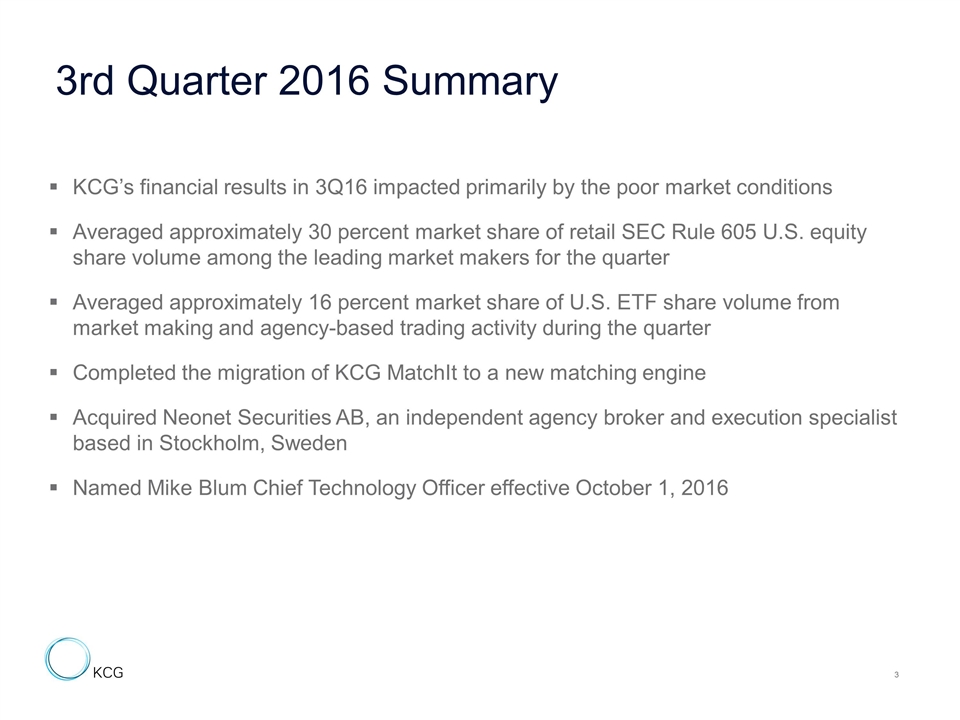
KCG’s financial results in 3Q16 impacted primarily by the poor market conditions Averaged approximately 30 percent market share of retail SEC Rule 605 U.S. equity share volume among the leading market makers for the quarter Averaged approximately 16 percent market share of U.S. ETF share volume from market making and agency-based trading activity during the quarter Completed the migration of KCG MatchIt to a new matching engine Acquired Neonet Securities AB, an independent agency broker and execution specialist based in Stockholm, Sweden Named Mike Blum Chief Technology Officer effective October 1, 2016 3rd Quarter 2016 Summary
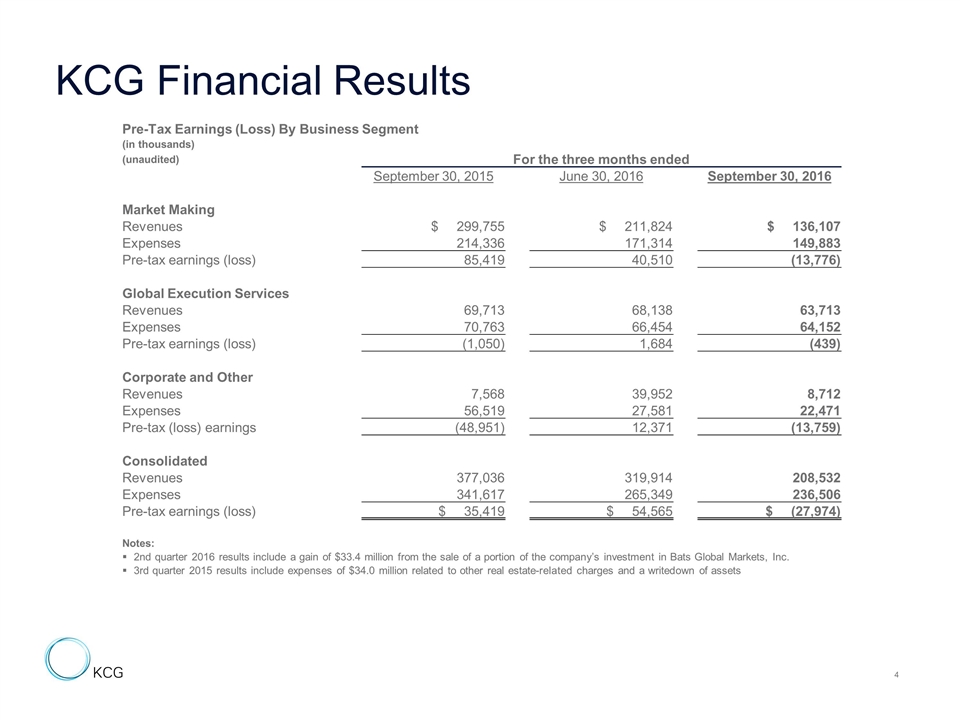
KCG Financial Results Pre-Tax Earnings (Loss) By Business Segment (in thousands) (unaudited) For the three months ended September 30, 2015 June 30, 2016 September 30, 2016 Market Making Revenues $ 299,755 $ 211,824 $ 136,107 Expenses 214,336 171,314 149,883 Pre-tax earnings (loss) 85,419 40,510 (13,776) Global Execution Services Revenues 69,713 68,138 63,713 Expenses 70,763 66,454 64,152 Pre-tax earnings (loss) (1,050) 1,684 (439) Corporate and Other Revenues 7,568 39,952 8,712 Expenses 56,519 27,581 22,471 Pre-tax (loss) earnings (48,951) 12,371 (13,759) Consolidated Revenues 377,036 319,914 208,532 Expenses 341,617 265,349 236,506 Pre-tax earnings (loss) $ 35,419 $ 54,565 $ (27,974) Notes: 2nd quarter 2016 results include a gain of $33.4 million from the sale of a portion of the company’s investment in Bats Global Markets, Inc. 3rd quarter 2015 results include expenses of $34.0 million related to other real estate-related charges and a writedown of assets
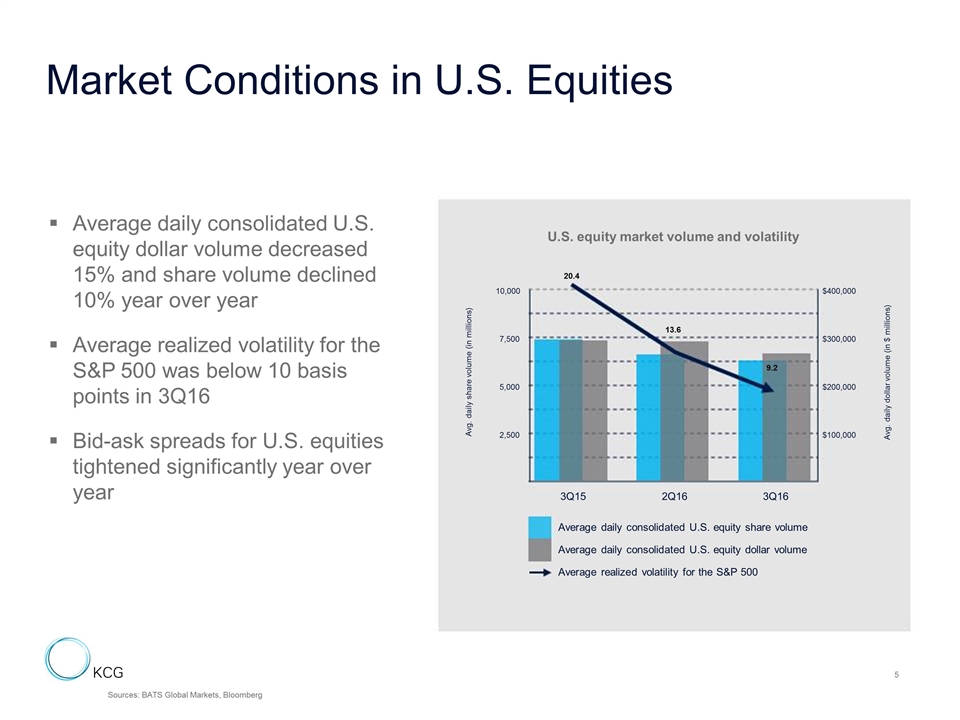
Market Conditions in U.S. Equities Average daily consolidated U.S. equity dollar volume decreased 15% and share volume declined 10% year over year Average realized volatility for the S&P 500 was below 10 basis points in 3Q16 Bid-ask spreads for U.S. equities tightened significantly year over year Sources: BATS Global Markets, Bloomberg U.S. equity market volume and volatility 13.6 20.4 9.2 10,000 $400,000 7,500 $300,000 5,000 $200,000 2,500 $100,000 3Q15 2Q16 3Q16 Average daily consolidated U.S. equity share volume Average daily consolidated U.S. equity dollar volume Average realized volatility for the S&P 500 Avg. daily share volume (in millions) Avg. daily dollar volume (in $ millions)
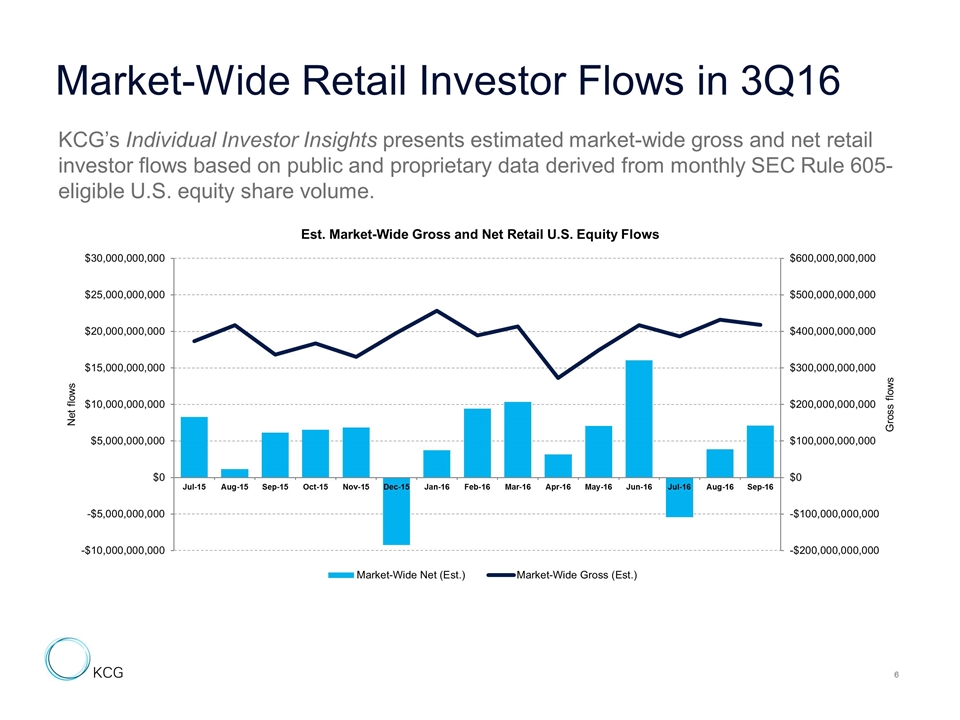
Market-Wide Retail Investor Flows in 3Q16 KCG’s Individual Investor Insights presents estimated market-wide gross and net retail investor flows based on public and proprietary data derived from monthly SEC Rule 605-eligible U.S. equity share volume.
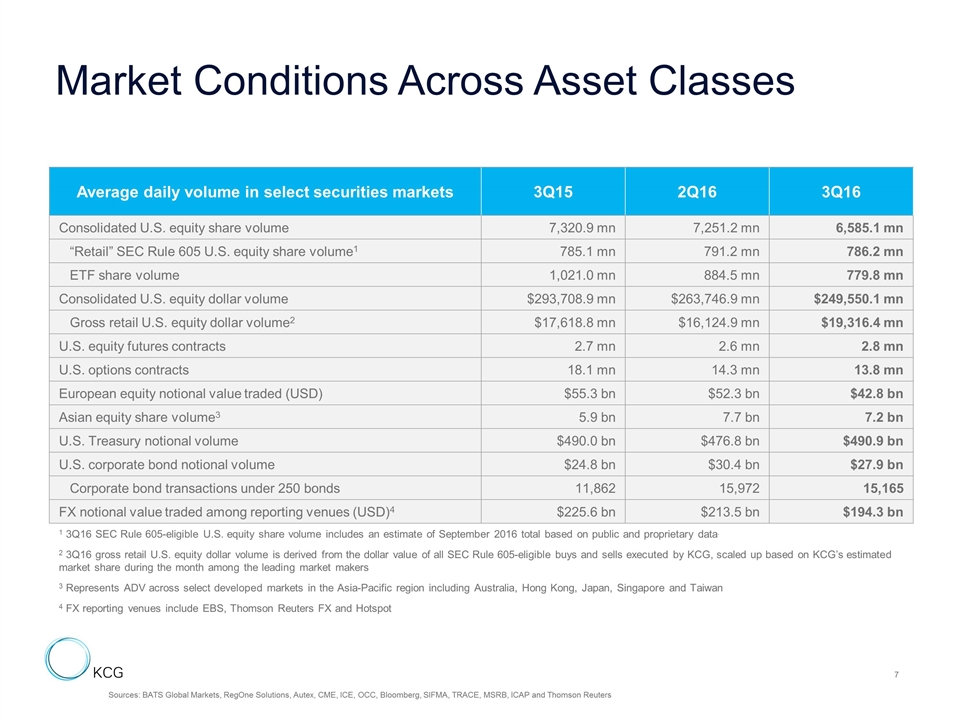
Market Conditions Across Asset Classes Average daily volume in select securities markets 3Q15 2Q16 3Q16 Consolidated U.S. equity share volume 7,320.9 mn 7,251.2 mn 6,585.1 mn “Retail” SEC Rule 605 U.S. equity share volume1 785.1 mn 791.2 mn 786.2 mn ETF share volume 1,021.0 mn 884.5 mn 779.8 mn Consolidated U.S. equity dollar volume $293,708.9 mn $263,746.9 mn $249,550.1 mn Gross retail U.S. equity dollar volume2 $17,618.8 mn $16,124.9 mn $19,316.4 mn U.S. equity futures contracts 2.7 mn 2.6 mn 2.8 mn U.S. options contracts 18.1 mn 14.3 mn 13.8 mn European equity notional value traded (USD) $55.3 bn $52.3 bn $42.8 bn Asian equity share volume3 5.9 bn 7.7 bn 7.2 bn U.S. Treasury notional volume $490.0 bn $476.8 bn $490.9 bn U.S. corporate bond notional volume $24.8 bn $30.4 bn $27.9 bn Corporate bond transactions under 250 bonds 11,862 15,972 15,165 FX notional value traded among reporting venues (USD)4 $225.6 bn $213.5 bn $194.3 bn 1 3Q16 SEC Rule 605-eligible U.S. equity share volume includes an estimate of September 2016 total based on public and proprietary data. 2 3Q16 gross retail U.S. equity dollar volume is derived from the dollar value of all SEC Rule 605-eligible buys and sells executed by KCG, scaled up based on KCG’s estimated market share during the month among the leading market makers 3 Represents ADV across select developed markets in the Asia-Pacific region including Australia, Hong Kong, Japan, Singapore and Taiwan 4 FX reporting venues include EBS, Thomson Reuters FX and Hotspot Sources: BATS Global Markets, RegOne Solutions, Autex, CME, ICE, OCC, Bloomberg, SIFMA, TRACE, MSRB, ICAP and Thomson Reuters
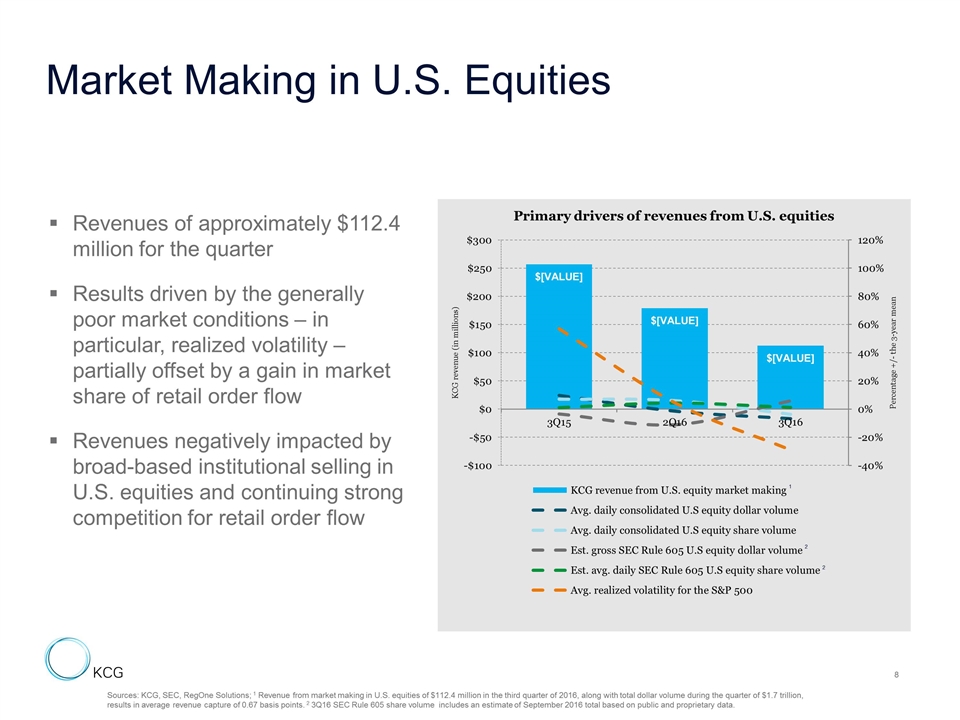
Market Making in U.S. Equities Sources: KCG, SEC, RegOne Solutions; 1 Revenue from market making in U.S. equities of $112.4 million in the third quarter of 2016, along with total dollar volume during the quarter of $1.7 trillion, results in average revenue capture of 0.67 basis points. 2 3Q16 SEC Rule 605 share volume includes an estimate of September 2016 total based on public and proprietary data. Revenues of approximately $112.4 million for the quarter Results driven by the generally poor market conditions – in particular, realized volatility – partially offset by a gain in market share of retail order flow Revenues negatively impacted by broad-based institutional selling in U.S. equities and continuing strong competition for retail order flow 1 2 2
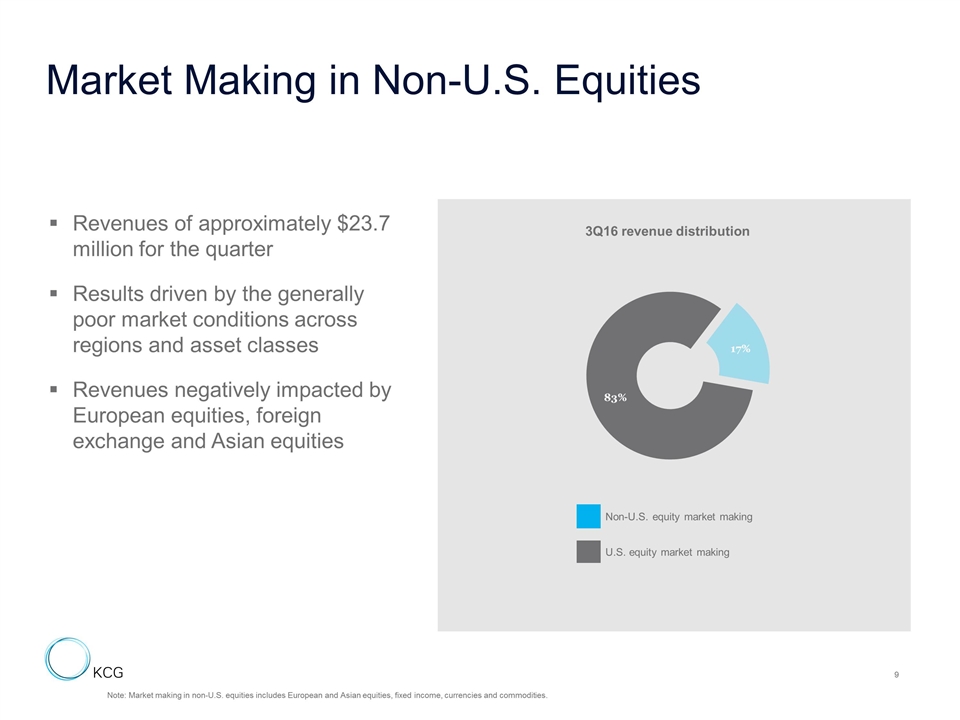
Market Making in Non-U.S. Equities Note: Market making in non-U.S. equities includes European and Asian equities, fixed income, currencies and commodities. Revenues of approximately $23.7 million for the quarter Results driven by the generally poor market conditions across regions and asset classes Revenues negatively impacted by European equities, foreign exchange and Asian equities Non-U.S. equity market making U.S. equity market making 3Q16 revenue distribution
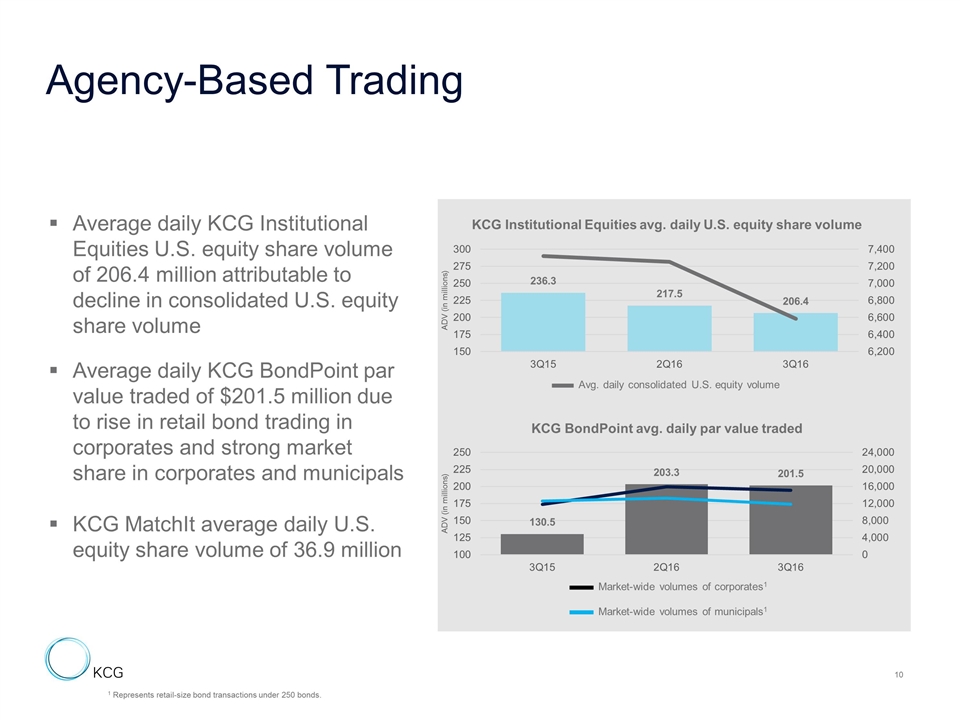
Agency-Based Trading Average daily KCG Institutional Equities U.S. equity share volume of 206.4 million attributable to decline in consolidated U.S. equity share volume Average daily KCG BondPoint par value traded of $201.5 million due to rise in retail bond trading in corporates and strong market share in corporates and municipals KCG MatchIt average daily U.S. equity share volume of 36.9 million KCG Institutional Equities avg. daily U.S. equity share volume KCG BondPoint avg. daily par value traded Market-wide volumes of corporates1 Market-wide volumes of municipals1 Avg. daily consolidated U.S. equity volume 1 Represents retail-size bond transactions under 250 bonds.
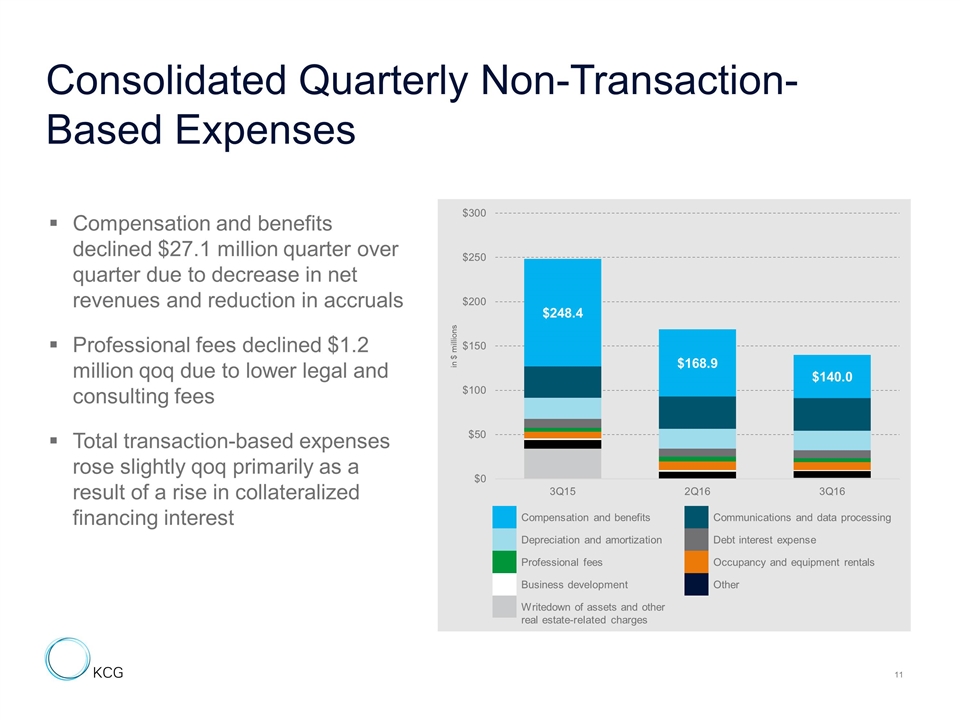
Consolidated Quarterly Non-Transaction-Based Expenses Compensation and benefits declined $27.1 million quarter over quarter due to decrease in net revenues and reduction in accruals Professional fees declined $1.2 million qoq due to lower legal and consulting fees Total transaction-based expenses rose slightly qoq primarily as a result of a rise in collateralized financing interest Compensation and benefits Communications and data processing Depreciation and amortization Debt interest expense Professional fees Occupancy and equipment rentals Business development Other Writedown of assets and other real estate-related charges
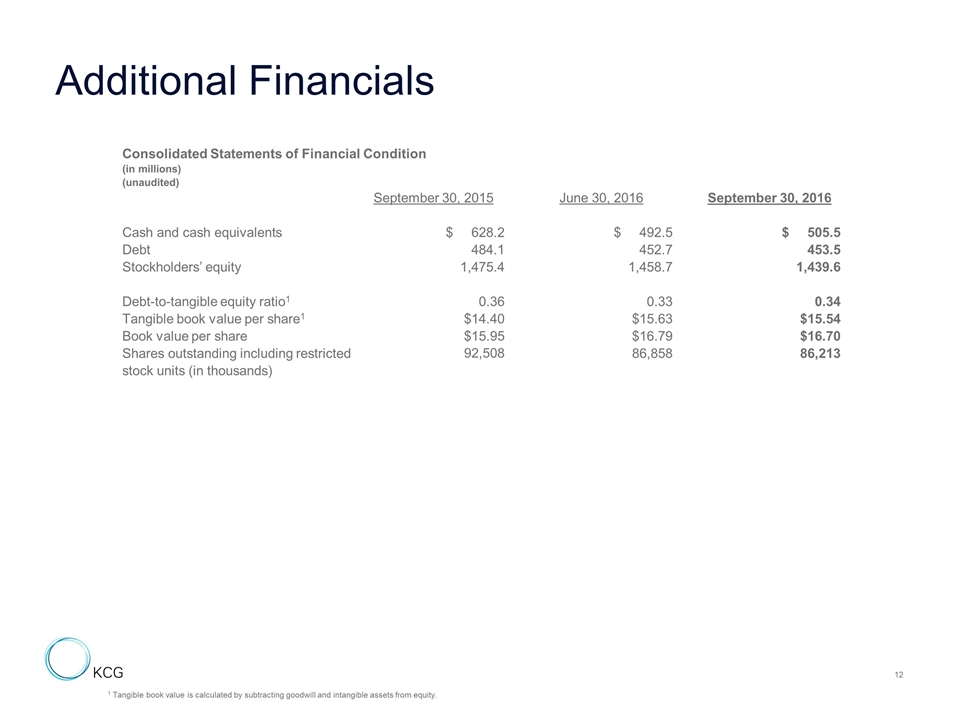
Additional Financials Consolidated Statements of Financial Condition (in millions) (unaudited) September 30, 2015 June 30, 2016 September 30, 2016 Cash and cash equivalents $ 628.2 $ 492.5 $ 505.5 Debt 484.1 452.7 453.5 Stockholders’ equity 1,475.4 1,458.7 1,439.6 Debt-to-tangible equity ratio1 0.36 0.33 0.34 Tangible book value per share1 $14.40 $15.63 $15.54 Book value per share $15.95 $16.79 $16.70 Shares outstanding including restricted 92,508 86,858 86,213 stock units (in thousands) 1 Tangible book value is calculated by subtracting goodwill and intangible assets from equity.
