Attached files
| file | filename |
|---|---|
| EX-32.2 - EXHIBIT 32.2 - Apigee Corp | apic10-kex322.htm |
| EX-32.1 - EXHIBIT 32.1 - Apigee Corp | apic10-kex321.htm |
| EX-31.2 - EXHIBIT 31.2 - Apigee Corp | apic10-kex312.htm |
| EX-31.1 - EXHIBIT 31.1 - Apigee Corp | apic10-kex311.htm |
| EX-23.1 - EXHIBIT 23.1 - Apigee Corp | apic10-kex231.htm |
| EX-10.14 - EXHIBIT 10.14 - Apigee Corp | apic10-kex1014.htm |
UNITED STATES
SECURITIES AND EXCHANGE COMMISSION
WASHINGTON, DC 20549
FORM 10-K
(Mark One)
☒ | ANNUAL REPORT PURSUANT TO SECTION 13 OR 15(d) OF THE SECURITIES EXCHANGE ACT OF 1934 |
For the fiscal year ended July 31, 2016
OR
☐ | TRANSITION REPORT PURSUANT TO SECTION 13 OR 15(d) OF THE SECURITIES EXCHANGE ACT OF 1934 |
For the transition period from to
Commission File Number: 001-37346
APIGEE CORPORATION
(Exact Name of Registrant as Specified in its Charter)
Delaware | 20-1367539 | |
(State or other jurisdiction of incorporation or organization) | (I.R.S. Employer Identification No.) | |
10 S. Almaden Blvd., 16th Floor
San Jose, California 95113
(Address of principal executive offices, including zip code)
(408) 343-7300
(Registrant’s telephone number, including area code)
Indicate by check mark if the registrant is a well-known seasoned issuer, as defined in Rule 405 of the Securities Act: Yes ☐ No ☒
Indicate by check mark if the registrant is not required to file reports pursuant to Section 13 or Section 15(d) of the Act: Yes ☐ No ☒
Indicate by check mark whether the registrant: (1) has filed all reports required to be filed by Section 13 or 15(d) of the Securities Exchange Act of 1934 during the preceding 12 months (or for such shorter period that the registrant was required to file such reports), and (2) has been subject to such filing requirements for the past 90 days. Yes ☒ No ☐
Indicate by check mark whether the registrant has submitted electronically and posted on its corporate Web site, if any, every Interactive Data File required to be submitted and posted pursuant to Rule 405 of Regulation S-T (§232.405 of this chapter) during the preceding 12 months (or for such shorter period that the registrant was required to submit and post such files). Yes ☒ No ☐
Indicate by check mark if disclosure of delinquent filers pursuant to Item 405 of Regulation S-K (§229.405) is not contained herein, and will not be contained, to the best of the registrant’s knowledge, in definitive proxy or information statements incorporated by reference in Part III of this Form 10-K or any amendment to this Form 10-K. ☒
Indicate by check mark whether the registrant is a large accelerated filer, an accelerated filer, a non-accelerated filer, or a smaller reporting company. See the definitions of “large accelerated filer,” “accelerated filer” and “smaller reporting company” in Rule 12b-2 of the Exchange Act.
Large accelerated filer | ☐ | Accelerated filer | ☒ | |||
Non-accelerated filer | ☐ (do not check if a smaller reporting company) | Smaller reporting company | ☐ | |||
Indicate by check mark whether the registrant is a shell company (as defined in Rule 12b-2 of the Exchange Act). Yes ☐ No ☒
The aggregate market value of the registrant’s common stock held by non-affiliates of the registrant, based on the closing price of a share of the registrant’s common stock on January 31, 2016 as reported by the NASDAQ Global Select Market on such date, was approximately $105.0 million. Shares of the registrant’s common stock held by each executive officer, director and holder of 5% or more of the outstanding common stock have been excluded in that such persons may be deemed to be affiliates. This calculation does not reflect a determination that certain persons are affiliates of the registrant for any other purpose
As of September 30, 2016, the registrant had 30,795,493 shares of common stock, $0.001 par value per share, outstanding.
Portions of the registrant’s definitive Proxy Statement relating to its 2017 Annual Meeting of Stockholders to be filed pursuant to Regulation 14A within 120 days after the registrant’s fiscal year end of July 31, 2016 are incorporated by reference into Part III of this Annual Report on Form 10-K. In the event that the registrant does not file a definitive Proxy Statement relating to its 2017 Annual Meeting within 120 days after the registrant’s fiscal year end of July 31, 2016, the registrant will amend this Annual Report on Form 10-K to include the information required by Part III.
TABLE OF CONTENTS
Page No. | ||
PART I | ||
Item 1. | ||
Item 1A. | ||
Item 1B. | ||
Item 2. | ||
Item 3. | ||
Item 4. | ||
PART II | ||
Item 5. | ||
Item 6. | ||
Item 7. | ||
Item 7A. | ||
Item 8. | ||
Item 9. | ||
Item 9A. | ||
Item 9B. | ||
PART III | ||
Item 10. | ||
Item 11. | ||
Item 12. | ||
Item 13. | ||
Item 14. | ||
PART IV | ||
Item 15. | ||
Signatures | ||
Exhibit Index | ||
2
SPECIAL NOTE REGARDING FORWARD-LOOKING STATEMENTS
This Annual Report on Form 10-K, including the sections titled “Business,” “Risk Factors,” “Use of Proceeds,” and “Management’s Discussion and Analysis of Financial Condition and Results of Operations,” contains forward-looking statements within the meaning of Section 27A of the Securities Act of 1933, as amended (the “Securities Act”), and Section 21E of the Securities Exchange Act of 1934, as amended (the “Exchange Act”), which statements involve substantial risks and uncertainties. All statements contained in this Annual Report on Form 10-K other than statements of historical fact, including statements regarding our future results of operations and financial position, our business strategy and plans, and our objectives for future operations, are forward-looking statements. The words “believe,” “may,” “will,” “potentially,” “estimate,” “continue,” “anticipate,” “plan,” “intend,” “could,” “would,” “expect” and similar expressions are intended to identify forward-looking statements. These forward-looking statements include, but are not limited to, statements concerning the following:
• | our proposed acquisition by Google Inc. (the “Merger”), including projections regarding the consummation of such acquisition and the potential impacts on our business prior to the consummation or termination of such acquisition; |
• | our future financial performance, including our expectations regarding our revenue, specified components of revenue, revenue mix, cost of revenue, gross profit or gross margin, operating expenses including changes in research and development, sales and marketing and general and administrative expenses, international performance, operating leverage and our ability to achieve and maintain future profitability; |
• | our business plan and beliefs and objectives for future operations; |
• | the anticipated benefits associated with the use of our solutions; |
• | our plans to further invest in and grow our business as a whole and specified portions of our business, and our ability to effectively manage our growth and associated investments; |
• | anticipated trends, growth rates and challenges in our business and in the markets in which we operate; |
• | market adoption of our solutions; |
• | our sales and marketing strategy and related activities; |
• | our ability to increase sales of our solutions and renewals of our subscriptions; |
• | our sales cycles and timing of our sales; |
• | our ability to attract and retain customers; |
• | our ability to expand sales to our existing customers; |
• | maintaining and expanding our customer base and our relationships with our channel partners; |
• | our product performance, strategy and positioning; |
• | our ability to timely and effectively scale and adapt our solutions; |
• | our ability to develop or acquire new solutions and bring them to market in a timely manner and make enhancements to our existing solutions; |
• | expanding the delivery of professional services to our customers through our channel partners; |
• | increased competition in our markets and our ability to compete effectively; |
• | our ability to maintain, protect and enhance our brand and intellectual property; |
• | our international operations and our ability to continue to expand internationally; |
• | our future capital requirements and estimates regarding the sufficiency of our cash resources; |
• | the effects of seasonal trends on our business; |
• | future acquisitions or investments; |
• | our ability to stay in compliance with laws and regulations that currently apply or become applicable to our business both in the United States and internationally; |
• | economic and industry trends or trend analysis; |
• | the attraction and retention of qualified employees and key personnel; |
• | the estimates and estimate methodologies used in preparing our consolidated financial statements and determining option exercise prices; |
• | our intentions with respect to paying stock dividends; |
• | the sufficiency of, and our uses of, cash including the proceeds from our initial public offering; and |
• | the future trading prices of our common stock. |
We have based these forward-looking statements largely on our current expectations and projections about future events and trends that we believe may affect our financial condition, results of operations, business strategy, short-term and long-term business operations and objectives and financial needs. These forward-looking statements are subject to a number of risks, uncertainties and assumptions, including those described in Part I, Item 1A. “Risk Factors” in this Annual Report on Form 10-K. Moreover, we operate in a very competitive and rapidly changing environment. New risks emerge from time to time. It is not possible for us to predict all risks, nor can we assess the impact of all factors on our business or the extent to which any factor, or combination of factors, may cause actual results to differ materially from those contained in any forward-looking statements we may make. In light of these risks, uncertainties and assumptions, the future events and trends discussed in this
3
Annual Report on Form 10-K may not occur and actual results could differ materially and adversely from those anticipated or implied in the forward-looking statements and you should not place undue reliance on our forward-looking statements.
We undertake no obligation to revise or publicly release the results of any revision to these forward-looking statements, except as required by law. Given these risks and uncertainties, readers are cautioned not to place undue reliance on such forward-looking statements.
Unless expressly indicated or the context requires otherwise, the terms “Apigee,” the “Company,” “we,” “us” and “our” in this document refer to Apigee Corporation, a Delaware corporation, and, where appropriate, its wholly owned subsidiaries. The term “Apigee” may also refer to our products, regardless of the manner in which they are accessed.
4
PART I
Item 1. Business
The Merger
On September 7, 2016, we entered into a definitive agreement to be acquired by Google Inc. (“Google”) for $17.40 per share in cash for each share of our common stock (the “Merger”), for a total value of approximately $625 million. Completion of the Merger is subject to the satisfaction of customary closing conditions, including approval of the Merger by our stockholders, the absence of certain legal impediments, the absence of a material adverse effect on our business and the approval of applicable regulatory authorities. The companies expect the transaction to close by the end of calendar 2016. For more information about the Merger, please see the preliminary proxy statement on Schedule 14A we filed with the Securities Exchange Commission on September 28, 2016 and any subsequently filed definitive proxy statement.
Overview
Unprecedented growth in mobile technologies, big data, cloud services and the connected devices that comprise the Internet of Things (“IoT”) has changed consumer behavior, disrupted or transformed the dynamics of business, and eroded the divide between the physical and digital worlds. To fully embrace the digital world, businesses must provide customer experiences on a variety of devices and channels, respond quickly to fast-changing customer expectations and market conditions, drive revenue through new business models, and create or participate in digital ecosystems. A digital business creates value by unlocking its data and services to better serve customers in a real-time, anywhere-anytime fashion and uses data to continually improve the customer experience and drive additional revenue.
We believe that APIs are a critical enabling technology for the shifts in mobile, cloud computing, big data and the IoT and that APIs are a foundational technology on which digital business operates. APIs are programmed instructions that allow any app (for example, a customer-care app on a mobile phone) to easily consume data in various combinations from various corporate and partner systems. We believe that a new and expansive market opportunity exists to help enterprises adopt digital strategies and navigate the digitally driven economy. We believe that in order to optimize this process for speed and to also extract critical data insights from API-based interactions required for the digital economy, nearly all businesses will require a new layer within their core application software stack to achieve this.
We provide an innovative software platform that serves as a connection layer between our customers’ core IT systems and data, and the applications with which their customers, partners, and employees engage with their business. Our web scale and flexible platform processes billions of API calls per week and allows businesses to secure, manage, scale and analyze API traffic, and to design and deploy both APIs and a systematic API strategy. Our cloud service provides up to 99.99% availability and uptime, and a multi-region API delivery network enabling low latency worldwide. We have designed a comprehensive security solution to enable security at all points of engagement, from users, apps, developers, the API team, the APIs themselves to the back-end systems. We enable organizations to control access to APIs and services, and to protect customers and the business from threats, backend system overload, service issues and sensitive data exposure. Our platform provides end-to-end visibility across the digital value chain with unified operational and business metrics and application monitoring. Furthermore, our platform enables a business to provide a developer community experience that accelerates API adoption, simplifies learning, enables monetization and increases the business value of APIs.
Our customers include many leading businesses: over 30 percent of the Fortune 100, five of the top ten Global 2000 retail companies and five of the top 10 global telecommunications companies as of July 31, 2016. Our solution has been sold to customers in over 30 countries around the world. Our current focus is on acquiring new customers and increasing revenue from our existing customers as they realize the value of our platform and expand the use of our software through additional use cases and broader deployment within their organizations. We are also focused on increasing adoption of our platform through Apigee Edge Start.
We generate our revenue primarily from licenses of and subscriptions for our Apigee Edge products and from professional services. We also generate revenue from licenses of and subscriptions to our Apigee Insights product, although such revenue has been immaterial to date. We also offer free trial versions of Apigee Edge to the developer community. We provide our customers the flexibility to deploy our software as a cloud service or on-premises. For those customers that deploy our products as a cloud service, we license our software on a subscription basis. For those customers that deploy our products on premises, we offer two pricing options: a time-based subscription or a perpetual license. We recognize revenue from subscription fees ratably over the service period, and have been increasing the proportion of our revenue mix that we derive
5
from subscriptions. We therefore believe that gross billings, which is a key performance metric that takes into consideration deferred revenue resulting from subscriptions, provide valuable insight into the performance of our business. See Management’s Discussion and Analysis of Financial Condition and Results of Operations-Certain Key Non-GAAP Financial Metrics and Key Performance Metrics for information on the uses and limitations of gross billings, and a reconciliation of this key performance metric to the most directly comparable financial measures calculated and presented in accordance with GAAP. We expect professional services and other revenue to account for a decreasing percentage of our total revenue over the long term as we continue to increase our subscriptions and as our customers increase their use of professional services provided by our channel partners and other third parties. However, we expect to continue to provide professional services as an important part of our solution to our customers because digital infrastructure transformation frequently involves core business strategy.
From fiscal 2004 to fiscal 2007, our activities were focused on research and development that resulted in the first commercial release of our software in fiscal 2007 – our Apigee Edge on-premises platform. In fiscal 2009, we extended Apigee Edge solution to a cloud offering to enable deployment flexibility for our customers. In fiscal 2012, we further extended our platform with the release of our first predictive analytics solution, Apigee Insights. In December 2013, we acquired InsightsOne, to further advance predictive analytics as part of our platform strategy and to bolster our developer adoption strategy. In fiscal 2013, we expanded our network of channel partners by entering into a master alliance agreement with Accenture, under which either we co-sell or they resell our solutions as part of larger installations. In fiscal 2014, we announced an OEM and reseller partnership with SAP under which SAP will deliver a comprehensive API management application build on our Apigee Edge product on SAP’s Hana Cloud to SAP’s cloud customers, and sell our Apigee Edge product on a standalone basis to its on-premises customers. In fiscal 2016 and 2015, we continued to build out our global partner ecosystem and extend the capabilities in Apigee Edge. We also added a new product, Apigee Sense, which helps customers detect malicious “bots” at the API layer.
We sell our products through direct field sales, direct inside sales and indirect channel sales. We utilize a wide range of online and offline marketing activities to drive brand awareness, thought leadership, developer trials and lead volume. Our software sales pricing is based on the customer’s usage. Our on-premises term and perpetual license sales are based on the number of computer server cores, while our cloud-based services sales are based on API traffic. Many of our customers initially use our product as a free trial by visiting our website, creating an account and testing the free cloud version of our platform. In addition, we offer open source solutions that introduce developers to the key technical concepts and technologies of APIs and mobile app development, and that allow their APIs and applications to be migrated or deployed to our paid products. After signing up, developers are able to experience the power of our platform and learn how to interact with our solutions, enabling them to understand the benefits of our paid products. We use the trial program as a source of lead volume for our direct sales team.
We have experienced rapid growth in recent periods. Our total revenue was $92.0 million, $68.6 million, and $52.7 million in fiscal 2016, 2015, and 2014, respectively, representing growth rates of 34% from fiscal 2015 to fiscal 2016 and 30% from fiscal 2014 to fiscal 2015. Our gross billings were $105.1 million, $81.2 million, and $63.8 million in fiscal 2016, 2015, and 2014, respectively, representing growth rates of 29% from fiscal 2015 to fiscal 2016 and 27% from fiscal 2014 to fiscal 2015. Please see our reconciliation between revenue and gross billings in Certain Key Non-GAAP Financial Metrics and Key Performance Metrics within Management's Discussion and Analysis. Our revenue derived from sales to customers located outside the United States was approximately 36%, 38%, and 33% in fiscal 2016, 2015, and 2014, respectively. We expect that sales to customers located outside the United States will continue to comprise a significant portion of our total revenue for the foreseeable future.
We have made substantial investments in developing and improving our platform and solutions, in expanding our sales and marketing capabilities and geographic coverage, and in providing general and administrative resources to support our growth. As a result, we have incurred net losses of $41.5 million, $50.4 million, and $60.8 million in fiscal 2016, 2015, and 2014, respectively. We had an accumulated deficit of $237.7 million and $196.2 million as of July 31, 2016 and July 31, 2015, respectively, and we expect to continue to incur net losses for the foreseeable future. We expect that continued investments will drive further growth in our total revenue and gross billings.
Our Solution
We have pioneered a software platform that enables API-based digital strategies and business insights for enterprises. Our solution is a secure run-time platform for optimized execution and management of APIs and predictive analytics that accelerates the pace at which businesses innovate, share their data and services for developers and partners, and continuously adapt to ever-changing customer and market needs. Our API platform is designed for the digital economy and the data-rich and mobile-driven APIs and applications that power it. It is designed to service the needs of the stakeholders across the new digital
6
value chain, from the backend systems of record through to the developers of apps to customers who have a digital experience delivered by a mobile app or a connected device.
Key elements of this solution include:
• | Purpose-built for People and Technology Across the Digital Value Chain. Our management tools, business and operational analytics, policy-based approach and advanced programmability provide a simple yet powerful platform that serves the entire digital value chain between the end user and the business’ backend systems. This digital value chain includes the applications, the developers who build them and the APIs that they use, all of which need to work together seamlessly and each of which has requirements that can only be addressed by an integrated platform. Pre-built and configurable policies provide a unified and intuitive platform approach to APIs, enabling organizations to control traffic on their APIs, enhance performance, enforce security, simplify customer self-service and reduce time-to-value—all without coding or changing the backend systems of record. Advanced programmability allows developers to handle advanced use cases, customize existing APIs for online and mobile platforms and add new API services—all using languages and tools, such as Java, JavaScript, Node.js and Python, which are familiar to developers. |
• | Enterprise-grade Software Enables Web Scale, Reliability and Security. Our platform is web scale and flexible and is offered as a cloud service or as an on-premises deployment. Our cloud service provides up to 99.99% availability and uptime, and a multi-region API delivery network enabling low latency worldwide. We have designed a comprehensive security solution to enable security at all points of engagement. Our solutions provide mechanisms to secure users, apps, developers, the API team, the APIs themselves, as well as the back-end systems. We enable organizations to control access to APIs and services to protect customers and the business from threats, backend system overload, service issue and sensitive data exposure. Our platform supports billions of API calls per week for the world’s largest and mission-critical API programs, including more than 30% of the Fortune 100, five of the top ten Global 2000 retail companies and five of the top 10 global telecommunications companies as of July 31, 2016. |
• | Built-in Developer Services to Foster Adoption and Enhance the Business Value of APIs. Our platform enables a business to provide a developer community experience that accelerates API adoption, simplifies learning, enables monetization and increases the business value of APIs. Using our platform, businesses can rapidly onboard developers and facilitate their secure interaction with their business data and systems. Our customizable developer portal helps businesses foster innovation among internal and external developers and partners by making it easy for developers to interact with the enterprise and with each other. |
• | Analytics for End-to-end Business Visibility. Our platform provides end-to-end visibility across the digital value chain with unified operational and business metrics and application monitoring. Operational metrics enable monitoring of the health and performance of APIs and digital ecosystems. Business metrics enable businesses to track product, service, customer usage and trends, respond quickly to customer and market changes and make data-driven decisions. Application monitoring helps organizations discover application errors and performance glitches, optimize application performance, identify network bottlenecks and understand usage patterns. |
• | Predictive Analytics to Derive Actionable Insights at the Point of Engagement. With APIs positioned at the center of the application data stream, our platform enables businesses to gain actionable insights from the flow of data. Every connected experience that a business delivers to customers, partners, or employees generates an interaction with that business, and interactions produce data. Our platform collects data in a Hadoop data store and mines API traffic for critical business events and adds contextual data from the customer journey, which is the sequence of digital interactions by customers with the business over time. Businesses can derive insights from these events, their context and their sequence, and use them to create models to predict likely customer behaviors, and generate actions that result in a change of behavior in a system or in delivering the right experience, at the right time, on the right device. |
• | Support for All New Forms of Interaction and Connectivity, such as the Internet of Things. Our platform allows businesses to manage APIs and data at the scale needed to support new and emerging forms of interaction and connectivity. Our platform powers the APIs, and captures and derives insights from the data generated by the applications and experiences, through which customers, partners, and employees engage with a business. We believe that our platform is positioned to power complex, distributed systems such as the IoT, including wearable technology, intelligent cars, smart energy grids and other forms of emerging connected interaction. |
Our Platform
Architecture
Our guiding architectural principles are simplicity, scalability and data-centricity. These principles guide our product design and technology strategies.
7
We define simplicity in two dimensions: first as the initial experience of a first time user of our platform, and second as the ability of our product to serve the entire life cycle of usage by both individuals and teams across multiple projects. We define scalability as the ability to handle the highest levels of traffic throughput with the lowest latencies, with a system that is reliable and available, in the cloud or in a private datacenter. We define data-centricity as the essential property that drives us to enable the customer to mine every transaction and interaction for data; to provide data management capabilities that efficiently store all of the data that we collect or generate; and to ensure that these data can be used throughout the system, whether to present meaningful dashboard reports or to automatically adapt the platform to optimize business outcomes.
Our architecture is designed as a platform technology—it is not just about managing APIs, but a technology stack that is itself built out of APIs. This makes it possible for us to build new solutions for new markets and it enables our customers and partners to leverage the full set of capabilities that we deliver for new purpose-built applications and systems.
Products
Our platform is designed to empower business leaders, IT technologists and developers to build and operate digital businesses. The platform is comprised of the following products:
• | Apigee Edge is a self-service API platform that enables businesses to manage the digital value chain from exposure of their services and data through APIs to the use of those APIs by developers who are building consumer-facing and enterprise applications, and to measure the success of the business’s digital initiatives with end-to-end analytics. |
• | Apigee Edge PRO is API management for small and medium-sized businesses and divisions in large enterprises. It is a cloud-delivered service that enables up to 25 million API calls/quarter for a monthly subscription fee. It is designed to enable businesses to deploy in days on the same technology as the Apigee Edge product and upgrade to the Apigee Edge product as the business grows. Apigee Edge Start is an entry level package targeting startups or single project teams in enterprise to get started with Apigee at a much lower price point. Once they start using Apigee Edge Start, they can upgrade to Apigee Edge Pro or Apigee Edge Enterprise as their needs grow over time. |
• | Apigee Link is our IoT platform for connecting devices to the Internet, which is currently under development and in beta testing with certain customers. Apigee Link is designed to provide built-in REST APIs and end-to-end connectivity for devices to enable device makers to offer new digital experiences for their customers, create new revenue streams with their partners, and grow their business. Apigee Link is designed to take the IoT beyond connecting gadgets, and to enable any device maker to become a digital platform business that can operate at scale in the physical world of home automation, smart transportation, wearable computing, and in other ecosystems of devices. |
• | Apigee Sense is a bot prevention product that was launched in late 2015. Apigee Sense leverages sophisticated machine learning algorithms to detect bad bots at the API layer. Apigee Sense processes the high volume of API traffic going through Apigee Edge in the Apigee Cloud, does pattern recognition using machine learning algorithms to identify bad bots, creates blacklists and either blocks or marks bad bots. |
• | Apigee Insights is the self-service predictive analytics solution that enables the enterprise to find time-based patterns in big data—both structured and unstructured—and gain insights to help an enterprise provide personalized experiences, maximize customer satisfaction and retention and grow revenue and profits. |
Apigee Edge
Apigee Edge is the foundation of our platform strategy. It provides a solution that addresses the entire digital value chain and minimizes risk and time-to-value by eliminating the need to integrate disparate point solutions. Apigee Edge includes three components: API Services, Developer Services and Analytics Services.
API Services unites Internet and enterprise technologies with API management, BaaS, security and programming extensibility. API Services enable the transformation of services into APIs that extend an enterprise’s capabilities to the digital world of applications and devices, delivering new agility while maintaining the security and reliability that enterprises require. Key capabilities of API Services include:
• | Self-service and extensibility enables developers to directly manage API policy configuration and changes with pre-built policies for traffic management, security, mediation and extension. |
• | Protocol transformation enables the transformation of enterprise data and services into easily usable, scalable and secure APIs. |
• | BaaS provides developers with a cloud datastore and API-based capabilities for user management, push notifications, social networking and geolocation services. |
8
• | Policy-based security architecture provides a configurable model that enables enterprise-grade security to protect the business from threats, backend overload and service issues. |
• | API programmability enables the extension of API Services capabilities to increase flexibility and meet business requirements, with support for Java, JavaScript, Node.js and Python. |
Developer Services enables an enhanced developer and community experience that accelerates API adoption, simplifies learning and increases the business value of APIs. Key Developer Services capabilities include:
• | Developer portal is deployed by an enterprise to provide a community for developers with the resources necessary to learn about the enterprise’s APIs, become a registered developer and collaborate with peers and with the enterprise. |
• | Fast on-boarding for developers with self-service registration and key generation to register their applications and engage with both the API provider and with a community of peer developers. |
• | Interactive API documentation and modeling simplifies designing and documenting new APIs as well as learning, testing and evaluation of existing APIs. |
• | API monetization enables API revenue models based on fees, freemium and revenue sharing and can be customized to meet complex requirements. |
Analytics Services enables end-to-end visibility across the digital value chain with the unified operational, developer, application performance and business metrics necessary to monitor, measure and manage success. Key Analytics Services capabilities include:
• | Business metrics provide a business context for monitoring and measuring API program goals and helping to make smart, informed business decisions. |
• | Operational analytics monitors the health and performance of production APIs, enabling enterprises to plan for traffic spikes, identify slow and error-prone APIs, find root causes and understand traffic anomalies. |
• | Application performance monitoring measures mobile app usage and performance of applications, on different platforms, carriers and devices. |
• | Developer program metrics identifies the developer programs with the most popular applications, best developer engagement and highest API traffic. |
The API Health feature of the Apigee Edge product is designed to help organizations detect and prevent the potential consequences of bad API performance such as poor application experience, user frustration, and lost revenue.
Apigee Edge Microgateway adds a hybrid cloud deployment option to Apigee Edge that can reduce latency and improve performance of API programs by leveraging the availability of the Apigee public cloud together with the performance of local, on-premises API management.
Apigee Link
Apigee Link is our IoT platform for connecting devices to the Internet. We are developing Apigee Link to enable companies to reliably and securely connect devices to the Internet with minimal latency, enable developers, partners and customers to orchestrate digital experiences that involve multiple devices, and collects, analyzes, and act on data from sensors and actuators. Apigee Link is designed to enable a device maker to become a digital business by helping them create an ecosystem around their devices, all powered by APIs. Key capabilities that are planned for this solution include:
• | The ability to access any device using the built-in REST APIs; |
• | The ability to stream near-real-time data among physical devices, the cloud and mobile apps using open standards; |
• | Two-way communication to send data from the cloud to the device or from the device to the cloud, including requests through traditional home routers in either direction; |
• | Protocol mediation to enable communication with any device by mediating between Web, wired, and wireless protocols, including, ZigBee, WiFi, BLE, MQTT; |
• | Sensor and actuator data to monitor device behavior by streaming and ingesting data in the cloud for storage and analysis; and |
• | Identity and security to enable secure device interactions by authenticating and authorizing users, apps and devices |
Apigee Sense
Apigee Sense, a bot prevention product was launched in late 2015. Apigee Sense leverages sophisticated machine learning algorithms to detect bad bots at the API layer. Apigee Sense processes the high volume of API traffic going through Apigee Edge in the Apigee Cloud, does pattern recognition using machine learning algorithms to identify bad bots, creates blacklists
9
and either blocks or marks bad bots. Customers can then use the marking of bots to do further actions like honeypotting or throttling to mitigate the impact of bad bots on their application systems.
Apigee Insights
Apigee Insights delivers predictive analytics enabling businesses to gain actionable insights. To address the need to perform sophisticated predictive analytics on business events, such as those captured by the data streams running through our APIs, we have built a unique time-sequenced graph database that stores and analyzes the events within graphs, which can be used to represent the relationships of events within complex sequences. This allows businesses to model customers’ journeys as they interact with various digital touch-points such as mobile apps. By modeling the propensity of a customer to step through these sequences, a company can make predictions that determine the next most likely or next best action, or to make recommendations and tailor the experience to drive the user to choose the next action that serves business objectives. Graph and Sequence Processing technology, or GRASP, is the core proprietary technology within Insights.
Our Technology
Our technology efforts are centered on five key areas of focus across our solutions: scalability, multi-tenancy, data-centricity, simplicity and reliability. Each of these areas represents a significant challenge to implement effectively, and we believe that the combination of the five differentiates our platform.
Scale Is Hard
Our API platform is positioned at the center of the enterprise architecture and enables all API traffic between applications and backend systems to pass through our systems. This means that our products must be among the most scalable, high performance and reliable systems in the enterprise. Enterprise architectures are by nature distributed geographically and often have elements that run in the cloud as well as in the customer’s data center. Therefore, our platform technology is built as a distributed architecture and can be deployed both in the cloud and on premises. Our cloud service is highly scalable and can process more than one billion API calls a day.
In order to build a system that can perform at scale, we use a variety of best practices and technologies. These include:
• | High-performance pipelined proxy architectures that can effectively handle very high levels of API traffic, efficiently processing the traffic whether to analyze or transform it with minimal computational overhead; |
• | Automated elastic computing to devote additional computational resources on-demand, with our software automatically able to take advantage of new resources and allocate them to tasks efficiently; |
• | Micro-services architecture that allows us to develop constituent services powering specific features and then scale these features independently as necessary based on usage patterns; and |
• | Distributed database technologies and expertise that allows us to manage the storage requirements for our architecture as demand grows. |
Multi-tenancy Is Hard
Multi-tenancy is the technology that cloud-based services use to share IT resources cost-efficiently and securely across multiple users and projects. The multi-tenant design of a cloud service can have a dramatic impact on the application delivery and productivity of an IT organization. Multi-tenancy at scale is a core requirement and key technological advantage for us. Customers of our cloud service business must experience the fast and simple self-service process that they have come to expect from Software-as-a-Service products.
We have developed unique mechanisms for ensuring that each user of our cloud service is isolated from other users in ways designed to ensure that each user gets guaranteed service levels. At the same time, we are able to safely share certain pooled computation and data resources between users in order to create a high degree of operational efficiency. We provide the same multi-tenancy experience to our non-cloud customers who install our software as an on-premises solution.
Data Is Hard
All of our solutions rely on the ability to store, query and analyze data, often in real time, and at significant levels of scale, leveraging a unique combination of open source data storage technologies, including Cassandra, Hadoop and Postgres, and a proprietary set of data management and analytics capabilities. We have augmented these capabilities with predictive analytics based on complex graph-based analysis of these data streams. These technologies allow us to:
10
• | Store large amounts of API data and API traffic metadata in real-time regardless of traffic levels; |
• | Construct queries that can execute in real time with traffic flows in order to retrieve information that supplements API data and to make real-time decisions about the handling of API traffic; |
• | Implement “counters,” which are the running tallies of traffic patterns and key metrics related to users, devices and business events; |
• | Generate alerts based on data conditions in order to notify IT personnel of critical events; and |
• | Serve pre-defined and customer reports to provide answers to questions such as how API traffic is trending over time, who are the top developers, when API response time varies, from which geography is API traffic coming, what APIs are failing, and what devices are making the most API requests. |
Apigee Insights leverages our proprietary GRASP to power big data predictive analytics that increases the ability to find time-based patterns in structured and unstructured data. Featuring a distributed processing foundation based on Hadoop and an in-memory real-time processor, Apigee Insights combines the power of big data and data science to deliver significantly greater precision than is possible with traditional technologies and statistical tools.
Simplicity Is Hard
We leverage APIs in our own platform architecture to deliver simplicity and adaptability. Using a modern “microservices architecture” approach, the capabilities of our solutions are exposed as APIs. This allows us to develop our solutions as a set of independent services, which are assembled to create a comprehensive user experience. This also allows developers or organizations to create and customize the manner in which they interact with our solutions, bringing simplicity and flexibility to enterprise infrastructure. We provide an intuitive graphical user interface, and easy to use “command line” options for developers. We make our APIs intuitive and easy to use and enable developers to build on our platform with technologies such as JavaScript and Node.js, simplifying the programmability of our platform. Our platform is designed to be operated in a “self-service” manner by our customers, and our configurable policies allow customers to transform services into highly consumable APIs, control API traffic, enhance performance and enforce security, all without coding or changing the backend systems of record.
Reliability Is Hard
The integrity and security of our cloud products is critical to our business, and as such we leverage industry-standard security and monitoring tools to ensure performance across our cloud service. Our technology enables enterprises to provide secure access to their data and services with a well-defined API that is consistent across all of their databases and services, regardless of implementation. Our cloud customers are highly dependent on our cloud service, and as such, it is designed to be available 24 hours a day, 365 days a year. We provide a service level commitment for our cloud service, which can be up to 99.99%, excluding designated periods of maintenance.
Our Customers
Our customers include leading enterprises across a broad range of industry segments, including telecommunications, media and entertainment, financial services, retail, travel and hospitality, and healthcare and insurance. Our paying customer base has grown 64% from July 31, 2015 to July 31, 2016. We define the number of paying customers at the end of any particular month as the number of customers for which we have recognized or deferred revenue during that month. As of July 31, 2015 and July 31, 2016, we had 205 and 337 paying customers, respectively. Our customers are comprised of organizations that have purchased our cloud or on-premises software solutions and professional services.
On an annual basis, our revenue per customer ranges from less than $50,000 to over $1.0 million. No customer accounted for more than 10% of our total revenue in fiscal 2016. One customer, AT&T, represented 15% of our total revenue in fiscal 2014. No other customer accounted for more than 10% of our total revenue in fiscal 2016, fiscal 2015 or fiscal 2014.
11
Below are some of our representative customers by revenue during the prior eight fiscal quarters ended July 31, 2016, organized by industry segment:
Telecommunications | Media & Entertainment | Financial Services | ||
T-Mobile USA, Inc. | BBC Worldwide Ltd. | Thomson Reuters | ||
AT&T Inc. | Gamesys, Ltd. | First Data Corporation | ||
Vodafone | Fox Broadcasting Company | Vantiv, Inc. | ||
Telstra Corp. | ITV Plc. | Morningstar, Inc. | ||
Swisscom AG | Live Nation | |||
Retail | Healthcare/Insurance | |
Target Corporation | Humana Inc. | |
Magazine Luiza | McKesson | |
Walgreens Company | Health Care Service Corp. | |
Staples, Inc. | Kaiser Permanente | |
Burberry Group Plc. | ||
We also offer a free, limited trial version of our software to developers with much of the functionality in the enterprise edition of Apigee Edge. This enables us to build awareness of our platform and our technologies within the developer community and we believe that it results in our products being used in projects at early stages of development, giving us an advantage as projects grow and require commercial support and services.
Sales and Marketing
Our sales and marketing organizations optimize our customer acquisition process by generating brand and product awareness, cultivating customer relationships, lead generation, building pipeline, onboarding new channel partners and implementing customer expansion programs.
Sales
We sell our software through direct field sales, direct inside sales and indirect channel sales. We have local sales teams in North America, Europe and Asia Pacific. Our software sales pricing is based on the customer’s usage. Our on-premises license sales are based on the number of computer server cores, while our cloud-service sales are based on API traffic. We generate prospects and leads through a wide range of marketing programs and events and also run a robust outbound teleprospecting program. Leads are qualified by inside account development representatives based on a set of criteria agreed upon by sales and marketing leadership. Our direct sales team seeks to build relationships high up in the enterprise where business strategy decisions are being made. In addition to acquiring new customers, our sales teams are responsible for increased adoption of our software by existing customers.
We have formed strategic partnerships with Accenture and SAP and work closely with them globally to acquire new customers. We also have established relationships with other channel partners to provide us with additional sales leverage worldwide by sourcing new prospects, providing professional services and technical support to existing customers and upselling for additional use cases. Our channel partners include system integrators that combine our products with their own technology expertise and solutions and digital agencies that help customers implement digital initiatives. Technology partners and OEMs integrate our products to extend functionality and use our products in their own solutions.
12
Backlog
As is typical in the software industry, we expect a significant portion of our product orders to be received in the last month of each fiscal quarter. We typically provision our product orders shortly after the receipt of an order. While we may have a backlog consisting of product orders that have not shipped and maintenance, professional and training services that have not been billed and for which the services have not yet been performed at the end of a given fiscal year, historically, we have not had material backlog, and we do not anticipate having material backlog in the future.
Marketing
Our marketing and demand generation efforts consist of a mix of metrics-driven programs to educate the market and generate leads for our field sales team. Through our marketing programs and events, and through our strategic relationships, we generate customer leads, accelerate sales opportunities and increase brand awareness.
Our thought leadership content and online education and certification programs reach business leaders, IT technologists and developers, helping define the language and the requirements of the market. Equipping all of these important constituents with the know-how and tools to be effective in digital business facilitates our potential future sales. We offer a free trial cloud service as well as free developer tools, and open source solutions to help drive adoption of our solutions. Our marketing programs include free online and local training to engage both existing and prospective customers. We participate in conferences, trade shows and industry events and also annually host a series of API industry user conferences held in large cities across the U.S. and other countries, called Adapt or Die, to build and support the API community to enable companies to become digital businesses.
Customer Success
We have built a company culture centered around our customers’ success and satisfaction. We have developed several programs designed to provide customers with service options to enhance their experience with, and expand their use of, our products.
Professional Services
We provide consulting, training, configuration and implementation services to customers through our professional services organization. These services are typically utilized by large enterprises looking to deploy our solutions across their large, disparate and complex IT infrastructure. We believe that these professional services are an important part of our solution to our customers because digital infrastructure transformation frequently involves core business strategy and impacts the entire organization. Personnel within our professional services organization are trained on our products and are encouraged to follow our methodologies. We generally provide these services at the time of initial installation to help the customer with configuration and implementation. Given our software’s ease-of-use, our professional services engagements are typically short in duration.
Maintenance and Customer Support
Our customers typically purchase annual subscriptions to our platform that include software maintenance and support as part of their initial purchase of our software platform. Software maintenance and support is not included as part of a perpetual license and may be purchased separately. The maintenance agreements provide customers the right to receive unspecified software updates, maintenance releases and patches and access to our technical support services during the term of the agreement.
Customers receiving maintenance and support receive guaranteed response times, direct telephonic support and access to online support portals. All support is provided 24x7x365 for critical issues. Our customer support organization has global capabilities, delivering support with deep expertise in both its software as well as complex IT environments. Our support team also works closely with our updates team to create the best possible experience for customers as they move from one version of our products to the next version.
Training
We provide several options for customers to increase their level of knowledge about our products through our training organization, which offers classroom training, virtual classroom training and on-demand training. Paid classroom training offers customers the opportunity to visit one of our training facilities for one or more days of hands-on, instructor-led courses. Paid virtual classroom training is also delivered by an instructor, but students attend the training on-line rather than being present at
13
a training facility. We also continue to develop our free and on-demand online education and enablement courses through the Apigee Academy.
Research and Development
We invest substantial resources in research and development to enhance our platform, develop new solutions, conduct software and quality assurance testing and improve our core technology. Our technical staff monitors and tests our software on a regular basis, and we maintain a regular release process to refine, update, and enhance our existing products. We typically provide our customers with updates to our solutions at least monthly in the cloud and quarterly on premises. Research and development expense totaled $37.8 million, $30.4 million and $22.3 million for fiscal 2016, fiscal 2015 and fiscal 2014, respectively.
Competition
The market for enterprise API-based platforms is fragmented, rapidly evolving and highly competitive. We compete against in-house or custom development efforts, a variety of large software vendors and smaller specialized companies and open source initiatives, all of which vary in the breadth and scope of the products and services offered. Beyond in-house or custom development efforts, our competitors include International Business Machines Corporation and Oracle Corporation, both of which can bundle competing products and services with other software offerings, or offer them at a low price as part of a larger sale. In addition, Amazon Web Services offers gateway functionality in a product called AWS Gateway, which functionality is a subset of that offered by the API Services component of Apigee Edge. Our industry is evolving rapidly and is becoming increasingly competitive. Larger and more established companies may focus on API management and API-based platforms and could directly compete with us. Smaller companies could also launch competing or new products and services.
We believe that the principal competitive factors in our market include the following:
• | domain expertise in API business practices and technologies; |
• | size of customer base and level of user adoption; |
• | established status as a strategic IT platform; |
• | brand awareness and reputation; |
• | total cost of ownership; |
• | ease of deployment and use of API-based platforms by paying customers and developers; |
• | level of paying customer and developer following; |
• | breadth and depth of offering; |
• | performance, availability and support for API-based platforms; |
• | capability for customization, configurability, integration, security, scalability and reliability of applications; and |
• | the ability to innovate and respond to customer needs rapidly. |
We believe that we compete favorably on the basis of the above factors. However, some of our actual and potential competitors have certain additional advantages over us, such as significantly greater financial, technical, marketing, research and development or other resources, stronger brand and business user recognition, larger installed customer bases, larger intellectual property portfolios and broader global distribution and presence.
Intellectual Property
Our success depends in part upon our ability to protect our core technology and intellectual property. To accomplish this, we rely on a combination of intellectual property rights, including patents, trade secrets, copyrights and trademarks, as well as customary contractual protections.
We had nine issued patents and fifteen patent applications pending in the United States as of July 31, 2016. Our issued patents expire between 2028 and 2029. We cannot assure you whether any of our patent applications will result in the issuance of a patent or whether the examination process will require us to narrow our claims. Furthermore, even if a patent issues, we cannot assure you that such patent will be adequate to protect our business. We also license software from third parties for integration into our solutions, including open source software and other software available on commercially reasonable terms.
We control access to and use of our proprietary technology and other confidential information through the use of internal and external controls, including contractual protections with employees, contractors, customers and partners, and our software is protected by U.S. and international copyright laws. Despite our efforts to protect our technology and proprietary rights through intellectual property rights, licenses and confidentiality agreements, unauthorized parties may still copy or otherwise
14
obtain and use our software and other technology. In addition, we intend to expand our international operations, and effective patent, copyright, trademark and trade secret protection may not be available or may be limited in foreign countries.
Our industry is characterized by the existence of a large number of patents and frequent claims and related litigation regarding patent and other intellectual property rights. In particular, leading companies in our markets have extensive patent portfolios and are regularly involved in litigation. From time to time, third parties, including certain of these leading companies, may assert patent, copyright, trade secret and other intellectual property rights against us, our channel partners or our customers. Our standard license and other agreements may obligate us to indemnify our channel partners and customers against such claims. Successful claims of infringement by a third party could prevent us from continuing to offer our solution or performing certain services, require us to expend time and money to develop non-infringing solutions, or force us to pay substantial damages, including treble damages if we are found to have willfully infringed patents or copyrights, royalties or other fees. Competitors may also be more likely to claim that our solutions infringe their proprietary rights and seek an injunction against us from continuing to offer our platform. We cannot assure you that we do not currently infringe, or that we will not in the future infringe, upon any third-party patents or other proprietary rights.
Employees
As of July 31, 2016, we had 374 full-time employees. None of our employees are either represented by a labor union or subject to a collective bargaining agreement. We have not experienced any work stoppages, and we consider our relations with our employees to be good.
Segment and Geographic Information
Segment and geographic information is set forth in Note 10 of the Notes to Consolidated Financial Statements under Item 8 of this Annual Report on Form 10-K.
Government Regulation
We are subject to a number of U.S. federal and state and foreign laws and regulations that involve matters central to our business. These laws and regulations may involve privacy, data protection, intellectual property, competition, consumer protection, taxation or other subjects. Many of the laws and regulations to which we are subject are still evolving and being tested in courts and could be interpreted in ways that could harm our business. In addition, the application and interpretation of these laws and regulations often are uncertain, particularly in the new and rapidly evolving industry in which we operate. Because global laws and regulations have continued to develop and evolve rapidly, it is possible that we may not be, or may not have been, compliant with each such applicable law or regulation.
Corporate Information
We were incorporated in the State of Delaware as Nexgen Machines, Inc. on June 3, 2004, changed our name to Sonoa Systems, Inc. on November 15, 2004 and changed our name to Apigee Corporation on September 21, 2010. Our principal executive offices are located at 10 South Almaden Blvd., 16th Floor, San Jose, California 95113. Our telephone number at that location is (408) 343-7300.
Our website is located at www.apigee.com and our investor relations website is located at www.investors.apigee.com. Our Annual Reports on Form 10-K, Quarterly Reports on Form 10-Q, Current Reports on Form 8-K and amendments to reports filed or furnished pursuant to Sections 13(a) and 15(d) of the Exchange Act, are available free of charge on the Investors portion of our web site as soon as reasonably practicable after we electronically file such material with, or furnish it to, the Securities and Exchange Commission (the “SEC”). Further, a copy of this Annual Report on Form 10-K is located at the SEC’s Public Reference Room at 100 F Street, NE, Washington, D.C. 20549. Information on the operation of the Public Reference Room can be obtained by calling the SEC at 1-800-SEC-0330.
Webcasts of our earnings calls and certain events we participate in or host with members of the investment community are on our investor relations website. Additionally, we announce investor information, including news and commentary about our business and financial performance, SEC filings, notices of investor events, and our press and earnings releases, on our investor relations website. Investors and others can receive notifications of new information posted on our investor relations website in real time by signing up for email alerts and RSS feeds. Further corporate governance information, including our corporate governance guidelines, board committee charters, and code of conduct, is also available on our investor relations website under the heading “Corporate Governance.” The contents of our websites are not incorporated by reference into this
15
Annual Report on Form 10-K or in any other report or document we file with the SEC, and any references to our websites are intended to be inactive textual references only.
Item 1A. Risk Factors
Investing in our common stock involves a high degree of risk. You should carefully consider the risks and uncertainties described below, together with all of the other information contained in this Annual Report on Form 10-K, including our consolidated financial statements and the related notes thereto, before making a decision to invest in our common stock. The risks and uncertainties described below are not the only ones we face. Additional risks and uncertainties that we are unaware of, or that we currently believe are not material, may also become important factors that affect us. If any of the following risks occur, our business, financial condition, operating results and prospects could be materially and adversely affected. In that event, the price of our common stock could decline, and you could lose part or all of your investment.
Risks Related to Ownership of Our Common Stock
Our stock price has been and may continue to be volatile or may decline, regardless of our operating performance, resulting in substantial losses for investors.
The trading prices of the securities of technology companies have been and may continue to be highly volatile. Since shares of our common stock were sold in our initial public offering in April 2015 at a price of $17.00 per share, the reported high and low sales prices of our common stock have ranged from $5.14 to $13.15 in the most recent fiscal year ended July 31, 2016. The market price of our common stock may fluctuate significantly in response to numerous factors, many of which are beyond our control, including:
• | actual or anticipated fluctuations in our operating results; |
• | the financial projections we may provide to the public, any changes in these projections or our failure to meet these projections; |
• | failure of securities analysts to initiate or maintain coverage of our company, changes in financial estimates by any securities analysts who follow our company, or our failure to meet these estimates or the expectations of investors; |
• | ratings changes by any securities analysts who follow our company; |
• | announcements by us or our competitors of significant technical innovations, acquisitions, strategic partnerships, joint ventures or capital commitments; |
• | the addition or loss of large customers; |
• | network outages or performance issues of our cloud service; |
• | information security breaches of our internal systems, our cloud service or customer on-premises deployments of our platform; |
• | changes in operating performance and stock market valuations of other technology companies generally, or those in our industry in particular; |
• | price and volume fluctuations in the overall stock market, including as a result of trends in the economy as a whole; |
• | any major change in our board of directors or management; |
• | lawsuits threatened or filed against us; and |
• | other events or factors, including those resulting from war, incidents of terrorism or responses to these events. |
In addition, the stock markets, and in particular the market on which our common stock is listed, have experienced extreme price and volume fluctuations that have affected and continue to affect the market prices of equity securities of many technology companies. Stock prices of many technology companies have fluctuated in a manner unrelated or disproportionate to the operating performance of those companies. In the past, stockholders have instituted securities class action litigation following periods of market volatility. If we were to become involved in securities litigation, it could subject us to substantial costs, divert resources and the attention of management from our business and adversely affect our business, results of operations, financial condition and cash flows.
Our directors, executive officers and significant stockholders continue to have substantial control over us and could delay or prevent a change in corporate control.
As of July 31, 2016, our directors, executive officers and holders of more than 5% of our common stock, together with their affiliates, currently beneficially own, in the aggregate 48% of our outstanding common stock. As a result, these stockholders, acting together, would have the ability to control the outcome of matters submitted to our stockholders for approval, including the election of directors and any merger, consolidation or sale of all or substantially all of our assets. In
16
addition, these stockholders, acting together, would have the ability to control the management and affairs of our company. Accordingly, this concentration of ownership might adversely affect the market price of our common stock by:
• | delaying, deferring or preventing a change in control of the company; |
• | impeding a merger, consolidation, takeover or other business combination involving us; or |
• | discouraging a potential acquirer from making a tender offer or otherwise attempting to obtain control of the company. |
If securities or industry analysts do not publish research or reports about our business, or publish negative reports about our business, our share price and trading volume could decline.
The trading market for our common stock will depend in part on the research and reports that securities or industry analysts publish about us or our business, our market and our competitors. We do not have any control over these analysts. If one or more of the analysts who cover us downgrade our shares or change their opinion of our shares, our share price would likely decline. If one or more of these analysts cease coverage of our company or fail to regularly publish reports on us, we could lose visibility in the financial markets, which could cause our share price or trading volume to decline.
Substantial future sales of shares of our common stock could cause the market price of our common stock to decline.
The market price of shares of our common stock could decline as a result of substantial sales of our common stock, particularly sales by our directors, executive officers and significant stockholders, a large number of shares of our common stock becoming available for sale or the perception in the market that holders of a large number of shares intend to sell their shares. As of July 31, 2016, we had 30,440,809 shares of our common stock outstanding.
We rely on judgments, assumptions and estimates, as well as data collected from our data management system, to calculate certain of our metrics, and real or perceived inaccuracies in such metrics may harm our reputation and cause our stock price to decline.
Certain of our metrics are calculated and estimated using data from data systems other than our financial accounting system. While these numbers are based on what we believe to be reasonable calculations and estimates for the applicable period of measurement, there are inherent challenges in measuring these metrics because of the judgments and assumptions such measurements require our management team to make. If these judgments or assumptions are made incorrectly, the resulting calculation or estimation of the applicable metric will likely be inaccurate. Further, the judgments and assumptions made by our management team to calculate or estimate a metric may change from time to time, as additional information is taken into account subsequent to the initial calculation or estimate, and such changes by themselves may significantly impact such metric in future periods and may cause us to revise the calculations or estimations of such metric for historical periods.
If we discover material inaccuracies in our metrics, our reputation may be harmed. Such inaccuracies could also cause investors to lose confidence in our reported financial and other information, which would likely have a negative effect on the trading price of our common stock.
We are an “emerging growth company” and we cannot be certain if the reduced disclosure requirements applicable to emerging growth companies will make our common stock less attractive to investors.
We are an “emerging growth company,” as defined in the Jumpstart our Business Startups Act of 2012 (“JOBS Act”), and we may take advantage of certain exemptions from various reporting requirements that are applicable to other public companies that are not “emerging growth companies” including, but not limited to, not being required to comply with the auditor attestation requirements of Section 404 of the Sarbanes-Oxley Act of 2002 (“Sarbanes-Oxley Act”), reduced disclosure obligations regarding executive compensation in our periodic reports and proxy statements, and exemptions from the requirements of holding a nonbinding advisory vote on executive compensation and stockholder approval of any golden parachute payments not previously approved. We cannot predict if investors will find our common stock less attractive because we may rely on these exemptions. If some investors find our common stock less attractive as a result, there may be a less active trading market for our common stock and our stock price may be more volatile.
Anti-takeover provisions in our charter documents and under Delaware law could make an acquisition of our company more difficult, limit attempts by our stockholders to replace or remove our current management and limit the market price of our common stock.
17
Provisions in our amended and restated certificate of incorporation and amended and restated bylaws, may have the effect of delaying or preventing a change of control or changes in our management. Our amended and restated certificate of incorporation and amended and restated bylaws include provisions that:
• | authorize our board of directors to issue, without further action by the stockholders, shares of undesignated preferred stock with terms, rights and preferences determined by our board of directors; |
• | require that any action to be taken by our stockholders be effected at a duly called annual or special meeting and not by written consent; |
• | specify that special meetings of our stockholders can be called only by our board of directors, the Chairman of our board of directors, or our Chief Executive Officer; |
• | establish an advance notice procedure for stockholder proposals to be brought before an annual meeting, including proposed nominations of persons for election to our board of directors; |
• | establish that our board of directors is divided into three classes, Class I, Class II and Class III, with each class serving three-year staggered terms; |
• | prohibit cumulative voting in the election of directors; |
• | provide that our directors may be removed only for cause; |
• | provide that vacancies on our board of directors may be filled only by a majority of directors then in office, even though less than a quorum; and |
• | require the approval of our board of directors or the holders of a supermajority of our outstanding shares of capital stock to amend our bylaws and certain provisions of our certificate of incorporation. |
These provisions may frustrate or prevent any attempts by our stockholders to replace or remove our current management by making it more difficult for stockholders to replace members of our board of directors, which is responsible for appointing the members of our management. In addition, because we are incorporated in Delaware, we are governed by the provisions of Section 203 of the Delaware General Corporation Law, which generally prohibits a Delaware corporation from engaging in any of a broad range of business combinations with any “interested” stockholder for a period of three years following the date on which the stockholder became an “interested” stockholder.
The requirements of being a public company may strain our resources, divert management’s attention and affect our ability to attract and retain executive management and qualified board members.
As a public company, we are subject to the reporting requirements of the Exchange Act, the Sarbanes-Oxley Act, the Dodd-Frank Act, the accounting provisions of the FCPA, the listing requirements of the NASDAQ Stock Market and other applicable securities rules and regulations. Compliance with these rules and regulations has increased and will continue to increase our legal and financial compliance costs, make some activities more difficult, time-consuming or costly and increase demand on our systems and resources, particularly after we are no longer an “emerging growth company.” The Exchange Act requires, among other things, that we file annual, quarterly and current reports with respect to our business and operating results. The Sarbanes-Oxley Act requires, among other things, that we maintain effective disclosure controls and procedures and internal control over financial reporting. In order to maintain and, if required, improve our disclosure controls and procedures and internal control over financial reporting to meet this standard, significant resources and management oversight may be required. As a result, management’s attention may be diverted from other business concerns, which could adversely affect our business and operating results. Although we have already hired additional employees to comply with these requirements, we may need to hire more employees in the future or engage outside consultants, which will increase our costs and expenses.
In addition, changing laws, regulations and standards relating to corporate governance and public disclosure are creating uncertainty for public companies, increasing legal and financial compliance costs and making some activities more time consuming. These laws, regulations and standards are subject to varying interpretations, in many cases due to their lack of specificity, and, as a result, their application in practice may evolve over time as new guidance is provided by regulatory and governing bodies. This could result in continuing uncertainty regarding compliance matters and higher costs necessitated by ongoing revisions to disclosure and governance practices. We intend to invest resources to comply with evolving laws, regulations and standards, and this investment may result in increased general and administrative expenses and a diversion of management’s time and attention from revenue-generating activities to compliance activities. If our efforts to comply with new laws, regulations and standards differ from the activities intended by regulatory or governing bodies due to ambiguities related to their application and practice, regulatory authorities may initiate legal proceedings against us and our business may be adversely affected.
However, for as long as we remain an “emerging growth company” as defined in the JOBS Act, we may take advantage of certain exemptions from various reporting requirements that are applicable to other public companies that are not “emerging
18
growth companies” including, but not limited to, not being required to comply with the auditor attestation requirements of Section 404 of the Sarbanes-Oxley Act, reduced disclosure obligations regarding executive compensation in our periodic reports and proxy statements, and exemptions from the requirements of holding a nonbinding advisory vote on executive compensation and stockholder approval of any golden parachute payments not previously approved. We may take advantage of these reporting exemptions until we are no longer an “emerging growth company.”
We will remain an “emerging growth company” for up to five years, although if the market value of our common stock that is held by non-affiliates exceeds $700 million as of any July 31 before that time, we would cease to be an “emerging growth company” as of the following January 31.
We also expect that these new rules and regulations will make it more expensive for us to obtain director and officer liability insurance, and we may be required to accept reduced coverage or incur substantially higher costs to obtain coverage. These factors could also make it more difficult for us to attract and retain qualified members of our board of directors, particularly to serve on our audit committee and compensation committee, and qualified executive officers.
As a public company, our business and financial condition has become more visible, which we believe may result in threatened or actual litigation, including by competitors and other third parties. If such claims are successful, our business and operating results could be adversely affected, and even if the claims do not result in litigation or are resolved in our favor, these claims, and the time and resources necessary to resolve them, could divert the resources of our management and adversely affect our business and operating results.
As a public company, we are obligated to develop and maintain proper and effective internal control over financial reporting. These internal controls may not be determined to be effective, which may adversely affect investor confidence in our company and, as a result, the value of our common stock.
We are required, pursuant to Section 404 of the Sarbanes–Oxley Act, to furnish a report by management on, among other things, the effectiveness of our internal control over financial reporting. This assessment will need to include disclosure of any material weaknesses identified by our management in our internal control over financial reporting. During the evaluation and testing process, if we identify one or more material weaknesses in our internal control over financial reporting, we will be unable to assert that our internal controls are effective.
If we are unable to assert that our internal control over financial reporting is effective, we could lose investor confidence in the accuracy and completeness of our financial reports, which would cause the price of our common stock to decline, and we may be subject to investigation or sanctions by the SEC.
We are required to disclose changes made in our internal control and procedures on a quarterly basis. However, our independent registered public accounting firm will not be required to formally attest to the effectiveness of our internal control over financial reporting pursuant to Section 404 until we are no longer an “emerging growth company” as defined in the JOBS Act if we take advantage of the exemptions contained in the JOBS Act. At such time, our independent registered public accounting firm may issue a report that is adverse in the event it is not satisfied with the level at which our controls are documented, designed or operating. Our remediation efforts may not enable us to avoid a material weakness in the future
To comply with the requirements of being a public company, we may need to undertake various actions, such as implementing new internal controls and procedures and hiring accounting or internal audit staff.
We do not intend to pay dividends for the foreseeable future.
We have never declared or paid any cash dividends on our common stock and do not intend to pay any cash dividends in the foreseeable future. We anticipate that we will retain all of our future earnings for use in the development of our business and for general corporate purposes. Any determination to pay dividends in the future will be at the discretion of our board of directors. In addition, our loan and security agreement with SVB restricts, and any future indebtedness may restrict, our ability to pay dividends. Accordingly, investors must rely on sales of their common stock after price appreciation, which may never occur, as the only way to realize any future gains on their investments.
Risks Related to Our Business and Industry
The Merger, the pendency of the Merger or our failure to complete the Merger could have a material adverse effect on our business, results of operations, financial condition and stock price.
19
Completion of the Merger is subject to the satisfaction of various conditions, including approval of the Merger by our shareholders, the absence of certain legal impediments, the absence of a material adverse effect on our business, and the approval of antitrust authorities in the United States and foreign jurisdictions. There is no assurance that all of the various conditions will be satisfied, or that the Merger will be completed on the proposed terms, within the expected timeframe, or at all. Furthermore, there are additional inherent risks in the Merger, including the risks detailed below.
Risks related to the pendency of the Merger
During the period prior to the closing of the Merger, our business is exposed to certain inherent risks due to the effect of the announcement or pendency of the Merger on our business relationships, operations, results and business generally, including:
• | potential uncertainty in the marketplace, which could lead current and prospective customers to purchase from other vendors or delay purchasing from us; |
• | the possibility of disruption to our business and operations, including diversion of management and employee time and resources, increased transaction costs, and the potentially negative impact on our relationships with our commercial partners; |
• | the inability to attract and retain key personnel, and the possibility that our current employees could be distracted, and their productivity decline as a result, due to uncertainty regarding the Merger; |
• | the inability to pursue alternative business opportunities or make changes to our business pending the completion of the Merger, and other restrictions on our ability to conduct our business; |
• | the fact that under the terms of the Merger Agreement, we are unable to solicit other acquisitions proposals during the pendency of the Merger; |
• | the amount of the costs, fees, expenses and charges related to the Merger Agreement or the Merger; and |
• | other developments beyond our control, including, but not limited to, changes in domestic or global economic conditions that may affect the timing or success of the Merger. |
Risks that the Merger may be delayed or may not be completed
The Merger may be delayed, and may ultimately not be completed, due to a number of factors, including:
• | the failure to obtain the approval of the Merger Agreement by our shareholders; |
• | the failure to obtain regulatory approvals from various foreign governmental entities (or the imposition of any conditions, limitations or restrictions on such approvals); |
• | potential future shareholder litigation and other legal and regulatory proceedings, which could delay, disrupt or prevent the Merger; and |
• | the failure to satisfy the other conditions to the completion of the Merger, including the possibility that a material adverse effect on our business would permit Google not to close the Merger. |
Risks to our business if the Merger does not close
If the Merger does not close, our business and shareholders would be exposed to additional risks, including:
• | to the extent that the current market price of our stock reflects an assumption that the Merger will be completed, the price of our common stock could decrease if the Merger is not completed; |
• | investor confidence could decline, shareholder litigation could be brought against us, relationships with existing and prospective customers, suppliers and other business partners may be adversely impacted, we may be unable to retain key personnel, and profitability may be adversely impacted due to costs incurred in connection with the pending Merger; and |
• | the requirement that we pay a termination fee of $21.75 million to Google if the agreement governing the Merger is terminated under certain circumstances; and; |
Risks related to the successful completion of the Merger
Even if successfully completed, there are certain risks to our shareholders from the Merger, including:
• | the amount of cash to be paid under the agreement governing the Merger is fixed and will not be adjusted for changes in our business, assets, liabilities, prospects, outlook, financial condition or results of operations or in the event of any change in the market price of, analyst estimates of, or projections relating to, our common stock; |
• | the fact that receipt of the all-cash Merger Consideration will be taxable to stockholders that are treated as U.S. holders for U.S. federal income tax purposes; |
• | the possibility that Google could, at a later date, engage in unspecified transactions, including restructuring efforts, special dividends or the sale of some or all of Apigee’s assets to one or more as yet unknown purchasers, that could conceivably produce a higher aggregate value than that available to stockholders in the Merger; and |
20
• | the fact that, if the Merger is completed, shareholders will forego the opportunity to realize the potential long-term value of the successful execution of Apigee’s current strategy as an independent company. |
We have a history of losses, and we expect to incur losses for the foreseeable future.
We have incurred significant net losses in each year since our inception, including net losses of $41.5 million, $50.4 million, and $60.8 million for the years ended July 31, 2016, 2015, and 2014, respectively. As a result, we had an accumulated deficit of $237.7 million and $196.2 million at July 31, 2016 and 2015, respectively, and we expect to continue to incur net losses for the foreseeable future. Because the market for our software is rapidly evolving and has not yet reached widespread adoption, it is difficult for us to predict our future operating results. We expect our operating expenses to significantly increase over the next several years as we hire additional personnel, particularly in sales and marketing, expand and improve the effectiveness of our distribution channels, expand our operations and infrastructure, both domestically and internationally, and continue to develop our platform. In addition, as we grow and because we are a newly public company, we will incur additional significant legal, accounting and other expenses that we did not incur as a private company. If our revenue does not increase to offset these increases in our operating expenses, we will not be profitable in future periods. While historically our total revenue has grown, not all components of our total revenue have grown consistently. Further, in future periods, our revenue growth could slow or our revenue could decline for a number of reasons, including slowing demand for our software, increasing competition, any failure to gain or retain channel partners, a decrease in the growth of our overall market, or our failure, for any reason, to continue to capitalize on growth opportunities. As a result, our past financial performance should not be considered indicative of our future performance. Any failure by us to achieve or sustain profitability on a consistent basis could cause the value of our common stock to materially decline.
The market for our platform is new and unproven and may not grow or may decrease.
Since we were founded in 2004, we have been creating products for the developing and rapidly evolving market for API-based software platforms, a market that is largely unproven and is subject to a number of inherent risks and uncertainties. We believe that our future success will depend in large part on the growth, if any, in the market for API-based software platforms. The utilization of API software is still relatively new, and enterprises may not recognize the need for APIs or, if they do, they may decide that they do not need a solution that offers the range of functionalities that we offer, or they may decide to build such capabilities in-house. In order to grow our business and extend our market position, we intend to expand the functionality of our product and bring new technologies to market to increase market acceptance and use of our platform. It is difficult to predict customer adoption and renewal rates, customer demand for our solutions, the size and growth rate of the overall market that our platform addresses, the entry of competitive products and the success of existing competitive products. Any expansion of the market our platform addresses depends upon a number of factors, including the cost, performance and perceived value associated with such solutions. If the market our platform addresses does not achieve significant additional growth or there is a reduction in demand for our platform solutions caused by a lack of customer acceptance, technological challenges, competing technologies and products, decreases in corporate spending, weakening economic conditions, or otherwise, it could result in reduced revenue and customer orders, early terminations, and reduced renewal rates, any of which would adversely affect our business, results of operations, financial condition and growth prospects.
We have a short operating history for our recently released solutions, including the current version of our cloud-based solution and the current version of our predictive analytics solution, which makes it difficult to evaluate our future prospects and may increase the risk that we will not be successful.
We have a short operating history of selling our recently released solutions, including the current version of our cloud-based solution that we began offering at the end of 2012 and other solutions such as Apigee Insights and Apigee Sense, both of which we introduced more recently.This short selling history limits our ability to forecast our future operating results and plan for and model future growth. We also have encountered and will continue to encounter risks and uncertainties frequently experienced by growing companies in developing industries. If our assumptions regarding these uncertainties, which we use to plan our business, are incorrect or if we do not address these risks successfully, our business, results of operations, financial condition and growth prospects could differ materially from our expectations and our business could suffer.
Additionally, we have limited experience with respect to determining the optimal prices for our solutions. If the market for our solutions begins to mature or as new competitors introduce new products or services that compete with our solutions, we may be unable to attract new customers based on the pricing model we have used historically. Moreover, large customers, which are the focus of our sales efforts, may demand greater price concessions. As a result, in the future we may be required to reduce our prices, which could adversely affect our revenue, gross margin, and other results of operations, financial condition and cash flows. Furthermore, our software sales pricing is based on the customer’s usage. Our on-premises license sales are based on the number of computer server cores, while our cloud-based services sales are based on API traffic. This usage-based
21
aspect to our pricing model may make it difficult to accurately forecast revenue because the customer controls when and to what extent it uses our platform, and our customers’ activities on our platform may vary from period to period based on a variety of factors. As a result, revenue may fluctuate period to period. Therefore, historical revenue from a customer may not be indicative of our future revenue, and this usage-based aspect of our pricing model may limit our ability to forecast revenue. If we fail to address these risks and challenges and those described elsewhere in this “Risk Factors” section, our business will be adversely affected and our operating results will suffer.
Moreover, although we have experienced strong growth historically, we may not continue to grow in the future. Any success that we may experience in the future will depend in large part on our ability to, among other things:
• | maintain and expand our customer base and the ways in which our customers use our platform; |
• | increase revenue from existing customers through increased or broader use of our platform within their organizations; |
• | improve the performance and capabilities of our software through research and development; |
• | successfully expand our business domestically and internationally; |
• | successfully compete with other companies, open source initiatives and custom development efforts that are currently in, or may in the future enter, the markets for our software; |
• | continue to invest in our platform to foster an ecosystem of developers and users to expand the use cases of our software; |
• | continue to develop Apigee Edge and other solutions on our platform such as Apigee Link and Apigee Sense; |
• | generate leads and convert users of the trial version of our software to paying customers; |
• | prevent users from circumventing the terms of their software licenses; |
• | continue to enhance our website infrastructure to minimize interruptions or slower than expected download times when accessing our software from our website; |
• | process, store and use our customers’ data in compliance with applicable governmental regulations and other legal obligations related to data privacy and security; and |
• | hire, integrate and retain qualified talent. |
Because we currently derive substantially all of our revenue and cash flows from our Apigee Edge solution, failure of this solution to satisfy customer demands or to achieve increased market acceptance would materially and adversely affect our business, results of operations, financial condition and growth prospects.
We derive substantially all of our revenue and cash flows from our Apigee Edge solution. As such, the market acceptance of Apigee Edge is critical to our continued success. Demand for Apigee Edge is affected by a number of factors beyond our control, including continued market acceptance of our solutions by referenceable accounts for existing and new use cases, the timing of development and release of new products by our competitors and additional capabilities and functionality by us, technological change, and growth or contraction of the market in which we compete. In addition, similar to the situation encountered by traditional APIs, we cannot assure you that our Apigee Edge solution and future enhancements to our platform and solutions will be able to address future advances in technology or requirements of digital businesses. Moreover, our platform may not be able to scale and perform to meet increased requirements, including any associated with the proliferation of mobile apps and devices. We also lacked a clear migration path to transition existing customers under prior versions of our Apigee Edge solution (versions prior to August 2012), which has limited our ability to sell add-on purchases to these existing customers. We have experienced, and may continue to experience, decline in add-on purchases from customers using prior versions of our Apigee Edge solution. If we are unable to continue to meet customer demands or to achieve more widespread market acceptance of our software, our business, results of operations, financial condition and growth prospects will be materially and adversely affected.
If we are not able to introduce new products successfully and to make enhancements to existing products, our growth rates would likely decline and our business, results of operations and competitive position could suffer.
We invest substantial resources in researching and developing new products and enhancing existing products by incorporating additional features, improving functionality and adding other improvements to meet our customers’ evolving demands in our highly competitive industry. In order to be competitive, our platform must address an ever-increasing array of mobile apps, networked devices and back end databases, applications and systems, as well as keep pace with technological innovations in our industry and with our customers’ business requirements. For example, we are focused on enhancing the features and functionality of our platform to enhance its adaptability for the Internet of Things (“IoT”), and have developed Apigee Link, our IoT product for connecting devices to the Internet. We are also focused on enhancing the features and functionality of our platform for the healthcare industry segment, and have developed Apigee Health APIx to enable healthcare payors and providers to securely share patient data with mobile health apps and with each other. In addition, we recently introduced Apigee Sense for enhanced, data driven API security. We have derived very little revenue from Apigee Link and no
22
revenue from our new healthcare solution or Apigee Sense to date, and we cannot assure you when new products or solutions under development will be commercially released or that they will generate material revenue. Since developing our platform is complex, the timetable for the release of new products and enhancements to existing products is difficult to predict, and we may not offer new products and updates as rapidly as our customers require or expect. The success of new products and enhancements to our platform and their market acceptance may depend upon the timing of introduction of these new products and enhancements, and any failure in this regard may significantly impair our revenue growth.
We also have invested, and may in the future continue to invest, in the acquisition of complementary products or services that expand the solutions that we can offer our customers and help us enter into new markets. We often make these investments without being certain that they will result in products or enhancements that our target markets will accept or that they will expand our share of those markets. The sizes of the markets currently addressed by our products are not certain, and our ability to grow our business in the future may depend upon our ability to introduce new solutions or enhance and improve our existing products for those markets or entry into new markets. Our growth would likely be adversely affected and we would not be able to extend our leadership position if we fail to introduce these new solutions or enhancements, fail to manage successfully the transition to new solutions from the products they are replacing or do not invest our development efforts in appropriate products or enhancements for significant new markets, or if these new products or enhancements do not attain market acceptance.
In addition, our introduction of new products that are developed or acquired by us may reduce sales of existing products or cause us to lower the sales price of existing products, which may impact our results of operations. For example, we recently began offering a lower-priced version of our Apigee Edge product, which includes a limit on call volume, fewer features and less functionality than our current version of Apigee Edge. Customers may choose to purchase this new version of Apigee Edge instead of our existing version, or we may determine to lower the price of our existing version of Apigee Edge in order to make this version more attractive to our customers.
Our new solutions or enhancements, such as Apigee Link, Apigee Sense and Apigee Insights, could fail to attain market acceptance for many reasons, including:
• | downtime or other lack of availability or performance of our cloud–based solution; |
• | defects, errors or failures in our platform; |
• | the inability of our platform to interoperate effectively with products from other vendors or to operate successfully when deployed within the networks of our customers; |
• | negative publicity about the performance or effectiveness of our new solutions or enhancements to our existing solutions; |
• | the timeliness of the introduction and delivery of our solutions or enhancements; |
• | our failure or inability to predict changes in our industry or customers’ requirements; |
• | reluctance of customers to purchase products that include cloud-based solutions or incorporate elements of open source software; |
• | failure of our channel partners to market, support or distribute our solutions; and |
• | changes in government or industry standards and criteria. |
If we do not respond to the rapidly changing needs of our customers by timely developing and introducing new and effective solution features, upgrades and services that can respond adequately to their needs, our competitive position, business and growth prospects will be harmed.
We may not be able to compete successfully against current and future competitors.
We compete against in-house or custom IT development efforts, a variety of large software vendors and smaller specialized companies and open source initiatives, all of which vary in the breadth and scope of the products and services offered. The principal competitive factors in our markets include domain expertise in API business practices and technologies, size of customer base and level of user and developer adoption, established status as a strategic IT platform, brand awareness and reputation, total cost of ownership, ease of deployment and use of our solution by paying customers and developers, breadth and depth of offering, performance, availability and support for our solution, capability for configurability, integration, security, scalability and reliability of applications, and the ability to innovate and respond to customer needs rapidly. Beyond in-house or custom IT development efforts, our competitors include, among others, International Business Machines Corporation and Oracle Corporation, both of which can bundle competing products and services with other software offerings, or offer them at a low price as part of a larger sale. In addition, in July 2015 Amazon Web Services (“AWS”) introduced a gateway functionality in a product called AWS Gateway, which product’s functionality is a subset of that offered by the API
23
Services component of our Apigee Edge solution. Some of our actual and potential competitors have additional advantages over us, such as:
• | significantly greater financial, technical, marketing, research and development or other resources; |
• | stronger brand and business user recognition; |
• | larger installed customer bases; |
• | larger intellectual property portfolios; |
• | more basic, lower priced solutions; and |
• | broader global distribution and presence. |
Our industry is evolving rapidly and is becoming increasingly competitive, and we expect further increased competition if our market continues to expand. Larger and more established companies may focus on API management and API-based software platforms and could directly compete with us. Smaller companies are also launching new products and services that could gain market acceptance quickly. Conditions in our market could change rapidly and significantly as a result of technological advancements, open source initiatives or other factors.
In recent years, there have been significant acquisitions and consolidation by and among our competitors. Consolidation in our industry may allow our competitors to take advantage of the greater resources of the larger organization or may increase the likelihood of our competitors offering bundled or integrated products with which we cannot effectively compete. As a result of these acquisitions, competitors might take advantage of the greater resources of the larger organization to compete more vigorously or broadly with us. If we are unable to differentiate our products from the integrated or bundled products of our competitors, such as by offering enhanced functionality or performance, we may see increased pricing pressure, decreased demand or increased sales and marketing expenses, which would adversely affect our business, operations, financial results and growth prospects. Further, it is possible that continued industry consolidation may impact customers’ perceptions of the viability of smaller or even medium-sized software firms and consequently their willingness to use software solutions from such firms. Similarly, if customers seek to concentrate their software license purchases in the product portfolios of a few large providers, we may be at a competitive disadvantage regardless of the performance and features of our software. We believe that to remain competitive at the large enterprise level, we may need to develop and expand relationships with resellers, large system integrators and providers of complementary technologies to provide a broad range of products and services. If we are unable to compete effectively, our business, results of operations, financial condition and growth prospects could be materially and adversely affected.
Our future quarterly results may fluctuate significantly, which could adversely affect our share price.
Our results of operations, including the levels of our revenue, cost of revenue, gross margin, operating expenses, cash flow and deferred revenue, have fluctuated from quarter to quarter in the past and may continue to vary significantly in the future so that period-to-period comparisons of our operating results may not be meaningful. Accordingly, our financial results in any one quarter should not be relied upon as indicative of future performance. Our quarterly financial results may fluctuate as a result of a variety of factors, many of which are outside of our control, may be difficult to predict, and may or may not fully reflect the underlying performance of our business. Because the timing and amount of our revenue is difficult to forecast and because our operating costs and expenses are relatively fixed in the short term, if our revenue does not meet our expectations, we are unlikely to be able to adjust our spending to levels commensurate with our revenue. As a result, the effect of revenue shortfalls on our results of operations may be more accentuated, and these and other fluctuations in quarterly results may negatively affect the market price of our common stock. Among the factors that may cause fluctuations in our quarterly financial results are those listed below:
• | our ability to attract and retain new customers; |
• | the addition or loss of large customers; |
• | our ability to successfully expand our business domestically and internationally; |
• | our ability to gain new channel partners and retain existing channel partners; |
• | fluctuations in the growth rate of the overall market that our solutions address; |
• | fluctuations in the mix of our revenue; |
• | the unpredictability of the timing of our receipt of orders for perpetual licenses, the revenue for which we typically recognize upfront; |
• | the amount and timing of operating expenses related to the maintenance and expansion of our business and operations, including continued investments in sales and marketing, research and development and general and administrative resources; |
• | network outages or performance degradation of our cloud service; |
• | information security breaches; |
24
• | general economic, industry and market conditions; |
• | customer renewal rates; |
• | increases or decreases in the number of elements of our services or pricing changes upon any renewals of customer agreements; |
• | changes in our pricing policies or those of our competitors; |
• | the budgeting cycles and purchasing practices of customers; |
• | decisions by potential customers to purchase alternative solutions from larger, more established vendors, including from their primary software vendors; |
• | decisions by potential customers to develop in-house solutions as alternatives to our platform; |
• | insolvency or credit difficulties confronting our customers, which could adversely affect their ability to purchase or pay for our software and services; |
• | delays in our ability to fulfill our customers’ orders; |
• | seasonal variations in sales of our solutions; |
• | the cost and potential outcomes of future litigation or other disputes; |
• | future accounting pronouncements or changes in our accounting policies; |
• | our overall effective tax rate, including impacts caused by any reorganization in our corporate tax structure and any new legislation or regulatory developments; |
• | fluctuations in stock-based compensation expense; |
• | fluctuations in foreign currency exchange rates; |
• | the timing and success of new products and service introductions by us or our competitors or any other change in the competitive dynamics of our industry, including consolidation among competitors, customers or strategic partners; |
• | the timing of expenses related to the development or acquisition of technologies or businesses and potential future charges for impairment of goodwill from acquired companies; and |
• | other risk factors described in this Annual Report on Form 10-K. |
We expect our revenue mix to vary over time, which can affect our gross margin and operating results.
We expect our revenue mix to vary over time due to a number of factors, including the mix of perpetual licenses, time-based licenses, subscriptions and professional services. In addition, third-party hosting infrastructure costs associated with customer adoption of our cloud-based solution can vary over time. Our gross margins and operating results can be affected by such changes in revenue mix and costs, together with numerous other factors including:
• | entry into new markets or growth in lower margin markets; |
• | entry into markets with different pricing and cost structures; |
• | pricing discounts; |
• | increased price competition; |
• | changes in distribution channels; and |
• | how well we execute our strategy and operating plans. |
Reliance on orders, especially for perpetual licenses, at the end of a fiscal quarter could cause our revenue to vary from period to period or to fall below expected levels for a given period.
As a result of customer buying behavior and the efforts of our sales force and channel partners to meet or exceed their sales objectives, we have historically received and generated a substantial portion of bookings and generated a significant portion of our quarterly revenue related to perpetual licenses during the last month of each quarter. The unpredictability of the timing of customer licenses—particularly for perpetual licenses, the revenue for which we typically recognize upfront—and subscriptions could cause our revenue to vary from period to period or to fall below expected levels for a given period, which would adversely affect our business, financial condition, and results of operations, and result in a decline in the market price of our common stock.
Our business and growth depend on our ability to obtain subscription and maintenance renewals from existing customers. Nonrenewals and subscription downgrades could adversely affect our future operating results.
We primarily sell our platform on a yearly subscription basis, either deployed in the cloud or on premises. At the end of the term of these subscriptions, customers can renew their existing subscriptions, upgrade their subscriptions, downgrade their subscriptions or not renew. In recent periods, a lesser portion of our total revenue has been derived from annual maintenance and support associated with perpetual licenses. During the year ended July 31, 2016, our subscription, support and time-based licenses that were eligible for renewal were renewed at a dollar-based simple renewal rate of approximately 90%. We calculate dollar-based simple renewal rate based on the dollar value of renewed contracts divided by the dollar value of expiring
25
contracts at any given period. However, due to limited historical data with respect to rates of subscription renewals by our customers, particularly for our cloud-based solution, we cannot accurately predict customer dollar-based simple renewal rates. The dollar-based simple renewal rate for the year ended July 31, 2016, is not necessarily indicative of our dollar-based simple renewal rate for any future period. Our customers’ renewal rates may decline or fluctuate as a result of a number of factors, including customer dissatisfaction with our pricing or our products’ functionality, features or performance, competitors’ product offerings or in-house developed solutions, customers’ ability to continue their operations and spending levels, migration path issues for new versions of products (which we have experienced before) and other factors, a number of which are beyond our control. Our customers have no obligation to renew their subscriptions after the expiration of the initial term, and they may elect not to renew their subscriptions or to reduce the product quantity under their subscriptions or maintenance and support contracts, thereby reducing our future revenue. If our customers do not renew their subscriptions for our products on similar pricing terms, our revenue may decline and our business, results of operations and growth prospects could suffer. In addition, if the average term of our contracts were to decrease, this may afford us less visibility into our future financial performance.
We recognize our subscription and time-based revenue over the term of our customer contracts. Consequently, downturns or upturns in new sales may not be immediately reflected in our operating results and may be difficult to discern.
We recognize our revenue ratably over the term, typically one year, of customer subscriptions for our cloud-based solution and on-premises time-based licenses. As a result, a portion of our total revenue in each quarter is derived from the recognition of deferred revenue relating to subscriptions and time-based licenses and maintenance and support contracts entered into during prior periods. Consequently, a decline in new or renewed subscriptions or time-based licenses in any single quarter may have a small impact on our revenue for that quarter. However, such a decline will negatively affect our revenue in future quarters. Accordingly, the effect of significant downturns in sales and market acceptance of our platform and potential changes in our rate of customer expansion or retention or in our pricing policies will not be fully reflected in our results of operations in a single quarter but only over several quarters. In addition, a significant majority of our operating costs are expensed as incurred, while a majority of our revenue is recognized over the term of our agreements with our customers. As a result, continued growth in the number of our customers may not result in increases in our revenue that offset increases in our operating costs and expenses. Our subscription model also makes it difficult for us to rapidly increase our revenue through additional sales in any period, as revenue from new customers is generally recognized ratably over the applicable term of our agreements.
We may require additional capital to support our business, and this capital might not be available on acceptable terms, if at all.
We intend to continue to make investments to support our business and may require additional funds, in particular as we seek to grow our business, including the need to develop new features or enhance our software, improve our operating infrastructure or acquire complementary businesses and technologies. Accordingly, we may need to engage in equity or debt financings to secure additional funds. If we raise additional funds through future issuances of equity or convertible debt securities, our existing stockholders could suffer significant dilution, and any new equity securities we issue could have rights, preferences and privileges superior to those of holders of our common stock. Any debt financing that we may secure in the future could involve restrictive covenants relating to our capital raising activities and other financial and operational matters, which may make it more difficult for us to obtain additional capital and to pursue business opportunities, including potential acquisitions. We may not be able to obtain additional financing on terms favorable to us, if at all. If we are unable to obtain adequate financing or financing on terms satisfactory to us when we require it, our ability to continue to support our business growth, scale our infrastructure, develop product enhancements and to respond to business challenges could be significantly impaired, and our business may be adversely affected.
To the extent that we are unable to timely recognize revenue from the provision of professional services to our customers or to rely on our partners and others to deliver professional services for our solutions, our total revenue, gross profit and gross margins may be lower.
We generally offer professional services associated with implementing our solutions, and we recognize revenue from professional services primarily on a time and materials basis as services are delivered. Costs associated with maintaining a professional services department is fixed while professional services revenue is dependent on the amount of work actually billed to customers in a period, the combination of which may result in variability in our gross profit. In addition, the timing of the recognition of professional services revenue is dependent on several factors outside our control. If a customer deploys our solutions and utilizes our services more slowly than we expect, we may not be able to recognize the related revenue as quickly as we anticipated, and we may experience an adverse impact on our gross profit and other results of operations. We increasingly rely on our channel partners for professional services associated with implementing our solutions and we plan to continue to expand our channel relationships that provide these professional services to supplement our own resources and, to
26
the extent that we are unable to adequately grow these channel partner relationships, or otherwise have others perform professional services associated with our solutions, we may have a significant portion of our revenue mix derived from our provision of such services which carry lower gross margins than our other revenue sources and may reduce our gross profit.
The seasonality of our business can create significant variance in our quarterly bookings, license revenue and cash flows from operations.
We operate on a July 31 fiscal year end and believe that there are significant seasonal factors which may cause us to experience lower levels of revenue in our first fiscal quarter ending October 31 and higher levels of revenue in our second fiscal quarter ending January 31 as compared with other quarters. We believe that this seasonality results from a number of factors, including:
• | slower enterprise buying patterns during the late summer months, both domestically and overseas, including from our telecommunications customers, as well as government customer procurement, budget and deployment cycles, and the timing of our training for our entire sales force, each of which impacts our revenue in our first fiscal quarter; and |
• | larger customers with a December 31 fiscal year end choosing to spend remaining budgets shortly before their year end, which impacts our revenue in our second fiscal quarter. |
If we are unable to attract and retain key personnel, our business and financial results could be adversely affected.
We depend on the continued contributions of our senior management and other key personnel, the loss of whom could adversely affect our business. All of our executive officers and key employees are at-will employees, which means they may terminate their employment relationship with us at any time. We do not maintain a key-person life insurance policy on any of our officers or other employees.
Our future success also depends in large part on our ability to identify, attract and retain highly skilled technical, managerial, finance and other personnel, particularly in our sales and marketing, research and development, general and administrative, and professional service departments. We face intense competition for qualified individuals from numerous software and other technology companies. In addition, competition for qualified personnel, particularly software engineers, is particularly intense in the San Francisco Bay Area, where our headquarters are located. We may incur significant costs to attract and retain them, and we may lose new employees to our competitors or other technology companies before we realize the benefit of our investment in recruiting and training them. As we move into new geographies, we will need to attract and recruit skilled personnel in those areas. Certain members of our senior management team have only recently joined us, and other members of our senior management team have separated from us in recent quarters. Our productivity and business may be harmed if we do not integrate and train our employees and managers quickly and effectively or if we do not retain them. If we are unable to attract and retain suitably qualified individuals who are capable of meeting our growing technical, operational and managerial requirements, on a timely basis or at all, our business will be adversely affected.
Volatility or lack of appreciation in our stock price may also affect our ability to attract and retain our key employees. Many of our senior management personnel and other key employees have become, or will soon become, vested in a substantial amount of stock or stock options. Employees may be more likely to leave us if the shares they own or the shares underlying their vested options have significantly appreciated in value relative to the original purchase prices of the shares or the exercise prices of the options, or, conversely, if the exercise prices of the options that they hold are significantly above the market price of our common stock. If we are unable to retain our employees, or if we need to increase our compensation expenses to retain our employees, our business, results of operations, financial condition and cash flows would be adversely affected.
If we do not effectively train and expand our sales force, we may be unable to add new customers or increase sales to our existing customers and our business will be adversely affected.
Currently, we sell our solutions primarily through our direct sales force. Our ability to increase our sales to both new and existing customers is in part dependent on our ability to continue to train and expand our sales force, which from July 31, 2012 to July 31, 2016 grew over 250%. There is significant competition for sales personnel with the skills and technical knowledge that we require. Moreover, newly hired sales personnel require substantial training and typically take a significant amount of time before they achieve full productivity. Our recent hires and planned hires may not become productive as quickly as we expect, and we may be unable to hire or retain sufficient numbers of qualified individuals in the markets where we do business or plan to do business. In addition, as we continue to grow, a large percentage of our sales force can be expected to be new to the company and our platform. Identifying, recruiting and effectively training sufficient sales personnel to support our growth requires significant time, expenses and management and other resources. If we are unable to hire, develop and retain sales personnel or if our new direct sales personnel are unable to achieve expected sales productivity levels in a reasonable period of
27
time or at all, we may not be able to increase our revenue and grow our business, which would adversely affect our results of operations.
If we fail to manage our growth effectively, our business, operating results and financial condition would be adversely affected.
In recent periods, we have been adding personnel and other resources as we focus on growing our business, entering new geographic markets and increasing our market share, and we expect to incur significant additional expenses in further expanding our personnel, particularly in sales and marketing and our international operations in order to grow our business, operations and customer base, and we intend to continue to make significant additional investments in these areas. The number of our full-time employees was 374 as of July 31, 2016. The return on these investments in terms of increases in revenue, operating margin and number of customers may be lower, or may be realized more slowly, than we expect. If we do not achieve the benefits anticipated from our investments, or if the achievement of these benefits is delayed, our business, results of operations and financial condition would be adversely affected.
In addition, our growth has placed, and is expected to continue to place, a significant strain on our managerial, administrative, operational, financial and other resources. To effectively manage growth, we must continue to improve our operational, financial and management controls, and our reporting systems and procedures.
If we are not able to maintain and enhance our brand and increase market awareness of our company and solutions, our business and operating results may be adversely affected.
We believe that maintaining and enhancing the “Apigee” brand identity and increasing market awareness of our company and solutions is critical to achieving widespread acceptance of our platform, to our relationships with our customers and channel partners and to our ability to attract new customers and channel partners. The successful promotion of our brand will depend largely upon our marketing efforts, our ability to continue to offer high-quality software, our ability to be thought leaders in API-based software platforms and our ability to successfully differentiate our platform from those of our competitors. Our thought leadership and brand promotion activities may not be successful or yield increased revenue. In addition, independent industry analysts often provide reviews of our products, as well as those of our competitors, and perception of our product in the marketplace may be significantly influenced by these reviews. If these reviews are negative, or less positive as compared to those of our competitors’ products and services, our brand may be adversely affected.
In addition, the promotion of our brand requires us to make substantial expenditures, and we anticipate that the expenditures will increase as our market becomes more competitive, as we expand into new markets and as more sales are generated through our channel partners. To the extent that these activities yield increased revenue, this revenue may not offset the increased expenses we incur. If we do not successfully maintain and enhance our brand, our business may not grow, we may have reduced pricing power relative to competitors with stronger brands, and we may lose customers and channel partners, all of which would adversely affect our business, results of operations, and financial condition.
Our growth depends in part on the success of our strategic relationships with third parties, which relationships are at an early stage of development.
In order to grow our business, we anticipate that we will continue to depend on relationships with third parties, such as Accenture LLP and SAP AG, to resell and co-sell and provide services related to our platform. Our relationships with these partners are at an early stage of development, we have generated very limited revenue through these relationships to date, and we cannot assure you that we will be able to maintain successful relationships with our channel partners or that these partners will be successful in marketing and selling our platform or solutions based upon our platform. Identifying partners such as these, negotiating and supporting relationships with them and maintaining relationships requires a significant commitment of time and resources that may not yield a significant return on our investment in these relationships. Our channel partners are not required to exclusively market or sell our solutions in our target markets and have only limited commitments to dedicate resources to marketing and promoting our solutions. In addition, our competitors may be more effective in providing incentives to our strategic partners or prospective partners to favor their products or services over our solutions. If we are unsuccessful in establishing or maintaining our relationships with strategic partners, or if these partners are unsuccessful in marketing or selling our solutions, or are unable or unwilling to devote sufficient resources to these activities, our ability to compete in the marketplace or to grow our revenue could be impaired and our operating results may suffer.
Our sales cycles can be long and unpredictable, and our sales efforts require considerable time and expense. As a result, our sales and revenue are difficult to predict and may vary substantially from period to period.
28
The timing of our sales and related revenue recognition is difficult to predict because of the length and unpredictability of the sales cycle for our platform. We are often required to spend time and resources to better familiarize potential customers with the value proposition of API management and API-based software platforms generally. Customers often view the purchase of our products as a significant and strategic decision and, as a result, frequently require considerable time to evaluate, test and qualify our products prior to making a purchase decision and placing an order. A number of factors influence the length and variability of our sales cycles, including, for example:
• | the need to educate potential customers about the uses and benefits of our platform; |
• | the discretionary nature of potential customers’ purchasing and budget cycles and decisions; |
• | the competitive nature of potential customers’ evaluation and purchasing approval processes; and |
• | the availability of in-house solutions, either currently or through addition internal development, to our potential and current customers. |
The amount of time that customers devote to their evaluation, contract negotiation and budgeting processes vary significantly. The length of the sales cycle for our platform averages approximately seven months, but specific transactions can be significantly longer. During the sales cycle, we expend significant time and money on sales and marketing and contract negotiation activities, which may not result in a sale. For all of these reasons, it is difficult to predict whether and when a sale will be completed, and when revenue from a sale will be recognized or begin to be recognized. If our sales cycles lengthen, our revenue could be lower than expected, which would have an adverse effect on our business, results of operations and financial condition.
We rely upon Amazon Web Services to operate certain aspects of our service and any disruption of or interference with our use of Amazon Web Services would impact our operations and our business would be adversely impacted.
AWS, provides a distributed computing infrastructure platform for business operations, or what is commonly referred to as a cloud computing service. We have designed our software and computer systems so as to utilize data processing, storage capabilities and other services provided by AWS. Currently, the vast majority of our cloud service infrastructure is run on AWS. Given this, along with the fact that we cannot easily switch our AWS operations to another cloud provider, any disruption of or interference with our use of AWS would impact our operations and our business would be adversely impacted.
If we fail to adequately maintain cloud-based infrastructure capacity through third parties, our existing customers may experience service outages, and our new customers may experience delays in the deployment of our platform.
Customers of our cloud-based solution need to be able to access our platform 24 hours a day, seven days a week, without interruption or degradation of performance. We outsource all of our data centers to third parties, including AWS. The number of API calls trafficked through our platform is increasing substantially. An API call is a request for data or services from within an application, made through an API, to another application or system. Although we expend considerable effort to ensure that our platform performance is able to handle existing and anticipated traffic levels, we are dependent upon third parties in order to meet these performance requirements of our customers and we may not be able to maintain the level of performance required by our customers, especially to cover peak levels or spikes in the number of API calls trafficked through our platform. The provisioning of new cloud hosting capacity and data center infrastructure requires lead-time. If we do not accurately predict our infrastructure capacity requirements with sufficient lead-time, our customers could experience service shortfalls.
We do not control the operation of the third-party infrastructure on which our cloud service is deployed and we are therefore vulnerable to any information security breaches, power outages or other issues the data center may experience. We have in the past experienced, and expect that we will in the future experience, interruptions, delays and outages in service and availability from time to time due to a variety of factors, including infrastructure changes, human or software errors, website or third-party hosting disruptions or capacity constraints due to a number of potential causes including technical failures, natural disasters or fraud or security attacks. For example, in the fall of 2014, we were unable to process all of the API calls for one of our customers due to initial capacity constraints in connection with a spike in the number of API calls for this customer. As a result, this customer experienced a momentary outage in service and availability, and during a period of less than two hours the performance of our platform was degraded for this customer while we provisioned additional capacity for this customer. We assessed the impact of the outage and determined that it did not have a material impact on our business or operating results. If our security, or that of our third-party infrastructure providers, is compromised, our platform is unavailable or our users are unable to deploy our solutions within a reasonable amount of time or at all, our business could be negatively affected. In some instances, we may not be able to identify the cause or causes of these performance problems within an acceptable period of time. It may become increasingly difficult to maintain and improve our platform performance, especially during peak usage times and as our software becomes more complex and the number of API calls trafficked through our platform increases. To the extent that we do not effectively address capacity constraints, upgrade third-party infrastructure as needed and continually
29
develop our technology and network architecture to accommodate actual and anticipated changes in technology, our business and results of operations may be adversely affected. In addition, any changes in service levels from our cloud infrastructure provider may adversely affect our ability to meet our customers’ requirements.
Any of the above circumstances or events may harm our reputation, cause customers to terminate their agreements with us, impair our ability to obtain subscription and maintenance renewals from existing customers, impair our ability to grow our customer base, subject us to financial penalties and liabilities under our service level agreements, and otherwise harm our business, results of operations and financial condition.
Breaches of our networks or systems, or those of our third-party cloud infrastructure providers, could degrade our ability to conduct our business operations, delay our ability to recognize revenue, compromise the integrity of our solutions and products, result in significant data losses and the theft of our intellectual property, damage our reputation, expose us to liability to third parties and require us to incur significant additional costs to maintain the security of our networks and data.
We increasingly depend upon our IT systems to conduct virtually all of our business operations, ranging from our internal operations and product development activities to our marketing and sales efforts and communications with our customers and business partners. Computer programmers or other individuals or entities may attempt to penetrate our network security, or that of our platform, including both customer deployments and our third-party cloud infrastructure, and to cause adverse effects on our business operations, including by misappropriating our proprietary information or that of our customers, employees and business partners or to cause interruptions of our service. Because the techniques used by such individuals or entities to access, disrupt or sabotage computing devices, systems and networks change frequently and may not be recognized until launched against a target, we may be unable to anticipate these techniques, and we may not become timely aware of such a security breach which could exacerbate any damage we experience. Any data security incidents, unauthorized access, unauthorized usage, virus or similar breach or disruption of us or of a third-party infrastructure provider could result in loss of confidential information, damage to our reputation, early termination of our contracts, litigation, regulatory investigations, fines, penalties and other liabilities. Additionally, we depend upon our employees and contractors to appropriately handle confidential and sensitive data and to deploy our IT resources in safe and secure fashion that does not expose our network systems to security breaches or the loss of data. Accordingly, if our cybersecurity protocols and defenses and those of our contractors, including our third-party infrastructure providers, fail to protect against unauthorized access, attacks (which may include sophisticated cyberattacks) or the mishandling of data by our employees and contractors, our ability to conduct our business effectively could be damaged in a number of ways, including:
• | sensitive data regarding our business, including intellectual property and other proprietary data, could be stolen or compromised; |
• | sensitive customer data running through our cloud-based solution or through on-premises customer deployments could be stolen or compromised; |
• | our electronic communications systems, including email and other methods, could be disrupted, and our ability to conduct our business operations could be seriously impeded until such systems can be restored; |
• | our ability to process customer orders, electronically deliver solutions and services and perform our contractual obligations could be degraded, and our distribution channels could be disrupted, resulting in delays in revenue recognition; |
• | defects and security vulnerabilities could be introduced into our software, thereby damaging the reputation and perceived reliability and security of our solutions and potentially making the data systems of our customers vulnerable to further data loss and cyberincidents; and |
• | personally identifiable data of our customers, employees and business partners could be stolen or compromised. |
If our security measures or those of our third-party infrastructure providers are breached as a result of third-party action, employee error, malfeasance or otherwise and, as a result, someone obtains unauthorized access to or engages in unauthorized use of customer data, our reputation may be damaged, our business may suffer and we could incur significant liability. Also, the regulatory and contractual actions, litigation, investigations, fines, penalties and liabilities relating to any such incidents can be significant in terms of the dedication of management and financial resources, reputational impact and may necessitate changes to our business operations that may be disruptive to us. Additionally, we could incur significant costs, both in terms of monetary expense and in management and technical attention, in order to upgrade our information security systems and methods and remediate damages. Consequently, our financial performance and results of operations could be adversely affected.
30
Our ability to sell our products is highly dependent on the quality of our software, support and services offerings, and our failure to offer high-quality software, support and services could have a material and adverse effect on our business and results of operations.
Once our platform is deployed for our customers, those customers depend on our support organization and those of our channel partners to resolve any issues relating to our platform. Customers using our cloud-based solution are similarly dependent upon our ability to resolve these platform issues. Because our software is complex, undetected errors, failures or bugs may occur. Our platform may be installed and used in large-scale computing environments with different operating systems, system management software and equipment and networking configurations, which may cause errors or failures of our software or other aspects of the computing environment into which it is deployed. Despite testing by us, errors, failures or bugs may not be found in enhancements to our platform until they are used by our customers. In the past, we have discovered software errors, failures and bugs in our platform. Real or perceived errors, failures or bugs in our software could result in negative publicity, loss of or delay in market acceptance of our software, loss of competitive position, claims by customers for losses sustained by them or, in the case of our cloud-based solution, failure to meet the stated service level commitments in our customer agreements. In such an event, we may be required, or may choose, for customer relations or other reasons, to expend significant additional resources in order to help correct the problem.
High-quality software, support and services are critical for the successful marketing and sale of our products. If we or our channel partners do not devote sufficient resources or are otherwise unsuccessful in assisting our customers in deploying our products effectively, succeed in helping our customers resolve post-deployment issues quickly, or provide ongoing support, it could adversely affect our ability to sell our products to existing end customers and could harm our reputation with potential customers. In addition, as we expand our operations internationally, our support organization will face additional challenges, including those associated with delivering support, training and documentation in languages other than English. Our failure or the failure of our channel partners to maintain high-quality software, support and services could have an adverse effect on our business, results of operations and financial condition.
Incorrect implementation or use of our software could result in customer or developer dissatisfaction and negatively affect our business, operations, financial results and growth prospects.
Our platform is designed to be operated in a “self-service” manner by developers and by customers who subscribe to our cloud-based solution. In addition, our platform may be deployed in large scale, complex technology environments of our customers. Our customers, developers and channel partners require training and experience in the proper use of and the variety of benefits that can be derived from our platform to maximize its potential. If our customers do not have sufficient or adequate resources to timely launch projects using our software, or they are unable to operate our software properly, customer perceptions of our platform may be impaired, our reputation and brand may suffer, and customers may choose not to expand their use of our software or to discontinue its use. If our software is not implemented or used correctly or as intended, inadequate performance or security vulnerabilities may result. Because our customers rely on our software to manage a wide range of operations, the incorrect implementation or use of our software, our failure to train customers on how to productively use our software may result in customer dissatisfaction, negative publicity and adversely affect our reputation and brand. Failure by us to provide these training and implementation services to our customers would result in lost opportunities for follow-on sales to these customers and adoption of our platform by new customers, and adversely affect our business and growth prospects.
In cases where our platform has been deployed on premises within a customer’s environment, if we or our customers or their developers are unable to configure or implement our software properly, or unable to do so in a timely manner, or poor advice or information is spread through our customer or developer communities, customer perceptions of our platform may be impaired, our reputation and brand may suffer, and customers may choose not to increase their use of our software or to discontinue its use. In addition, our on-premises solution imposes server load and data storage requirements for implementation. If our customers do not have the server load capacity or the storage capacity required, they may not be able to effectively implement and use our software and, therefore, may not choose to expand their use of our software or to discontinue its use.
We typically provide service level commitments of up to 99.99% under our customer contracts. If we fail to meet these contractual commitments, we could be obligated to provide credits or refunds for prepaid amounts related to unused subscription services or face contract terminations, which could adversely affect our business, results of operations and financial condition.
Subscriptions for our cloud-based solution typically provide our customers with service level commitments on a monthly basis. If we are unable to meet the stated service level commitments to our customers, as has happened from time to time, or
31
suffer extended periods of unavailability of our cloud-based solution, we may be contractually obligated to provide these customers with service credits, refunds for prepaid amounts related to unused subscription services, and could face contract terminations. As a result, our revenue, other operating results and financial condition could be adversely affected if we suffer unscheduled downtime that exceeds the service level commitments under our agreements with our customers, and any extended service outages could adversely affect our business and reputation.
Our international sales and operations subject us to additional risks that can adversely affect our operating results and financial condition.
In fiscal 2016, 2015, and 2014, respectively, we derived approximately 36%, 38%, and 33%, respectively, of our total revenue from customers located outside the United States. We are continuing to expand our international operations as part of our growth strategy. Sales to our customers in foreign countries have typically been denominated in U.S. dollars. Fluctuations in currency exchange rates could cause our products to become relatively more expensive to end customers in a particular country, leading to a reduction in sales in that country. We are also exposed to movements in foreign currency exchange rates since the operating expenses we incur for our operations and personnel outside the United States are denominated in local currencies. We have research and development personnel in India and the United Kingdom, engage contractors in various international locations, and have testing and support personnel in the United States, India and the United Kingdom, and we may expand our offshore development efforts. In addition, we have sales and support personnel in numerous countries worldwide and expect to continue to substantially expand our overseas headcount. Our international operations subject us to a variety of additional risks, including:
• | the difficulty of managing and staffing international offices and the increased travel, infrastructure and legal compliance costs associated with numerous international locations; |
• | reduced demand for technology products outside the United States; |
• | difficulties in enforcing contracts and collecting accounts receivable, and longer payment cycles, especially in emerging markets; |
• | demanding data protection standards in certain jurisdictions that can interrupt or delay the transfer and processing of personal data; |
• | tariffs and trade barriers, import requirements, export control and trade sanctions regulations and other regulatory or contractual limitations on our ability to sell or develop our products in certain foreign markets; |
• | heightened exposure to political instability, war and terrorism; |
• | added legal compliance obligations and complexity; |
• | reduced protection for intellectual property rights in some countries; |
• | multiple conflicting tax laws and regulations; |
• | lack of familiarity and burdens of complying with foreign laws, accounting and legal standards, regulatory requirements, tariffs, and other barriers; |
• | compliance with laws and regulations applicable to domestic and international operations, including the United States Foreign Corrupt Practices Act of 1977, as amended (“FCPA”), the United Kingdom Bribery Act of 2010 (“Bribery Act”), privacy and data protection laws and regulations, import and export control laws, tariffs, trade barriers, economic sanctions and other regulatory or contractual limitations on our ability to sell our software in certain foreign markets, and the risks and costs of non-compliance; |
• | heightened risks of unfair or corrupt business practices in certain geographies and of improper or fraudulent sales arrangements that may impact financial results and result in restatements of financial statements and irregularities in financial statements; |
• | difficulties in adapting to differing technology standards; |
• | the need to localize our products for international end customers and our lack of experience in connection with the localization of our solutions, including translation into foreign languages and adaptation for local practices and regulatory requirements; |
• | increased financial accounting and reporting burdens and complexities; and |
• | complexities and increased costs in retaining and terminating employees in some countries. |
As noted above, we are subject to the FCPA and the Bribery Act in certain cases. We are also subject to the U.S. domestic bribery statute contained in 18 U.S.C. § 201, the U.S. Travel Act, the USA PATRIOT Act, and possibly other anti-bribery and anti-money laundering laws and regulations in countries in which we conduct activities. Failure to comply with these laws and regulations could cause delays in revenue recognition and financial reporting misstatements, and subject us to other serious adverse consequences discussed below. Anti-corruption and anti-bribery laws such as the FCPA and Bribery Act generally prohibit companies and their employees and third-party intermediaries from making corrupt payments to government officials or private parties for the purpose of obtaining or keeping business, permits or other regulatory approvals, securing an advantage, or directing business to another. These laws also require companies to maintain accurate books and records and a
32
system of internal accounting controls. We plan to increase our international sales and business and engage with an increasing number of business partners and other third-party intermediaries to conduct our business and sell our products and services abroad. We, our business partners, or our third-party intermediaries may have direct or indirect interactions with officials and employees of government agencies or state-owned or affiliated entities. Under the FCPA, the company may be held liable for the corrupt actions taken by directors, officers, employees, agents, or other strategic or local partners or representatives. Similarly, under the Bribery Act, we may be held strictly liable for the corrupt acts of any person associated with us. As such, if we or our intermediaries fail to comply with the requirements of the FCPA, the Bribery Act or similar legislation, we could be subject to whistleblower complaints, investigations, sanctions, settlements, prosecution, other enforcement actions, significant criminal fines, civil penalties, tax penalties, disgorgement, and other remedial measures, suspension or debarment from contracting with certain governments or other persons, the loss of export privileges, reputational harm, adverse media coverage, civil litigation, and other collateral consequences. In addition, responding to any allegation or action will likely result in a materially significant diversion of management’s attention and resources and investigation, compliance, and defense costs and other professional fees, and could result in a material adverse effect on our business, prospects, financial condition, or results of operations. We also face the risk of multijurisdictional liability for the same act. This is due to the fact that many countries have broad laws and regulations in place which overlap with the laws and regulations of other countries.
As we continue to expand our business globally, our success will depend, in large part, on our ability to anticipate and manage effectively these and other risks associated with our international operations. In addition, compliance with laws and regulations applicable to our international operations increases our cost of doing business in foreign jurisdictions. We may be unable to keep current with changes in government requirements as they change from time to time. Failure to comply with these regulations could have adverse effects on our business. Although we have implemented policies and procedures designed to ensure compliance with these laws and policies, we cannot assure you that all of our employees, contractors, channel partners and agents will comply with the FCPA and Bribery Act.
Our reliance on Software-as-a-Service technologies from third parties may adversely affect our business and operating results.
We rely heavily on hosted Software-as-a-Service technologies from third parties in order to operate critical functions of our business, including enterprise resource planning services from NetSuite and customer relationship management services from salesforce.com. If these services become unavailable due to extended outages, interruptions or because they are no longer available on commercially reasonable terms or prices, our expenses could increase, our ability to manage our finances could be interrupted and our processes for managing sales of our software and supporting our customers could be impaired until equivalent services, if available, are identified, obtained and implemented, all of which could adversely affect our business.
We could incur substantial costs in protecting or defending our intellectual property rights, and any failure to protect our intellectual property could impair our business.
Our success depends, in part, on our ability to protect proprietary methods and technologies that we develop under patent and other intellectual property laws of the United States and foreign jurisdictions so that we can prevent others from using our inventions and proprietary information. As of July 31, 2016, we have only been issued nine U.S. patents and have filed fifteen nonprovisional U.S. patent applications. We have no foreign patents. Our issued patents expire between 2028 and 2029. There can be no assurance that additional patents will be issued or that any patents that have been issued or that may be issued in the future will provide significant protection for our intellectual property. If we fail to protect our intellectual property rights adequately, our competitors might gain access to our technology and our business might be harmed. There is no assurance that the particular forms of intellectual property protection that we seek, including business decisions about when to file patents and when to maintain trade secrets, will be adequate to protect our business. We could be required to spend significant resources to monitor and protect our intellectual property rights. Litigation may be necessary in the future to enforce our intellectual property rights, protect our trade secrets, determine the validity and scope of the proprietary rights of us or others or defend against claims of infringement or invalidity. Such litigation could be costly, time-consuming and distracting to management, result in a diversion of significant resources, the narrowing or invalidation of portions of our intellectual property and have an adverse effect on our business, results of operations and financial condition. Our efforts to enforce our intellectual property rights may be met with defenses, counterclaims and countersuits attacking the validity and enforceability of our intellectual property rights or alleging that we infringe the counterclaimant’s own intellectual property. These steps may be inadequate to protect our intellectual property. Any of our patents, copyrights, trademarks or other intellectual property rights could be challenged by others or invalidated through administrative process or litigation.
We also rely, in part, on confidentiality agreements with our technology partners, employees, consultants, advisors, customers and others in our efforts to protect our proprietary technology, processes and methods,. These agreements may not effectively prevent disclosure of our confidential information, and it may be possible for unauthorized parties to copy our
33
software or other proprietary technology or information, or to develop similar software independently without our having an adequate remedy for unauthorized use or disclosure of our confidential information. In addition, others may independently discover our trade secrets and proprietary information, and in these cases we would not be able to assert any trade secret rights against those parties. Costly and time-consuming litigation could be necessary to enforce and determine the scope of our proprietary rights, and failure to obtain or maintain trade secret protection could adversely affect our competitive business position.
In addition, the laws of some countries do not protect proprietary rights to the same extent as the laws of the United States. To the extent we expand our international activities, our exposure to unauthorized copying, transfer and use of our solutions and proprietary technology or information may increase.
There can be no assurance that our means of protecting our proprietary rights will be adequate or that our competitors will not independently develop similar technology. If we fail to meaningfully protect our intellectual property, our business, brand, operating results and financial condition could be materially harmed.
We could incur substantial costs as a result of any claim of infringement of another party’s intellectual property rights.
In recent years, there has been significant litigation involving patents and other intellectual property rights in the software industry. Companies providing software are increasingly bringing and becoming subject to suits alleging infringement of proprietary rights, particularly patent rights, and to the extent we gain greater market visibility, we face a higher risk of being the subject of intellectual property infringement claims. We do not have a significant patent portfolio, which could prevent us from deterring patent infringement claims, and our competitors and others may now and in the future have significantly larger and more mature patent portfolios than we have. The risk of patent litigation has been amplified by the increase in the number of a type of patent holder, which we refer to as a non-practicing entity, whose sole business is to assert such claims and against whom our own intellectual property portfolio may provide little deterrent value. We could incur substantial costs in prosecuting or defending any intellectual property litigation. If we sue to enforce our rights or are sued by a third party that claims that our solutions infringe its rights, the litigation could be expensive and could divert our management and resources.
Any intellectual property litigation to which we might become a party, or for which we are required to provide indemnification, may require us to do one or more of the following:
• | cease selling or using solutions that incorporate the intellectual property that we allegedly infringe; |
• | terminate customer agreements and issue refunds to customers; |
• | make substantial payments for legal fees, settlement payments or other costs or damages; |
• | obtain a license, which may not be available on reasonable terms or at all, to sell or use the relevant technology; or |
• | redesign the allegedly infringing solutions to avoid infringement, which could be costly, time-consuming or impossible. |
If we are required to make substantial payments or undertake any of the other actions noted above as a result of any intellectual property infringement claims against us or any obligation to indemnify our customers for such claims, such payments or actions could harm our business.
Our use of open source software could negatively affect our ability to sell our solutions and subject us to possible litigation.
A portion of our technologies incorporate open source software, and we expect to continue to incorporate open source software in our solutions in the future. Few of the licenses applicable to open source software have been interpreted by courts, and there is a risk that these licenses could be construed in a manner that could impose unanticipated conditions or restrictions on our ability to commercialize our products. Moreover, we cannot assure you that we have not incorporated additional open source software in our software in a manner that is inconsistent with the terms of the license or our current policies and procedures. If we fail to comply with these licenses, we may be subject to certain requirements, including requirements that we offer our solutions that incorporate the open source software for no cost, that we make available source code for modifications or derivative works we create based upon, incorporating or using the open source software and that we license such modifications or derivative works under the terms of applicable open source licenses. If an author or other third party that distributes such open source software were to allege that we had not complied with the conditions of one or more of these licenses, we could be required to incur significant legal expenses defending against such allegations and could be subject to significant damages, enjoined from the sale of our solutions that contained the open source software and required to comply with onerous conditions or restrictions on these solutions, which could disrupt the distribution and sale of these solutions. In addition, there have been claims challenging the ownership of open source software against companies that incorporate open source software into their products. In any of these events, we and our customers could be required to seek licenses from third
34
parties in order to continue offering our products, and to re-engineer our products or discontinue the sale of our products in the event re-engineering cannot be accomplished on a timely basis. We and our customers may also be subject to suits by parties claiming infringement due to the reliance by our solutions on certain open source software, and such litigation could be costly for us to defend or subject us to an injunction. Any of the foregoing could require us to devote additional research and development resources to re-engineer our solutions, could result in customer dissatisfaction, and may adversely affect our business, results of operations and financial condition.
We may have additional tax liabilities, which could harm our business, operating results, financial condition and prospects.
Significant judgments and estimates are required in determining our provision for income taxes and other tax liabilities. Our tax expense may be impacted if our intercompany transactions, which are required to be computed on an arm’s-length basis, are challenged and successfully disputed by the tax authorities. Also, our tax expense could be impacted depending on the applicability of withholding and other taxes (including withholding and indirect taxes on software licenses and related intercompany transactions) under the tax laws of certain jurisdictions in which we have business operations. In determining the adequacy of income taxes, we assess the likelihood of adverse outcomes that could result if our tax positions were challenged by the Internal Revenue Service, or IRS, and other tax authorities. We may be audited in various jurisdictions, and such jurisdictions may assess additional taxes against us. The ultimate outcome of these audits cannot be predicted with certainty. Should the IRS or other tax authorities assess additional taxes as a result of audits, we may be required to record charges to operations that could have a material impact on the results of operations, financial position or cash flows.
Taxing authorities may successfully assert that we should have collected or in the future should collect sales and use, value added or similar taxes, and we could be subject to liability with respect to past or future sales, which could adversely affect our results of operations.
We do not collect sales and use, value added and similar taxes in all jurisdictions in which we have sales, based on our belief that such taxes are not applicable. Sales and use, value added and similar tax laws and rates vary greatly by jurisdiction. Certain jurisdictions in which we do not collect such taxes may assert that such taxes are applicable, which could result in tax assessments, penalties and interest, and we may be required to collect such taxes in the future. Such tax assessments, penalties and interest or future requirements may adversely affect our results of operations.
Indemnity provisions in various agreements potentially expose us to substantial liability for intellectual property infringement and other losses.
Our agreements with clients and other third parties may include indemnification provisions under which we agree to indemnify them for losses suffered or incurred as a result of claims of intellectual property infringement, damages caused by us to property or persons, or other liabilities relating to or arising from our products, services, or other contractual obligations. Some of these indemnity agreements provide for uncapped liability for which we would be responsible. The term of these indemnity provisions generally survives termination or expiration of the applicable agreement. Large indemnity payments could harm our business, operating results and financial condition. From time to time, we are requested by clients to indemnify them for breach of confidentiality with respect to personal data or other security breaches. Although we typically do not agree to, or contractually limit our liability with respect to, such requests, the existence of such a dispute with a client may have adverse effects on our client relationships and reputation.
We may become involved in litigation that may materially adversely affect us.
From time to time, we may become involved in various legal proceedings relating to matters incidental to the ordinary course of our business, including patent, commercial, product liability, employment, class action, whistleblower and other litigation and claims, and governmental and other regulatory investigations and proceedings. Such matters can be time-consuming, divert management’s attention and resources, cause us to incur significant expenses or liability and/or require us to change our business practices. Because of the potential risks, expenses and uncertainties of litigation, we may, from time to time, settle disputes, even where we have meritorious claims or defenses, by agreeing to settlement agreements. Because litigation is inherently unpredictable, we cannot assure you that the results of any of these actions will not have a material adverse effect on our business, financial condition, results of operations and prospects.
We employ third-party licensed software for use in or with our products, and the inability to maintain these licenses or errors in the software we license could result in increased costs, or reduced service levels, which would adversely affect our business.
Our products incorporate certain third-party software obtained under licenses from other companies. We anticipate that we will continue to rely on such third-party software and development tools from third parties in the future. Such third-party
35
companies may discontinue their products, go out of business, or otherwise cease to make support available for such third-party software. Although we believe that there are commercially reasonable alternatives to the third-party software we currently license, this may not always be the case, or it may be difficult or costly to replace. In addition, integration of the software used in our products with new third-party software may require significant work and require substantial investment of our time and resources. Also, to the extent that our products depend upon the successful operation of third-party software in conjunction with our software, any undetected errors or defects in this third-party software could prevent the deployment or impair the functionality of our products, delay new product introductions, result in a failure of our products and injure our reputation. Our use of additional or alternative third-party software would require us to enter into license agreements with third parties.
Future acquisitions could disrupt our business and adversely affect our results of operations, financial condition and cash flows.
We may choose to expand by making acquisitions that could be material to our business, results of operations, financial condition and cash flows. Our ability as an organization to successfully acquire and integrate technologies or businesses is unproven. Acquisitions involve many risks, including the following:
• | an acquisition may negatively affect our results of operations, financial condition or cash flows because it may require us to incur charges or assume substantial debt or other liabilities, may cause adverse tax consequences or unfavorable accounting treatment, may expose us to claims and disputes by third parties, including intellectual property claims and disputes, or may not generate sufficient financial return to offset additional costs and expenses related to the acquisition; |
• | we may encounter difficulties or unforeseen expenditures in integrating the business, technologies, products, personnel or operations of any company that we acquire, particularly if key personnel of the acquired company decide not to work for us; |
• | an acquisition may disrupt our ongoing business, divert resources, increase our working capital requirements and expenses, and distract our management; |
• | the need to implement or improve internal controls, procedures and policies appropriate for a public company at businesses that, prior to our acquisition of them, may have lacked effective controls, procedures or policies, including but not limited to, processes required for the effective and timely reporting of the financial condition and results of operations of the acquired business, both for historical periods prior to the acquisition and on a forward basis following the acquisition; |
• | an acquisition may result in a delay or reduction of customer purchases for both us and the company acquired due to customer uncertainty about continuity and effectiveness of service from either company; |
• | we may encounter difficulties in, or may be unable to, successfully sell any acquired products; |
• | an acquisition may involve the entry into geographic or business markets in which we have little or no prior experience or where competitors have stronger market positions; |
• | our use of cash to pay for acquisition would limit other potential uses for our cash; |
• | if we incur debt to fund such acquisition, such debt may subject us to material restrictions on our ability to conduct our business as well as financial maintenance covenants; and |
• | to the extent that we issue a significant amount of equity securities in connection with future acquisitions, existing stockholders may be diluted and earnings per share may decrease. |
The occurrence of any of these risks could have a material adverse effect on our business, results of operations, financial condition and cash flows.
If our goodwill or intangible assets become impaired, we may be required to record a significant charge to earnings.
We review our intangible assets for impairment when events or changes in circumstances indicate the carrying value may not be recoverable. Goodwill is required to be tested for impairment at least annually. As of July 31, 2016 and July 31, 2015, we had goodwill and intangible assets with a net book value of $16.9 million and $17.9 million, respectively, related to our acquisition of InsightsOne Systems, Inc. (“InsightsOne”). An adverse change in market conditions, particularly if such change has the effect of changing one of our critical assumptions or estimates, could result in a change to the estimation of fair value that could result in an impairment charge to our goodwill or intangible assets. Any such charges may have a material negative impact on our operating results.
If currency exchange rates fluctuate substantially in the future, the results of our operations, which are reported in U.S. dollars, could be adversely affected.
As we continue to expand our international operations, we become more exposed to the effects of fluctuations in currency exchange rates. Our sales contracts are denominated in U.S. dollars, and therefore substantially all of our revenues are not
36
subject to foreign currency risk. However, a strengthening of the U.S. dollar could increase the real cost of our software to our customers located outside of the United States, which could adversely affect our business, results of operations, financial condition and cash flows. In addition, we incur expenses for employee compensation and other operating expenses at our non-U.S. locations in the local currency. Fluctuations in the exchange rates between the U.S. dollar and other currencies could result in the dollar equivalent of such expenses being higher. This could have a negative impact on our reported operating results. To date, we have not engaged in any hedging strategies, and any such strategies, such as forward contracts, options and foreign exchange swaps related to transaction exposures that we may implement to mitigate this risk, may not eliminate our exposure to foreign exchange fluctuations.
Our ability to use our net operating losses to offset future taxable income may be subject to certain limitations.
In general, under Section 382 of the Internal Revenue Code of 1986, as amended (the “Code”), a corporation that undergoes an “ownership change” is subject to limitations on its ability to utilize its pre-change net operating losses (“NOLs”), to offset future taxable income. Our existing NOLs may be subject to limitations arising from previous ownership changes, and if we undergo an ownership change, our ability to utilize NOLs could be further limited by Section 382 of the Code. Future changes in our stock ownership, some of which are outside of our control, could result in an ownership change under Section 382 of the Code. Furthermore, our ability to utilize NOLs of companies that we may acquire in the future may be subject to limitations. There is also a risk that due to regulatory changes, such as suspensions on the use of NOLs, or other unforeseen reasons, our existing NOLs could expire or otherwise be unavailable to offset future income tax liabilities. For these reasons, we may not be able to utilize a material portion of the NOLs reflected on our balance sheet, even if we attain profitability.
Our international operations may give rise to potentially adverse tax consequences.
We generally conduct our international operations through wholly-owned subsidiaries and report our taxable income in various jurisdictions worldwide based upon our business operations in those jurisdictions. Our intercompany relationships are subject to complex transfer pricing regulations administered by taxing authorities in various jurisdictions. The relevant taxing authorities may disagree with our determinations as to the income and expenses attributable to specific jurisdictions. In addition, a taxing authority in a jurisdiction in which we have substantial business operations could assert that withholding or other taxes in such jurisdiction could apply, including in connection with a future disposition of our shares. If such a disagreement were to occur or such assertion by a taxing authority made, we could be required to pay additional taxes, interest and penalties, which could result in one-time tax charges, higher effective tax rates and reduced cash flows. We believe that our financial statements reflect adequate reserves to cover such a contingency, but there can be no assurances in that regard. If our reserves are not sufficient to cover such contingency, our financial results could be harmed.
The enactment of legislation implementing changes in the U.S. taxation of international business activities or the adoption of other tax reform policies could materially impact our financial position and results of operations.
Recent changes to U.S. tax laws, including limitations on the ability of taxpayers to claim and utilize foreign tax credits and the deferral of certain tax deductions until earnings outside of the United States are repatriated to the United States, as well as changes to U.S. tax laws that may be enacted in the future, could impact the tax treatment of our foreign earnings. Due to expansion of our international business activities, any changes in the U.S. taxation of such activities may increase our worldwide effective tax rate and adversely affect our financial position and results of operations.
Our business is subject to the risks of earthquakes, fire, floods and other natural catastrophic events, and to interruption by man-made problems such as power disruptions or terrorism.
Our corporate headquarters are located in the San Francisco Bay Area, a region known for seismic activity. We also have significant facilities in India, a region known for typhoons, floods and other natural disasters. A significant natural disaster, such as an earthquake, fire or a flood, occurring at our headquarters, at one of our other facilities or where a channel partner or supplier is located could have a material adverse effect on our business, operating results and financial condition. In addition, natural disasters and acts of terrorism could cause disruptions in our or our customers’ businesses, national economies or the world economy as a whole. We also rely on IT systems to communicate among our workforce located worldwide and, in particular, our research and development activities that are coordinated between our corporate headquarters in the San Francisco Bay Area and our operations in other states and countries. Any disruption to our internal communications, whether caused by a natural disaster or by man-made problems, such as power disruptions or terrorism, could delay our research and development efforts. To the extent that these disruptions result in delays or cancellations of customer orders or delays in our research and development efforts or the deployment of our solutions, our business and operating results would be materially and adversely affected.
37
Unfavorable conditions in our industry or the global economy or reductions in information technology spending could limit our ability to grow our business and negatively affect our operating results.
Our operating results may vary based on the impact of changes in our industry or the global economy on us or our customers. The revenue growth and potential profitability of our business depend on demand for business software applications and services generally and for API-based software platforms in particular. Current or future economic uncertainties or downturns could adversely affect our business and results of operations. Negative conditions in the general economy both in the United States and abroad, including conditions resulting from changes in gross domestic product growth, financial and credit market fluctuations, political deadlock, natural catastrophes, warfare and terrorist attacks on the United States, Europe, the Asia Pacific region or elsewhere, could cause a decrease in business investments, including corporate spending on API-based software platforms in general and negatively affect the rate of growth of our business. Historically, during economic downturns there have been reductions in spending on information technology as well as pressure for extended billing terms and other financial concessions. If economic conditions deteriorate, our customers and prospective customers may elect to decrease their information technology, which would limit our ability to grow our business and negatively affect our operating results.
To the extent purchases of our platform perceived by customers and potential customers to be discretionary, our revenue may be disproportionately affected by delays or reductions in general information technology spending. Also, customers may choose to develop in-house software as an alternative to using our products. Moreover, competitors may respond to market conditions by lowering prices and attempting to lure away our customers. In addition, the increased pace of consolidation in certain industries may result in reduced overall spending on our software.
We cannot predict the timing, strength or duration of any economic slowdown, instability or recovery, generally or within any particular industry. If the economic conditions of the general economy or industries in which we operate do not improve, or worsen from present levels, our business, results of operations, financial condition and cash flows could be adversely affected.
We are subject to governmental export and import controls that could impair our ability to compete in international markets due to licensing requirements and subject us to liability if we are not in compliance with applicable laws.
Our solutions are subject to export control and import laws and regulations, including the U.S. Export Administration Regulations, U.S. Customs regulations and various economic and trade sanctions regulations administered by the U.S. Treasury Department’s Office of Foreign Assets Controls. Exports of our solutions must be made in compliance with these laws and regulations. If we fail to comply with these laws and regulations, we and certain of our employees could be subject to substantial civil or criminal penalties, including: the possible loss of export or import privileges; fines, which may be imposed on us and responsible employees or managers; and, in extreme cases, the incarceration of responsible employees or managers. Obtaining the necessary authorizations, including any required license, for a particular sale may be time-consuming, is not guaranteed and may result in the delay or loss of sales opportunities. In addition, changes in our solutions or changes in applicable export or import regulations may create delays in the introduction and sale of our solutions in international markets, prevent our customers with international operations from deploying our solutions or, in some cases, prevent the export or import of our solutions to certain countries, governments or persons altogether. Any change in export or import regulations, shift in the enforcement or scope of existing regulations, or change in the countries, governments, persons or technologies targeted by such regulations, could also result in decreased use of our solutions, or in our decreased ability to export or sell our solutions to existing or potential customers with international operations. Any decreased use of our solutions or limitation on our ability to export or sell our solutions would likely adversely affect our business.
Furthermore, we incorporate encryption technology into certain of our solutions. Various countries regulate the import of certain encryption technology, including through import permitting and licensing requirements, and have enacted laws that could limit our ability to distribute our solutions or could limit our customers’ ability to implement our solutions in those countries. Encrypted solutions and the underlying technology may also be subject to export control restrictions. Governmental regulation of encryption technology and regulation of imports or exports of encryption products, or our failure to obtain required import or export approval for our solutions, when applicable, could harm our international sales and adversely affect our revenue. Compliance with applicable regulatory requirements regarding the export of our solutions, including with respect to new releases of our solutions, may create delays in the introduction of our solutions in international markets, prevent our customers with international operations from deploying our solutions throughout their globally-distributed systems or, in some cases, prevent the export of our solutions to some countries altogether.
Moreover, U.S. export control laws and economic sanctions programs prohibit the shipment of certain products and services to countries, governments and persons that are subject to U.S. economic embargoes and trade sanctions. Any violations
38
of such economic embargoes and trade sanction regulations could have negative consequences, including government investigations, penalties and reputational harm.
Our platform and our business are subject to a variety of U.S. and international laws and regulations, including those regarding privacy, data protection and information security, and our customers may be subject to regulations related to the handling and transfer of certain types of sensitive and confidential information. Any failure of our products or solutions to comply with or enable our customers and channel partners to comply with applicable laws and regulations would harm our business, financial condition and operating results.
We and our customers that use our solutions may be subject to privacy- and data protection-related laws and regulations that impose obligations in connection with the collection, processing and use of personal data, financial data, health data or other similar data. Existing U.S. federal and various state and foreign privacy- and data protection-related laws and regulations are evolving and subject to potentially differing interpretations, and various legislative and regulatory bodies may expand current or enact new laws and regulations regarding privacy- and data protection-related matters. For example, the European Union recently adopted a general data protection regulation, to be effective in May 2018, which will supersede current EU data protection legislation and impose more stringent EU data protection requirements. Such regulation provides for penalties for noncompliance of up to four percent of annual global revenues. More generally, we believe additional regulation is likely in the area of data privacy, and changing laws, regulations and standards applying to the collection, processing or use of personal or consumer information could affect our customers’ obligations and our facilitation of those obligations. New laws, amendments to or re-interpretations of existing laws and regulations, rules of self-regulatory bodies, industry standards and contractual obligations may impact our business and practices, and we may be required to expend significant resources to adapt to these changes. These developments could harm our business, financial condition and results of operations.
The U.S. federal and various state and foreign governments have adopted or proposed limitations on, or requirements regarding, the collection, distribution, use, security and storage of personally identifiable information of individuals. The U.S. Federal Trade Commission and numerous state attorneys general are applying federal and state consumer protection laws to impose standards on the online collection, use and dissemination of data, and to the security measures applied to such data. Similarly, many foreign countries and governmental bodies, including the member states of the European Union, or EU, have laws and regulations concerning the collection and use of personally identifiable information obtained from their residents or by businesses operating within their jurisdiction, which are often more restrictive than those in the United States. Laws and regulations in these jurisdictions apply broadly to the collection, use, storage, disclosure and security of personally identifiable information that identifies or may be used to identify an individual, such as names, email addresses and, in some jurisdictions, Internet Protocol, or IP, addresses. Further, as we undertake efforts to have our platform comply with applicable laws and regulations, these and other obligations may be modified, they may be interpreted and applied in an inconsistent manner from one jurisdiction to another, and they may conflict with one another, other regulatory requirements or our internal practices. We also may be bound by contractual obligations relating to our collection, use and disclosure of personal, financial and other data.
Following a European court decision in October 2015 that invalidated the U.S.-EU Safe Harbor Framework, which framework was adopted to provide assurance that U.S. based companies were adhering to certain standards for data protection, we have in certain cases been willing to enter into standard EU model contractual clauses in an effort to help our customers comply with, relevant laws and regulations of the EU and its member states applicable to our handling of personal data. The invalidation of the U.S.-EU Safe Harbor Framework may serve as a basis for our personal data handling practices, or those of our customers, to be challenged and may otherwise adversely impact our business. U.S. and EU authorities reached a political agreement in February 2016 regarding a new means for legitimizing personal data transfers from the European Economic Area, or EEA to the United States, the EU-U.S. Privacy Shield. It is unclear whether the EU-U.S. Privacy Shield will function as an appropriate means for us to legitimize any of our personal data transfers from the EEA to the U.S. Responding to an investigation or enforcement action by relevant authorities of the EU and its member states could divert management’s attention and resources, cause us to incur investigation, compliance and defense costs and other professional fees, result in fines and other penalties, and adversely affect our business, results of operations, financial condition and cash flows.
We facilitate our customers’ compliance with a number of diverse data protection, security, privacy and other government- and industry-specific requirements, including those that require companies to notify individuals of data security incidents involving certain types of personal data. For example, with respect to portions of our platform we maintain compliance with the requirements set forth in the U.S. Health Insurance Portability and Accountability Act of 1996 (“HIPAA”), as amended by the Health Information Technology for Economic and Clinical Health Act of 2009 (“HITECH”), and their respective implementing regulations, including the final omnibus rule published on January 25, 2013. Among other things, HITECH, through its implementing regulations, makes certain of HIPAA’s privacy and security standards directly applicable to business associates, defined as persons or organizations that create, receive, maintain or transmit protected health information
39
(“PHI”), for or on behalf of a HIPAA-covered entity for a function or activity regulated by HIPAA. Because certain customers that are HIPAA-covered entities receive and transmit PHI through our platform, we may be considered a business associate with respect to these customers and therefore subject to the HIPAA requirements applicable to business associates. In addition, state laws govern the privacy and security of personal information and health information in certain circumstances, many of which differ from each other in significant ways and may not have the same effect, thus complicating compliance efforts. Noncompliance with applicable HIPAA and related state law requirements could result in significant civil and criminal penalties, which could adversely impact our business, financial condition and cash flows as well as our reputation.
Similarly, because a number of our clients interface with payment card systems through our platform, including those for the processing of debit or credit cards, we maintain Payment Card Industry Data Security Standard (“PCI DSS”) compliance with respect to portions of our platform as part of our information security program. If we are unable to comply with PCI DSS, whether due to changes in the PCI DSS standard or for another reason, we might incur significant liability and may suffer an adverse effect to our reputation.
With respect to all of the above, any failure or perceived failure by us or our platform to comply with U.S., EU or other foreign privacy or security laws, policies, industry standards or legal obligations, or any security incident that results in the unauthorized access to, or acquisition, release or transfer of, personally identifiable information or other customer data may result in governmental investigations, inquiries, enforcement actions and prosecutions, private litigation, fines and penalties or adverse publicity. Such actions and penalties could divert management’s attention and resources, adversely affect our business, results of operations, financial condition and cash flows, and cause our customers and channel partners to lose trust in our solutions, which could have an adverse effect on our reputation and business.
We expect that there will continue to be new proposed laws, regulations and industry standards concerning privacy, data protection and information security in the United States, the European Union and other jurisdictions, and we cannot yet determine the impact such future laws, regulations and standards may have on our business. Because global laws, regulations and industry standards concerning privacy, data protection and information security have continued to develop and evolve rapidly, it is possible that we or our platform and solutions may not be, or may not have been, compliant with each such applicable law, regulation, and industry standard.
Any such new laws, regulations, other legal obligations or industry standards, or any changed interpretation of existing laws, regulations or other standards may require us to incur additional costs and restrict our business operations. If our privacy or data security measures fail to comply with current or future laws, regulations, policies, legal obligations or industry standards, we may be subject to litigation, regulatory investigations, fines or other liabilities, as well as negative publicity and a potential loss of business. Moreover, if future laws, regulations, other legal obligations or industry standards, or any changed interpretations of the foregoing limit our customers’ or partners’ ability to use and share personally identifiable information or our ability to store, process and share personally identifiable information or other data, demand for our solutions could decrease, our costs could increase and our business, financial condition and operating results could be harmed.
The outcome of the United Kingdom’s (U.K.) referendum on membership in the European Union may have a negative effect on global economic conditions, financial markets, and on the U.K. and European economies, any or all of which could have a material adverse effect on our U.K. and international businesses.
On June 23, 2016, a referendum was held on the U.K.’s membership in the European Union, the outcome of which was a vote in favor of leaving the European Union. The U.K.’s vote to leave the European Union creates an uncertain political and economic environment in the U.K. and potentially across other European Union member states, which may last for a number of months or years. The resulting political and economic instability has caused and may continue to cause significant volatility in global financial markets and the relative value of global currencies, particularly the Pound Sterling and the Euro, which may adversely affect our revenue, expenses as well as the value of our assets and liabilities. This period of uncertainty may continue for the foreseeable future and the extent of its effects or the time period for which it extends cannot be predicted with any certainty. Further, it is possible there will be greater restrictions on imports and exports between the U.K. and European Union countries along with increased regulatory complexities.
Apigee has significant operations based in the U.K., including its Apigee Europe head office. Subject to the terms negotiated for the U.K.’s exit from the European Union, it is possible that there may be other adverse practical and/or operational implications and costs on our business, and for our customers doing business in Europe, as a result of which our U.K. and European operations may be significantly affected and even impaired. Costs may rise for our U.K. operations while revenues may fall. Consequently, no assurance can be given as to the impact of the referendum outcome and, in particular, no assurances can be given that our operating results, financial condition and prospects would not be adversely impacted by the referendum result and such an exit from the European Union by the U.K.
40
Changes in laws and regulations related to the Internet or changes in the Internet infrastructure itself may diminish the demand for our platform, and could have a negative impact on our business.
The future success of our business depends in part upon the continued use of the Internet as a primary medium for commerce, communication, and business applications. Federal, state, or foreign government bodies or agencies have in the past adopted, and may in the future adopt, laws or regulations affecting the use of the Internet as a commercial medium. Changes in these laws or regulations could require us to modify our platform in order to comply with these changes. In addition, government agencies or private organizations have imposed and may impose additional taxes, fees, or other charges for accessing the Internet or commerce conducted via the Internet. These laws or charges could limit the growth of Internet-related commerce or communications generally, or result in reductions in the demand for Internet-based platforms and services such as ours. In addition, the use of the Internet as a business tool could be adversely affected due to delays in the development or adoption of new standards and protocols to handle increased demands of Internet activity, security, reliability, cost, ease-of-use, accessibility, and quality of service. The performance of the Internet and its acceptance as a business tool has been adversely affected by “viruses,” “worms,” and similar malicious programs and the Internet has experienced a variety of outages and other delays as a result of damage to portions of its infrastructure. If the use of the Internet is adversely affected by these issues, demand for our platform could decline.
The terms of our existing loan and security agreement with Silicon Valley Bank and future indebtedness could restrict our operations, particularly our ability to respond to changes in our business or to take specified actions.
The terms of our existing loan and security agreement with Silicon Valley Bank, or SVB, contains, and any future indebtedness would likely contain, a number of restrictive covenants that impose significant operating and financial restrictions on us, including restrictions on our ability, and the ability of our subsidiaries, to take actions that may be in our best interests, including, among others, disposing of assets, entering into change of control transactions, mergers or acquisitions, incurring additional indebtedness, granting liens on our assets and paying dividends. Our loan and security agreement requires us to satisfy specified financial covenants, including a minimum revenue covenant and a minimum adjusted quick ratio. Our ability to meet those financial covenants can be affected by events beyond our control, and we may not be able to continue to meet those covenants. A breach of any of these covenants or the occurrence of other events specified in the loan and security agreement could result in an event of default under the loan and security agreement. Upon the occurrence of an event of default, SVB could elect to declare all amounts outstanding under the loan and security agreement to be immediately due and payable and terminate all commitments to extend further credit. If we were unable to repay those amounts, SVB could proceed against the collateral granted to them to secure such indebtedness. We have pledged substantially all of our assets, other than our intellectual property, as collateral under the loan and security agreement. If SVB accelerates the repayment of borrowings, if any, we may not have sufficient funds to repay our existing debt.
The nature of our business requires the application of complex revenue and expense recognition rules and the current legislative and regulatory environment affecting GAAP is uncertain. Significant changes in current principles could affect our financial statements going forward and changes in financial accounting standards or practices may cause adverse, unexpected financial reporting fluctuations and harm our operating results.
The accounting rules and regulations that we must comply with are complex and subject to interpretation by the Financial Accounting Standards Board (“FASB”), the SEC and various bodies formed to promulgate and interpret appropriate accounting principles. Recent actions and public comments from FASB and the SEC have focused on the integrity of financial reporting. In addition, many companies’ accounting policies are being subject to heightened scrutiny by regulators and the public. Further, the accounting rules and regulations are continually changing in ways that could materially impact our financial statements.
For example, in May 2014, FASB issued a new accounting guidance on revenue recognition, Accounting Standards Update No. 2014-09, Revenue from Contracts with Customers, which becomes effective for us beginning August 1, 2018. The standard permits the use of either the retrospective or cumulative effect transition method. We have not yet selected a transition method and continue to evaluate the impact that this guidance will have on our financial condition and results of operations. Depending on the transition method selected, the application of this new guidance may result in exclusion of certain future licensing revenues in the statement of comprehensive loss after the adoption date, which, despite no change in associated cash flows, could have a material adverse effect on our net income or loss. We cannot predict the impact of future changes to accounting principles or our accounting policies on our financial statements going forward, which could have a significant effect on our reported financial results, and could affect the reporting of transactions completed before the announcement of the change. In addition, were we to change our critical accounting estimates, including the timing of recognition of license revenue and other revenue sources, our results of operations could be significantly impacted.
41
Item 1B. Unresolved Staff Comments
None.
Item 2. Properties
We currently lease approximately 41,000 square feet of space for our corporate headquarters in San Jose, California under a lease agreement expiring in June 2019. We lease regional offices for sales, support and product development in Denver, Colorado and various international locations, including India, Dubai and the United Kingdom. While we believe our facilities are sufficient and suitable for the operations of our business today, we are closely monitoring the need to add new facilities and expanding our existing facilities as we add employees and expand into additional markets.
Item 3. Legal Proceedings
Beginning on March 17, 2016, four purported shareholder class action complaints were filed in the Superior Court of the State of California, County of San Mateo, against the Company, our directors, certain of our executive officers, the underwriters of our IPO and other defendants. The lawsuits were brought by purported stockholders of ours seeking to represent a class consisting of all purchasers of our stock pursuant or traceable to the Registration Statement and Prospectus issued in connection with our April 2015 IPO. On May 26, 2016, the court consolidated these lawsuits into a single action. On July 13, 2016, Plaintiffs filed a consolidated complaint against Apigee, members of Apigee’s board of directors, and certain executive officers. The consolidated complaint asserts claims under Sections 11, 12(a)(2), and 15 of the Securities Act of 1933, and generally alleges that the Registration Statement made materially false and misleading statements and omitted material facts required to be disclosed. The consolidated complaint seeks compensatory damages, reasonable costs and expenses, rescission or rescissory damages, and equitable relief. The Company believes that the claims are without merit and intends to defend this lawsuit vigorously. To that end, defendants filed a demurrer and motion to strike the consolidated complaint on September 12, 2016.
The Company is not able to predict the ultimate outcome of these matters or to reasonably estimate a range of loss related to these lawsuits, if any. If these lawsuits result in a material loss to the Company, this may have an impact on the Company’s financial position, results of operations or cash flows.
From time to time, we may become involved in other legal proceedings arising in the ordinary course of our business. We are not presently a party to any other legal proceedings that, if determined adversely to us, would individually or taken together have a material adverse effect on our business, operating results, financial condition or cash flows.
Item 4. Mine Safety Disclosures
Not applicable.
42
PART II
Item 5. Market for Registrant’s Common Equity, Related Stockholder Matters and Issuer Purchases of Equity Securities
Market Information for Common Stock
Our common stock began trading on the NASDAQ Global Select Market under the symbol “APIC” on April 24, 2015. Prior to that date, there was no public trading market for our common stock. The following table sets forth the high and low sales price per share of our common stock as reported on the NASDAQ Global Select Market for the periods indicated:
Fiscal | ||||||||||||||||
2016 | 2015 | |||||||||||||||
High | Low | High | Low | |||||||||||||
First Quarter | $ | 11.42 | $ | 5.14 | — | — | ||||||||||
Second Quarter | $ | 9.90 | $ | 6.61 | $ | — | $ | — | ||||||||
Third Quarter | $ | 10.00 | $ | 5.35 | $ | 20.50 | 1 | $ | 13.78 | |||||||
Fourth Quarter | $ | 13.15 | $ | 9.32 | $ | 16.94 | $ | 7.75 | ||||||||
1. | Third quarter of fiscal 2015, beginning April 24, 2015. |
Holders of Record
As of July 31, 2016, there were169 shareholders of record and another estimated 3,500 beneficial shareholders holding in street name. Because many of our shares are held by brokers and other institutions on behalf of stockholders, we are unable to accurately estimate the total number of stockholders represented by these record holders.
Dividend Policy
We have never declared or paid any cash dividends on our common stock and do not intend to pay any cash dividends in the foreseeable future. We anticipate that we will retain all of our future earnings for use in the development of our business and for general corporate purposes. Any determination to pay dividends in the future will be at the discretion of our board of directors. In addition, our loan and security agreement with SVB restricts, and any future indebtedness may restrict, our ability to pay dividends. Accordingly, investors must rely on sales of their common stock after price appreciation, which may never occur, as the only way to realize any future gains on their investments.
Unregistered Sales of Equity Securities
None
Use of Proceeds from Registered Securities
There has been no material change in the use of proceeds from our initial public offering as described in our Annual Report on Form 10-K filed with the SEC on October 14, 2015. We invested the funds received in short-term, investment-grade, interest-bearing securities such as money market accounts, certificates of deposit, commercial paper, and guaranteed obligations of the U.S. government.
Stock Performance Graph
This performance graph shall not be deemed “soliciting material” nor to be “filed” with the SEC for purposes of Section 18 of the Exchange Act, or otherwise subject to the liabilities under that Section, and shall not be deemed to be incorporated by reference into any filing of Apigee Corporation under the Securities Act.
The following graph compares the cumulative total return to stockholders on our common stock relative to the cumulative total returns of the S&P 500 Index and the Russell 2000 Index. An investment of $100 (with reinvestment of all dividends) is assumed to have been made in our common stock and in each index on April 24, 2015, the date our common stock
43
began trading on the NASDAQ Global Select Market, and its relative performance is tracked through July 31, 2016. The returns shown are based on historical results and are not intended to suggest future performance.
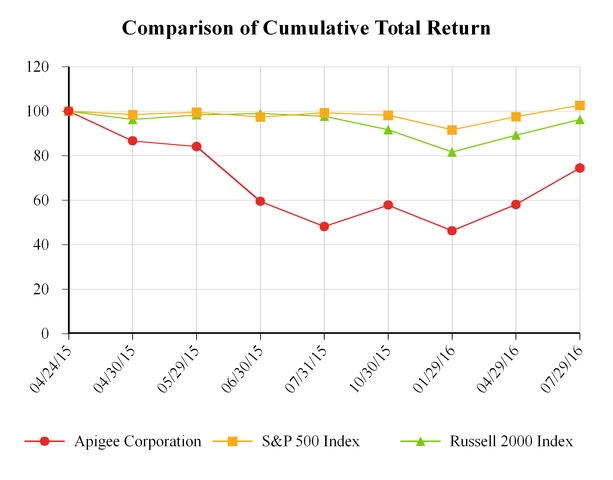
Base Period 4/24/15 | 4/30/2015 | 5/29/2015 | 6/30/2015 | 7/31/2015 | 10/30/2015 | 1/29/2016 | 4/29/2016 | 7/29/2016 | |||||||||||||||||||||||||||||
Apigee Corporation | $ | 100.00 | $ | 86.65 | $ | 84.13 | $ | 59.46 | $ | 48.20 | $ | 57.78 | $ | 46.23 | $ | 58.08 | $ | 74.49 | |||||||||||||||||||
S&P 500 Index | $ | 100.00 | $ | 98.48 | $ | 99.51 | $ | 97.42 | $ | 99.35 | $ | 98.19 | $ | 91.62 | $ | 97.53 | $ | 102.64 | |||||||||||||||||||
Russell 2000 Index | $ | 100.00 | $ | 96.26 | $ | 98.34 | $ | 98.93 | $ | 97.72 | $ | 91.66 | $ | 81.68 | $ | 89.22 | $ | 96.24 | |||||||||||||||||||
Equity Compensation Plan Information
See Part III, Item 12 of this Annual Report on Form 10-K for information regarding securities authorized for issuance under our equity compensation plans.
Item 6. Selected Financial Data
The following selected consolidated financial and other data should be read together with our consolidated financial statements and accompanying notes and “Management’s Discussion and Analysis of Financial Condition and Results of Operations” included elsewhere in this report. The selected consolidated financial and other data in this section is not intended to replace our consolidated financial statements and the related notes. We derived the selected consolidated statements of operations data for fiscal 2016, fiscal 2015 and fiscal 2014 and the consolidated balance sheet data as of July 31, 2016 and 2015 from our audited consolidated financial statements included elsewhere in our Annual Report on Form 10-K. The
44
consolidated statements of operations data for fiscal 2013 and the consolidated balance sheet data as of July 31, 2013 are derived from audited consolidated financial statements not included in this Annual Report on Form 10-K. Our historical results presented below are not necessarily indicative of financial results to be achieved in future periods.
Fiscal Year Ended July 31, | ||||||||||||||||
2016 | 2015 | 2014 | 2013 | |||||||||||||
(in thousands, except per share amounts) | ||||||||||||||||
Consolidated Statement of Operations Data: | ||||||||||||||||
Revenue | ||||||||||||||||
License | $ | 32,345 | $ | 20,757 | $ | 11,411 | $ | 13,917 | ||||||||
Subscription and support | 42,936 | 30,865 | 20,237 | 15,243 | ||||||||||||
Professional services and other | 16,746 | 16,985 | 21,054 | 13,992 | ||||||||||||
Total revenue | 92,027 | 68,607 | 52,702 | 43,152 | ||||||||||||
Cost of revenue | ||||||||||||||||
License | 521 | 514 | 366 | 108 | ||||||||||||
Subscription and support(1) | 12,469 | 11,062 | 11,911 | 9,286 | ||||||||||||
Professional services and other(1) | 14,535 | 13,415 | 15,431 | 12,435 | ||||||||||||
Total cost of revenue | 27,525 | 24,991 | 27,708 | 21,829 | ||||||||||||
Gross profit | 64,502 | 43,616 | 24,994 | 21,323 | ||||||||||||
Operating expenses | ||||||||||||||||
Research and development(1) | 37,795 | 30,387 | 22,273 | 16,848 | ||||||||||||
Sales and marketing(1) | 50,178 | 49,250 | 47,029 | 23,812 | ||||||||||||
General and administrative(1) | 17,436 | 13,453 | 14,415 | 5,885 | ||||||||||||
Total operating expenses | 105,409 | 93,090 | 83,717 | 46,545 | ||||||||||||
Loss from operations | (40,907 | ) | (49,474 | ) | (58,723 | ) | (25,222 | ) | ||||||||
Other expense, net | (390 | ) | (452 | ) | (1,678 | ) | (376 | ) | ||||||||
Loss before income taxes | (41,297 | ) | (49,926 | ) | (60,401 | ) | (25,598 | ) | ||||||||
Provision for income taxes | 215 | 427 | 392 | 273 | ||||||||||||
Net loss and comprehensive loss | $ | (41,512 | ) | $ | (50,353 | ) | $ | (60,793 | ) | $ | (25,871 | ) | ||||
Net loss per share(2): | ||||||||||||||||
Basic and diluted | $ | (1.39 | ) | $ | (4.73 | ) | $ | (17.81 | ) | $ | (10.59 | ) | ||||
Weighted-average shares outstanding used in calculating net loss per share(1): | ||||||||||||||||
Basic and diluted | 29,769 | 10,651 | 3,413 | 2,444 | ||||||||||||
(1) | Includes stock-based compensation expense as follows: |
Fiscal Year Ended July 31, | ||||||||||||||||
2016 | 2015 | 2014 | 2013 | |||||||||||||
(in thousands) | ||||||||||||||||
Cost of subscription and support revenue | $ | 147 | $ | 44 | $ | 24 | $ | 21 | ||||||||
Cost of professional services and other revenue | 520 | 223 | 133 | 65 | ||||||||||||
Research and development | 3,592 | 1,195 | 490 | 114 | ||||||||||||
Sales and marketing | 1,808 | 777 | 1,090 | 138 | ||||||||||||
General and administrative | 2,321 | 1,212 | 989 | 70 | ||||||||||||
Total stock-based compensation expense | $ | 8,388 | $ | 3,451 | $ | 2,726 | $ | 408 | ||||||||
(2) | See Note 13 to our consolidated financial statements appearing elsewhere in this report for an explanation of our basic and diluted net loss per share calculations. |
45
July 31, | ||||||||||||||||
2016 | 2015 | 2014 | 2013 | |||||||||||||
(in thousands) | ||||||||||||||||
Consolidated Balance Sheet Data: | ||||||||||||||||
Cash and cash equivalents | $ | 68,303 | $ | 89,562 | $ | 51,759 | $ | 44,243 | ||||||||
Working capital | 41,587 | 67,281 | 36,317 | 31,051 | ||||||||||||
Total assets | 118,837 | 138,706 | 95,622 | 56,550 | ||||||||||||
Deferred revenue, current and long-term | 53,889 | 40,802 | 28,190 | 17,124 | ||||||||||||
Term debt, current and long-term | 2,200 | 3,866 | 5,243 | 3,681 | ||||||||||||
Additional paid-in capital | 287,156 | 276,099 | 195,221 | 112,279 | ||||||||||||
Total stockholders’ equity | 49,450 | 79,904 | 49,522 | 27,336 | ||||||||||||
Item 7. Management’s Discussion and Analysis of Financial Condition and Results of Operations
You should read the following discussion and analysis of our financial condition and results of operations together with our consolidated financial statements and related notes appearing elsewhere in this Annual Report on Form 10-K. The last day of our fiscal year is July 31. Our fiscal quarters end on October 31, January 31, April 30 and July 31. This discussion contains forward-looking statements based upon current plans, expectations and beliefs that involve risks and uncertainties. Our actual results may differ materially from those anticipated in these forward-looking statements as a result of various factors, including those set forth under Part I, Item 1A “Risk Factors” and elsewhere in this Annual Report on Form 10-K. See “Special Note Regarding Forward-Looking Statements” above.
The Merger
On September 7, 2016, we entered into a definitive agreement to be acquired by Google for $17.40 per share in cash for each share of our common stock, for a total value of approximately $625 million. Completion of the Merger is subject to the satisfaction of customary closing conditions, including approval of the Merger by our stockholders, the absence of certain legal impediments, the absence of a material adverse effect on our business and the approval of applicable regulatory authorities. The companies expect the transaction to close by the end of calendar 2016. For more information about the Merger, please see the preliminary proxy statement on Schedule 14A we filed with the Securities Exchange Commission on September 28, 2016 and any subsequently filed definitive proxy statement.
Overview
Unprecedented growth in mobile technologies, big data, cloud services and the connected devices that comprise the IoT has changed consumer behavior, disrupted or transformed the dynamics of business, and eroded the divide between the physical and digital worlds. To fully embrace the digital world, businesses must provide customer experiences on a variety of devices and channels, respond quickly to fast-changing customer expectations and market conditions, drive revenue through new business models, and create or participate in digital ecosystems. A digital business creates value by unlocking its data and services to better serve customers in a real-time, anywhere-anytime fashion and uses data to continually improve the customer experience and drive additional revenue.
We believe that APIs are a critical enabling technology for the shifts in mobile, cloud computing, big data and the IoT and that APIs are a foundational technology on which digital business operates. APIs are programmed instructions that allow any app (for example, a customer-care app on a mobile phone) to consume data in back-end systems. We believe that a new and expansive market opportunity exists to help enterprises adopt digital strategies and navigate the digitally driven economy. We believe that in order to build, manage and extract valuable insights from APIs and data needed for digital business, nearly all businesses will require a new layer within their core application software stack to achieve this.
We provide an innovative software platform that serves as a connection layer between our customers’ core IT systems and data, and the applications with which their customers, partners, and employees engage with their business. Our web scale and flexible platform processes billions of API calls per week and allows businesses to secure, manage, scale and analyze API traffic, and to design and deploy both APIs and a systematic API strategy. Our cloud service provides up to 99.99% availability and uptime, and a multi-region API delivery network enabling low latency worldwide. We have designed a comprehensive security solution to enable security at all points of engagement, from users, apps, developers, the API team, the APIs themselves to the back-end systems. We enable organizations to control access to APIs and services, and to protect customers and the business from threats, backend system overload, service issues and sensitive data exposure. Our platform provides end-
46
to-end visibility across the digital value chain with unified operational and business metrics and application monitoring. Furthermore, our platform enables a business to provide a developer community experience that accelerates API adoption, simplifies learning, enables monetization and increases the business value of APIs.
Our customers include many leading businesses: over 30 percent of the Fortune 100, five of the top ten Global 2000 retail companies and five of the top 10 global telecommunications companies as of July 31, 2016. Our solution has been sold to customers in over 30 countries around the world. Our current focus is on acquiring new customers and increasing revenue from our existing customers as they realize the value of our platform and expand the use of our software through additional use cases and broader deployment within their organizations. We are also focused on increasing adoption of our platform through Apigee Edge Free.
We generate our revenue primarily from licenses of and subscriptions for our Apigee Edge products and from professional services. We also generate revenue from licenses of and subscriptions to our Apigee Insights product, although such revenue has been immaterial to date. We also offer free trial versions of Apigee Edge to the developer community. We provide our customers the flexibility to deploy our software as a cloud service or on-premises. For those customers that deploy our products as a cloud service, we license our software on a subscription basis. For those customers that deploy our products on premises, we offer two pricing options: a time-based subscription or a perpetual license. We recognize revenue from subscription fees ratably over the service period, and have been increasing the proportion of our revenue mix that we derive from subscriptions. We therefore believe that gross billings, which takes into consideration deferred revenue resulting from subscriptions, provide valuable insight into the performance of our business. We expect professional services and other revenue to account for a decreasing percentage of our total revenue over the long term as we continue to increase our subscriptions and as our customers increase their use of professional services provided by our channel partners and other third parties. However, we expect to continue to provide professional services as an important part of our solution to our customers because digital infrastructure transformation frequently involves core business strategy.
From fiscal 2004 to fiscal 2007, our activities were focused on research and development that resulted in the first commercial release of our software in fiscal 2007 – our Apigee Edge on-premises platform. In fiscal 2009, we extended Apigee Edge solution to a cloud offering to enable deployment flexibility for our customers. In fiscal 2012, we further extended our platform with the release of our first predictive analytics solution, Apigee Insights. In December 2013, we acquired InsightsOne, to further advance predictive analytics as part of our platform strategy and to bolster our developer adoption strategy. In fiscal 2013, we expanded our network of channel partners by entering into a master alliance agreement with Accenture, under which either we co-sell or they resell our solutions as part of larger installations. In fiscal 2014, we announced an OEM and reseller partnership with SAP under which SAP will deliver a comprehensive API management application build on our Apigee Edge product on SAP’s Hana Cloud to SAP’s cloud customers, and sell our Apigee Edge product on a standalone basis to its on-premises customers. From fiscal 2015 to 2016, our activities were focused on expanding our partnership ecosystem, improving sales productivity by acquiring new customers and expanding with existing customers, and improving the functionalities of our product portfolio.
We sell our products through direct field sales, direct inside sales and indirect channel sales. We utilize a wide range of online and offline marketing activities to drive brand awareness, thought leadership, developer trials and lead volume. Our software sales pricing is based on the customer’s usage. Our on-premises term and perpetual license sales are based on the number of computer server cores, while our cloud-based services sales are based on API traffic. Many of our customers initially use our product as a free trial by visiting our website, creating an account and testing the free cloud version of our platform. In addition, we offer open source solutions that introduce developers to the key technical concepts and technologies of APIs and mobile app development, and that allow their APIs and applications to be migrated or deployed to our paid products. After signing up, developers are able to experience the power of our platform and learn how to interact with our solutions, enabling them to understand the benefits of our paid products. We use the trial program as a source of lead volume for our direct sales team.
We have experienced rapid growth in recent periods. Our total revenue was $92.0 million, $68.6 million, and $52.7 million in fiscal 2016, 2015, and 2014, respectively, representing growth rates of 34% from fiscal 2015 to fiscal 2016 and 30% from fiscal 2014 to fiscal 2015. Our gross billings were $105.1 million, $81.2 million and $63.8 million in fiscal 2016, 2015 and 2014, respectively, representing growth rates of 29% from fiscal 2015 to fiscal 2016 and 27% from fiscal 2014 to fiscal 2015. Please see our reconciliation between revenue and gross billings in Certain Key Non-GAAP Financial Metrics. Our revenue derived from sales to customers located outside the United States was approximately 36%, 38%, and 33% in fiscal 2016, 2015, and 2014, respectively. We expect that sales to customers located outside the United States will continue to comprise a significant portion of our total revenue for the foreseeable future.
47
We have made substantial investments in developing and improving our platform and solutions, in expanding our sales and marketing capabilities and geographic coverage, and in providing general and administrative resources to support our growth. As a result, we have incurred net losses of $41.5 million, $50.4 million and $60.8 million in fiscal 2016, 2015, and 2014, respectively. We had an accumulated deficit of $237.7 million and $196.2 million as of July 31, 2016 and 2015, respectively, and we expect to continue to incur net losses for the foreseeable future. We expect that continued investments will drive further growth in our total revenue and gross billings. While increases in our total revenue and gross billings may trail the increases in our operating expenses in the near term, we expect to realize operating leverage in our business model over the long term.
Key Opportunities and Challenges Affecting Our Performance
Market Adoption of Our Platform
We are affected by the pace at which enterprises adopt APIs, mobile apps and cloud computing, and make the transition to become digital businesses. We believe that the transformation to digital business, enabled by APIs and powerful analytics, is an emerging trend. We believe that we have established a leadership position in this new market, both as a provider of API management and data analytics and also as a thought leader helping to define the architecture and vision of API-enabled and data-driven businesses. We intend to extend our leadership position by continuing to innovate, bringing new technologies to market, and honing best practices and thought leadership by working closely with our global customer base, both at a technology level and with senior executives. The degree to which prospective customers recognize the need to transform their businesses into digital businesses will determine the rate at which we are able to sell our platform to new and existing customers.
Investment in Our API and Predictive Analytics Solutions
We have invested, and intend to continue to invest, in expanding the breadth and depth of our platform to enable organizations to deploy robust APIs, big data, and predictive analytics solutions. We intend to continue to invest in research and development to enhance the application development and technology capabilities of our platform. We had four significant product releases or enhancements in calendar 2014. We typically provide our customers with updates to our solution twice a month in the cloud and on premises. In 2015 and 2016, we continued to build out our global partner ecosystem and extend the capabilities in Apigee Edge. We also added a new product, Apigee Sense, which helps customers detect malicious “bots” at the API layer.
Ability to Grow Our Worldwide Sales Capacity
We have invested, and intend to continue to invest, in expanding our sales capacity and improving our sales operations to drive additional revenue and support the growth of our global customer base. We sell our platform through direct field sales, direct inside sales and indirect channel sales. Our sales to date have been primarily through our direct field sales force. We are continuing to develop and expand a partner community to supplement our sales and support operations through system integrators, OEM partners, resellers and other partners to further influence customer decision making and drive adoption of our solutions. Our partners may also co-sell with our direct field sales organization. Our channel partners provide us with additional sales leverage by sourcing new prospects, providing professional services and technical support to existing customers and upselling additional use cases. These channel partners expand our geographic sales reach worldwide, particularly in key international markets in EMEA and APAC. All of these factors will influence timing and overall levels of sales capacity, impacting the rate at which we will be able to acquire customers to drive revenue growth. In fiscal 2016, we derived very limited revenue through our channel partners.
Expansion and Upsell Within Our Existing Customer Base
After the initial sale to and successful deployment by a new customer, we focus on expanding our relationship with the customer to sell additional software licenses and add-on features of our current platform. Historically, we have often realized sales of additional software licenses and add-on features on prior versions of our Apigee Edge platform as well. However, upon the introduction of our current platform in August 2012, there was no easy migration path for transitioning existing customers to the current Apigee Edge platform. Accordingly, we believe our upsell opportunities with customers who initially licensed our prior platforms to be limited. We expect our opportunity to expand our customer relationships through additional sales to increase as we add new customers, broaden our product portfolio to meet additional mobile IT requirements, increase the benefits provided to both users and the enterprise and enhance platform functionality. Additional sales over the lifecycle of a customer relationship can significantly increase the return on our sales and marketing investments. Accordingly, our financial performance will depend in part on the degree to which our expansion and upsell sales strategy is successful.
48
Mix of Products Sold as Subscription and Perpetual Licenses
We offer our customers the flexibility to use our software as a cloud service or on premises. For those customers that use our platform as a cloud service, we license our software on a subscription basis. For those customers that use our platform on premises, we offer two licensing options, a time-based license or a perpetual license. In addition, we also offer our customers software support and professional services. We expect the proportion of our subscription and support revenue to our total revenue to increase over time. However, because we recognize subscription and term revenue ratably over the duration of the related contracts, increases in total revenue will lag any increase in subscription arrangements. Furthermore, the unpredictability of the timing of our receipt of orders for perpetual licenses, the revenue for which we typically recognize upfront, may cause fluctuations in our quarterly financial results.
Future Investment in Growth and Product Development
We intend to extend our leadership position by continuing to innovate, bringing new technologies to market, and honing best practices and thought leadership by working closely with our global customer base, both at a technology level and with senior executives. We intend to continue building innovative software products that extend the value of our existing offering and further help enterprises realize digital business success, through new growth and operational efficiencies. We develop technology to address emerging technology markets such as the IoT. We have steadily increased our focus on partner and channel development efforts to drive efficient new customer acquisition across geographies and industries. We believe that there is substantial opportunity to grow our international business. We plan to continue to aggressively market to customers located outside the United States by building partnerships that help us add customers internationally and by expanding our direct and indirect sales channels outside the United States and EMEA.
Components of Our Operating Results
Revenue
License Revenue. License revenue reflects the revenue recognized from sales of on-premises software licenses, which represented 35%, 30%, and 22% of our total revenue for each of fiscal 2016, 2015, and 2014, respectively. A substantial majority of our license revenue consists of revenue from perpetual licenses, under which we generally recognize the license fee portion of the arrangement upfront, assuming all revenue recognition criteria are satisfied. Customers can also purchase time-based licenses, under which we typically recognize the license fee ratably over the term of the license after all other revenue recognition criteria are met. Due to the differing revenue recognition criteria applicable to perpetual and time-based licenses, shifts in the mix between perpetual and time-based licenses from quarter to quarter could produce substantial variation in the license revenue we recognize.
Subscription Revenue. We generate subscription revenue primarily from fees paid by the customer accessing our cloud-based solution, which represented 32%, 32%, and 28% of our total revenue for each of fiscal 2016, 2015, and 2014, respectively. We typically recognize subscription revenue ratably over the term of the arrangement after all other revenue recognition criteria are met.
Support Revenue. We generate revenue from maintenance and support agreements with customers for on-premises licenses, which represented 15%, 13%, and 10% of our total revenue for each of fiscal 2016, 2015, and 2014, respectively. Going forward, we expect our maintenance and support revenue to remain flat as a percentage of our total revenue over the long term. We typically recognize support revenue ratably over the term of the arrangement after all other revenue recognition criteria are met.
Professional Services and Other Revenue. Professional services and other revenue consists of fees recognized from consulting and training services. We recognize revenue from consulting and training services as the services are performed. We recognize revenue from time and material arrangements as the services are rendered based on inputs to the project, such as billable hours incurred, after all other revenue recognition criteria are met. For fixed-fee professional service arrangements, we recognize revenue under the proportional performance method of accounting and estimate the proportional performance on a monthly basis, utilizing hours incurred to date as a percentage of the total estimated hours to complete the project. If we do not have a sufficient basis to measure progress towards completion, we recognize revenue upon completion of the arrangement.
Our professional services and other revenue represented 18% of our total revenue for fiscal 2016. Historically, we experienced growth in our professional services and other revenue primarily due to the deployment of our software with some customers that have large, highly complex IT environments. However, in fiscal 2017 and going forward, we expect our
49
professional services and other revenue to account for a decreasing percentage of our total revenue over the long term as our customers increase their use of professional services provided by our channel partners and other third parties. We have started to refer professional services opportunities to our partners and have started to field requests from customers to use their current third-party service providers for professional services engagements.
Cost of Revenue
Cost of License Revenue. Cost of license revenue consists primarily of the cost of third-party software royalties and amortization of acquired intangible assets.
Cost of Subscription and Support Revenue. Cost of subscription and support revenue includes all direct costs to deliver our cloud-based solution and software support, including salaries, benefits and stock-based compensation for our customer support organization, third-party hosting costs, third-party software royalties, allocated overhead for facilities and IT, and amortization of acquired intangible assets.
Cost of Professional Services and Other Revenue. Cost of professional services and other revenue includes salaries, benefits and stock-based compensation for our professional services organization, consulting services and allocated overhead for facilities and IT.
Gross Profit and Gross Margin
Gross profit, or total revenue less total cost of revenue, and gross margin, or gross profit as a percentage of total revenue, has been and will continue to be affected by various factors, including the mix among our license, subscription and professional services and other revenue, the costs associated with third-party hosting facilities and the extent to which we expand our customer support and professional services organizations. Our gross margins are highest on our license revenue, followed by gross margins on our subscription and support revenue, and finally gross margins on professional services and other revenue.
Operating Expenses
We classify our operating expenses into three categories: research and development, sales and marketing, and general and administrative. For each category, the largest component is personnel costs, which include salaries and bonuses, employee benefits costs, stock-based compensation and, in the case of sales and marketing expenses, sales commissions. Operating expenses also include allocated overhead costs for facilities and IT, which include compensation of personnel and costs associated with our facilities and IT infrastructure.
Research and Development. Research and development expenses primarily consist of personnel costs and allocated overhead attributable to our research and development personnel. We have devoted our product development efforts primarily to enhancing the functionality and expanding the capabilities of our software platform. We intend to continue to make significant investments in research and development to enhance and further develop our platform. As a result, we expect our research and development expenses to continue to increase in absolute dollar amounts for the foreseeable future.
Sales and Marketing. Sales and marketing expenses primarily consist of personnel costs and allocated overhead for our sales, marketing and business development personnel, commissions earned by our sales personnel, and the cost of marketing and business development programs. We intend to continue to make significant investments in sales and marketing to drive additional revenue and grow our global customer base. As a result, we expect our sales and marketing expenses to increase in absolute dollar amounts and to continue to be our largest operating expenses category as we grow our global customer base and expand our geographic coverage.
General and Administrative. General and administrative expenses primarily consist of personnel costs and allocated overhead for our executive and administrative personnel, legal, accounting and other professional services fees, and other corporate expenses. We have recently incurred, and expect to continue to incur, additional general and administrative expenses to support the growth of our operations and to operate as a public company. As a result, we expect our general and administrative expenses to increase in absolute dollar amounts for the foreseeable future.
Other Expense, Net
Other expense, net consists primarily of the changes in the fair value of common stock warrants, foreign currency exchange gains or losses, interest expense on outstanding debt and interest income earned on our cash and cash equivalents balances.
50
Provision for Income Taxes
Provision for income taxes is based on the amount of taxable earnings and enacted federal, state and foreign tax rates and is adjusted for allowable credits and deductions. Our provision for income taxes currently consists mainly of foreign taxes.
Because of our history of U.S. net operating losses, we have established a full valuation allowance against potential future benefits for our U.S. deferred tax assets. Our income tax provision could be significantly impacted by estimates surrounding our uncertain tax positions and changes to our valuation allowance in future periods. We reevaluate the judgments surrounding our estimates and make adjustments as appropriate each reporting period. See Note 7 of our audited consolidated financial statements appearing elsewhere in this Annual Report on Form 10-K for more information concerning our provision for income taxes.
Results of Operations
The following tables set forth our results of operations for the periods presented and as a percentage of our total revenue for those periods. The period-to-period comparison of financial results are not necessarily indicative of financial results to be achieved in future periods.
Fiscal Year Ended July 31, | ||||||||||||
2016 | 2015 | 2014 | ||||||||||
(in thousands) | ||||||||||||
Consolidated Statement of Operations Data: | ||||||||||||
Revenue | ||||||||||||
License | $ | 32,345 | $ | 20,757 | $ | 11,411 | ||||||
Subscription | 29,161 | 21,715 | 14,738 | |||||||||
Support | 13,775 | 9,150 | 5,499 | |||||||||
Professional services and other | 16,746 | 16,985 | 21,054 | |||||||||
Total revenue | 92,027 | 68,607 | 52,702 | |||||||||
Cost of revenue | ||||||||||||
License | 521 | 514 | 366 | |||||||||
Subscription and support(1) | 12,469 | 11,062 | 11,911 | |||||||||
Professional services and other(1) | 14,535 | 13,415 | 15,431 | |||||||||
Total cost of revenue | 27,525 | 24,991 | 27,708 | |||||||||
Gross profit | 64,502 | 43,616 | 24,994 | |||||||||
Operating expenses | ||||||||||||
Research and development(1) | 37,795 | 30,387 | 22,273 | |||||||||
Sales and marketing(1) | 50,178 | 49,250 | 47,029 | |||||||||
General and administrative(1) | 17,436 | 13,453 | 14,415 | |||||||||
Total operating expenses | 105,409 | 93,090 | 83,717 | |||||||||
Operating loss | (40,907 | ) | (49,474 | ) | (58,723 | ) | ||||||
Other expense, net | (390 | ) | (452 | ) | (1,678 | ) | ||||||
Loss before income taxes | (41,297 | ) | (49,926 | ) | (60,401 | ) | ||||||
Provision for income taxes | 215 | 427 | 392 | |||||||||
Net loss | $ | (41,512 | ) | $ | (50,353 | ) | $ | (60,793 | ) | |||
(1) | Includes stock-based compensation expense as follows: |
51
Fiscal Year Ended July 31, | ||||||||||||
2016 | 2015 | 2014 | ||||||||||
(in thousands) | ||||||||||||
Cost of subscription and support revenue | $ | 147 | $ | 44 | $ | 24 | ||||||
Cost of professional services and other revenue | 520 | 223 | 133 | |||||||||
Research and development | 3,592 | 1,195 | 490 | |||||||||
Sales and marketing | 1,808 | 777 | 1,090 | |||||||||
General and administrative | 2,321 | 1,212 | 989 | |||||||||
Total stock-based compensation expense | $ | 8,388 | $ | 3,451 | $ | 2,726 | ||||||
Fiscal Year Ended July 31, | |||||||||
2016 | 2015 | 2014 | |||||||
(as a percentage of total revenue) | |||||||||
Consolidated Statement of Operations Data: | |||||||||
Revenue | |||||||||
License | 35.1 | % | 30.3 | % | 21.7 | % | |||
Subscription | 31.7 | 31.7 | 28.0 | ||||||
Support | 15.0 | 13.3 | 10.4 | ||||||
Professional services and other | 18.2 | 24.7 | 39.9 | ||||||
Total revenue | 100.0 | 100.0 | 100.0 | ||||||
Cost of revenue | |||||||||
License | 0.6 | 0.7 | 0.7 | ||||||
Subscription and support | 13.5 | 16.1 | 22.6 | ||||||
Professional services and other | 15.8 | 19.6 | 29.3 | ||||||
Total cost of revenue | 29.9 | 36.4 | 52.6 | ||||||
Gross profit | 70.1 | 63.6 | 47.4 | ||||||
Operating expenses | |||||||||
Research and development | 41.1 | 44.3 | 42.3 | ||||||
Sales and marketing | 54.5 | 71.8 | 89.2 | ||||||
General and administrative | 18.9 | 19.6 | 27.4 | ||||||
Total operating expenses | 114.5 | 135.7 | 158.9 | ||||||
Operating loss | (44.5 | ) | (72.1 | ) | (111.5 | ) | |||
Other expense, net | (0.4 | ) | (0.7 | ) | (3.2 | ) | |||
Loss before income taxes | (44.9 | ) | (72.8 | ) | (114.7 | ) | |||
Provision for income taxes | 0.2 | 0.6 | 0.7 | ||||||
Net loss | (45.1 | )% | (73.4 | )% | (115.4 | )% | |||
52
Fiscal 2016, 2015 and 2014
Revenue
Fiscal Year Ended July 31, | 2016 to 2015 % Change | 2015 to 2014 % Change | ||||||||||||||
2016 | 2015 | 2014 | ||||||||||||||
(dollar amounts in thousands) | ||||||||||||||||
Revenue | ||||||||||||||||
License | $ | 32,345 | $ | 20,757 | $ | 11,411 | 55.8% | 81.9% | ||||||||
Subscription | 29,161 | 21,715 | 14,738 | 34.3% | 47.3% | |||||||||||
Support | 13,775 | 9,150 | 5,499 | 50.5% | 66.4% | |||||||||||
Professional services and other | 16,746 | 16,985 | 21,054 | (1.4)% | (19.3)% | |||||||||||
Total revenue | $ | 92,027 | $ | 68,607 | $ | 52,702 | 34.1% | 30.2% | ||||||||
Percentage of revenue | ||||||||||||||||
License | 35.1 | % | 30.3 | % | 21.7 | % | ||||||||||
Subscription | 31.7 | % | 31.7 | % | 28.0 | % | ||||||||||
Support | 15.0 | % | 13.3 | % | 10.4 | % | ||||||||||
Professional services and other | 18.2 | % | 24.7 | % | 39.9 | % | ||||||||||
Total | 100.0 | % | 100.0 | % | 100.0 | % | ||||||||||
Fiscal 2016 Compared to Fiscal 2015. Total revenue increased $23.4 million, or 34%, in fiscal 2016 compared to fiscal 2015, due to an increase in license revenue of $11.6 million, or 56%, an increase in subscription revenue of $7.4 million, or 34%, and an increase in support revenue of $4.6 million, or 51%, partially offset by a decrease in professional services and other revenue of $0.2 million, or 1%. The increase in license revenue in fiscal 2016 compared to fiscal 2015 was primarily due to the growth in on-premise deployments that resulted in an increase in perpetual licenses. The increase in subscription revenue in fiscal 2016 compared to fiscal 2015 was driven primarily by growth in the number of customers adopting our cloud-based solution. The increase in support revenue in fiscal 2016 compared to fiscal 2015 was primarily a result of an increase in the installed base of on-premises software licenses that increased our recurring software support fees paid by those customers. The decrease in professional services and other revenue was primarily due to customers' increased use of professional services provided by our channel partners and other third parties. In 2015, we started to refer professional services opportunities to our partners which has contributed to the above mentioned decrease. In fiscal 2016, we also experienced a decrease in the proportion of our total revenue that we derived from customers located outside the United States, falling from 38% in fiscal 2015 to 36% in fiscal 2016.
Fiscal 2015 Compared to Fiscal 2014. Total revenue increased $15.9 million, or 30%, in fiscal 2015 compared to fiscal 2014, due to an increase in license revenue of $9.3 million, or 82%, an increase in subscription revenue of $7.0 million, or 47%, and an increase in support revenue of $3.7 million, or 66%, partially offset by a decrease in professional services and other revenue of $4.1 million, or 19%. The increase in license revenue in fiscal 2015 compared to fiscal 2014 was primarily due to the growth in on-premise deployments that resulted in an increase in perpetual licenses. The increase in subscription revenue in fiscal 2015 compared to fiscal 2014 was driven primarily by growth in the number of customers adopting our cloud-based solution. The increase in support revenue in fiscal 2015 compared to fiscal 2014 was primarily a result of on-premises software licenses that increased our cumulative installed base of customers that pay recurring software support fees.
53
Cost of Revenue and Gross Margin
Fiscal Year Ended July 31, | 2016 to 2015 % Change | 2015 to 2014 % Change | ||||||||||||||
2016 | 2015 | 2014 | ||||||||||||||
(dollar amounts in thousands) | ||||||||||||||||
Cost of revenue | ||||||||||||||||
License | $ | 521 | $ | 514 | $ | 366 | 1.4% | 40.4% | ||||||||
Subscription and support | 12,469 | 11,062 | 11,911 | 12.7% | (7.1)% | |||||||||||
Professional services and other | 14,535 | 13,415 | 15,431 | 8.3% | (13.1)% | |||||||||||
Total cost of revenue | $ | 27,525 | $ | 24,991 | $ | 27,708 | 10.1% | (9.8)% | ||||||||
Gross margin | ||||||||||||||||
License | 98.4 | % | 97.5 | % | 96.8 | % | ||||||||||
Subscription and support | 71.0 | % | 64.2 | % | 41.1 | % | ||||||||||
Professional services and other | 13.2 | % | 21.0 | % | 26.7 | % | ||||||||||
Total gross margin | 70.1 | % | 63.6 | % | 47.4 | % | ||||||||||
Fiscal 2016 Compared to Fiscal 2015. Total cost of revenue increased by $2.5 million, or 10.1%, in fiscal 2016 compared to fiscal 2015, primarily due to an increase in cost of subscription and support revenue of $1.4 million, or 12.7%, and an increase in cost of professional services and other revenue of $1.1 million, or 8.3%. The increase in cost of subscription and support revenue primarily reflected a $1.0 million increase in third-party hosting costs, and a $0.4 million increase in salaries and benefits costs. The increase in cost of professional services and other revenue was driven by a $0.9 million increase in salaries and benefits costs and stock-based compensation, and a $0.4 million increase in travel expense. This was partially offset by a $0.1 million reduction in third party consulting fees.
Total gross margin increased in fiscal 2016 compared to fiscal 2015 due to a favorable shift in revenue mix as a result of higher license and subscription and support revenues due to an increase in our customer base. More specifically, our license and subscription and support revenue accounted for 82% of our total revenue in fiscal 2016, compared to 75% of our total revenue in fiscal 2015. This increase in total gross margin also reflected increased efficiencies in our customer support organization and substantial completion of customer migration to our current digital platform, resulting in a significant increase in our subscription and support gross margin. This increase was partially offset by a decline in gross margin on our professional services and other revenue due to investments in hiring and training that were made in fiscal 2016 and a year on year decline in average hourly rate.
Fiscal 2015 Compared to Fiscal 2014. Total cost of revenue decreased by $2.7 million, or 10%, in fiscal 2015 compared to fiscal 2014, primarily due to a decrease in cost of professional services and other revenue of $2.0 million, or 13%, and a decrease in cost of subscription and support revenue of $0.8 million, or 7%. The decrease in cost of professional services and other revenue was driven by reduced professional services revenues, primarily reflected in a $1.6 million decrease in third-party consulting fees and a $0.4 million decrease in salaries and benefits costs and stock-based compensation. The decrease in cost of subscription and support revenue primarily reflected a $1.1 million decrease in salaries and benefits costs and stock-based compensation, partially offset by an increase of $0.3 million related to third-party hosting and consulting costs.
Total gross margin increased in fiscal 2015 compared to fiscal 2014 due to a favorable shift in the revenue mix as a result of higher license and subscription and support revenues due to an increase in our customer base. More specifically, our license and subscription and support revenue accounted for 75% of our total revenue in fiscal 2015, compared to 60% of our total revenue in fiscal 2014. This increase in total gross margin also reflected increased efficiencies in our customer support organization and substantial completion of customer migration to our current digital platform, resulting in a significant increase in our subscription and support gross margin. This increase was partially offset by a decline in gross margin realized on our professional services and other revenue due to a decrease in AT&T professional services and other revenue we recognized from AT&T in fiscal 2015 as compared to fiscal 2014.
54
Operating Expenses
Fiscal Year Ended July 31, | 2016 to 2015 % Change | 2015 to 2014 % Change | ||||||||||||||
2016 | 2015 | 2014 | ||||||||||||||
(dollar amounts in thousands) | ||||||||||||||||
Operating expenses | ||||||||||||||||
Research and development | $ | 37,795 | $ | 30,387 | $ | 22,273 | 24.4% | 36.4% | ||||||||
Sales and marketing | 50,178 | 49,250 | 47,029 | 1.9% | 4.7% | |||||||||||
General and administrative | 17,436 | 13,453 | 14,415 | 29.6% | (6.7)% | |||||||||||
Total operating expenses | $ | 105,409 | $ | 93,090 | $ | 83,717 | 13.2% | 11.2% | ||||||||
Percentage of revenue | ||||||||||||||||
Research and development | 41.1 | % | 44.3 | % | 42.3 | % | ||||||||||
Sales and marketing | 54.5 | % | 71.8 | % | 89.2 | % | ||||||||||
General and administrative | 18.9 | % | 19.6 | % | 27.4 | % | ||||||||||
Total operating expenses | 114.5 | % | 135.7 | % | 158.9 | % | ||||||||||
Research and Development Expense
Fiscal 2016 Compared to Fiscal 2015. Research and development expense increased $7.4 million, or 24%, in fiscal 2016 compared to fiscal 2015, primarily due to a $6.2 million increase in salaries and benefits expense and stock-based compensation as we increased engineering headcount in the United States to support ongoing development and enhancement of our product offerings. In addition, professional services and engineering infrastructure expense increased by $0.7 million, software and equipment expense increased by $0.4 million, and travel related expenses increased by $0.1 million.
Fiscal 2015 Compared to Fiscal 2014. Research and development expense increased $8.1 million, or 36%, in fiscal 2015 compared to fiscal 2014, primarily due to a $7.5 million increase in salaries and benefits expense and stock-based compensation as we increased engineering headcount to support ongoing development and enhancement of our product offerings, as well as a $0.4 million increase in allocated overhead costs for facilities and IT, and a $0.2 million increase in engineering services and consulting costs.
Sales and Marketing Expense
Fiscal 2016 Compared to Fiscal 2015. Sales and marketing expense increased $0.9 million, or 2%, in fiscal 2016 compared to fiscal 2015, primarily due to a $1.0 million increase in salaries and benefits expense and stock-based compensation expense. The increased expenses in fiscal 2016 also reflected an increase in marketing related expenditures of $0.5 million as we expanded customer programs and lead generation activities. The increase in sales and marketing expense was partially offset by a $0.3 million decrease in hiring and training and other professional service expenses, and a $0.3 million overall reduction in other operating expenses.
Fiscal 2015 Compared to Fiscal 2014. Sales and marketing expense increased $2.2 million, or 5%, in fiscal 2015 compared to fiscal 2014, primarily due to a $2.8 million increase in salaries and benefits expense related to merit increases, bonuses, commissions and stock-based compensation expense. The increased expenses in fiscal 2015 also reflected an increase in marketing related expenditures of $0.9 million as we expanded customer programs and lead generation activities. The increase in sales and marketing expense was partially offset by a $0.8 million decrease in costs for developer and lead generation program, a $0.3 million decrease in allocated overhead costs for facilities and IT due to a decrease in headcount, and a $0.3 million decrease in hiring and training expenses.
General and Administrative Expense
Fiscal 2016 Compared to Fiscal 2015. General and administrative expense increased $4.0 million, or 30%, in fiscal 2016 compared to fiscal 2015, primarily due to a $2.3 million increase in salaries and benefits and stock-based compensation expense, a $0.8 million increase in corporate charges, a $0.6 million increase in professional services primarily related to legal and accounting activities, a $0.1 million increase in travel expense, and a $0.1 million increase in software and equipment expense.
55
Fiscal 2015 Compared to Fiscal 2014. General and administrative expense decreased $1.0 million, or 7%, in fiscal 2015 compared to fiscal 2014, primarily due to a $1.4 million decrease in corporate charges, a $0.6 million decrease in professional services primarily related to legal activities, and a $0.3 million decrease in hiring and training expenses. These decreases were partially offset by a $1.0 million increase in salaries and benefits expense related to merit increases, bonuses and stock-based compensation expense, and a $0.3 million increase in facility-related expenses.
Other Expense, Net
Fiscal Year Ended July 31, | 2016 to 2015 % Change | 2015 to 2014 % Change | ||||||||||||||
2016 | 2015 | 2014 | ||||||||||||||
(dollar amounts in thousands) | ||||||||||||||||
Other expense, net | $ | (390 | ) | $ | (452 | ) | $ | (1,678 | ) | 13.7% | 73.1% | |||||
Percentage of revenue | ||||||||||||||||
Other expense, net | (0.4 | )% | (0.7 | )% | (3.2 | )% | ||||||||||
Fiscal 2016 Compared to Fiscal 2015. Other expense, net decreased by $0.1 million primarily due to lower foreign exchange losses in fiscal 2016.
Fiscal 2015 Compared to Fiscal 2014. Other expense, net decreased by $1.2 million primarily due to $1.6 million of expense associated with the revaluation of common stock warrants in fiscal 2014 as well as foreign exchange gains and losses.
Provision for Income Taxes
Fiscal Year Ended July 31, | 2016 to 2015 % Change | 2015 to 2014 % Change | ||||||||||||||
2016 | 2015 | 2014 | ||||||||||||||
(dollar amounts in thousands) | ||||||||||||||||
Provision for income taxes | $ | 215 | $ | 427 | $ | 392 | (49.6)% | 8.9% | ||||||||
Percentage of revenue | ||||||||||||||||
Provision for income taxes | 0.2 | % | 0.6 | % | 0.7 | % | ||||||||||
In each of fiscal 2016, fiscal 2015 and fiscal 2014, we recorded income taxes that were principally attributable to foreign taxes.
Certain Key Non-GAAP Financial Metrics and Key Performance Metrics
To supplement our financial results presented on a GAAP basis, we provide readers of this annual report with certain performance measures, including gross billings, and certain non-GAAP financial measures, including non-GAAP gross profit, non-GAAP gross margin, and non-GAAP operating loss, which we use in analyzing and assessing our overall business performance, for making operating decisions and for forecasting and planning future periods. We consider the use of non-GAAP financial measures and key performance measures helpful in assessing our current financial performance and ongoing operations
There are limitations in using non-GAAP financial measures and key performance measures because the non-GAAP financial measures and performance measures are not prepared in accordance with GAAP, may be different from non-GAAP financial measures and key performance measures used by other companies, and exclude expenses that may have a material impact on our reported financial results. Further, stock-based compensation expense has been and will continue to be for the foreseeable future a significant recurring expense in our business and an important part of the compensation provided to our employees. The presentation of non-GAAP financial information and key performance measures is not meant to be considered in isolation or as a substitute for the directly comparable financial measures prepared in accordance with GAAP. We urge readers of this annual report to review the reconciliation of our non-GAAP financial measures and key performance measures to the comparable GAAP financial measures included below, and not to rely on any single financial measure to evaluate our business.
56
Gross Billings. Gross billings is a key performance metric which we define as our total revenue plus the change in our deferred revenue in a period. Gross billings in any period consists of sales to new customers plus renewals by and additional sales to existing customers. Our management uses gross billings as a performance measure because we generally bill our customers at the time of sale of our solutions and recognize revenue either upon delivery or ratably over subsequent periods, and a portion of our revenue may be recognized over a period of more than 12 months. We believe that gross billings provides valuable insight into the sales of our solutions and the performance of our business. We do not consider gross billings as a substitute for revenue recognition or revenue measurement.
Non-GAAP Gross Profit and Gross Margin. We define non-GAAP gross profit as our total revenue less our total cost of revenue, adjusted to exclude stock-based compensation associated with equity awards granted to subscription, support, and professional services personnel and amortization of acquired intangible assets. We define non-GAAP gross margin as our non-GAAP gross profit as a percentage of our total revenue. Non-GAAP gross profit and gross margin are key measures used by our management to understand and evaluate our operating performance and trends. In particular, non-GAAP gross profit and gross margin exclude certain non-cash expenses and can provide useful measures for period-to-period comparisons of our business.
Non-GAAP Operating Loss. We define non-GAAP operating loss as our operating loss excluding stock-based compensation expense and amortization of acquired intangibles assets. Our management uses non-GAAP operating loss to understand and evaluate our operating performance and trends. In particular, non-GAAP operating loss excludes certain non-cash expenses and can provide useful measures for period-to-period comparisons of our business.
The following table summarizes certain of our key non-GAAP financial metrics and key performance metrics:
Fiscal Year Ended July 31, | ||||||||||||
2016 | 2015 | 2014 | ||||||||||
(dollar amounts in thousands) | ||||||||||||
Gross billings | $ | 105,114 | $ | 81,219 | $ | 63,768 | ||||||
Non-GAAP gross profit | 66,092 | 44,791 | $ | 25,763 | ||||||||
Non-GAAP gross margin | 71.8 | % | 65.3 | % | 48.9 | % | ||||||
Non-GAAP operating loss | $ | (31,484 | ) | $ | (44,881 | ) | $ | (55,117 | ) | |||
57
The following table reflects the reconciliation of the most directly comparable GAAP financial measure to each of the non-GAAP financial measures and key performance metrics discussed above:
Fiscal Year Ended July 31, | ||||||||||||
2016 | 2015 | 2014 | ||||||||||
(in thousands) | ||||||||||||
Gross billings: | ||||||||||||
Total revenue | $ | 92,027 | $ | 68,607 | $ | 52,702 | ||||||
Total deferred revenue, end of period | 53,889 | 40,802 | 28,190 | |||||||||
Less: Total deferred revenue, beginning of period | (40,802 | ) | (28,190 | ) | (17,124 | ) | ||||||
Total change in deferred revenue | 13,087 | 12,612 | 11,066 | |||||||||
Gross billings | $ | 105,114 | $ | 81,219 | $ | 63,768 | ||||||
Non-GAAP gross profit: | ||||||||||||
Gross profit | 64,502 | 43,616 | $ | 24,994 | ||||||||
Add: Stock-based compensation expense | 667 | 267 | 157 | |||||||||
Add: Amortization of intangible assets | 923 | 908 | 612 | |||||||||
Non-GAAP gross profit | $ | 66,092 | $ | 44,791 | $ | 25,763 | ||||||
Non-GAAP gross margin: | ||||||||||||
Gross margin | 70.1 | % | 63.6 | % | 47.4 | % | ||||||
Add: Stock-based compensation expense | 0.7 | % | 0.4 | % | 0.3 | |||||||
Add: Amortization of intangible assets | 1.0 | % | 1.3 | % | 1.2 | |||||||
Non-GAAP gross margin | 71.8 | % | 65.3 | % | 48.9 | % | ||||||
Non-GAAP operating loss: | ||||||||||||
Operating loss | $ | (40,907 | ) | $ | (49,474 | ) | $ | (58,723 | ) | |||
Add: Stock-based compensation expense | 8,388 | 3,451 | 2,726 | |||||||||
Add: Amortization of intangible assets | 1,035 | 1,142 | 880 | |||||||||
Non-GAAP operating loss | $ | (31,484 | ) | $ | (44,881 | ) | $ | (55,117 | ) | |||
58
Quarterly Results of Operations
The following tables set forth selected unaudited quarterly statements of operations data for the eight fiscal quarters ended July 31, 2016, as well as the percentage that each line item represents of total revenue. The information for each of these quarters has been prepared on the same basis as the audited annual financial statements included elsewhere in this annual report and, in the opinion of management, includes all adjustments, which includes only normal recurring adjustments, necessary for the fair statement of the results of operations for these periods. This data should be read in conjunction with our audited consolidated financial statements and related notes included elsewhere in this annual report. These quarterly operating results are not necessarily indicative of our operating results for a full year or any future period.
Three Months Ended | ||||||||||||||||||||||||||||||||
July 31, 2016 | April 30, 2016 | Jan 31, 2016 | Oct 31, 2015 | July 31, 2015 | April 30, 2015 | Jan 31, 2015 | Oct 31, 2014 | |||||||||||||||||||||||||
Consolidated Statement of Operations Data: | ||||||||||||||||||||||||||||||||
Revenue | ||||||||||||||||||||||||||||||||
License | $ | 8,581 | $ | 8,161 | $ | 8,763 | $ | 6,840 | $ | 5,538 | $ | 5,697 | $ | 5,106 | $ | 4,416 | ||||||||||||||||
Subscription | 7,730 | 6,967 | 7,638 | 6,826 | 6,353 | 5,368 | 5,447 | 4,547 | ||||||||||||||||||||||||
Support | 3,875 | 3,485 | 3,339 | 3,076 | 2,654 | 2,326 | 2,224 | 1,946 | ||||||||||||||||||||||||
Professional services and other | 4,930 | 4,864 | 3,149 | 3,803 | 4,157 | 3,899 | 4,231 | 4,698 | ||||||||||||||||||||||||
Total revenue | 25,116 | 23,477 | 22,889 | 20,545 | 18,702 | 17,290 | 17,008 | 15,607 | ||||||||||||||||||||||||
Cost of revenue | ||||||||||||||||||||||||||||||||
License | 136 | 128 | 129 | 128 | 128 | 129 | 128 | 129 | ||||||||||||||||||||||||
Subscription and support(1) | 3,168 | 3,077 | 3,141 | 3,083 | 2,887 | 2,808 | 2,929 | 2,438 | ||||||||||||||||||||||||
Professional services and other(1) | 4,007 | 3,879 | 3,396 | 3,253 | 3,268 | 3,103 | 3,324 | 3,720 | ||||||||||||||||||||||||
Total cost of revenue | 7,311 | 7,084 | 6,666 | 6,464 | 6,283 | 6,040 | 6,381 | 6,287 | ||||||||||||||||||||||||
Gross profit | 17,805 | 16,393 | 16,223 | 14,081 | 12,419 | 11,250 | 10,627 | 9,320 | ||||||||||||||||||||||||
Operating expenses | ||||||||||||||||||||||||||||||||
Research and development(1) | 10,281 | 9,477 | 8,913 | 9,124 | 8,435 | 7,567 | 7,062 | 7,323 | ||||||||||||||||||||||||
Sales and marketing(1) | 12,166 | 12,702 | 11,761 | 13,549 | 12,937 | 11,139 | 11,214 | 13,960 | ||||||||||||||||||||||||
General and administrative(1) | 4,963 | 4,075 | 4,212 | 4,186 | 3,450 | 3,299 | 3,125 | 3,579 | ||||||||||||||||||||||||
Total operating expenses | 27,410 | 26,254 | 24,886 | 26,859 | 24,822 | 22,005 | 21,401 | 24,862 | ||||||||||||||||||||||||
Operating loss | (9,605 | ) | (9,861 | ) | (8,663 | ) | (12,778 | ) | (12,403 | ) | (10,755 | ) | (10,774 | ) | (15,542 | ) | ||||||||||||||||
Other income (expense), net | 11 | 19 | (227 | ) | (194 | ) | (69 | ) | (93 | ) | (183 | ) | (107 | ) | ||||||||||||||||||
Loss before income taxes | (9,594 | ) | (9,842 | ) | (8,890 | ) | (12,972 | ) | (12,472 | ) | (10,848 | ) | (10,957 | ) | (15,649 | ) | ||||||||||||||||
Provision for income taxes | (65 | ) | 73 | 128 | 79 | 84 | 140 | 92 | 111 | |||||||||||||||||||||||
Net loss | $ | (9,529 | ) | $ | (9,915 | ) | $ | (9,018 | ) | $ | (13,051 | ) | $ | (12,556 | ) | $ | (10,988 | ) | $ | (11,049 | ) | $ | (15,760 | ) | ||||||||
(1) | Includes stock-based compensation expense as follows: |
59
Three Months Ended | |||||||||||||||||||||||||||||||||
July 31, 2016 | April 30, 2016 | Jan 31, 2016 | Oct 31, 2015 | July 31, 2015 | April 30, 2015 | Jan 31, 2015 | Oct 31, 2014 | ||||||||||||||||||||||||||
Cost of subscription and support revenue | $ | 33 | $ | 43 | $ | 41 | $ | 30 | $ | 23 | $ | 8 | $ | 8 | $ | 5 | |||||||||||||||||
Cost of professional services and other revenue | 192 | 132 | 101 | 95 | 78 | 54 | 48 | 43 | |||||||||||||||||||||||||
Research and development | 1,457 | 897 | 671 | 567 | 436 | 306 | 257 | 196 | |||||||||||||||||||||||||
Sales and marketing | 583 | 426 | 463 | 336 | 285 | 173 | 188 | 131 | |||||||||||||||||||||||||
General and administrative | 745 | 612 | 510 | 454 | 360 | 281 | 349 | 222 | |||||||||||||||||||||||||
Total stock-based compensation expense | $ | 3,010 | $ | 2,110 | $ | 1,786 | $ | 1,482 | $ | 1,182 | $ | 822 | $ | 850 | $ | 597 | |||||||||||||||||
Liquidity and Capital Resources
As of July 31, | ||||||||||||
2016 | 2015 | 2014 | ||||||||||
(in thousands) | ||||||||||||
Cash and cash equivalents | $ | 68,303 | $ | 89,562 | $ | 51,759 | ||||||
Fiscal Year Ended July 31, | ||||||||||||
2016 | 2015 | 2014 | ||||||||||
(in thousands) | ||||||||||||
Cash used in operating activities | $ | (21,695 | ) | $ | (37,367 | ) | $ | (50,267 | ) | |||
Cash used in investing activities | (241 | ) | (966 | ) | (2,086 | ) | ||||||
Cash provided by financing activities | 677 | 76,136 | 59,869 | |||||||||
Net increase (decrease) in cash and cash equivalents | $ | (21,259 | ) | $ | 37,803 | $ | 7,516 | |||||
Since our inception, we have funded our operations primarily through sales of equity securities and credit facilities. We believe that our existing cash and cash equivalents will be sufficient to meet our anticipated cash needs for at least the next 12 months. Our future capital requirements will depend on many factors, including our growth rate, our needs for increased data center capacity to support our expanding customer base, the timing and extent of spending to support development efforts, the expansion of sales and marketing activities, the introduction of new and enhanced software and services offerings, and the continuing market acceptance of our solutions. In the event that additional financing is required from outside sources, we may not be able to raise it on terms acceptable to us, if at all. If we are unable to raise additional capital when desired, our business, operating results and financial condition would be adversely affected.
Operating Activities
For fiscal 2016, we used $21.7 million of cash in our operating activities, which reflects our net loss of $41.5 million, adjusted by non-cash charges of $10.8 million consisting primarily of $8.4 million for stock-based compensation, and $2.4 million for depreciation and amortization. Cash inflows were from changes in our working capital, including a $13.1 million increase in deferred revenue due to increased subscription and support sales in fiscal 2016, a $1.0 million increase in accrued expenses and other liabilities, and a $0.8 million increase in prepaid expenses and other assets, which were partially offset by a $4.5 million increase in accounts receivable associated with increased sales, and a $1.4 million decrease in accounts payable.
For fiscal 2015, we used $37.4 million of cash in our operating activities, which reflects our net loss of $50.4 million, adjusted by non-cash charges of $6.0 million consisting primarily of $3.5 million for stock-based compensation, and $2.4 million for depreciation and amortization. Cash inflows were from changes in our working capital, including a $12.6 million
60
increase in deferred revenue due to increased subscription and support sales in fiscal 2015, and $2.2 million increase in accrued expenses and other liabilities, which were partially offset by a $5.1 million increase in accounts receivable associated with increased sales, a $1.7 million increase in prepaid expenses and other assets, and a $1.0 decrease in accounts payable.
For fiscal 2014, we used $50.3 million of cash in our operating activities, which reflects our net loss of $60.8 million, adjusted by non-cash charges of $6.6 million consisting primarily of $2.7 million for stock-based compensation, $2.1 million for depreciation and amortization and $1.6 million associated with changes in fair value of our common stock warrants. Cash inflows were from changes in our working capital, including an $11.0 million increase in deferred revenue, and $3.7 million increase in accounts payable, accrued expenses and other liabilities, which were partially offset by a $9.7 million increase in accounts receivable associated with increased sales and a $1.2 million increase in prepaid expenses and other assets.
Investing Activities
During fiscal 2016, cash used in investing activities of $0.2 million was primarily attributable to capital expenditures for technology and software support for growth of the business.
During fiscal 2015, cash used in investing activities of $1.0 million was primarily attributable to capital expenditures for technology and software to support the growth of our business, as well as leasehold improvements for our UK facility.
During fiscal 2014, cash used in investing activities of $2.1 million was primarily attributable to capital expenditures of $2.5 million for technology and software to support the growth of our business, as well as leasehold improvements for our corporate headquarters, partially offset by $0.4 million of net cash acquired as part of our acquisition of InsightsOne.
Financing Activities
During fiscal 2016, cash provided by financing activities of $0.7 million was primarily due to proceeds of $2.6 million from issuance of debt, net of issuance costs, proceeds from our Employee Stock Purchase Plan of $2.1 million and $1.2 million in proceeds from exercise of common stock options, net of taxes paid. These were partially offset by repayments of $4.5 million on our outstanding debt obligations and taxes remitted on vested RSU awards of $0.5 million.
During fiscal 2015, cash provided by financing activities of $76.1 million was primarily due to $77.1 million proceeds from our initial public offering, net of offering costs, $4.0 million proceeds from issuance of debt, net of issuance costs, and $0.4 million proceeds from exercise of common stock options, net of taxes paid related to net share settlement of equity awards. This was partially offset by $5.4 million of repayments on our outstanding debt obligations.
During fiscal 2014, cash provided by financing activities of $59.9 million was primarily due to $59.9 million proceeds from the issuance of convertible preferred stock and $6.5 million of proceeds from the issuance of debt, each net of issuance costs, as well as $0.5 million of proceeds from exercise of common stock options. This was partially offset by $7.0 million of repayments on our outstanding debt obligations.
Long-term Debt
In May 2012, we entered into a Loan and Security Agreement with Silicon Valley Bank (“SVB”), which was amended and restated in November 2014 and further amended on March 2, 2016 and May 23, 2016 (the “Loan Agreement”). As amended, the Loan Agreement provides us with the ability to borrow up to $25.0 million through a revolving line of credit, $7.5 million of which can be advanced at any time during the draw period and $17.5 million of which is subject to an accounts receivable borrowing base. We can draw upon the revolving line of credit through October 31, 2019, when all outstanding principal and accrued and unpaid interest becomes due and payable, and the revolving loans bear interest at a rate equal to the Prime Rate (as defined in the Loan Agreement the “Prime Rate”) plus 0.5% per annum (equal to 4.0% at July 31, 2016), payable monthly in arrears. Outstanding revolving loans subject to the accounts receivable borrowing base are limited to the lesser of (a) $17.5 million or (b) 80% of the balance of certain eligible customer accounts receivable plus the greater of $6.0 million or 30% of eligible foreign accounts receivable. As of July 31, 2016, we had not drawn on the revolving line of credit. Pursuant to the March 2, 2016 amendment, we also procured a supplemental term loan of $2.65 million, which refinanced, replaced and superseded our pre-existing term loan and equipment term loan in their entirety, and paid off the $156,250 end-of-term payment on the outstanding portion of the term loan. We will repay the outstanding principal of the supplemental term loan in monthly installments, plus interest at a rate equal to the Prime Rate plus 0.25% per annum (equal to 3.75% at July 31, 2016), with the last payment due in March 2018. So long as we are not in default, we are permitted to prepay the supplemental term loan in full without premium or penalty.
61
In connection with the original Loan Agreement, the Company issued SVB warrants (“SVB warrants”) to purchase 3,495, 26,315 and 39,473 shares of common stock during the years ended July 31, 2015, 2013 and 2012, respectively. On May 13, 2015, 65,788 warrant shares were net exercised on a cashless basis resulting in issuance of 57,082 common shares. As of both July 31, 2016 and July 31, 2015, 3,495 warrants with an exercise price of $13.68 to purchase shares of common stock remained outstanding and exercisable. The outstanding warrants expire in May 2022. There were no SVB warrants issued during the fiscal year ended July 31, 2016.
The Loan Agreement contains customary affirmative covenants and certain financial and negative covenants, including restrictions on disposing of assets, entering into change of control transactions, mergers or acquisitions, incurring additional indebtedness, granting liens on our assets and paying dividends. After the March 2, 2016 amendment, we are required to maintain a minimum adjusted quick ratio of 1.75:1 and a minimum total revenue of $74.75 million for the twelve months ending July 31, 2016. For fiscal quarters after July 31, 2016, the minimum total revenue we are required to maintain will be based on our annual plan for the next fiscal year using criteria consistent with the covenant for the twelve months ending July 31, 2016 (as approved by our board of directors). The minimum total revenue requirement for all future periods ending after July 31, 2016 will be subject to further adjustment by SVB. Stemming from noncompliance with a loan covenant at April 30, 2016, on May 23, 2016 we received a waiver of this requirement from SVB and amended the Loan Agreement to modify certain financial covenants. As of July 31, 2016 and 2015, we were in compliance with all loan covenants. We have pledged substantially all of our assets, other than our intellectual property, as collateral under the Loan Agreement.
The Loan Agreement contains customary events of default that include, among others, payment defaults, covenant defaults, bankruptcy defaults, cross-defaults to certain other obligations, judgment defaults and inaccuracy of representations and warranties. Upon the occurrence of an event of default, SVB may elect to declare all amounts outstanding under the Loan Agreement to be immediately due and payable and terminate all commitments to extend further credit. If we are unable to repay those amounts, SVB can proceed against the collateral granted to them to secure such indebtedness. In addition, the occurrence of an event of default will increase the applicable rate of interest by three percentage points for the applicable unpaid loan(s).
Contractual Payment Obligations
The following summarizes our contractual commitments and obligations as of July 31, 2016:
Payments Due by Period | ||||||||||||||||||||
Total | Less Than 1 Year | 1-3 Years | 3-5 Years | More Than 5 Years | ||||||||||||||||
(in thousands) | ||||||||||||||||||||
Contractual Obligations(1): | ||||||||||||||||||||
Debt obligations(2) | $ | 2,279 | $ | 1,384 | $ | 895 | $ | — | $ | — | ||||||||||
Purchase obligations(3) | 11,865 | 10,459 | 1,355 | 51 | — | |||||||||||||||
Operating lease obligations | 6,491 | 2,044 | 3,637 | 810 | — | |||||||||||||||
(1) | The table above excludes the liability for uncertain tax positions due to the uncertainty of when the related tax settlements will become due. |
(2) | Excludes future interest payments on debt obligations for which the timing and amounts are uncertain. Interest payments on debt obligations range from prime plus 0.25% per annum and prime plus 0.5% per annum for the supplemental term loan and the revolving line of credit |
(3) | Purchase commitments consist of agreements to purchase services, entered into in the ordinary course of business. These represent non-cancellable commitments for which a penalty would be imposed if the agreement was canceled for any reason other than an event of default as described by the agreement. |
Off-balance Sheet Arrangements
During fiscal 2016, 2015 and 2014, we did not have any relationships with unconsolidated organizations or financial partnerships, such as structured finance or special purpose entities that would have been established for the purpose of facilitating off-balance sheet arrangements or other contractually narrow or limited purposes.
62
Indemnification Arrangements
In the ordinary course of business, we enter into contractual arrangements under which we agree to provide indemnification of varying scope and terms to customers, business partners and other parties with respect to certain matters, including losses arising out of the breach of such agreements, intellectual property infringement claims made by third parties, and other liabilities with respect to our products and services and our business. In these circumstances, payment may be conditional on the other party making a claim pursuant to the procedures specified in the particular contract.
We include service level commitments to our cloud customers warranting certain levels of uptime reliability and performance and permitting those customers to receive credits in the event that we fail to meet those levels. To date, we have not incurred any material costs as a result of these commitments and we expect the time between any potential claims and issuance of the credits to be short. As a result, we have not accrued any liabilities related to these commitments in our consolidated financial statements.
In addition, we have indemnification agreements with our directors and certain of our executive officers that require us, among other things, to indemnify them against certain liabilities that may arise by reason of their status or service as directors or officers.
Critical Accounting Policies and Estimates
We prepare our consolidated financial statements in accordance with GAAP in the United States. The preparation of consolidated financial statements also requires us to make estimates and assumptions that affect the reported amounts of assets, liabilities, revenue, costs and expenses and related disclosures. We base our estimates on historical experience and on various other assumptions that we believe to be reasonable under the circumstances. Actual results could differ significantly from the estimates made by our management. To the extent that there are differences between our estimates and actual results, our future financial statement presentation, financial condition, results of operations and cash flows will be affected. We refer to accounting estimates of this type as critical accounting policies and estimates.
Revenue Recognition
We generate revenue from the sale of our software solutions to customers as a cloud service or on premises. For those customers that deploy our platform as a cloud service, we license our software on a subscription basis. For those customers that deploy our platform on premises, we offer two licensing options, a time-based license or a perpetual license. We also generate revenue from the sale of post-contract software support for on premises licenses including when and if available updates, and professional services such as consulting and training services.
We begin to recognize revenue when (1) persuasive evidence of an arrangement exists, (2) delivery has occurred or services have been provided, (3) the sales price is fixed and determinable and (4) collection of the related receivable is probable.
Signed agreements, including by electronic acceptance, are used as evidence of an arrangement. For our on premises solution, delivery is considered to occur when we provide the customer the ability to download the software. For our cloud service, delivery is considered to occur when subscription service is provisioned and made available to a customer. We assess whether a fee is fixed or determinable at the outset of the arrangement, primarily based on the payment terms associated with the sale. We assess collectability of the fee based on a number of factors such as collection history and creditworthiness of the customer. If we determine that collectability is not probable, revenue is deferred until collectability becomes probable, generally upon receipt of payment from the customer.
We typically enter into multiple-element arrangements with our customers in which a customer may purchase a combination of our software (offered on premises with software support or as a cloud service) and professional services. The software support and professional services are not considered essential to the functionality of the software. All of these elements are considered separate units of accounting. Typically, our agreements do not include rights for customers to cancel or terminate arrangements or to return software to obtain refunds.
We established vendor-specific objective evidence, or VSOE, of fair value for consulting days, training and software support, except for software support bundled with time-based licenses or subscriptions, based on a substantial majority of separate stand-alone sales of these elements, which have been priced within a reasonably narrow range. As a result, for multiple-element arrangements that include perpetual licenses, revenue is allocated to undelivered elements based on VSOE for software support or consulting days and training. Using the residual method, the difference between the total arrangement fee
63
and amount deferred for the undelivered elements is recognized upon delivery of the perpetual license if all other revenue recognition criteria are met. Revenue for software support for our on-premises perpetual and time-based software licenses is generally recognized ratably over the contractual term, which is typically one to three years. Software support is bundled with time-based licenses, and we use a consistent systematic and rational method to allocate between time-based license and support revenue for financial statement presentation purposes only.
We have not historically priced our cloud service within a narrow range and, therefore, cannot establish VSOE. We also believe that third-party evidence, or TPE, is not readily available for our cloud service as pricing is not readily accessible and there is no comparable product offering in the market. As a result, we use best estimate of selling price, or BESP, in order to allocate the selling price to cloud deliverables. We determined BESP considering multiple factors, including the price we charge for similar offerings, market conditions, competitive landscape, and pricing practices. For cloud services that include consulting days and training, we use BESP for cloud deliverables and VSOE for consulting days and training to allocate revenue into separate units of accounting. Revenue for our cloud services is generally recognized over the subscription period when all other revenue recognition criteria are met.
Revenue from our on-premises perpetual licenses is generally recognized upfront, assuming all revenue recognition criteria are satisfied. Revenue from our on premises time-based licenses is recognized ratably over the contractual term. Our on-premises licenses are included as a component of license revenue within our consolidated statements of comprehensive loss. Revenue from subscriptions to our cloud service and software support for our on-premises licenses is generally recognized ratably over the contract term and is included as a component of subscription and support revenue within our consolidated statements of comprehensive loss. Revenue related to professional services and training is recognized as delivered and is included as a component of professional services and other revenue within the consolidated statements of comprehensive loss.
Stock-based Compensation
Stock-based compensation is measured at the grant date based on the fair value of the award and is recognized as expense, net of estimated forfeitures, straight line over the requisite service period, which is generally the vesting period of the respective award.
Determining the fair value of stock-based awards at the grant date requires judgment. We use the Black-Scholes option pricing model to determine the fair value of stock-based awards. The determination of the grant-date fair value of options using an option pricing model is affected by a number of complex and subjective variables. These variables include the fair value of our common stock, the expected term of the awards, our expected stock price volatility, risk-free interest rates, and expected dividends, which are estimated as follows:
• | Fair Value of Our Common Stock. Since our IPO in April 2015, we have used the market closing price of our common stock as reported on the NASDAQ Global Select Market. Prior to our IPO, the fair value of the common stock underlying the stock-based awards was determined by our board of directors. |
• | Expected Term. The expected term represents the period that our stock-based awards are expected to be outstanding. As we do not have sufficient historical experience for determining the expected term of the awards granted, we have based our expected term on the simplified method. The simplified method calculates the expected term as the average of the time-to-vesting and the contractual life of the awards. |
• | Expected Volatility. As we do not have a significant trading history for our common stock, the expected stock price volatility for our common stock was estimated by taking the average historic price volatility for industry peers based on daily price observations over a period equivalent to the expected term of the awards. We did not rely on implied volatilities of traded options in our industry peers’ common stock because the volume of activity was relatively low. We intend to continue to consistently apply this process using the same or similar public companies until we have a sufficient amount of historical information regarding the volatility of our own common stock share price. |
• | Risk-free Rate. The risk-free interest rate is based on the yields of U.S. Treasury securities with maturities similar to the expected term of the stock-based awards. |
• | Dividend Yield. We have never declared or paid any cash dividends and do not presently plan to pay cash dividends in the foreseeable future. Consequently, we used an expected dividend yield of zero. |
In addition to the assumptions used in the Black-Scholes option-pricing model, we must also estimate a forfeiture rate to calculate the stock-based compensation expense for our awards. Our forfeiture rate is based on an analysis of our actual forfeitures. We will continue to evaluate the appropriateness of the forfeiture rate based on actual forfeiture experience, analysis of employee turnover, and other factors. Quarterly changes in the estimated forfeiture rate can have a significant impact on our stock-based compensation expense as the cumulative effect of adjusting the rate is recognized in the period the forfeiture estimate is changed.
64
If any of the assumptions used in the Black-Scholes model changes materially, stock-based compensation for future awards may differ materially compared with the awards granted previously.
Recent Accounting Pronouncements
Share-Based Payment: In March 2016, the Financial Accounting Standards Board (“FASB”) issued Accounting Standards Update (“ASU”) No. 2016-09 (“ASU 2016-09”), “Improvements to Employee Share-Based Payment Accounting (“Topic 718”).” ASU 2016-09 simplifies several aspects of the accounting for employee share-based payment transactions, including the accounting for income taxes, forfeitures, and statutory tax withholding requirements, as well as classification in the statement of cash flows. Under the new guidance, an entity recognizes all excess tax benefits and tax deficiencies as income tax expense or benefit in the income statement. This change eliminates the notion of the APIC pool and significantly reduces the complexity and cost of accounting for excess tax benefits and tax deficiencies. In addition, excess tax benefits and tax deficiencies are considered discrete items in the reporting period they occur and are not included in the estimate of an entity’s annual effective tax rate. The new standard is effective for financial statements issued for fiscal years beginning after December 15, 2016 and interim periods within those fiscal years. Early adoption is permitted. This guidance is effective for the Company on a prospective basis beginning in the first fiscal quarter of 2018. We are beginning to evaluate the impact this standard will have on our consolidated financial statements and related disclosures.
Leases: In February 2016, the FASB issued ASU 2016-02, “Leases (Topic 842)”, which requires lessees to recognize a right-of-use asset and lease liability for all leases with terms of more than 12 months. Recognition, measurement and presentation of expenses will depend on classification as a finance or operating lease. The amendments also require certain quantitative and qualitative disclosures. Accounting guidance for lessors is largely unchanged. This guidance should be applied on a modified retrospective basis for the Company beginning in the first quarter of fiscal 2020. We are beginning to evaluate the impact this standard will have on our consolidated financial statements and related disclosures.
Simplifying the Accounting for Measurement-Period Adjustments: In September 2015, the FASB issued ASU No. 2015-16 Simplifying the Accounting for Measurement-Period Adjustments, The amendments in ASU 2015-16 eliminate the requirement to retrospectively account for adjustments made to provisional amounts recognized in a business combination during the measurement period. Adjustments to provisional amounts are to be recorded in the same period in which the adjustments are determined, and are to be calculated as if the accounting had been completed at the acquisition date. This update requires that all such adjustments be presented separately on the face of the income statement or disclosed in the notes to the financial statements and identify, by financial statement line item, the portion of the adjustment that would have been recorded in previous reporting periods if the adjustment to the provisional amounts had been recognized as of the acquisition date. ASU 2015-16 is effective for annual periods, including interim periods within those annual periods, beginning after December 15, 2015. The amendments in this update should be applied prospectively to adjustments to provisional amounts that occur after the effective date of this update with earlier application permitted for financial statements that have not been issued. The effect of ASU 2015-16 on the Company’s financial statements and related disclosures is subject to its future business combination activity.
Fees paid in a cloud computing arrangement: In April 2015, the FASB issued ASU 2015-05 related to a customer’s accounting for fees paid in a cloud computing arrangement. The new guidance requires that management evaluate each cloud computing arrangement in order to determine whether it includes a software license that must be accounted for separately from hosted services. ASU 2015-05 applies the same guidance cloud service providers use to make this determination and also eliminates the existing requirement for customers to account for software licenses they acquire by analogizing to the guidance on leases. ASU 2015-05 is effective for annual periods, including interim periods within those annual periods, beginning after December 15, 2015 and provides the option of applying the guidance prospectively to all arrangements entered into or materially modified after the effective date or on a retrospective basis. The Company will adopt ASU 2015-05 beginning with the first fiscal quarter of 2017 on a prospective basis for all arrangements entered into or materially modified after the effective date. The adoption of this standard is not expected to have a material effect on its financial position.
Debt Issuance Costs: In April 2015, the Financial Accounting Standards Board (“FASB”) issued ASU No. 2015-03, Interest—Imputation of Interest (Subtopic 835-30): Simplifying the Presentation of Debt Issuance Costs. The ASU requires that debt issuance costs related to a recognized debt liability be presented in the balance sheet as a direct deduction from the carrying amount of that debt liability, consistent with debt discounts. The recognition and measurement guidance for debt issuance costs are not affected by this ASU. Early adoption is permitted. This guidance is effective for the Company on a retrospective basis beginning in the first quarter of fiscal 2017 and is not expected to have a material impact on our consolidated financial statements.
65
Going Concern: In August 2014, the FASB issued ASU No. 2014-15, Presentation of Financial Statements—Going Concern, which requires an entity to evaluate whether there is substantial doubt about its ability to continue as a going concern, and to provide related footnote disclosures. The new standard is effective for us in our fiscal year ending July 31, 2017. We are evaluating the effect of our pending adoption of ASU 2014-15 on our consolidated financial statements and related disclosures and do not expect it to have a material impact on our consolidated financial statements.
Revenue Recognition: In May 2014, the FASB issued ASU No. 2014-09, Revenue from Contracts with Customers (Topic 606), which supersedes the revenue recognition requirements in Accounting Standards Codification 605, Revenue Recognition. According to the new guidance, revenue is recognized when promised goods or services are transferred to customers in an amount that reflects the consideration for which the Company expects to be entitled in exchange for those goods or services. In August 2015, the FASB issued ASU No. 2015-14, which provides a one-year deferral in the effective date of ASU No. 2014-09. Early adoption will be permitted, but not earlier than the original effective date for annual and interim periods. In accordance with the deferral, the effective date applicable to us will be the first quarter of fiscal 2019. In March 2016, the FASB issued ASU No. 2016-08 which provides clarification on assessing whether an entity is a principal or an agent in a revenue transaction, which impacts whether revenue is reported on a gross or net basis. In April 2016, the FASB issued ASU No. 2016-10 which provides guidance on identifying performance obligations in a contract and accounting for licenses of intellectual property. The new standard may be applied retrospectively to each prior period presented or as a cumulative effect recognized as of the date of adoption. We have not yet selected a transition method nor have we determined the effect of the standard will have on our consolidated financial statements and related disclosures.
See also “Recently Adopted Accounting Standards” in Note 1 to Consolidated Financial Statements included in Part II, Item 8 of this Annual Report on Form 10-K.
Item 7A. Quantitative and Qualitative Disclosures About Market Risk
We are exposed to financial market risks, primarily changes in interest rates and currency exchange rate fluctuations.
Interest Rate Risk
We had cash and cash equivalents of $68.3 million and $89.6 million as of July 31, 2016 and 2015, respectively. Our cash and cash equivalents are held in cash deposits and money market funds. Due to the short-term nature of these instruments, we do not believe that we have any material exposure to changes in the fair value of our investment portfolio as a result of changes in interest rates. Declines in interest rates, however, would reduce our future interest income.
The primary objective of our investment activities is to preserve principal while maximizing yields without significantly increasing risk. This objective is accomplished by making investments, consisting only of money market funds. During the fiscal years ended July 31, 2016, 2015, and 2014, the effect of a hypothetical 10% increase or decrease in overall interest rates would not have had a material impact on our interest income.
Any draws under our outstanding debt obligations bear interest at a variable rate tied to the prime rate. At July 31, 2016 and 2015, respectively, we had an outstanding balance of $2.2 million and $3.9 million on our debt obligations. During the fiscal years ended July 31, 2016, 2015, and 2014, the effect of a hypothetical 10% increase or decrease in overall interest rates would not have had a material impact on our interest expense.
Foreign Currency Exchange Risk
Our results of operations and cash flows are subject to fluctuations due to changes in foreign currency exchange rates. All of our revenue is generated in U.S. dollars. Our expenses are generally denominated in the currencies in which our operations are located, which is primarily in the United States and to a lesser extent in Europe and Asia. Our results of operations and cash flows are, therefore, subject to fluctuations due to changes in foreign currency exchange rates and may be adversely affected in the future due to changes in foreign exchange rates. The effect of a hypothetical 10% change in foreign currency exchange rates applicable to our business would not have a material impact on our historical consolidated financial statements for the fiscal years ended July 31, 2016, 2015, and 2014. To date, we have not engaged in any hedging strategies. As our international operations grow, we will continue to reassess our approach to manage our risk relating to fluctuations in currency rates.
Inflation
We do not believe that inflation had a material effect on our business, financial condition or results of operations in the last three fiscal years. If our costs were to become subject to significant inflationary pressures, we may not be able to fully
66
offset such higher costs through price increases. Our inability or failure to do so could harm our business, financial condition and results of operations.
67
Item 8. Financial Statements and Supplementary Data
APIGEE CORPORATION
INDEX TO CONSOLIDATED FINANCIAL STATEMENTS
68
REPORT OF INDEPENDENT REGISTERED PUBLIC ACCOUNTING FIRM
The Board of Directors and Stockholders
Apigee Corporation:
We have audited the accompanying consolidated balance sheets of Apigee Corporation and subsidiaries (the Company) as of July 31, 2016 and 2015, and the related consolidated statements of comprehensive loss, stockholders’ equity, and cash flows for each of the years in the three-year period ended July 31, 2016. These consolidated financial statements are the responsibility of the Company’s management. Our responsibility is to express an opinion on these consolidated financial statements based on our audits.
We conducted our audits in accordance with the standards of the Public Company Accounting Oversight Board (United States). Those standards require that we plan and perform the audit to obtain reasonable assurance about whether the financial statements are free of material misstatement. An audit includes examining, on a test basis, evidence supporting the amounts and disclosures in the financial statements. An audit also includes assessing the accounting principles used and significant estimates made by management, as well as evaluating the overall financial statement presentation. We believe that our audits provide a reasonable basis for our opinion.
In our opinion, the consolidated financial statements referred to above present fairly, in all material respects, the financial position of Apigee Corporation and subsidiaries as of July 31, 2016 and 2015, and the results of their operations and their cash flows for each of the years in the three-year period ended July 31, 2016, in conformity with U.S. generally accepted accounting principles.
/s/ KPMG LLP
Santa Clara, California
October 7, 2016
69
Apigee Corporation
Consolidated Balance Sheets
(in thousands, except share and per share amounts)
July 31, | ||||||||
2016 | 2015 | |||||||
Assets | ||||||||
Current assets | ||||||||
Cash and cash equivalents | $ | 68,303 | $ | 89,562 | ||||
Accounts receivable, net of allowance for doubtful accounts of $75 and $89 as of July 31, 2016 and 2015, respectively | 25,958 | 21,451 | ||||||
Prepaid expenses and other current assets | 5,092 | 5,806 | ||||||
Total current assets | 99,353 | 116,819 | ||||||
Property and equipment, net | 1,923 | 3,144 | ||||||
Goodwill | 14,744 | 14,744 | ||||||
Intangible assets, net | 2,165 | 3,200 | ||||||
Other assets | 652 | 799 | ||||||
Total assets | $ | 118,837 | $ | 138,706 | ||||
Liabilities and stockholders’ equity | ||||||||
Current liabilities | ||||||||
Accounts payable | $ | 368 | $ | 2,015 | ||||
Accrued expenses and other current liabilities | 11,247 | 9,796 | ||||||
Deferred revenue, current portion | 44,833 | 35,648 | ||||||
Term debt, current portion | 1,318 | 2,079 | ||||||
Total current liabilities | 57,766 | 49,538 | ||||||
Non-current liabilities | ||||||||
Deferred revenue, non-current | 9,056 | 5,154 | ||||||
Deferred rent, non-current | 1,038 | 1,550 | ||||||
Other liabilities, non-current | 645 | 773 | ||||||
Term debt, non-current | 882 | 1,787 | ||||||
Total non-current liabilities | 11,621 | 9,264 | ||||||
Total liabilities | 69,387 | 58,802 | ||||||
Commitments and contingencies (Note 9) | ||||||||
Stockholders’ equity | ||||||||
Convertible preferred stock: $0.001 par value; 200,000,000 shares authorized; no shares issued and outstanding at July 31, 2016 and 2015 | — | — | ||||||
Common stock: $0.001 par value; 1,000,000,000 shares authorized; 30,440,809 and 29,386,481 shares issued and outstanding at July 31, 2016 and 2015, respectively | 30 | 29 | ||||||
Additional paid-in capital | 287,156 | 276,099 | ||||||
Accumulated deficit | (237,736 | ) | (196,224 | ) | ||||
Total stockholders’ equity | 49,450 | 79,904 | ||||||
Total liabilities and stockholders’ equity | $ | 118,837 | $ | 138,706 | ||||
See accompanying notes to consolidated financial statements
70
Apigee Corporation
Consolidated Statements of Comprehensive Loss
(in thousands, except per share amounts)
Year Ended July 31, | ||||||||||||
2016 | 2015 | 2014 | ||||||||||
Revenue | ||||||||||||
License | $ | 32,345 | $ | 20,757 | $ | 11,411 | ||||||
Subscription and support | 42,936 | 30,865 | 20,237 | |||||||||
Professional services and other | 16,746 | 16,985 | 21,054 | |||||||||
Total revenue | 92,027 | 68,607 | 52,702 | |||||||||
Cost of revenue | ||||||||||||
License | 521 | 514 | 366 | |||||||||
Subscription and support | 12,469 | 11,062 | 11,911 | |||||||||
Professional services and other | 14,535 | 13,415 | 15,431 | |||||||||
Total cost of revenue | 27,525 | 24,991 | 27,708 | |||||||||
Gross profit | 64,502 | 43,616 | 24,994 | |||||||||
Operating expenses | ||||||||||||
Research and development | 37,795 | 30,387 | 22,273 | |||||||||
Sales and marketing | 50,178 | 49,250 | 47,029 | |||||||||
General and administrative | 17,436 | 13,453 | 14,415 | |||||||||
Total operating expenses | 105,409 | 93,090 | 83,717 | |||||||||
Loss from operations | (40,907 | ) | (49,474 | ) | (58,723 | ) | ||||||
Other expense, net | (390 | ) | (452 | ) | (1,678 | ) | ||||||
Loss before provision for income taxes | (41,297 | ) | (49,926 | ) | (60,401 | ) | ||||||
Provision for income taxes | 215 | 427 | 392 | |||||||||
Net loss and comprehensive loss | $ | (41,512 | ) | $ | (50,353 | ) | $ | (60,793 | ) | |||
Net loss per share: | ||||||||||||
Basic and diluted | $ | (1.39 | ) | $ | (4.73 | ) | $ | (17.81 | ) | |||
Weighted-average shares outstanding used in calculating net loss per share: | ||||||||||||
Basic and diluted | 29,769 | 10,651 | 3,413 | |||||||||
See accompanying notes to consolidated financial statements
71
Apigee Corporation
Consolidated Statements of Stockholders’ Equity
(in thousands, except share amounts)
Convertible Preferred Stock | Common Stock | Additional Paid-in Capital | Accumulated Deficit | Total Stockholders’ Equity | ||||||||||||||||||||||
Shares | Amount | Shares | Amount | |||||||||||||||||||||||
Balances at July 31, 2013 | 14,797,535 | $ | 112 | 3,003,076 | $ | 23 | $ | 112,279 | $ | (85,078 | ) | $ | 27,336 | |||||||||||||
Issuance of Series G convertible preferred stock in connection with InsightsOne acquisition | 511,538 | 4 | — | — | 9,599 | — | $ | 9,603 | ||||||||||||||||||
Issuance of Series G-1 convertible preferred stock in connection with InsightsOne acquisition | 681,792 | 5 | — | — | 7,416 | — | $ | 7,421 | ||||||||||||||||||
Issuance of Series H convertible preferred stock, net of issuance costs of $180 | 2,715,382 | 21 | — | — | 59,853 | — | $ | 59,874 | ||||||||||||||||||
Issuance of common stock upon exercise of options | — | — | 545,370 | 4 | 452 | — | $ | 456 | ||||||||||||||||||
Issuance of common stock upon vesting of restricted stock units | — | — | 70,655 | 1 | 29 | — | $ | 30 | ||||||||||||||||||
Issuance of common stock from exercise of common stock warrants | — | — | 311,741 | 2 | 2,836 | — | $ | 2,838 | ||||||||||||||||||
Issuance of restricted stock units in connection with InsightsOne acquisition | — | — | — | — | 31 | — | $ | 31 | ||||||||||||||||||
Stock-based compensation | — | — | — | — | 2,726 | — | $ | 2,726 | ||||||||||||||||||
Net loss | — | — | — | — | — | (60,793 | ) | $ | (60,793 | ) | ||||||||||||||||
Balances at July 31, 2014 | 18,706,247 | 142 | 3,930,842 | 30 | 195,221 | (145,871 | ) | $ | 49,522 | |||||||||||||||||
Conversion of convertible preferred stock to common stock upon initial public offering | (18,614,597 | ) | (141 | ) | 19,818,172 | (11 | ) | 152 | — | $ | — | |||||||||||||||
Issuance of common stock upon initial public offering, net of offering costs of $4,022 | — | — | 5,115,000 | 5 | 76,842 | — | $ | 76,847 | ||||||||||||||||||
Issuance of common stock upon exercise of options | — | — | 465,385 | 5 | 429 | — | $ | 434 | ||||||||||||||||||
Issuance of common stock from exercise of common stock warrants | — | — | 57,082 | — | 26 | — | $ | 26 | ||||||||||||||||||
Issuance of restricted stock units in connection with InsightsOne acquisition | — | — | — | — | (8 | ) | — | $ | (8 | ) | ||||||||||||||||
Repurchase of series G-1 preferred stock | (91,650 | ) | (1 | ) | — | — | (14 | ) | — | $ | (15 | ) | ||||||||||||||
Stock-based compensation | — | — | — | — | 3,451 | — | $ | 3,451 | ||||||||||||||||||
Net loss | — | — | — | — | — | (50,353 | ) | $ | (50,353 | ) | ||||||||||||||||
Balances at July 31, 2015 | — | — | 29,386,481 | 29 | 276,099 | (196,224 | ) | $ | 79,904 | |||||||||||||||||
Issuance of common stock upon exercise of options | — | — | 625,496 | 1 | 1,161 | — | $ | 1,162 | ||||||||||||||||||
Shares issued under employee stock purchase plan | — | — | 296,411 | — | 2,057 | — | $ | 2,057 | ||||||||||||||||||
Repurchase of unvested common stock | — | — | (24,287 | ) | — | (18 | ) | — | $ | (18 | ) | |||||||||||||||
Restricted stock units vested (net) | — | — | 156,708 | — | — | — | $ | — | ||||||||||||||||||
Shares withheld for taxes related to net share settlement | — | — | — | — | (531 | ) | — | $ | (531 | ) | ||||||||||||||||
Stock-based compensation | — | — | — | — | 8,388 | — | $ | 8,388 | ||||||||||||||||||
Net loss | — | — | — | — | — | (41,512 | ) | $ | (41,512 | ) | ||||||||||||||||
Balances at July 31, 2016 | — | — | 30,440,809 | 30 | 287,156 | (237,736 | ) | $ | 49,450 | |||||||||||||||||
See accompanying notes to consolidated financial statements
72
Apigee Corporation
Consolidated Statements of Cash Flows
(in thousands)
Year Ended July 31, | ||||||||||||
2016 | 2015 | 2014 | ||||||||||
Cash flows from operating activities | ||||||||||||
Net loss | $ | (41,512 | ) | $ | (50,353 | ) | $ | (60,793 | ) | |||
Adjustments to reconcile net loss to net cash used in operating activities | ||||||||||||
Depreciation and amortization | 2,401 | 2,436 | 2,104 | |||||||||
Provision for (recovery of) doubtful accounts | (14 | ) | 42 | 150 | ||||||||
Amortization of debt discount | 39 | 46 | 24 | |||||||||
Issuances and changes in fair value of common stock warrants | — | — | 1,584 | |||||||||
Deferred income taxes | — | — | (84 | ) | ||||||||
Stock-based compensation expense | 8,388 | 3,451 | 2,726 | |||||||||
Loss on disposal of fixed assets | — | 10 | 39 | |||||||||
Loss on lease abandonment | — | — | 75 | |||||||||
Changes in operating assets and liabilities | ||||||||||||
Accounts receivable | (4,493 | ) | (5,090 | ) | (9,671 | ) | ||||||
Prepaid expenses and other assets | 841 | (1,733 | ) | (1,173 | ) | |||||||
Accounts payable | (1,400 | ) | (996 | ) | 1,034 | |||||||
Accrued expenses and other liabilities | 968 | 2,209 | 2,694 | |||||||||
Deferred revenue | 13,087 | 12,611 | 11,024 | |||||||||
Net cash used in operating activities | (21,695 | ) | (37,367 | ) | (50,267 | ) | ||||||
Cash flows from investing activities | ||||||||||||
Purchase of property and equipment | (241 | ) | (966 | ) | (2,539 | ) | ||||||
Proceeds from the sale of property and equipment | — | — | 4 | |||||||||
Acquisitions, net of cash acquired | — | — | 449 | |||||||||
Net cash used in investing activities | (241 | ) | (966 | ) | (2,086 | ) | ||||||
Cash flows from financing activities | ||||||||||||
Proceeds from issuance of debt, net of issuance costs | 2,648 | 4,000 | 6,500 | |||||||||
Repayments of debt obligations | (4,489 | ) | (5,382 | ) | (6,961 | ) | ||||||
Proceeds from issuance of convertible preferred stock, net of issuance costs | — | — | 59,874 | |||||||||
Repurchases of unvested common stock | (18 | ) | — | — | ||||||||
Proceeds from initial public offering, net of offering costs | (152 | ) | 77,092 | — | ||||||||
Taxes remitted on RSU awards vested | (531 | ) | — | — | ||||||||
Proceeds from exercise of stock options, net of taxes paid | 1,162 | 434 | 456 | |||||||||
Proceeds from Employee Stock Purchase Plan | 2,057 | — | — | |||||||||
Cash paid for fractional shares | — | (8 | ) | — | ||||||||
Net cash provided by financing activities | 677 | 76,136 | 59,869 | |||||||||
Net increase (decrease) in cash and cash equivalents | (21,259 | ) | 37,803 | 7,516 | ||||||||
Cash and cash equivalents | ||||||||||||
Beginning of period | 89,562 | 51,759 | 44,243 | |||||||||
End of period | $ | 68,303 | $ | 89,562 | $ | 51,759 | ||||||
Supplemental disclosures | ||||||||||||
Cash paid for interest | $ | 129 | $ | 231 | $ | 321 | ||||||
Cash paid for taxes, net of refunds | 316 | 541 | 348 | |||||||||
Non-cash investing and financing activities | ||||||||||||
Accrued purchases of property and equipment | $ | 2 | $ | 16 | $ | 15 | ||||||
Property and equipment acquired utilizing lease incentives | — | 139 | 883 | |||||||||
Convertible preferred stock issued in connection with InsightsOne acquisition | — | — | 17,024 | |||||||||
Issuance of restricted stock units in connection with InsightsOne acquisition | — | — | 31 | |||||||||
Deferred offering costs not yet paid | — | 176 | — | |||||||||
See accompanying notes to consolidated financial statements
73
Apigee Corporation
Notes to Consolidated Financial Statements
(1) Description of Business and Significant Accounting Policies
Description of Business
Apigee Corporation’s (together with its wholly-owned subsidiaries, “Apigee” or the “Company”) mission is to make every business a digital business. The Company provides an innovative software platform that allows businesses to design, deploy, and scale APIs, as a connection layer between their core IT systems and data and the applications with which their customers, partners, employees and other users engage with the business. The foundations of the Company’s platform are Apigee Edge, a robust API-management solution, and Apigee Insights, the Company’s predictive analytics software solution. The Company delivers its platform both in the cloud and on premises. Apigee was incorporated in Delaware on June 3, 2004 and is headquartered in San Jose, California.
Initial Public Offering
On April 29, 2015 the Company completed its initial public offering (the “IPO”) in which it sold 5,115,000 shares of common stock to the public at $17.00 per share. The total gross proceeds from the offering were approximately $87.0 million. After deducting underwriting discounts and commissions and offering expenses payable by the Company, the aggregate net proceeds received totaled approximately $76.9 million.
The sale of common stock in the IPO triggered the weighted average anti-dilution provisions of the Company’s amended and restated certificate of incorporation then in effect. At the IPO price of $17.00 per share, the per share conversion rate for the Company’s Series H convertible preferred stock into common stock was approximately 1:1.0365. In connection with the completion of the IPO, and giving effect to the anti-dilution adjustment relating to the Company’s Series H convertible preferred stock, all shares of the Company’s convertible preferred stock outstanding automatically converted into 19,818,172 shares of the Company’s common stock.
Reverse Stock Split
On April 7, 2015, the Company effected a 1-for-7.6 reverse stock split of its common stock and convertible preferred stock, as approved by its Board of Directors (the “Board”) and stockholders. All information throughout these consolidated financial statements and notes to the consolidated financial statements relating to the number of shares, price per share and per share amounts have been adjusted to give effect to the 1-for-7.6 reverse stock split. All fractional shares were settled in cash.
Basis of Presentation and Principles of Consolidation
The accompanying consolidated financial statements have been prepared in accordance with generally accepted accounting principles in the United States (“GAAP”) and applicable rules and regulations of the Securities and Exchange Commission (the “SEC”). The accompanying consolidated financial statements include the accounts of Apigee Corporation and its wholly-owned subsidiaries. All intercompany balances and transactions have been eliminated upon consolidation.
Use of Estimates
The preparation of consolidated financial statements in conformity with GAAP requires management to make estimates and assumptions that affect the reported amounts of assets and liabilities and disclosure of contingent assets and liabilities at the date of the consolidated financial statements and the reported amounts of revenue and expenses during the reporting period covered by the consolidated financial statements and accompanying notes. In particular, the Company makes estimates with respect to the fair value of multiple elements in revenue recognition, uncollectible accounts receivable, assets acquired and liabilities assumed in a business combination, valuation of long-lived assets, stock-based compensation, income taxes and other contingencies. Actual results could differ from those estimates and such differences could be material to the financial statements and affect the results of operations reported in future periods.
74
Foreign Currency Transactions
The functional currency of the Company’s foreign subsidiaries is the U.S. dollar. Accordingly, monetary balance sheet accounts are remeasured using the current exchange rate in effect at the balance sheet date and non-monetary items are remeasured at the historical exchange rate. Expenses are remeasured at the average exchange rates for the period. The resulting gains and losses are included in other expense, net and were not material for the years ended July 31, 2016, 2015 and 2014.
Cash and Cash Equivalents
The Company considers all highly liquid instruments with original or remaining maturities of 90 days or less at the date of purchase to be cash equivalents. Cash and cash equivalents are stated at cost, which approximates fair value. As of July 31, 2016 and 2015, $66.0 million and $86.4 million, respectively, of cash and cash equivalents were invested in money market funds.
Concentration of Risk and Significant Customers
Financial instruments that potentially subject the Company to significant concentrations of credit risk consist primarily of cash and cash equivalents and accounts receivable. The Company maintains the majority of its cash and money market accounts at one financial institution that management believes is a high-credit, high-quality financial institution and accordingly, subject to minimal credit risk. Deposits held with these financial institutions may be in excess the amount of insured limits provided on such deposits, if any.
The Company’s accounts receivable are subject to credit risks. The accounts receivable are unsecured and are derived from customers around the world in a variety of industries.
The Company’s significant customers who individually exceeded 10% of total accounts receivable as of the dates shown or total revenue during the period are as follows:
Revenue | Accounts Receivable | |||||||||
Year Ended July 31, | As of July 31, | |||||||||
2016 | 2015 | 2014 | 2016 | 2015 | ||||||
Customer A | * | * | 15% | * | * | |||||
Customer B | * | * | * | 11% | * | |||||
* Does not exceed 10%. | ||||||||||
Accounts Receivable and Allowance for Doubtful Accounts
The Company’s accounts receivable are recorded at invoiced amounts, net of the Company’s estimated allowances for doubtful accounts. The allowance for doubtful accounts is estimated based on an assessment of the Company’s ability to collect on customer accounts receivable. The Company performs ongoing credit evaluations of its customers and regularly reviews the allowance by considering certain factors such as historical experience, industry data, credit quality, age of accounts receivable balances and current economic conditions that may affect a customer’s ability to pay. In cases where the Company is aware of circumstances that may impair a specific customer’s ability to meet their financial obligations, the Company records a specific allowance against amounts due from the customer and thereby reduces the net recognized receivable to the amount the Company reasonably believes will be collected. There is judgment involved with estimating the Company’s allowance for doubtful accounts and if the financial condition of its customers were to deteriorate, resulting in their inability to make the required payments, the Company may be required to record additional allowances or charges against revenue. The Company writes off accounts receivable against the allowance when it determines a balance is uncollectible and no longer actively pursues collection of the receivable. The Company’s accounts receivable are not collateralized by any security.
75
The following table summarizes the accounts receivable allowance activity:
Year Ended July 31, | ||||||||||||
2016 | 2015 | 2014 | ||||||||||
(in thousands) | ||||||||||||
Balance at beginning of period | $ | 89 | $ | 204 | $ | 172 | ||||||
Additions | 132 | 42 | 150 | |||||||||
Write-offs, net of recoveries | (146 | ) | (157 | ) | (118 | ) | ||||||
Balance at end of period | $ | 75 | $ | 89 | $ | 204 | ||||||
Property and Equipment, Net
Property and equipment are stated at cost, net of accumulated depreciation and amortization. Depreciation is calculated using the straight-line method over the estimated useful lives of the assets generally ranging from three to five years. Leasehold improvements are amortized over the shorter of the estimated useful life or the remaining lease term. When assets are retired or disposed of, the cost and accumulated depreciation are removed from the accounts, and any resulting gains or losses are included in the consolidated statements of comprehensive loss. Maintenance and repairs that do not improve or extend the lives of the respective assets are expensed in the period incurred.
The estimated useful lives of property and equipment are as follows:
Useful Life | ||
Computer equipment and software | 3 years | |
Furniture and fixtures | 5 years | |
Leasehold improvements | Shorter of the lease term or estimated useful life | |
Fair Value of Financial Instruments
Assets and liabilities recorded at fair value in the financial statements are categorized based upon the level of judgment associated with the inputs used to measure their fair value. Hierarchical levels which are directly related to the amount of subjectivity associated with the inputs to the valuation of these assets or liabilities are as follows:
Level 1—Observable inputs, such as quoted prices in active markets for identical assets or liabilities.
Level 2—Observable inputs other than Level 1 prices such as quoted prices for similar assets or liabilities, quoted prices in markets that are not active, or other inputs that are observable or can be corroborated by observable market data for substantially the full term of the assets or liabilities.
Level 3—Unobservable inputs that are supported by little or no market activity and that are significant to the fair value of the assets or liabilities.
The Company has certain financial assets and liabilities that are measured at fair value on a recurring basis. Assets and liabilities measured at fair value are classified in their entirety based on the lowest level of input that is significant to the fair value measurement. The Company’s assessment of the significance of a particular input to the fair value measurement in its entirety requires management to make judgments and considers factors specific to the asset or liability. The Company’s cash equivalents include highly liquid money market funds and are classified within the Level 1 of the fair value hierarchy. Level 3 liabilities that are measured at fair value on a recurring basis consist solely of the Company’s common stock warrant liability. The fair values of the outstanding common stock warrants are measured using the Black-Scholes option-pricing model. Inputs used to determine estimated fair value include the estimated fair value of the underlying stock at the valuation measurement date, the remaining contractual term of the warrants, risk-free interest rates, expected dividends, and the expected volatility of the underlying stock. Generally, increases (decreases) in the fair value of the underlying stock and estimated term would have a directionally similar impact to the fair value measurement.
The carrying amounts of certain of the Company’s financial instruments including cash equivalents, accounts receivable, accounts payable and accrued liabilities approximate fair value due to their short-term maturities. Based on borrowing rates
76
currently available to the Company for financing obligations with similar terms and considering the Company’s credit risks, the carrying value of the Company’s long-term debt approximates fair value.
Goodwill and Intangible Assets
Goodwill represents the excess of the purchase price over the fair value of the net tangible and intangible assets acquired in a business combination. Goodwill is not amortized, but is tested for impairment at least annually or more frequently if events or changes in circumstances indicate that the asset may be impaired. The Company’s impairment tests are based on a single operating segment and reporting unit structure. If the Company determines that it is more likely than not that the fair value of the Company’s reporting unit is less than the carrying value, it will conduct a two-step test for impairment of goodwill. The first step involves comparing the fair value of the Company’s reporting unit to its carrying value, including goodwill. If the carrying value of the reporting unit exceeds its fair value, the second step of the test is performed by comparing the carrying value of the goodwill in the reporting unit to its implied fair value. An impairment charge is recognized for the excess of the carrying value of goodwill over its implied fair value. The Company’s annual goodwill impairment test resulted in no impairment charges during the years ended July 31, 2016, 2015 or 2014.
Intangible assets acquired as part of a business combination, consisting primarily of developed technology, customer relationships and backlog are capitalized at their acquisition-date fair value and amortized using the straight-line method over their estimated useful life.
Impairment of Long-lived Assets
Long-lived assets, such as property, plant, and equipment, and purchased intangible assets are reviewed for impairment whenever events or changes in circumstances indicate that the carrying amount of an asset may not be recoverable. Recoverability of these assets is measured by a comparison of the future undiscounted cash flows expected to be generated by that asset or asset group to its carrying value. If the carrying value of the long-lived asset or asset group is not recoverable on an undiscounted cash flow basis, an impairment is recognized to the extent that the carrying value exceeds its fair value. There were no impairment charges for the years ended July 31, 2016, 2015 and 2014.
Business Combinations
The Company recognizes assets acquired, liabilities assumed and contingent consideration at their fair value on the acquisition date. The Company’s estimates are inherently uncertain and subject to refinement. As a result, during the measurement period, which may be up to one year from the acquisition date, the Company may record adjustments to the fair value of assets acquired and liabilities assumed, with the corresponding offset to goodwill. Upon the conclusion of the measurement period or final determination of the fair value of assets acquired or liabilities assumed, whichever comes first, any subsequent adjustments are recorded to the Company’s consolidated statements of comprehensive loss.
In addition, uncertainties in income tax and tax related valuation allowances assumed in connection with a business combination are initially estimated as of the acquisition date. The Company continues to gather information and evaluates these items and records any adjustments to the Company’s preliminary estimates to goodwill when the Company is within the measurement period. Subsequent to the measurement period, changes to these income tax uncertainties and tax related valuation allowances will affect the Company’s provision for income taxes in the Company’s consolidated statements of comprehensive loss.
Capitalized Software Development Costs
Software development costs are expensed as incurred until the establishment of technological feasibility, at which time those costs are capitalized until the product is available for general release to customers and amortized over the estimated life of the product. Technological feasibility is established upon completion of a working model. To date, costs incurred subsequent to the establishment of technological feasibility have not been significant, and all software development costs have been charged to research and development expense in the accompanying consolidated statements of comprehensive loss.
Revenue Recognition
The Company generates revenue from the sale of its software solutions to customers through perpetual licenses and time-based licenses for its on premises solutions, and subscription arrangements for its cloud service. The Company also generates revenue from the sale of post-contract software support for on premises licenses including when and if available updates, and
77
professional services such as consulting and training services. The Company recognizes revenue when all of the following conditions are met:
• | persuasive evidence of an arrangement exists; |
• | delivery has occurred or services have been provided; |
• | sales price is fixed or determinable; and |
• | collection of the related receivable is probable. |
Signed agreements, including by electronic acceptance, are used as evidence of an arrangement. For the Company’s on premises solution, delivery is considered to occur when it provides the customer the ability to download the software. For the Company’s cloud service solution, delivery is considered to occur when a subscription service is provisioned and made available to a customer. The Company assesses whether a fee is fixed or determinable at the outset of the arrangement, primarily based on the payment terms associated with the sale. The Company assesses collectability of the fee based on a number of factors such as collection history and creditworthiness of the customer. If the Company determines that collectability is not probable, revenue is deferred until collectability becomes probable, generally upon receipt of payment from the customer.
The Company typically enters into multiple-element arrangements with its customers in which a customer may purchase a combination of its software (offered on premises with software support or as a cloud service) solution, and professional services. The software support and professional services are not considered essential to the functionality of the software. All of these elements are considered separate units of accounting. Typically, the Company’s agreements do not include rights for customers to cancel or terminate arrangements or to return software to obtain refunds.
The Company presents revenue on a net basis, and therefore, all sales taxes are excluded from revenue in the consolidated statements of comprehensive loss. Travel and other reimbursable costs are recorded in revenue.
License
License revenue is comprised of revenue generated from licenses of the Company’s on premises perpetual and time-based software solutions. The majority of the Company’s perpetual software license arrangements include a combination of the Company’s software downloaded on the customer’s hardware, software support, or professional services. For software elements, under the software revenue recognition guidance, the residual method is used to recognize revenue when a multiple-element arrangement includes one or more elements to be delivered at a future date and vendor-specific objective evidence (“VSOE”) of fair value of all undelivered element exists. VSOE is defined as the price charged when the same element is sold separately or for an element not yet being sold separately, the price established by management having relevant authority. In the majority of the Company’s software arrangements, the only element that remains undelivered at the time of delivery of the software product is software support or services.
The Company has established VSOE for consulting days, training and software support, except for software support bundled with time-based licenses, based on a substantial majority of separate stand-alone sales of these elements, which have been priced within a reasonably narrow range. As a result, for multiple element arrangements that include perpetual licenses, revenue is allocated to the undelivered elements based on VSOE for support or consulting days and training. Using the residual method, the difference between the total arrangement fee and amount deferred for the undelivered elements is recognized upon delivery of the perpetual license if all other revenue recognition criteria are met.
The Company does not have VSOE for software support bundled with time-based licenses. Therefore, revenue from time-based licenses to the Company’s on-premises solution is generally recognized ratably over the contractual term for all periods presented.
Subscription and Support
Subscription and support revenue includes the revenue derived from customer subscriptions to the Company’s cloud service and software support for its on premises software licenses. Cloud service arrangements generally include the Company’s cloud service solution offered on a subscription basis and professional services. The term of the arrangement allows for the customer to access the Company’s software for a specified period of time, generally one to three years. In cloud service subscription arrangements, the customer is not allowed to take possession of the Company’s software. Revenue from subscriptions to the Company’s cloud service is generally recognized ratably over the contractual term for all periods presented.
When cloud service subscription arrangements involve multiple elements that qualify as separate units of accounting (i.e., the delivered items have stand-alone value), the Company allocates arrangement consideration based on the relative selling
78
price method using the following selling price hierarchy: (1) VSOE if available; (2) third-party evidence (“TPE”), if VSOE is not available; and (3) best estimate of selling price (“BESP”) if neither VSOE nor TPE is available.
The Company has not historically priced its cloud service solution within a narrow range and, therefore, cannot establish VSOE. The Company also believes that TPE is not readily available for its cloud service as pricing is not readily accessible and there is no comparable product offering in the market. As a result, the Company uses BESP in order to allocate the selling price to cloud deliverables. The Company determines BESP considering multiple factors including, but not limited to, the price it charges for similar offerings, market conditions, competitive landscape, and pricing practices. For cloud offerings that include consulting days and training, the Company uses BESP for cloud deliverables and VSOE for consulting days and training to allocate revenue into separate units of accounting. Revenue for the cloud service is generally recognized over the subscription period when all other revenue recognition criteria are met. Consulting days and training are recognized as the services are performed, as discussed below.
Revenue from software support for the Company’s on-premises perpetual and time-based software licenses is generally recognized ratably over the contractual term, which is typically one to three years. Software support is bundled with time-based licenses and the Company uses a consistent systematic and rational method to allocate between time-based license and support revenue for financial statement presentation purposes only.
Professional Services and Other
Generally, the Company’s professional service arrangements are short-term in nature and not considered essential to the functionality of the Company’s software. Professional services are generally offered as consulting days, time and material and fixed-fee arrangements. Consulting days are recognized as revenue as the services are performed on an hourly basis or upon expiration of the service period. Time and material services are recognized as revenue as services are rendered based on inputs to the project, such as billable hours incurred. For fixed-fee professional service arrangements, the Company recognizes revenue under the proportional performance method of accounting and estimates the proportional performance on a monthly basis, utilizing hours incurred to date as a percentage of the total estimated hours to complete the project.
In cases where the Company has on premises perpetual or time-based license and professional services arrangements requiring significant customization and implementation that are considered essential to the functionality of the software, the arrangement is accounted for using contract accounting until the essential services are complete. If the Company can make reliable estimates of total project costs and the extent of progress toward completion, it applies the percentage-of-completion method in recognizing the arrangement fee.
Deferred Revenue
Deferred revenue primarily consists of billings or payments received in advance of revenue recognition from the Company’s product offerings described above and is recognized as the revenue recognition criteria are met. Deferred revenue that will be recognized during the following 12 months is recorded as a current liability and the remaining portion is recorded as non-current.
Deferred Cost of Revenue
Deferred cost of revenue primarily consists of direct costs for professional services from multiple-element arrangements either accounted for using the completed contract method or subject to acceptance. The direct costs are being recognized in proportion to the related revenue.
Product Warranties
The Company generally provides a warranty for its software products and services to its customers for periods ranging from one to six months. The Company’s software products are generally warranted to be free of defects in materials and workmanship under normal use and the products are also generally warranted to substantially perform as described in published documentation. The Company’s services are generally warranted to be performed in a professional manner and to materially conform to the specifications set forth in the related customer contract. In the event there is a failure of such warranties, the Company generally will correct the problem or provide a reasonable workaround or replacement product. If the Company cannot correct the problem or provide a workaround or replacement product, then the customer’s remedy is generally limited to refund of the fees paid for the nonconforming product or services. To date, the warranty expenses have been insignificant.
79
Sales Commissions
Sales commissions are recorded as a component of sales and marketing expenses and consist of the variable compensation paid to the Company’s sales force. Sales commissions are earned and recorded at the time that a customer has entered into a binding license, subscription or services agreement. Sales commission expense was $7.2 million, $7.1 million and $4.6 million for the years ended July 31, 2016, 2015 and 2014, respectively.
Research and Development
Research and development costs are expensed as incurred, except for certain internal-use software development costs, which may be capitalized as noted above.
Advertising
The Company expenses advertising costs as incurred as a component of sales and marketing expenses. The Company incurred advertising costs of zero, $0.1 million and $0.2 million for the years ended July 31, 2016, 2015 and 2014, respectively.
Stock-based Compensation
The Company recognizes compensation expense for all stock-based awards, including stock options, ESPP and restricted stock units (“RSUs”), based on the estimated fair value of the award on the grant date in the consolidated statements of comprehensive loss over the related vesting periods. The expense recorded is based on awards ultimately expected to vest and therefore is reduced by estimated forfeitures. Forfeitures are estimated at the time of grant and revised, if necessary, in subsequent periods if actual forfeitures differ from those estimates. The Company calculates the fair value of awards using the Black-Scholes option pricing model and records expense using the straight-line attribution approach.
The determination of the grant date fair value of awards is affected by a number of complex variables, which include the Company’s fair value of common stock, expected term of the options, expected volatility, risk-free interest rates and expected dividends. Prior to the Company's IPO, the Company engaged an outside expert to assist management with the valuation of the Company's common stock grants.
The Company accounts for equity awards issued to non-employees, such as consultants, in accordance with the guidance relating to equity instruments that are issued to other than employees for acquiring, or in conjunction with selling, goods or services, using the Black-Scholes option pricing model to determine the fair value of such instruments. Awards granted to non-employees are remeasured over the vesting period, and the resulting value is recorded as an expense over the period the services are received.
Segments
The Company operates its business as one operating segment. The Company’s chief operating decision maker is its Chief Executive Officer, who reviews financial information presented on a consolidated basis for purposes of making operating decisions, assessing financial performance and allocating resources.
Taxes
Income Taxes
The Company accounts for income taxes using the asset and liability approach. Deferred tax assets and liabilities are recognized for the future tax consequences attributable to differences between the financial statement carrying amounts of existing assets and liabilities and their respective tax bases and operating loss and tax credit carryforwards. Deferred tax assets and liabilities are measured using enacted tax rates expected to apply to taxable income in the years in which those temporary differences are expected to be recovered or settled. The Company evaluates the realizability of its deferred income tax assets and assesses the need for a valuation allowance on an ongoing basis. In evaluating its deferred income tax assets, the Company considers all available positive and negative evidence related to the likelihood of realization of the deferred tax assets to determine, based on the weight of available evidence, whether it is more likely than not that some or all of the deferred tax assets will not be realized.
80
The Company has recorded a full valuation allowance on its U.S. deferred tax assets as of July 31, 2016 because the realization of these tax benefits through future taxable income is not more likely than not as of July 31, 2016. The valuation allowance will be maintained until sufficient positive evidence exists to support the reversal of the valuation allowance. The Company makes estimates and judgments about its future taxable income that are based on assumptions that are consistent with the plans and estimates. Should the actual amounts differ from the estimates, the amount of the valuation allowance could be materially impacted.
The Company accounts for uncertain tax positions using a two-step approach for recognizing and measuring uncertain tax positions. Tax positions are evaluated for recognition by determining if the weight of available evidence indicates that it is probable that the position will be sustained on audit, including resolution of related appeals or litigation. Tax benefits are then measured as the largest amount which is more than 50% likely of being realized upon ultimate settlement. The Company considers many factors when evaluating and estimating tax positions and tax benefits, which may require periodic adjustments and which may not accurately anticipate actual outcomes.
The Company recognized potential accrued interest and penalties related to unrecognized tax benefits in tax expense.
Other Taxes
The Company conducts operations in many tax jurisdictions throughout the U.S and around the world. In many of these jurisdictions, non-income based taxes such as property taxes, sales and use taxes, and value-added taxes are assessed on the Company’s operations in that particular location. While the Company strives to ensure compliance with these various non-income based tax filing requirements, there have been instances where potential non-compliance exposures have been identified. In accordance with GAAP, the Company makes a provision for these exposures when it is both probable that a liability has been incurred and the amount of the exposure can be reasonably estimated. The Company believes that, as of July 31, 2016 and 2015, it has adequately provided for such contingencies. However, it is possible that the Company’s results of operations, cash flows, and financial position could be harmed if one or more non-compliance tax exposures are asserted by any of the jurisdictions where the Company conducts its operations.
Commitments and Contingencies
Liabilities for loss contingencies arising from claims, assessments, litigation, fines and penalties and other sources are recorded when it is probable that a liability has been or will be incurred and the amount of the liability can be reasonably estimated. Legal costs incurred in connection with loss contingencies are expensed as incurred.
Recently Adopted Accounting Standards
Share-Based Payments with Performance Targets: In June 2014, the FASB issued Accounting Standards Update No. 2014-12, Accounting for Share-Based Payments When the Terms of an Award Provide That a Performance Target Could Be Achieved after the Requisite Service Period (ASU 2014-12). ASU 2014-12 requires that a performance target that affects vesting and could be achieved after the requisite service period be treated as a performance condition. A reporting entity should apply existing guidance in ASC 718, Compensation—Stock Compensation, as it relates to such awards. ASU 2014-12 is effective for the Company in its first quarter of fiscal 2017 with early adoption permitted using either of two methods: (1) prospective to all awards granted or modified after the effective date; or (2) retrospective to all awards with performance targets that are outstanding as of the beginning of the earliest annual period presented in the financial statements and to all new or modified awards thereafter, with the cumulative effect of applying ASU 2014-12 as an adjustment to the opening retained earnings balance as of the beginning of the earliest annual period presented in the financial statements. The Company has elected to early adopt the new standard using the retrospective adoption method. The adoption of this standard did not have a material effect on its financial position.
Balance Sheet Classification of Deferred Taxes: In November 2015, the FASB issued ASU 2015-17, “Balance Sheet Classification of Deferred Taxes”, which requires that all deferred tax assets and liabilities be classified as non-current on the balance sheet. The amendments in ASU 2015-17 are intended to simplify the presentation of deferred income taxes. This ASU is effective for financial statements issued for fiscal years beginning after December 15, 2016 and interim periods within those fiscal years. Early adoption is permitted. The Company early adopted the ASU in the fourth quarter of the year ended July 31, 2016. This guidance did not have a material impact on the Company’s consolidated financial statements.
(2) Acquisitions
81
InsightsOne Systems, Inc.
On December 19, 2013, the Company acquired all of the outstanding shares of InsightsOne Systems, Inc. (“InsightsOne”), a provider of on-premises and cloud-based consumer lifecycle predictive analytics. This acquisition is expected to enhance the API platform capabilities to further analyze and find patterns in consumer data across multiple channels. The total purchase price was $17.1 million, which consisted primarily of Company’s Series G and Series G-1 convertible preferred stock issuances. The Company issued 511,538 shares of Series G convertible preferred stock, 681,792 shares of Series G-1 convertible preferred stock, and 16,463 RSUs in exchange for all of the outstanding preferred stock, common stock and unvested stock options outstanding of InsightsOne. The Company recorded $0.7 million of net tangible assets and $4.7 million of identifiable intangible assets, based on their estimated fair values, assumed $3.0 million of liabilities and debt, and recorded $14.7 million of goodwill.
(3) Goodwill and Intangible Assets
The following table provides a summary of changes in the carrying amount of the Company’s goodwill:
Year Ended July 31, | ||||||||||||
2016 | 2015 | 2014 | ||||||||||
(in thousands) | ||||||||||||
Balance at beginning of period | $ | 14,744 | $ | 14,744 | $ | — | ||||||
Acquisition | — | — | 14,744 | |||||||||
Balance at end of period | $ | 14,744 | $ | 14,744 | $ | 14,744 | ||||||
The following tables provide a summary of the carrying amount and accumulated amortization of the Company’s intangible assets:
July 31, 2016 | Amortization Period | Gross Amount | Accumulated Amortization | Net Carrying Value | ||||||||||
(dollars in thousands) | ||||||||||||||
Developed technology | 48-60 months | $ | 5,244 | $ | (3,079 | ) | $ | 2,165 | ||||||
Total | $ | 5,244 | $ | (3,079 | ) | $ | 2,165 | |||||||
July 31, 2015 | Amortization Period | Gross Amount | Accumulated Amortization | Net Carrying Value | ||||||||||
(dollars in thousands) | ||||||||||||||
Developed technology | 48-60 months | $ | 5,244 | $ | (2,044 | ) | $ | 3,200 | ||||||
Customer relationships | 12 months | 150 | (150 | ) | $ | — | ||||||||
Total | $ | 5,394 | $ | (2,194 | ) | $ | 3,200 | |||||||
Amortization expense was $1.0 million, $1.1 million, $0.9 million for the years ended July 31, 2016, 2015 and 2014, respectively. Expected future amortization expense as of July 31, 2016 is as follows:
Amount | |||
(in thousands) | |||
2017 | $ | 908 | |
2018 | 908 | ||
2019 | 349 | ||
Total | $ | 2,165 | |
82
(4) Fair Value Measurements
The following table sets forth the fair value of the Company’s financial assets and liabilities that were measured on a recurring basis:
As of July 31, 2016 | ||||||||||||||||
Level I | Level II | Level III | Total | |||||||||||||
(in thousands) | ||||||||||||||||
Financial Assets | ||||||||||||||||
Money market funds | $ | 65,966 | $ | — | $ | — | $ | 65,966 | ||||||||
Reported as: | ||||||||||||||||
Cash and cash equivalents | $ | 65,966 | ||||||||||||||
As of July 31, 2015 | ||||||||||||||||
Level I | Level II | Level III | Total | |||||||||||||
(in thousands) | ||||||||||||||||
Financial Assets | ||||||||||||||||
Money market funds | $ | 86,370 | $ | — | $ | — | $ | 86,370 | ||||||||
Reported as: | ||||||||||||||||
Cash and cash equivalents | $ | 86,370 | ||||||||||||||
A summary of changes in the fair value of the Company’s Level III financial liability related to the common stock warrants for the year ended July 31, 2015 is as follows:
Year Ended July 31, | ||||
2015 | ||||
(in thousands) | ||||
Fair value, beginning of period | $ | 1,254 | ||
Issuance of common stock warrants | — | |||
Change in fair value of Level III liabilities | 1,584 | |||
Exercise of common stock warrants | (2,838 | ) | ||
Fair value, end of period | $ | — | ||
(5) Common Stock Warrants
The Company has not issued any new warrants in fiscal 2016. As of July 31, 2016 and July 31, 2015, 3,495 warrants to purchase shares of common stock issued to Silicon Valley Bank in fiscal 2015 with an exercise price of $13.68 remained exercisable.
On February 14, 2013, the Company issued to one of its customers a warrant to purchase 420,901 shares of common stock with an exercise price of $1.52 per share. The warrant was provided as a sales incentive and recorded as an offset to the amount of revenue recognized from the customer. The warrant vested 50% upon achievement of each of two performance milestones. Both performance milestones were based on achieving certain targets and both were met as of July 31, 2013. The warrant agreement had an anti-dilution clause whereby, if a financing event occurred prior to December 31, 2013, the Company was obligated to issue additional warrants to the customer equal to 2% of the Company’s outstanding shares on a fully diluted basis. A financing event was defined as a sale of equity securities for capital raising purposes during the period beginning on the date of the issue of the warrants until December 31, 2013.
Due to the anti-dilution provision of the warrants, the fair value of the outstanding warrants was classified within current liabilities on the consolidated balance sheets, and any changes in fair value were recognized as a reduction of revenue prior to the achievement of the performance milestones and as a component of other expense, net after both milestones were met, in its consolidated statements of comprehensive loss. During fiscal 2014 the Company performed the final remeasurement of the
83
warrants prior to its exercise on December 17, 2013 and recorded an expense of $1.6 million, which was included in other expense, net.
The Company determined the fair value of warrants on the issuance date and subsequent reporting dates using the Black-Scholes pricing model utilizing the assumptions noted below. The expected term of the warrants was based on the remaining contractual expiration period. The expected stock price volatility for the Company’s stock was determined by examining the historical volatilities of a group of its industry peers as it did not have any trading history of its common stock. The risk-free interest rate was calculated using the average of the published interest rates for U.S. Treasury zero-coupon issues with maturities that approximate the expected term. The dividend yield assumption was zero, as the Company does not have any history of, nor plans for, dividend payments.
The following assumptions were used to estimate the fair value of the common stock warrants:
Year Ended July 31, | ||
2014 | ||
Expected volatility | 34.9 – 37.0% | |
Risk-free rate | 0.07 – 0.11% | |
Dividend yield | —% | |
Expected term (in years) | 0.28 – 0.41 | |
Fair value of common stock | $4.11 – $7.38 | |
No customer common stock warrants were issued or valued during the years ended July 31, 2016 and 2015.
(6) Balance Sheet Components
Prepaid Expenses and Other Current Assets
Prepaid expenses and other current assets consisted of the following:
July 31, | ||||||||
2016 | 2015 | |||||||
(in thousands) | ||||||||
Prepaid expenses | $ | 1,673 | $ | 2,502 | ||||
Prepaid hosting costs | 1,548 | 2,138 | ||||||
Other | 1,871 | 1,166 | ||||||
$ | 5,092 | $ | 5,806 | |||||
Property and Equipment, Net
Property and equipment are stated at cost, net of accumulated depreciation and amortization. These assets are depreciated and amortized using the straight-line method over the estimated useful lives. Property and equipment, net consisted of the following:
July 31, | ||||||||
2016 | 2015 | |||||||
(in thousands) | ||||||||
Leasehold improvements | $ | 2,553 | $ | 2,668 | ||||
Computer equipment and software | 1,777 | 2,600 | ||||||
Furniture and fixtures | 680 | 671 | ||||||
5,010 | 5,939 | |||||||
Less: accumulated depreciation and amortization | (3,087 | ) | (2,795 | ) | ||||
$ | 1,923 | $ | 3,144 | |||||
84
Total depreciation expense for the years ended July 31, 2016, 2015 and 2014 was $1.4 million, $1.3 million, and $1.2 million, respectively.
Accrued Liabilities
Accrued expenses and other current liabilities consisted of the following:
July 31, | ||||||||
2016 | 2015 | |||||||
(in thousands) | ||||||||
Accrued bonuses and commissions | $ | 3,300 | $ | 3,243 | ||||
Accrued sales, service and income taxes | 3,085 | 2,291 | ||||||
Accrued payroll and benefits | 1,375 | 1,702 | ||||||
Other | 3,487 | 2,560 | ||||||
$ | 11,247 | $ | 9,796 | |||||
Deferred Revenue
Deferred revenue consisted of the following:
July 31, | ||||||||
2016 | 2015 | |||||||
(in thousands) | ||||||||
Deferred revenue: | ||||||||
License | $ | 5,548 | $ | 8,066 | ||||
Subscription | 28,529 | 19,856 | ||||||
Support | 11,415 | 8,716 | ||||||
Professional services and other | 8,397 | 4,164 | ||||||
Total deferred revenue | 53,889 | 40,802 | ||||||
Less: current portion of deferred revenue | (44,833 | ) | (35,648 | ) | ||||
Non-current portion of deferred revenue | $ | 9,056 | $ | 5,154 | ||||
(7) Income Taxes
Loss before provision for income taxes consisted of the following for the periods shown below:
Year Ended July 31, | ||||||||||||
2016 | 2015 | 2014 | ||||||||||
(in thousands) | ||||||||||||
United States | $ | (42,770 | ) | $ | (51,336 | ) | $ | (61,957 | ) | |||
International | 1,473 | 1,410 | 1,556 | |||||||||
Total | $ | (41,297 | ) | $ | (49,926 | ) | $ | (60,401 | ) | |||
85
Income tax expense consisted of the following for the periods shown below:
Year Ended July 31, | ||||||||||||
2016 | 2015 | 2014 | ||||||||||
(in thousands) | ||||||||||||
Current income tax provision: | ||||||||||||
Federal | $ | — | $ | — | $ | — | ||||||
State | — | 4 | — | |||||||||
Foreign | 278 | 423 | 476 | |||||||||
Total current tax provision | $ | 278 | $ | 427 | $ | 476 | ||||||
Deferred income tax provision | ||||||||||||
Federal | — | — | — | |||||||||
State | — | — | (96 | ) | ||||||||
Foreign | (63 | ) | — | 12 | ||||||||
Total deferred tax provision | (63 | ) | — | (84 | ) | |||||||
Total income tax provision | $ | 215 | $ | 427 | $ | 392 | ||||||
For the fiscal years ended July 31, 2016, 2015 and 2014, the Company’s tax provision consisted principally of foreign income tax expense.
The reconciliation of federal statutory income tax provision to the Company’s effective income tax provision is as follows:
Year Ended July 31, | ||||||||||||
2016 | 2015 | 2014 | ||||||||||
(in thousands) | ||||||||||||
Expected provision at U.S. federal statutory rate | $ | (14,039 | ) | $ | (16,975 | ) | $ | (20,536 | ) | |||
State income taxes—net of federal benefit | — | 2 | (96 | ) | ||||||||
Stock-based compensation | 78 | 668 | 98 | |||||||||
Common stock warrant | — | — | 63 | |||||||||
Tax credits | (941 | ) | (391 | ) | (225 | ) | ||||||
Foreign tax rate differential | (30 | ) | (80 | ) | (67 | ) | ||||||
Acquisition costs | — | — | 125 | |||||||||
Change in valuation allowance | 15,301 | 17,570 | 20,790 | |||||||||
Other | (154 | ) | (367 | ) | 240 | |||||||
Total tax provision | $ | 215 | $ | 427 | $ | 392 | ||||||
86
Deferred tax assets and liabilities consisted of the following:
July 31, | ||||||||
2016 | 2015 | |||||||
(in thousands) | ||||||||
Deferred tax assets: | ||||||||
Net operating loss carryforwards | $ | 81,822 | $ | 75,812 | ||||
Accrued liabilities | 1,482 | 1,280 | ||||||
Tax credit carryforwards | 5,859 | 3,759 | ||||||
Fixed assets | 269 | 157 | ||||||
Deferred revenue | 2,207 | 733 | ||||||
Stock-based compensation | 1,996 | 806 | ||||||
Other | 1 | 1 | ||||||
Valuation allowance | (92,846 | ) | (81,341 | ) | ||||
Total deferred tax assets | 790 | 1,207 | ||||||
Deferred tax liabilities: | ||||||||
Intangible assets | (684 | ) | (1,163 | ) | ||||
Total deferred tax liabilities | (684 | ) | (1,163 | ) | ||||
Net deferred tax assets | $ | 106 | $ | 44 | ||||
July 31, | ||||||||
2016 | 2015 | |||||||
(in thousands) | ||||||||
Recorded as: | ||||||||
Current deferred tax assets | $ | — | $ | 1,076 | ||||
Current valuation allowance | — | (1,050 | ) | |||||
Non-current deferred tax assets | 92,908 | 81,477 | ||||||
Non-current valuation allowance | (92,802 | ) | (80,291 | ) | ||||
Current deferred tax liabilities | — | (5 | ) | |||||
Non-current deferred tax liabilities | — | (1,163 | ) | |||||
Net deferred tax assets | $ | 106 | $ | 44 | ||||
The Company determines its valuation allowance on deferred tax assets by considering both positive and negative evidence, including operating results, history of losses, and forecasts of future taxable income in various U.S. and foreign jurisdictions, in order to ascertain whether it is more likely than not that deferred tax assets will be realized. The Company records a valuation allowance to reduce the amount of deferred tax assets to the amount that is more likely than not to be realized. Realization of deferred tax assets is dependent upon the generation of future taxable income, if any, the timing and amount of which are uncertain. Accordingly, the U.S. net deferred tax assets have been fully offset by a valuation allowance. A valuation allowance has not been recorded on certain foreign deferred net tax assets because these assets are expected to be realized on a more likely than not basis. The valuation allowance increased by $11.5 million and $23.1 million, respectively, during the years ended July 31, 2016 and 2015.
As of July 31, 2016 and 2015, the Company had net operating loss carryforwards for federal income tax purposes of $224.1 million and $193.3 million, respectively, which expire in the years 2024 through 2035. As of July 31, 2016 and 2015, the Company had net operating loss carryforwards for California state income tax purposes of $80.4 million and $162.5 million, respectively, which expire in the years 2016 through 2035. We had elected the three-factor apportionment formula pursuant to the Multistate Tax Compact, or MTC, in determining the state net operating loss carryforwards for certain years. In December 2015, the California Supreme Court overturned the California Appellate court decision on The Gillette Company et al. v. California Franchise Tax Board. The court held that the taxpayers couldn’t elect an evenly weighted, three-factor apportionment formula pursuant to the MTC. As a result of the California Supreme Court decision, we reduced our deferred tax assets and offsetting valuation allowance related to the California NOL calculated in earlier years pursuant to the MTC election.
87
As of July 31, 2016 and 2015, the Company had R&D credit carryforwards for federal income tax purposes of $5.0 million and $3.1 million respectively, which expire in the years 2024 through 2035. As of July 31, 2016 and 2015, the Company had R&D credit carryforwards for California income tax purposes of $4.2 million and $2.9 million respectively, which have no expiration date.
The Code, as amended, imposes restrictions on the utilization of net operating losses in the event of an “ownership change” of a corporation. Accordingly, a company’s ability to use net operating losses may be limited as prescribed under Internal Revenue Code Section 382 (“IRC Section 382”). Utilization of the federal and state net operating losses may be subject to substantial annual limitation due to the ownership change limitations provided by the IRC Section 382 and similar state provisions. Based on an analysis under Section 382 of the Internal Revenue Code, the Company experienced an ownership change in 2005 which substantially limits the future use of NOLs and certain other pre-change tax attributes as of that date. The Company has excluded the NOLs and R&D credits that will expire as a result of the annual limitations in the deferred tax assets as of July 31, 2016. To the extent that the Company does not utilize the carryforwards within the applicable statutory carryforward periods, either because of Section 382 limitations or the lack of sufficient taxable income, the carryforwards will expire unused.
The Company intends to reinvest its foreign earnings indefinitely. Accordingly, no U.S. income taxes have been provided on approximately $4.0 million of undistributed earnings and other outside basis differences of foreign subsidiaries. As of July 31, 2016, it is not practicable for the Company to determine the potential income tax impact of remitting these earnings.
The Company and its subsidiaries file income tax returns in the U.S. and in various states, local, and foreign jurisdictions. The tax years generally remain subject to examination by federal and most state tax authorities due to the ability to adjust net operating losses and credits. In significant foreign jurisdictions, the tax years generally remain subject to examination by their respective tax authorities. The Company is currently being audited by the India taxing authorities related to transfer pricing. Management has recorded a long-term tax liability for uncertain tax positions, including accrued interest and penalties.
Uncertain Income Tax Positions
The Company accounts for uncertainty in income taxes by determining whether it is more likely than not that a tax position will be sustained upon examination by the appropriate taxing authorities before any part of the benefit can be recorded in the consolidated financial statements.
The following table summarizes the activity related to the Company’s unrecognized tax benefits:
July 31, | ||||||||
2016 | 2015 | |||||||
(in thousands) | ||||||||
Balance at beginning of year | $ | 1,805 | $ | 1,273 | ||||
Increase related to prior year tax positions | 202 | 194 | ||||||
Decrease related to prior year tax positions | (13 | ) | (20 | ) | ||||
Increase related to current year tax positions | 605 | 358 | ||||||
Decrease related to lapse of statute of limitations | (48 | ) | — | |||||
Balance at end of year | $ | 2,551 | $ | 1,805 | ||||
If the gross unrecognized tax benefits at July 31, 2016 were recognized, $0.2 million of the recognition would affect the effective income tax rate. The Company is unable to make a reasonably reliable estimate as to when cash settlement with a taxing authority may occur. It is reasonably possible that the total amount of unrecognized tax benefits will increase or decrease in the next 12 months.
The Company also recognizes interest and penalties accrued in relation to unrecognized tax benefits as a tax expense. For the years ended July 31, 2016, 2015 and 2014, the Company recorded charges to tax expense of $33,000, $36,000 and $39,000 for interest and penalties, respectively. As of July 31, 2016 and 2015, the Company had $0.4 million and $0.5 million of accrued interest and penalties, which are included in non-current income tax liabilities in the consolidated balance sheets.
88
(8) Long-term Debt
In May 2012, we entered into a Loan and Security Agreement with Silicon Valley Bank (“SVB”), which was amended and restated in November 2014 and further amended on March 2, 2016 and May 23, 2016 (the “Loan Agreement”). As amended, the Loan Agreement provides us with the ability to borrow up to $25.0 million through a revolving line of credit, $7.5 million of which can be advanced at any time during the draw period and $17.5 million of which is subject to an accounts receivable borrowing base. We can draw upon the revolving line of credit through October 31, 2019, when all outstanding principal and accrued and unpaid interest becomes due and payable, and the revolving loans bear interest at a rate equal to the Prime Rate (as defined in the Loan Agreement the “Prime Rate”) plus 0.5% per annum (equal to 4.0% at July 31, 2016). Outstanding revolving loans subject to the accounts receivable borrowing base are limited to the lesser of (a) $17.5 million or (b) 80% of the balance of certain eligible customer accounts receivable plus the greater of $6.0 million million or 30% of eligible foreign accounts receivable. As of July 31, 2016, we had not drawn on the revolving line of credit. Pursuant to the March 2, 2016 amendment, we also procured a supplemental term loan of $2.65 million, which refinanced, replaced and superseded our pre-existing term loan and equipment term loan in their entirety, and paid off the $156,250 end-of-term payment on the outstanding portion of the term loan. We will repay the outstanding principal of the supplemental term loan in monthly installments, plus interest at a rate equal to the Prime Rate plus 0.25% per annum (equal to 3.75% at July 31, 2016), with the last payment due in March 2018. So long as we are not in default, we are permitted to prepay the supplemental term loan in full without premium or penalty.
The Loan Agreement contains customary affirmative covenants and certain financial and negative covenants, including restrictions on disposing of assets, entering into change of control transactions, mergers or acquisitions, incurring additional indebtedness, granting liens on our assets and paying dividends. After the March 2, 2016 amendment, we are required to maintain a minimum adjusted quick ratio of 1.75:1 and a minimum total revenue of $35 million for the six months ended January 31, 2016, $54 million for the nine months ending April 30, 2016 and $74.75 million for the twelve months ending July 31, 2016. For fiscal quarters after July 31, 2016, the minimum total revenue we are required to maintain will be based on our annual plan for the next fiscal year using criteria consistent with the covenant for the twelve months ending July 31, 2016 (as approved by our board of directors). The minimum total revenue requirement for all future periods ending after July 31, 2016 will be subject to further adjustment by SVB. Stemming from non-compliance with a loan covenant at April 30, 2016, on May 23, 2016 we received a waiver of this requirement from SVB and amended the Loan Agreement to modify certain financial covenants. As of July 31, 2016 and 2015, we were in compliance with all loan covenants. We have pledged substantially all of our assets, other than our intellectual property, as collateral under the Loan Agreement.
The Loan Agreement contains customary events of default that include, among others, payment defaults, covenant defaults, bankruptcy defaults, cross-defaults to certain other obligations, judgment defaults and inaccuracy of representations and warranties. Upon the occurrence of an event of default, SVB may elect to declare all amounts outstanding under the Loan and Security Agreement to be immediately due and payable and terminate all commitments to extend further credit. If the Company is unable to repay all amounts outstanding, SVB can proceed against the collateral granted to them to secure such indebtedness. In addition, the occurrence of an event of default will increase the applicable rate of interest by three percentage points for the applicable unpaid loan(s). As of July 31, 2016 and 2015, the Company was in compliance with all loan covenants.
The Company’s outstanding loan balances as of July 31, 2016 and July 31, 2015 are summarized as follows:
July 31, | ||||||||
Outstanding Loan Balances | 2016 | 2015 | ||||||
(in thousands) | ||||||||
Silicon Valley Bank term loan | $ | — | $ | 2,934 | ||||
Silicon Valley Bank equipment loan | — | 958 | ||||||
Silicon Valley Bank supplemental loan | 2,207 | — | ||||||
Total principal amount | 2,207 | 3,892 | ||||||
Less: Unamortized discount | (7 | ) | (26 | ) | ||||
Total debt | 2,200 | 3,866 | ||||||
Less: current portion | (1,318 | ) | (2,079 | ) | ||||
Non-current debt, excluding current portion | $ | 882 | $ | 1,787 | ||||
89
The future principal maturities of debt as of July 31, 2016 are as follows:
(in thousands) | |||
2017 | $ | 1,324 | |
2018 | 883 | ||
Total | $ | 2,207 | |
In connection with the original Loan Agreement, the Company issued SVB warrants (“SVB warrants”) to purchase 3,495 shares of common stock during the year ended July 31, 2015. On May 13, 2015, 65,788 warrant shares issued in earlier periods were net exercised on a cashless basis resulting in issuance of 57,082 common shares. Warrants to purchase 3,495 shares have an exercise price of $13.68 and expire in November 2024. The fair value of the SVB warrants was determined using the Black-Scholes option valuation model. As of July 31, 2016 and 2015, 3,495 of these warrants to purchase shares of common stock remained outstanding and exercisable. There were no warrants issued to SVB during the year ended July 31, 2016.
The following assumptions were used to estimate the fair value of the SVB warrants:
Year Ended July 31, | ||||
2015 | 2014 | |||
Expected volatility | 42.0% | —% | ||
Risk-free interest rate | 2.3% | —% | ||
Dividend yield | —% | —% | ||
Expected term (in years) | 10.0 | — | ||
(9) Commitments and Contingencies
Leases
The Company leases office space in San Jose, California; London, England; and Sydney, Australia under non-cancelable operating leases with various expiration dates through 2019. Rent expense was $2.1 million, $2.3 million and $2.5 million for the years ended July 31, 2016, 2015 and 2014, respectively.
Future minimum lease payments under non-cancelable operating leases as of July 31, 2016 are as follows:
(in thousands) | |||
2017 | $ | 2,131 | |
2018 | 1,851 | ||
2019 | 1,655 | ||
Total future minimum operating lease payments | $ | 5,637 | |
Letters of Credit
As of July 31, 2016, the Company had a total of $0.5 million in letters of credit outstanding related to its leased office space in San Jose, California. The letters of credit are collateralized by substantially all of the Company’s assets, excluding its intellectual property. These letters of credit renew annually and mature at various dates through June 30, 2019.
Legal Matters and Contingencies
The Company makes a provision for a liability relating to legal matters and loss contingencies when it is both probable that a liability has been or will be incurred and the amount of the loss can be reasonably estimated.
Beginning on March 17, 2016, four purported shareholder class action complaints were filed in the Superior Court of the State of California, County of San Mateo, against the Company, the Company’s directors, certain of the Company’s executive officers, the underwriters of the Company’s IPO and other defendants. The lawsuits were brought by purported stockholders of the Company seeking to represent a class consisting of all purchasers of the Company’s common stock
90
pursuant or traceable to the Registration Statement and Prospectus issued in connection with the Company’s IPO. These complaints allege claims under federal securities laws that such Registration Statement and Prospectus contained false and/or misleading statements or omissions. These complaints seek unspecified compensatory damages and other relief. The Company believes that the claims are without merit and intends to defend these lawsuits vigorously.
From time to time, the Company may become a party to other litigation and subject to claims incident to the ordinary course of business, including intellectual property claims, labor and employment claims, and threatened claims, breach of contract claims, tax, and other matters. The Company is not presently a party to any other legal proceedings that, if determined adversely to us, would individually or taken together have a material adverse effect on our business, operating results, financial condition or cash flows.
Indemnification Arrangements
In the ordinary course of business, the Company enters into contractual arrangements under which it agrees to provide indemnification of varying scope and terms to customers, business partners and other parties with respect to certain matters, including, losses arising out of the breach of such agreements, intellectual property infringement claims made by third parties, and other liabilities with respect to the Company’s products and services and its business. In these circumstances, payment may be conditional on the other party making a claim pursuant to the procedures specified in the particular contract.
The Company includes service level commitments to its cloud customers warranting certain levels of uptime reliability and performance and permitting those customers to receive credits in the event that it fails to meet those levels. To date, the Company has not incurred any material costs as a result of these commitments and the Company expects the time between any potential claims and issuance of the credits to be short. As a result, the Company has not accrued any liabilities related to these commitments in the Company’s consolidated financial statements.
In addition, the Company has indemnification agreements with its directors and certain of its executive officers that require the Company, among other things, to indemnify them against certain liabilities that may arise by reason of their status or service as directors or officers.
(10) Segment Information and Information About Geographic Areas
Revenue by geography is based on the shipping address of the customer. The following tables present the Company’s revenue by geographic region for the periods presented:
Year Ended July 31, | ||||||||||||
2016 | 2015 | 2014 | ||||||||||
(in thousands) | ||||||||||||
United States | $ | 58,931 | $ | 42,295 | $ | 35,434 | ||||||
United Kingdom | 8,077 | 8,319 | 4,049 | |||||||||
Rest of the world | 25,019 | 17,993 | 13,219 | |||||||||
$ | 92,027 | $ | 68,607 | $ | 52,702 | |||||||
No individual country other than the United States and the United Kingdom accounted for more than 10% of total revenue during any of the periods presented.
Long-lived assets by geographic area were as follows:
July 31, | ||||||||
2016 | 2015 | |||||||
(in thousands) | ||||||||
United States | $ | 18,421 | $ | 20,252 | ||||
Rest of the world | 411 | 836 | ||||||
$ | 18,832 | $ | 21,088 | |||||
91
(11) Stockholders’ Equity
Common Stock
Upon completion of the IPO, the Company’s certificate of incorporation was amended and restated to increase the amount of common stock authorized for issuance from 30,263,157 to 1,000,000,000 shares of $0.001 par value of common stock.
Convertible Preferred Stock
Upon completion of the IPO, all shares of the Company’s issued and outstanding convertible preferred stock were automatically converted into 19,818,172 shares of common stock and the Company’s certificate of incorporation was amended and restated to authorize the Company to issue 200,000,000 shares of preferred stock with a par value of $0.001 per share.
(12) Stock Incentive Plan
2005 Stock Incentive Plan
In 2005, the Company adopted the 2005 Stock Incentive Plan (the “2005 Plan”), which was amended in April 2014. The 2005 Plan was terminated in connection with the IPO with respect to the granting of future awards, and accordingly, no shares are available for future issuance under this plan. All shares that were reserved but not issued under the 2005 Plan as of immediately prior to its termination became available for issuance under the 2015 Equity Incentive Plan (the “2015 Plan”) upon its adoption. Shares reserved for issuance pursuant to awards under the 2005 Plan that expire or terminate without having been exercised subsequent to the IPO or are forfeited to or repurchased by the Company subsequent to the IPO became available for issuance under the 2015 Plan, subject to the limits set forth in the 2015 Plan.
2015 Equity Incentive Plan
In April 2015, the Board adopted and the Company’s stockholders approved the 2015 Equity Incentive Plan (the “2015 Plan”), which became effective upon the effectiveness of the registration statement in connection with our IPO. As of such date, an aggregate of 2,700,000 shares of common stock were reserved for issuance under the 2015 Plan, plus (a) those shares reserved but unissued under our 2005 Plan as of immediately prior to the termination of the 2005 Plan and (b) shares subject to options, restricted stock units, or similar awards granted under the 2005 Plan that, after the effectiveness of the registration statement, expire or otherwise terminate without having been exercised or issued in full and shares issued pursuant to awards granted under the 2005 Plan that, after the effectiveness of the registration statement, are forfeited to or repurchased by the Company (provided that the maximum number of shares that may be added to the 2015 Plan pursuant to (a) and (b) is 4,515,212 shares). Additionally, the 2015 Plan provides that the number of shares reserved and available for issuance will increase annually on the first day of each fiscal year beginning with the 2016 fiscal year equal to the least of (i) 3,100,000 shares of Common Stock, (ii) 4% of the outstanding shares of Common Stock on the last day of immediately preceding fiscal year, or (iii) an amount determined by the board of directors.
The 2015 Plan provides for the grant of incentive stock options, within the meaning of Section 422 of the Code, to the Company’s employees and any parent and subsidiary corporations’ employees, and for the grant of nonstatutory stock options, restricted stock, restricted stock units, stock appreciation rights, performance units and performance shares to the Company’s employees, directors and consultants and its parent and subsidiary corporations’ employees and consultants.
As of July 31, 2016, an aggregate of 4,349,738 common shares were reserved under the 2015 Plan, of which 430,729 shares remained available for issuance.
2015 Employee Stock Purchase Plan
The Company’s Board of Directors adopted and the Company’s stockholders approved the 2015 Employee Stock Purchase Plan (the “ESPP”) with the first offering period under the ESPP beginning on the effectiveness of the registration statement in connection with our IPO. As of such date, an aggregate of 775,000 shares of common stock were reserved and are available for issuance under the ESPP. Additionally, the ESPP provides that the number of shares reserved and available for issuance will increase annually on the first day of each fiscal year beginning with the 2016 fiscal year equal to the least of (i) 775,000 shares of Common Stock, (ii) 1% of the outstanding shares of Common Stock on the last day of immediately preceding fiscal year, or (iii) an amount determined by the ESPP administrator.
92
The ESPP allows eligible employees to purchase shares of common stock at a discount through payroll deductions of up to 15% of their eligible compensation, at 85% of the fair market value, as defined in the ESPP, on the first day of the offering period or the last day of the purchase period, whichever is lower, and subject to any plan limitations. The ESPP provides for consecutive six-month offering periods, starting on the first trading day on or after June 15 and December 15 of each year. The first offering period began on the first trading day on the effective date of the registration statement and ended on December 15, 2015. During the year ended July 31, 2016, a total of 296,411 shares were purchased by and distributed to employees at an average price of $6.94 per share.
As of July 31, 2016, 772,454 shares were reserved for future issuance under the 2015 ESPP.
Stock-based Compensation Expense
The total stock-based compensation expense recognized for stock-based awards under the Company’s equity plans in the consolidated statements of comprehensive loss was as follows:
Year Ended July 31, | ||||||||||||
2016 | 2015 | 2014 | ||||||||||
(in thousands) | ||||||||||||
Cost of subscription and support revenue | $ | 147 | $ | 44 | $ | 24 | ||||||
Cost of professional services and other revenue | 520 | 223 | 133 | |||||||||
Research and development | 3,592 | 1,195 | 490 | |||||||||
Sales and marketing | 1,808 | 777 | 1,090 | |||||||||
General and administrative | 2,321 | 1,212 | 989 | |||||||||
Total stock-based compensation expense | $ | 8,388 | $ | 3,451 | $ | 2,726 | ||||||
The total stock-based compensation expense for stock options awarded to non-employees included above was immaterial for all periods presented.
Stock Options
A summary of activity under the Company’s equity plans and related information was as follows:
Options Outstanding | |||||||||||||
Number of Shares Underlying Outstanding Options | Weighted- Average Exercise Price | Weighted- Average Remaining Contractual Life (Years) | Aggregate Intrinsic Value (In thousands) | ||||||||||
Balances at July 31, 2013 | 3,262,518 | $ | 1.10 | 7.82 | $ | 9,807 | |||||||
Options granted | 1,664,158 | 4.79 | |||||||||||
Options exercised | (545,370 | ) | 0.84 | ||||||||||
Options canceled | (372,581 | ) | 2.86 | ||||||||||
Balances at July 31, 2014 | 4,008,725 | 2.51 | 7.65 | 31,716 | |||||||||
Options granted | 1,213,344 | 14.39 | |||||||||||
Options exercised | (465,385 | ) | 2.07 | ||||||||||
Options canceled | (481,233 | ) | 4.04 | ||||||||||
Balances at July 31, 2015 | 4,275,451 | 5.75 | 7.29 | 17,468 | |||||||||
Options granted | 1,449,350 | 9.50 | |||||||||||
Options exercised | (625,496 | ) | 1.86 | ||||||||||
Options canceled | (460,213 | ) | 7.87 | ||||||||||
Balances at July 31, 2016 | 4,639,092 | $ | 7.24 | 7.15 | $ | 24,146 | |||||||
Exercisable at July 31, 2016 | 2,372,431 | $ | 4.27 | 5.55 | $ | 19,375 | |||||||
Vested and expected to vest at July 31, 2016 | 4,207,727 | $ | 6.93 | 7.00 | $ | 23,169 | |||||||
93
Aggregate intrinsic value represents the difference between the fair market value based on the valuation of the common stock as determined by the Company’s Board of Directors prior to the IPO, or the closing market price of the Company’s common stock, following the IPO, and the exercise price of the in-the-money stock options.
No income tax benefit has been recognized relating to stock-based compensation expense and no tax benefits have been realized from exercised stock options. The weighted-average grant-date fair value of options granted during the years ended July 31, 2016, 2015, and 2014 was $4.19, $6.21, and $2.63 per share, respectively. The total intrinsic value of stock options exercised during the years ended July 31, 2016, 2015 and 2014 was $4.7 million, $6.1 million and $3.6 million, respectively. The total fair value of options vested during the years ended July 31, 2016, 2015 and 2014 was $3.2 million, $1.7 million and $0.7 million, respectively. As of July 31, 2016, there was total unrecognized stock-based compensation cost of $7.4 million related to unvested stock options, net of estimated forfeitures, which is expected to be recognized over a weighted-average period of 2.9 years.
The following table summarizes information about stock options outstanding under the Company’s equity plans as of July 31, 2016:
Options Outstanding | Options Exercisable | |||||||||||||||||
Exercise Price | Number of Options Outstanding | Weighted- Average Remaining Contractual Life (Years) | Weighted- Average Exercise Price per Share | Number of Options Exercisable | Weighted- Average Exercise Price Per Share | |||||||||||||
$ | 0.46 | 216,420 | 4.82 | $ | 0.46 | 216,420 | $ | 0.46 | ||||||||||
$ | 0.61 | 21,707 | 2.50 | 0.61 | 21,707 | 0.61 | ||||||||||||
$ | 0.68 | 490,335 | 5.67 | 0.68 | 455,795 | 0.68 | ||||||||||||
$ | 1.06 | 436,699 | 0.45 | 1.06 | 436,699 | 1.06 | ||||||||||||
$ | 1.52 | 89,895 | 6.13 | 1.52 | 86,859 | 1.52 | ||||||||||||
$ | 1.75 | 105,131 | 6.65 | 1.75 | 89,002 | 1.75 | ||||||||||||
$ | 3.65 | 84,238 | 6.90 | 3.65 | 61,775 | 3.65 | ||||||||||||
$ | 4.10 | 633,700 | 7.17 | 4.10 | 471,529 | 4.10 | ||||||||||||
$ | 4.26 | 38,948 | 7.38 | 4.26 | 25,050 | 4.26 | ||||||||||||
$ | 7.37 | 98,380 | 7.60 | 7.37 | 59,751 | 7.37 | ||||||||||||
$ | 7.41 | 527,050 | 9.08 | 7.41 | — | — | ||||||||||||
$ | 7.70 | 54,450 | 9.63 | 7.70 | — | — | ||||||||||||
$ | 8.05 | 62,000 | 9.38 | 8.05 | — | — | ||||||||||||
$ | 8.20 | 57,000 | 9.46 | 8.20 | — | — | ||||||||||||
$ | 8.32 | 37,000 | 9.13 | 8.32 | — | — | ||||||||||||
$ | 8.37 | 42,100 | 9.48 | 8.37 | — | — | ||||||||||||
$ | 9.12 | 64,568 | 7.84 | 9.12 | 36,452 | 9.12 | ||||||||||||
$ | 9.60 | 18,000 | 9.72 | 9.60 | — | — | ||||||||||||
$ | 10.41 | 100,100 | 8.05 | 10.41 | 51,795 | 10.41 | ||||||||||||
$ | 10.78 | 62,250 | 9.23 | 10.78 | — | — | ||||||||||||
$ | 10.86 | 16,700 | 8.90 | 10.86 | 5,300 | 10.86 | ||||||||||||
$ | 11.96 | 25,000 | 9.97 | 11.96 | — | — | ||||||||||||
$ | 12.69 | 307,701 | 8.24 | 12.69 | 127,500 | 12.69 | ||||||||||||
$ | 12.96 | 447,100 | 9.89 | 12.96 | 625 | 12.96 | ||||||||||||
$ | 13.68 | 102,338 | 8.30 | 13.68 | 44,394 | 13.68 | ||||||||||||
$ | 15.88 | 153,172 | 8.40 | 15.88 | 66,913 | 15.88 | ||||||||||||
$ | 17.56 | 347,110 | 8.64 | 17.56 | 114,865 | 17.56 | ||||||||||||
4,639,092 | 7.15 | $ | 7.24 | 2,372,431 | $ | 4.27 | ||||||||||||
94
Valuation Assumptions
The Company estimates the fair value of each stock-based award on the date of grant using the Black-Scholes option pricing model utilizing the assumptions noted below. The expected term of the stock-based awards is based on the average period the stock-based awards are expected to remain outstanding calculated as the midpoint of the stock-based awards’ vesting terms and contractual expiration periods, as the Company does not have sufficient historical information to develop reasonable expectations about future exercise patterns and post-vesting employment termination behavior. The expected stock price volatility for the Company’s common stock was determined by examining the historical volatilities of a group of its industry peers as it does not have sufficient trading history of the Company’s common stock. The risk-free interest rate was calculated using the average of the published interest rates for United States Treasury zero-coupon issues with maturities that approximate the expected term. The dividend yield assumption is zero as the Company does not have any history of, nor plans to make, dividend payments. Forfeitures were estimated at the time of grant and revised, if necessary, in subsequent periods if actual forfeitures differed from those estimates. Forfeitures were estimated based on historical experience. The fair value of the common stock was historically determined by the Company’s board of directors given the absence of a public trading market prior to its IPO. The board of directors determined the fair value of the common stock at the time of the stock-based award grant by considering a number of objective and subjective factors, including valuations of comparable companies, operating and financial performance, lack of liquidity of capital stock and general and industry-specific economic outlooks, amongst other factors. Since the Company’s IPO, the Company has used the market closing price of the common stock as reported on the NASDAQ Global Select Market.
The following assumptions were used to estimate the fair value of options granted:
Year Ended July 31, | |||||||||
2016 | 2015 | 2014 | |||||||
Expected term (in years) | 5.5 – 6.2 | 5.8 – 6.4 | 5.5 – 6.9 | ||||||
Risk-free interest rate | 1.3 –1.9 | 1.5 –1.9 | 1.7 – 2.3 | ||||||
Expected volatility | 43 – 45 | 39 – 44 | 48 – 50 | ||||||
Dividend yield | — | % | — | % | — | % | |||
Fair value of common stock | $7.41 – $12.96 | $10.41 – $17.56 | $4.11 – $9.12 | ||||||
The following assumptions were used to estimate the fair value of ESPP shares:
Year Ended July 31, | |||||||
2016 | 2015 | ||||||
Expected term (in years) | 0.5 | 0.7 | |||||
Risk-free interest rate | 0.4% – 0.5% | 0.1 | % | ||||
Expected volatility | 36% – 40% | 30 | % | ||||
Dividend yield | — | % | — | % | |||
Fair value of common stock | $8.27 – $12.81 | $ | 17.00 | ||||
Employee Stock Purchase Plan
As of July 31, 2016, the remaining unamortized expense related to the Company’s 2015 ESPP Plan was $0.4 million, which will be recognized over a weighted-average remaining period of 0.4 years.
Series G-1 Stock
Stock-based compensation expense for the year ended July 31, 2016 and 2015 included $0.2 million and $0.6 million, respectively, of amortization expense for Series G-1 convertible preferred stock (which have since been converted to common stock) issued to former employees of InsightsOne. The awards are subject to vesting on a monthly basis over certain vesting periods.
As of July 31, 2016, the remaining unamortized expense related to these shares was less than $0.1 million, which will be recognized over a weighted-average remaining period of 0.4 years.
95
Restricted Stock Units
A summary of RSUs under the Company’s equity plans and related information was as follows:
RSUs Outstanding | Aggregate Intrinsic Value (In thousands) | ||||||||||||
Number of Shares | Weighted- Average Grant- Date Fair Value | Weighted- Average Remaining Contractual Life (Years) | |||||||||||
Balances at July 31, 2013 | 66,775 | $ | 1.05 | ||||||||||
Granted | 20,343 | 7.48 | |||||||||||
Released | (70,655 | ) | 1.43 | ||||||||||
Forfeited | (657 | ) | 7.38 | ||||||||||
Balances at July 31, 2014 | 15,806 | 7.38 | |||||||||||
Granted | 266,257 | 13.92 | |||||||||||
Released | — | — | |||||||||||
Forfeited | (2,917 | ) | 7.38 | ||||||||||
Balances at July 31, 2015 | 279,146 | 13.68 | 3.58 | $ | 2,247 | ||||||||
Granted | 2,564,275 | 8.93 | |||||||||||
Released | (156,708 | ) | 10.70 | ||||||||||
Forfeited | (261,819 | ) | 8.65 | ||||||||||
Balances at July 31, 2016 | 2,424,894 | $ | 9.39 | 3.27 | $ | 30,166 | |||||||
The Company grants RSUs as part of total stock compensation and such grants may have time-based vesting, performance-based vesting or a combination of the two. The fair value of time-based RSUs is determined using the closing market price on the date of grant. As of July 31, 2016, the remaining unamortized expense related to all RSUs was $7.9 million which will be recognized over a weighted-average remaining period of 3.3 years.
There were RSUs granted in connection with the acquisition of InsightsOne in fiscal 2014. Such RSUs are subject to a time-based vesting condition and a performance-based vesting condition, both of which must be satisfied before these RSUs are vested and settled for shares of common stock. The time-based vesting condition is three years and the performance-based vesting condition was satisfied upon the completion of the Company’s initial public offering in April 2015. The remaining expense is de minimus.
(13) Net Loss Per Share
The Company computes net loss per share of common stock in conformity with the two-class method required for participating securities. The Company considers all series of the convertible preferred stock to be participating securities as the holders of the preferred stock are entitled to receive a non-cumulative dividend on a pari passu basis in the event that a dividend is paid on the common stock. The holders of the convertible preferred stock do not have a contractual obligation to share in the Company’s losses. As such, the Company’s net losses for the years ended July 31, 2016, 2015 and 2014 were not allocated to these participating securities.
Basic net loss per share attributable to common stockholders is computed by dividing the net loss attributable to common stockholders by the weighted-average number of shares of common stock outstanding during the period. Diluted net loss per share is computed by giving effect to all potential shares of common stock, including common stock issuable upon conversion of the convertible preferred stock, outstanding stock-based awards, and outstanding warrants, to the extent dilutive. Basic and diluted net loss per share was the same for each period presented as the inclusion of all potential common stock outstanding would have been anti-dilutive.
96
The following table presents the calculation of basic and diluted net loss per share for the periods presented:
Year Ended July 31, | ||||||||||||
2016 | 2015 | 2014 | ||||||||||
(in thousands except per share amounts) | ||||||||||||
Numerator: | ||||||||||||
Net loss | $ | (41,512 | ) | $ | (50,353 | ) | $ | (60,793 | ) | |||
Denominator: | ||||||||||||
Weighted-average shares used to compute net loss per share, basic and diluted | 29,769 | 10,651 | 3,413 | |||||||||
Net loss per share, basic and diluted | $ | (1.39 | ) | $ | (4.73 | ) | $ | (17.81 | ) | |||
Since the Company was in a loss position for all periods presented, basic net loss per share is the same as diluted net loss per share as the inclusion of all potential common shares outstanding would have been anti-dilutive. Potentially dilutive securities that were not included in the diluted per share calculations because they would be anti-dilutive were as follows:
Year Ended July 31, | |||||||||
2016 | 2015 | 2014 | |||||||
(in thousands) | |||||||||
Shares subject to outstanding common stock options | 4,639 | 4,275 | 4,009 | ||||||
Convertible preferred stock (on an as if converted basis) | — | — | 19,811 | ||||||
Restricted stock units | 2,425 | 279 | 16 | ||||||
Shares subject to employee stock purchase plan | 207 | 206 | — | ||||||
Restricted common stock | 3 | 45 | — | ||||||
Shares subject to common stock warrants | 3 | 3 | 66 | ||||||
Total | 7,277 | 4,808 | 23,902 | ||||||
(14) Employee Benefit Plan
In July 2005, the Company adopted a defined-contribution retirement plan (the “401(k) Plan”), which qualifies under Section 401(k) of the Internal Revenue Code of 1986, as amended. This 401(k) Plan covers essentially all employees. Eligible employees may make voluntary contributions to the 401(k) Plan up to the statutory annual limitations, and the Company is allowed to make discretionary contributions. The Company has made no discretionary contributions during the fiscal years ended July 31, 2016, 2015, or 2014, respectively.
(15) Transactions with Customers with Common Board Members and Officers
A member of the Company’s board of directors was an employee of a publicly-traded company that is a customer of the Company. There was $0.4 million, $2.2 million, and zero revenue recorded from sales to this customer for the years ended July 31, 2016, July 31, 2015 and July 31, 2014, respectively. The Company recorded deferred revenue from sales to this customer of $0.3 million and $0.7 million as of July 31, 2016 and July 31, 2015, respectively, and had no accounts receivable due from this customer as of July 31, 2016 and 2015, respectively.
In addition, one of the Company’s officers is a member of the board of directors of a publicly-traded company that is a customer of the Company. There was $0.2 million of revenue recorded from sales this customer for the year ended July 31, 2016, and revenue recorded from sales to this customer for the years ended July 31, 2015 and 2014 was inconsequential. The Company recorded deferred revenue from sales to this customer of $0.7 million and $0.7 million as of July 31, 2016 and 2015, respectively, and had $0.5 million accounts receivable due from this customer as of both July 31, 2016 and July 31, 2015, respectively.
Another member of the Company’s board of directors had a direct ownership interest in InsightsOne prior to its acquisition by Apigee in December 2013. See Note 2 for further details on the InsightsOne acquisition.
97
(16) Subsequent Events
Merger Agreement
On September 7, 2016, the Company entered into a definitive agreement to be acquired by Google Inc. for $17.40 per share in cash for each share of the Company’s common stock, for a total value of approximately $625 million. Completion of the Merger is subject to the satisfaction of customary closing conditions, including approval of the Merger by the Company’s stockholders, the absence of certain legal impediments, the absence of a material adverse effect on our business and the approval of applicable regulatory authorities. The companies expect the transaction to close by the end of calendar 2016. For more information about the Merger, please see the preliminary proxy statement on Schedule 14A we filed with the Securities Exchange Commission on September 28, 2016 and any subsequently filed definitive proxy statement.
It is possible that some customers and other partners with whom we have a business relationship may decide to seek to terminate, change or renegotiate their relationship with us as a result of the transaction. As a result, certain balance sheet accounts, such as accounts receivable and deferred revenue may be impacted.
Item 9. Changes in and Disagreements with Accountants on Accounting and Financial Disclosure
None.
Item 9A. Controls and Procedures
Evaluation of Disclosure Controls and Procedures
Our management, with the participation of our Chief Executive Officer and our Chief Financial Officer, evaluated the effectiveness of our disclosure controls and procedures as of July 31, 2016. The term “disclosure controls and procedures,” as defined in Rules 13a-15(e) and 15d-15(e) under the Exchange Act, means controls and other procedures of a company that are designed to ensure that information required to be disclosed by a company in the reports that it files or submits under the Exchange Act is recorded, processed, summarized and reported, within the time periods specified in the SEC’s rules and forms. Disclosure controls and procedures include, without limitation, controls and procedures designed to ensure that information required to be disclosed by a company in the reports that it files or submits under the Exchange Act is accumulated and communicated to the company’s management, including its principal executive and principal financial officers, as appropriate to allow timely decisions regarding required disclosure. Based on the evaluation of our disclosure controls and procedures as of July 31, 2016, our Chief Executive Officer and Chief Financial Officer concluded that, as of such date, our disclosure controls and procedures were effective at the reasonable assurance level.
Management’s Annual Report on Internal Control Over Financial Reporting
Our management is responsible for establishing and maintaining adequate internal control over financial reporting (as defined in Rule 13a-15(f) under the Exchange Act). Our management conducted an assessment of the effectiveness of our internal control over financial reporting based on the criteria set forth in Internal Control-Integrated Framework issued by the Committee of Sponsoring Organizations of the Treadway Commission (2013 Framework). Our internal control system is designed to provide reasonable assurance regarding the preparation and fair presentation of financial statements for external purposes in accordance with generally accepted accounting principles. All internal control systems, no matter how well designed, have inherent limitations and can only provide reasonable assurance that the objectives of the internal control systems are met. Based on the assessment, management has concluded that our internal control over financial reporting was effective as of July 31, 2016. This Annual Report on Form 10-K does not include an attestation report of our registered public accounting firm on our internal control over financial reporting due to an exemption established by the JOBS Act for "emerging growth companies."
Changes in Internal Control over Financial Reporting
There were no changes to our internal control over financial reporting identified in connection with the evaluation required by Rules 13a-15(d) and 15d-15(d) of the Exchange Act that occurred during the quarter ended July 31, 2016 that have materially affected, or are reasonably likely to materially affect, our internal control over financial reporting.
98
Inherent Limitations on Effectiveness of Controls
Our management, including our Chief Executive Officer and Chief Financial Officer, believes that our disclosure controls and procedures and internal control over financial reporting are designed to provide reasonable assurance of achieving their objectives and are effective at the reasonable assurance level. However, our management does not expect that our disclosure controls and procedures or our internal control over financial reporting will prevent all errors and all fraud. A control system, no matter how well conceived and operated, can provide only reasonable, not absolute, assurance that the objectives of the control system are met. Further, the design of a control system must reflect the fact that there are resource constraints, and the benefits of controls must be considered relative to their costs. Because of the inherent limitations in all control systems, no evaluation of controls can provide absolute assurance that all control issues and instances of fraud, if any, have been detected. These inherent limitations include the realities that judgments in decision-making can be faulty, and that breakdowns can occur because of a simple error or mistake. Additionally, controls can be circumvented by the individual acts of some persons, by collusion of two or more people or by management override of the controls. The design of any system of controls also is based in part upon certain assumptions about the likelihood of future events, and there can be no assurance that any design will succeed in achieving its stated goals under all potential future conditions; over time, controls may become inadequate because of changes in conditions, or the degree of compliance with policies or procedures may deteriorate. Because of the inherent limitations in a cost-effective control system, misstatements due to error or fraud may occur and not be detected.
Item 9B. Other Information
None.
99
PART III
Item 10. Directors, Executive Officers and Corporate Governance
Executive Officers and Directors
Information responsive to this item is incorporated herein by reference to our definitive proxy statement with respect to our 2017 Annual Meeting of Stockholders to be filed with the SEC within 120 days after the end of the fiscal year covered by this annual report on Form 10-K (the “Proxy Statement”).
Item 11. Executive Compensation
The information called for by this item will be set forth in our Proxy Statement and is incorporated herein by reference.
Item 12. Security Ownership of Certain Beneficial Owners and Management and Related Stockholder Matters
The information called for by this item will be set forth in our Proxy Statement and is incorporated herein by reference.
Item 13. Certain Relationships and Related Transactions, and Director Independence
The information called for by this item will be set forth in our Proxy Statement and is incorporated herein by reference.
Item 14. Principal Accountant Fees and Services
The information called for by this item will be set forth in our Proxy Statement and is incorporated herein by reference.
100
PART IV
Item 15. Exhibits and Financial Statement Schedules
Documents filed as part of this report are as follows:
1 | Consolidated Financial Statements: Our Consolidated Financial Statements are listed in the “Index to Consolidated Financial Statements” Under Part II, Item 8 of this report |
2 | Financial Statement Schedules: Financial statement schedules have been omitted because they are not applicable or the required information is shown in the Consolidated Financial Statements or Notes thereto. |
3 | Exhibits: The documents listed in the Exhibit Index of this report are incorporated by reference or are filed with this report, in each case as indicated therein (numbered in accordance with Item 601 of Regulation S-K). |
101
SIGNATURES
Pursuant to the requirements of Section 13 or 15(d) of the Securities Exchange Act of 1934, the registrant has duly caused this report to be signed on its behalf by the undersigned, thereunto duly authorized, on October 7, 2016.
APIGEE CORPORATION | |||
By: | /s/ Chet Kapoor | ||
Chet Kapoor | |||
Chief Executive Officer and Director | |||
(Principal Executive Officer) | |||
102
POWER OF ATTORNEY
Each person whose signature appears below constitutes and appoints Chet Kapoor and Tim Wan, and each of them, his attorneys-in-fact, each with full power of substitution, for him in any and all capacities, to sign any and all amendments to this Annual Report on Form 10-K, and to file the same, with exhibits thereto and other documents in connection therewith, with the Securities and Exchange Commission, hereby ratifying and confirming all that each said attorneys-in-fact or his substitute or substitutes, may do or cause to be done by virtue hereof.
Pursuant to the requirements of the Securities Exchange Act of 1934, this Annual Report on Form 10-K has been signed below by the following persons on behalf of the registrant and in the capacities and on the dates indicated.
Signature | Title | Date | ||
/s/ Chet Kapoor | Chief Executive Officer and Director (Principal Executive Officer) | October 7, 2016 | ||
Chet Kapoor | ||||
/s/ Tim Wan | Chief Financial Officer (Principal Financial and Accounting Officer) | October 7, 2016 | ||
Tim Wan | ||||
/s/ Bob L. Corey | Director | October 7, 2016 | ||
Bob L. Corey | ||||
/s/ Neal Dempsey | Director | October 7, 2016 | ||
Neal Dempsey | ||||
/s/ Promod Haque | Director | October 7, 2016 | ||
Promod Haque | ||||
/s/ William “BJ” Jenkins | Director | October 7, 2016 | ||
William “BJ” Jenkins | ||||
/s/ Edmond Mesrobian | Director | October 7, 2016 | ||
Edmond Mesrobian | ||||
/s/ Robert Schwartz | Director | October 7, 2016 | ||
Robert Schwartz | ||||
103
EXHIBIT
INDEX
Incorporated by Reference | ||||||||||
Exhibit Number | Description | Form | File Number | Filing Date | Filed Herewith | |||||
2.1 | Agreement and Plan of Merger, dated as of September 7, 2016, among Apigee Corporation, Google Inc., and Areopagus Inc. | 8-K | 001-37346 | 9/8/2016 | ||||||
3.1 | Amended and Restated Certificate of Incorporation | 10-Q | 001-37346 | 6/11/2015 | ||||||
3.2 | Amended and Restated Bylaws | 10-Q | 001-37346 | 6/11/2015 | ||||||
3.3 | Amendment to Amended and Restated Bylaws | 8-K | 001-37346 | 9/8/2016 | ||||||
4.1 | Amended and Restated Investors’ Rights Agreement dated as of April 17, 2014, by and among the registrant and the other parties thereto | S-1/A | 333-202885 | 3/20/2015 | ||||||
4.2 | Warrant to Purchase Common Stock issued by the Registrant to Silicon Valley Bank, dated as of May 1, 2012, as amended on October 3, 2012 | S-1/A | 333-202885 | 3/20/2015 | ||||||
4.3 | Form of Warrant to purchase common stock issued by the Registrant to Silicon Valley Bank | S-1/A | 333-202885 | 3/20/2015 | ||||||
4.4 | Specimen common stock certificate of the registrant | S-1/A | 333-202885 | 4/13/2015 | ||||||
10.1 | Form of Indemnification Agreement by and between the Registrant and each of its directors and executive officers | S-1/A | 333-202885 | 3/20/2015 | ||||||
10.2# | 2005 Stock Incentive Plan and forms of agreements thereunder | S-1/A | 333-202885 | 3/20/2015 | ||||||
10.3# | 2015 Equity Incentive Plan and forms of agreement thereunder | S-1/A | 333-202885 | 4/13/2015 | ||||||
10.4# | 2015 Employee Stock Purchase Plan and form of agreement thereunder | S-1/A | 333-202885 | 4/13/2015 | ||||||
10.5# | Offer Letter, by and between the Registrant and Chet Kapoor, dated April 8, 2015 | S-1/A | 333-202885 | 4/13/2015 | ||||||
104
10.6# | Offer Letter, by and between the Registrant and Tim Wan, dated April 8, 2015 | S-1/A | 333-202885 | 4/13/2015 | ||||||
10.7# | Offer Letter, by and between the Registrant and Stacey Giamalis, dated April 8, 2015 | S-1/A | 333-202885 | 4/13/2015 | ||||||
10.8# | Offer Letter, by and between the Registrant and Anant Jhingran, dated April 8, 2015 | S-1/A | 333-202885 | 4/13/2015 | ||||||
10.9# | Offer Letter, by and between the Registrant and Shankar Ramaswamy, dated April 8, 2015 | S-1/A | 333-202885 | 4/13/2015 | ||||||
10.10# | Offer Letter, by and between the Registrant and Stephen Rowland, dated April 8, 2015 | S-1/A | 333-202885 | 4/13/2015 | ||||||
10.11# | Separation Agreement, by and between the Registrant and Steve Valenzuela, dated November 22, 2014 | S-1/A | 333-202885 | 3/20/2015 | ||||||
10.12 | Amended and Restated Loan and Security Agreement dated as of November 17, 2014, by and between the Registrant and Silicon Valley Bank | S-1/A | 333-202885 | 3/20/2015 | ||||||
10.13 | First Amendment to Amended and Restated Loan and Security Agreement, dated March 2, 2016, by and between the Registrant and Silicon Valley Bank. | 10-Q | 001-37346 | 3/4/2016 | ||||||
10.14 | Second Amendment to Amended and Restated Loan and Security Agreement, dated May [23], 2016, by and between the Registrant and Silicon Valley Bank. | X | ||||||||
10.15 | Office Lease, by and between the Registrant and CA-10 Almaden Limited Partnership, dated October 18, 2013 | S-1/A | 333-202885 | 3/20/2015 | ||||||
10.16# | Executive Incentive Compensation Plan | S-1/A | 333-202885 | 3/20/2015 | ||||||
10.17# | Form of Worldwide Sales Manager Compensation Plan Fiscal Year 2015 and form of Fiscal 2015 Plan Acknowledgement thereunder | 10-Q | 001-37346 | 6/11/2015 | ||||||
21.1 | Subsidiaries of the registrant | S-1 | 333-202885 | 3/20/2015 | ||||||
105
23.1 | Consent of KPMG LLP, independent registered public accounting firm | X | ||||||||
24.1 | Power of Attorney (included on the signature page of this report) | X | ||||||||
31.1 | Certification of Principal Executive Officer pursuant to Section 302 of the Sarbanes-Oxley Act of 2002 | X | ||||||||
31.2 | Certification of Principal Financial Officer pursuant to Section 302 of the Sarbanes-Oxley Act of 2002 | X | ||||||||
32.1~ | Certification of Chief Executive Officer pursuant to 18 U.S.C. Section 1350, as adopted pursuant to Section 906 of the Sarbanes-Oxley Act of 2002. | X | ||||||||
32.2~ | Certification of Chief Financial Officer pursuant to 18 U.S.C. Section 1350, as adopted pursuant to Section 906 of the Sarbanes-Oxley Act of 2002. | X | ||||||||
101.INS | XBRL Instance Document | X | ||||||||
101.SCH | XBRL Taxonomy Extension Schema Document | X | ||||||||
101.CAL | XBRL Taxonomy Calculation Linkbase Document | X | ||||||||
101.DEF | XBRL Taxonomy Definition Linkbase Document | X | ||||||||
101.LAB | XBRL Taxonomy Labels Linkbase Document | X | ||||||||
101.PRE | XBRL Taxonomy Presentation Linkbase Document | X | ||||||||
# | Indicates management contract or compensatory plan. | |||||||||
~ | The certifications attached as Exhibits 32.1 and 32.2 accompany this Annual Report on Form 10-K pursuant to 18 U.S.C. Section 1350, as adopted pursuant to Section 906 of the Sarbanes-Oxley Act of 2002, and shall not be deemed “filed” by the Registrant for purposes of Section 18 of the Securities Exchange Act of 1934, as amended, or the Exchange Act, and are not to be incorporated by reference into any of the Registrant’s filings under the Securities Act of 1933, as amended, or the Exchange Act, irrespective of any general incorporation language contained in any such filing. | |||||||||
106