Attached files
| file | filename |
|---|---|
| 8-K - FORM 8-K - Monotype Imaging Holdings Inc. | d278527d8k.htm |
| EX-99.2 - EX-99.2 - Monotype Imaging Holdings Inc. | d278527dex992.htm |
Monotype and Olapic October 3, 2016 Exhibit 99.1

Safe Harbor Statement This presentation contains forward looking statements that involve significant risks and uncertainties, including those discussed in the “Risk Factors” section of Monotype Imaging Holdings Inc.’s Form 10-K and subsequent filings with the SEC. We are providing this information as of today’s date and do not undertake any obligation to update any forward-looking statements contained in this document as a result of new information, future events or otherwise. No forward-looking statement can be guaranteed and actual results may differ materially from those that are projected.

How We Got Here

How We Got Here ENGAGEMENT EXPRESSION 1986- Founded Print & Desktop Linotype ITC Monotype 2006+ Mobile Devices Fonts for Mobile 2010+ Digital Content Web fonts Apps Ads Email 2016+ Brand Engagement Branded Assets Fonts Emoji UGC

Why Expand Beyond Type?

Past TV Print Ads Brochures Direct Mail Brand Color Fonts Emoji UGC Stock/ Pro Images Sound Stock/ Pro Video

Today TV Print Ads Brochures Direct Mail Websites Social Messaging HTML5 Ads Email eCommerce Brand Color Fonts Emoji UGC Stock/ Pro Images Sound Stock/ Pro Video

Analytics TV Print Ads Brochures Direct Mail Websites Social Messaging HTML5 Ads Email eCommerce Today Brand Color Fonts Emoji UGC Stock/ Pro Images Sound Stock/ Pro Video

What Did We Consider?
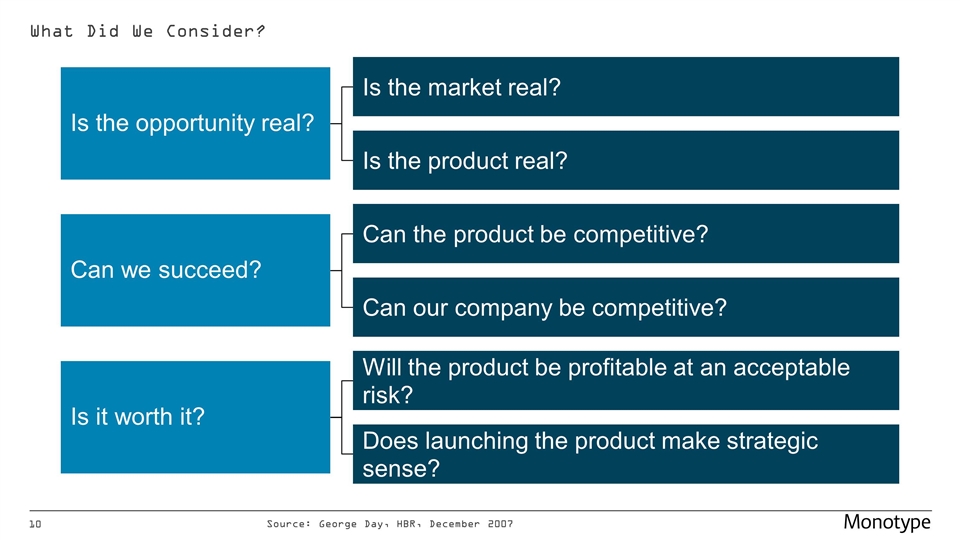
What Did We Consider? Source: George Day, HBR, December 2007 Is the opportunity real? Is the market real? Is the product real? Can we succeed? Is it worth it? Can the product be competitive? Can our company be competitive? Will the product be profitable at an acceptable risk? Does launching the product make strategic sense?
Why Olapic?
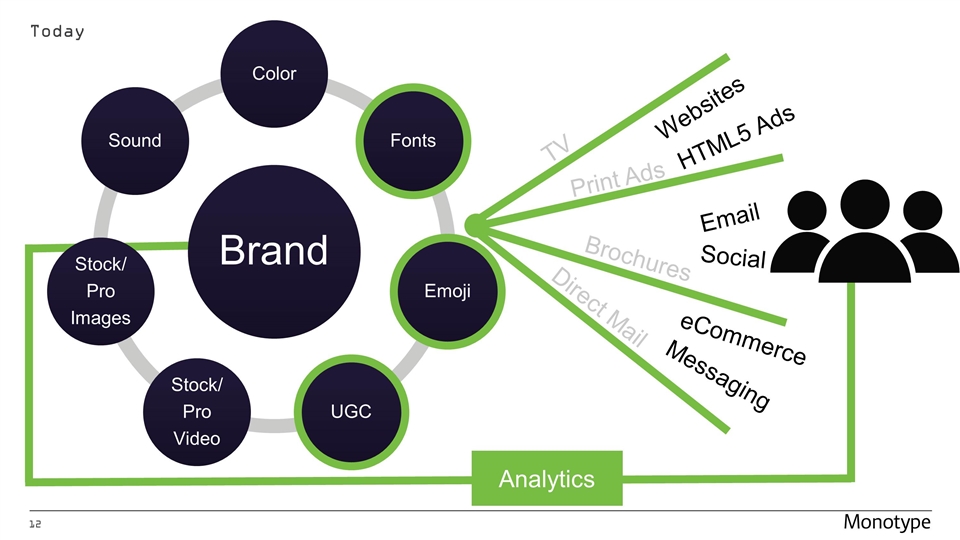
Analytics TV Print Ads Brochures Direct Mail Websites Social Messaging HTML5 Ads Email eCommerce Today Brand Color Fonts Emoji UGC Stock/ Pro Images Sound Stock/ Pro Video

Content Crunch The Challenge
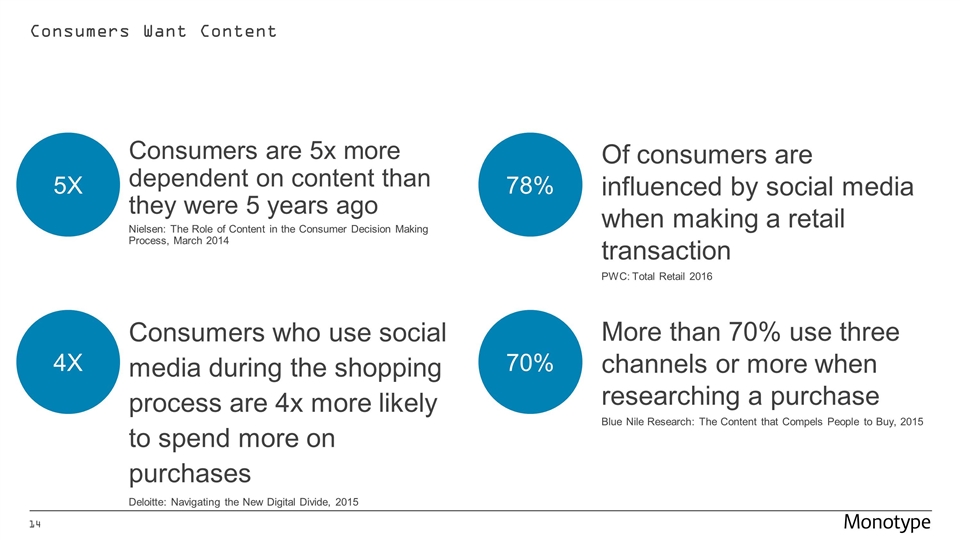
Consumers Want Content Of consumers are influenced by social media when making a retail transaction PWC: Total Retail 2016 More than 70% use three channels or more when researching a purchase Blue Nile Research: The Content that Compels People to Buy, 2015 Consumers who use social media during the shopping process are 4x more likely to spend more on purchases Deloitte: Navigating the New Digital Divide, 2015 Consumers are 5x more dependent on content than they were 5 years ago Nielsen: The Role of Content in the Consumer Decision Making Process, March 2014 5X 78% 70% 4X
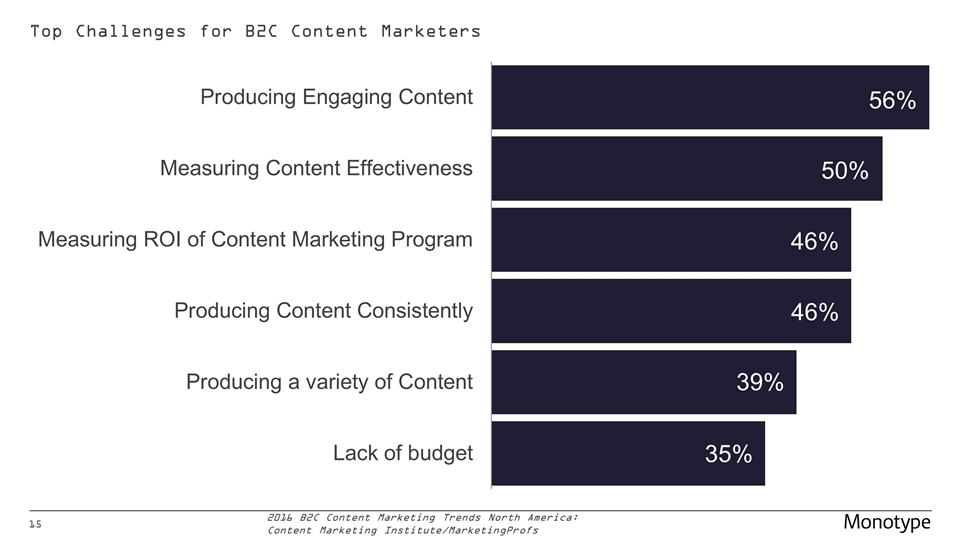
Top Challenges for B2C Content Marketers 2016 B2C Content Marketing Trends North America: Content Marketing Institute/MarketingProfs 39% 46% 56% 50% 46% 35%
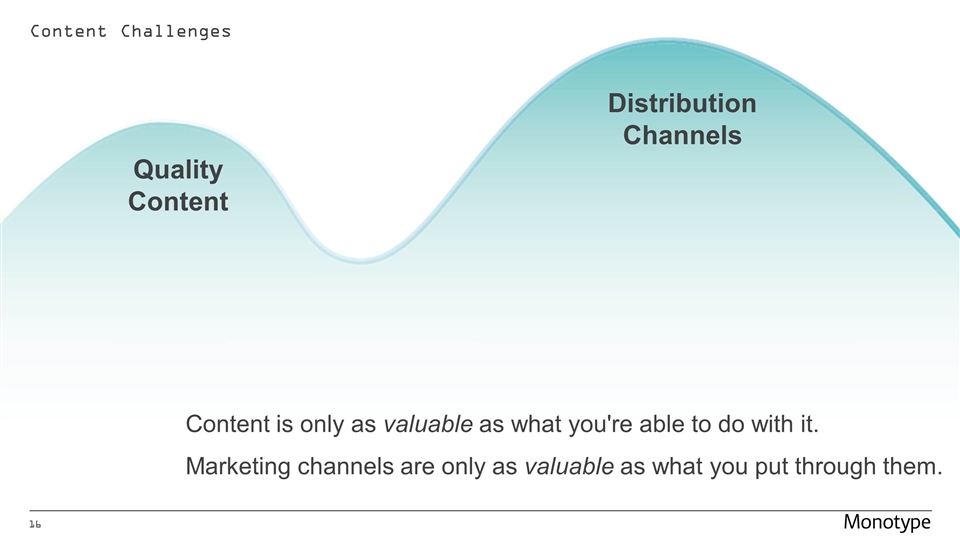
Content Challenges Distribution Channels Quality Content Content is only as valuable as what you're able to do with it. Marketing channels are only as valuable as what you put through them.
The Opportunity A New Type of Content
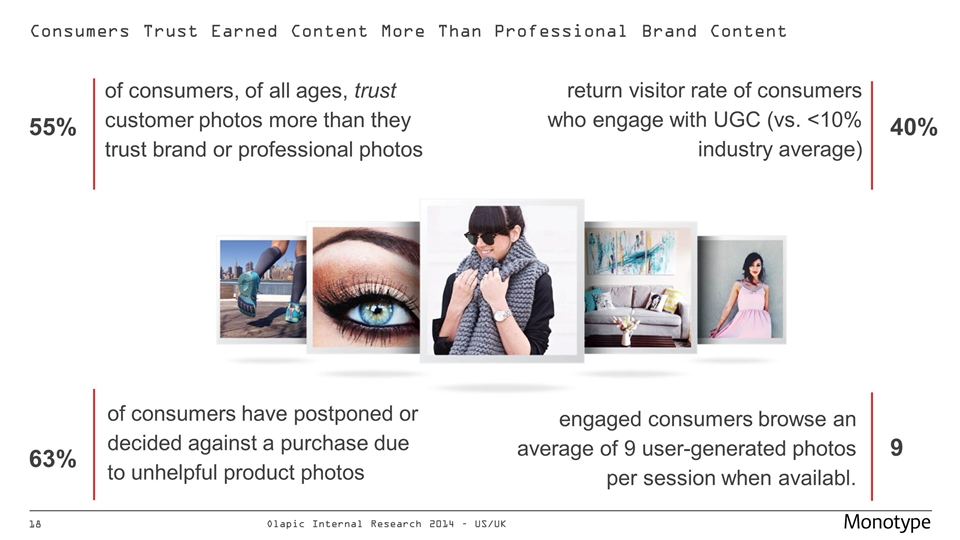
Consumers Trust Earned Content More Than Professional Brand Content 55% of consumers, of all ages, trust customer photos more than they trust brand or professional photos of consumers have postponed or decided against a purchase due to unhelpful product photos engaged consumers browse an average of 9 user-generated photos per session when availabl. return visitor rate of consumers who engage with UGC (vs. <10% industry average) 63% 40% 9 Olapic Internal Research 2014 – US/UK
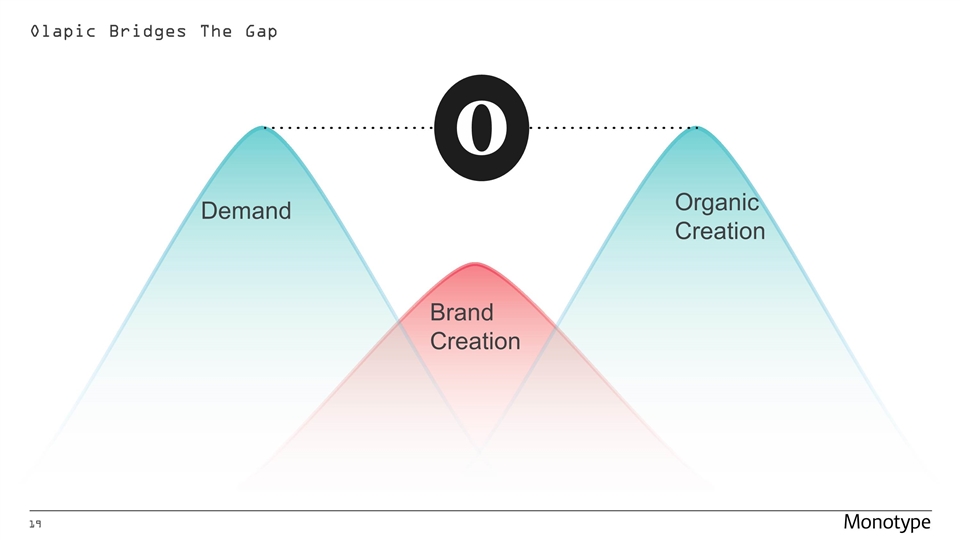
Olapic Bridges The Gap Demand Brand Creation Organic Creation
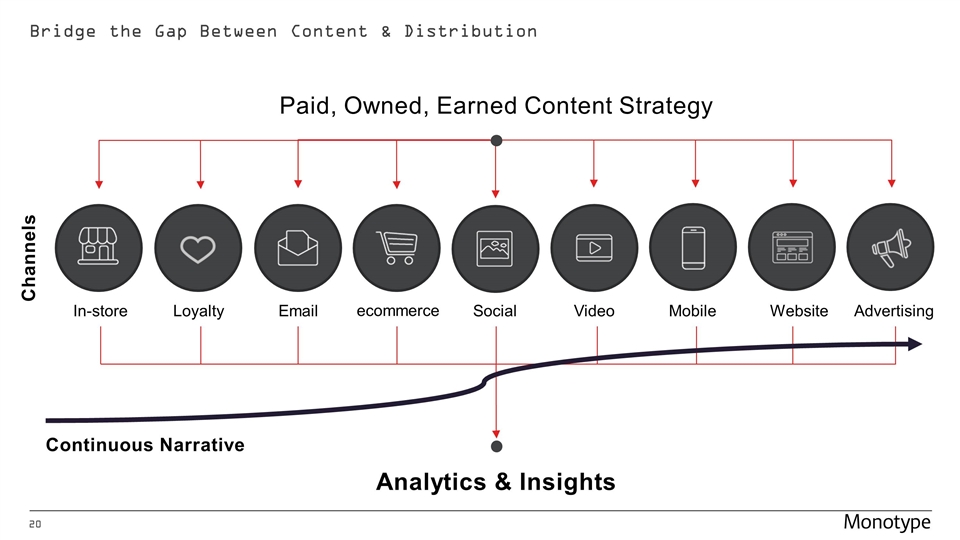
Bridge the Gap Between Content & Distribution Paid, Owned, Earned Content Strategy In-store Loyalty Email ecommerce Social Video Mobile Website Advertising Analytics & Insights Channels Continuous Narrative

Olapic The Solution

The Olapic Approach 01 Curate 02 Activate 03 Analyze

Curate Easily find, filter, select and manage thousands of high-performance, on-brand photos Collect Curate Moderate Request & Manage Rights Manage

Activate Increase ROI of each marketing channel and optimize the entire customer journey Web & eCommerce Social Advertising Mobile Email Offline Partners

Analyze Measure influence on sales, lift in revenue, and engagement Measure Sales Lift Brand Ambassadors Track Engagement

Olapic In Action

Case Study – West Elm West Elm embraces images to help tell their brand story and drive business growth across channels — from digital to print and in-store.

Case Study – West Elm e-commerce

Case Study – West Elm Email Marketing

Case Study – West Elm Offline Advertising

Case Study – West Elm Social Advertising

Case Study – West Elm Mobile Commerce

Nearly 400 Brands Using Olapic

2016 Fiscal Year Impact Guidance and Pro Forma Outlook

Guidance ($MM, except per share data) Q3 2016 TYPE Impact of Olapic* Consolidated Revenue $49.0 - $52.0 $0.5 - $1.5 $49.5 - $53.5 Non-GAAP Net Adjusted EBITDA $16.5 - $19.0 $(4.0) - $(3.0) $12.5 - $16.0 EPS $0.14 - $0.18 $(0.09) - $(0.08) $0.05 - $0.10 Non-GAAP EPS $0.24 - $0.28 $(0.07) - $(0.06) $0.17 - $0.22 FY 2016 TYPE Impact of Olapic* Consolidated Revenue $199.5 - $205.5 $2.0 - $4.0 $201.5 - $209.5 Non-GAAP Net Adjusted EBITDA $71.0 - $76.0 $(11.5) - $(9.8) $59.5 – $66.2 EPS $0.64 - $0.72 $(0.27) - $(0.24) $0.37 - $0.48 Non-GAAP EPS $1.05 - $1.13 $(0.20) - $(0.17) $0.85 - $0.96 *Since the acquisition date of August 9, 2016. A detailed reconciliation of all non-GAAP financial measures to the most directly comparable GAAP measures is provided in today’s press release.

Q3 2016 Consolidated Guidance Impact of Olapic pre-acquisition period (July 1-August 8) & estimated tax impact Addback of Olapic deferred revenue impairment Addback of transaction costs Pro forma outlook Revenue $49.5 - $53.5 $1.6 $1.4 $52.5 – $56.5 Non-GAAP Net Adjusted EBITDA $12.5 - $16.0 $(3.1) - $(3.0) $1.4 $0.6 $11.4 – $15.0 FY 2016 Consolidated Guidance Impact of Olapic pre-acquisition period (January 1-August 8) & estimated tax impact Addback of Olapic deferred revenue impairment Addback of transaction costs Pro forma outlook Revenue $201.5 - $209.5 $9.4 $3.6 $214.5 – $222.5 Non-GAAP Net Adjusted EBITDA $59.5 – $66.2 $(14.4) - $(14.0) $3.6 $1.3 $50.0 – $57.1 Non-GAAP Pro Forma Outlook ($MM) (Olapic pre-acquisition impact based on unaudited estimates) A detailed reconciliation of all non-GAAP financial measures to the most directly comparable GAAP measures is provided in today’s press release.

Strong Recurring and Predictable Revenue $218.5M* *Midpoint of the 2016 pro forma outlook for the combined companies. Includes estimates of impact of Olapic from January 1, 2016 and addback of the deferred revenue impairment.

Q&A

Thank You
