Attached files
| file | filename |
|---|---|
| 8-K - FORM 8-K - WCI Communities, Inc. | d262104d8k.htm |
| Exhibit 99.1
|
Strictly Private & Confidential WCI Communities, Inc. September 2016
|
|
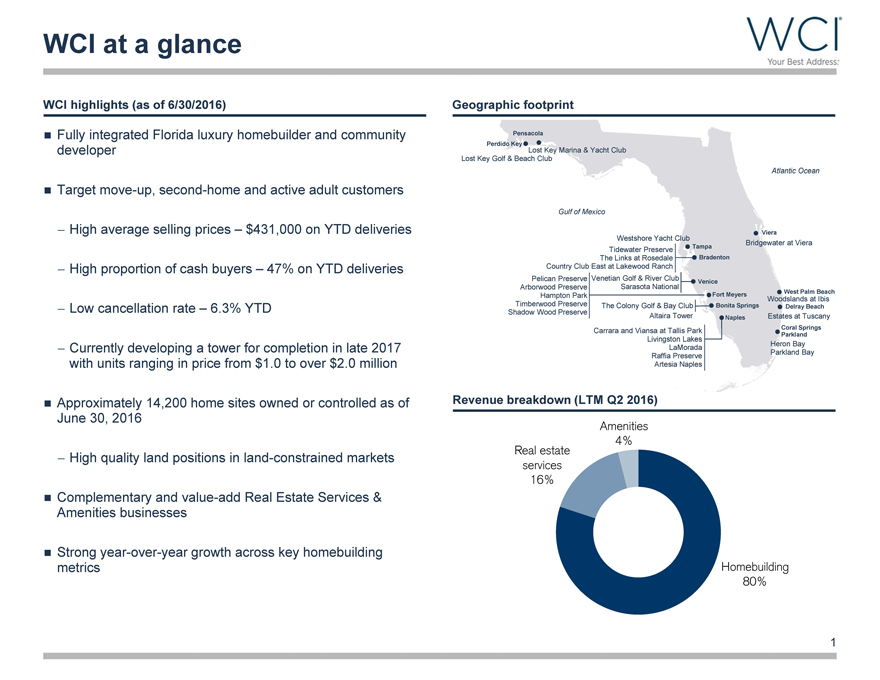
WCI at a glance WCI highlights (as of 6/30/2016) Geographic footprint Fully integrated Florida luxury homebuilder and community Pensacola developer Perdido Key Lost Key Marina & Yacht Club Lost Key Golf & Beach Club Atlantic Ocean Target move-up, second-home and active adult customers Gulf of Mexico —High average selling prices – $431,000 on YTD deliveries Viera Westshore Yacht Club Bridgewater at Viera Tidewater Preserve Tampa The Links at Rosedale Bradenton —High proportion of cash buyers – 47% on YTD deliveries Country Club East at Lakewood Ranch Pelican Preserve Venetian Golf & River Club Venice Arborwood Preserve Sarasota National West Palm Beach Hampton Park Fort Meyers Woodslands at Ibis —Low cancellation rate – 6.3% YTD Shadow Timberwood Preserve The Colony Golf & Bay Club Bonita Springs Delray Beach Wood Preserve Altaira Tower Naples Estates at Tuscany Carrara and Viansa at Tallis Park Coral Springs Livingston Lakes Parkland —Currently developing a tower for completion in late 2017 LaMorada Parkland Heron Bay Bay Raffia Preserve with units ranging in price from $1.0 to over $2.0 million Artesia Naples Approximately 14,200 home sites owned or controlled as of Revenue breakdown (LTM Q2 2016) June 30, 2016 Amenities 4% —High quality land positions in land-constrained markets Real estate services 16% Complementary and value-add Real Estate Services & Amenities businesses Strong year-over-year growth across key homebuilding metrics Homebuilding 80% 1
|
|
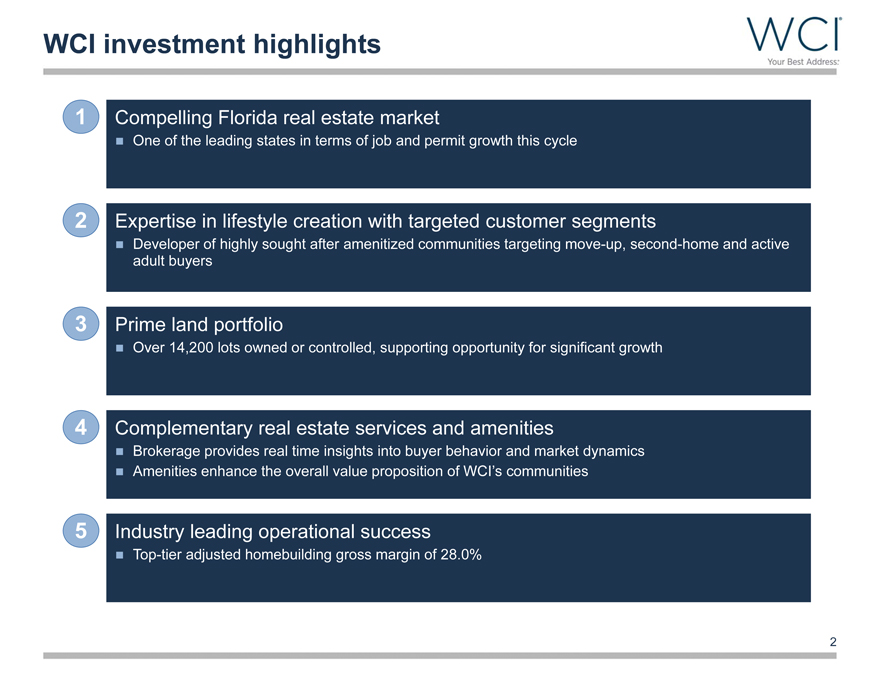
WCI investment highlights
1 Compelling Florida real estate market
One of the leading states in terms of job and permit growth this cycle
2 Expertise in lifestyle creation with targeted customer segments
Developer of highly sought after amenitized communities targeting move-up, second-home and active adult buyers
3 Prime land portfolio
Over 14,200 lots owned or controlled, supporting opportunity for significant growth
4 Complementary real estate services and amenities
Brokerage provides real time insights into buyer behavior and market dynamics Amenities enhance the overall value proposition of WCI’s communities
5 Industry leading operational success
Top-tier adjusted homebuilding gross margin of 28.0%
2
|
|
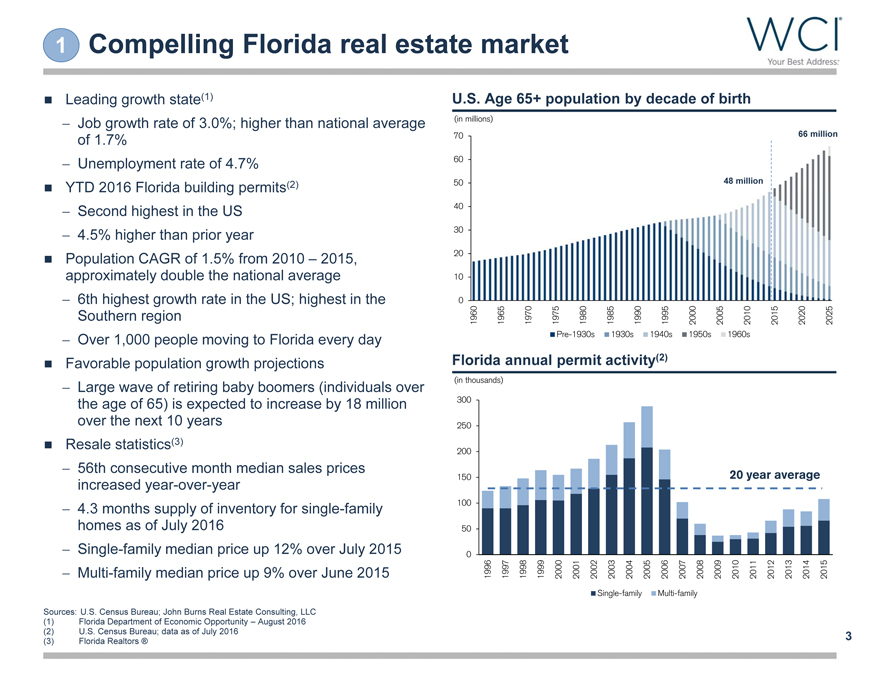
1 Compelling Florida real estate market
Leading growth state(1)
Job growth rate of 3.0%; higher than national average of 1.7%
Unemployment rate of 4.7% YTD 2016 Florida building permits(2)
Second highest in the US
4.5% higher than prior year
Population CAGR of 1.5% from 2010 – 2015, approximately double the national average
6th highest growth rate in the US; highest in the Southern region
Over 1,000 people moving to Florida every day Favorable population growth projections
Large wave of retiring baby boomers (individuals over the age of 65) is expected to increase by 18 million over the next 10 years Resale statistics(3)
56th consecutive month median sales prices increased year-over-year
4.3 months supply of inventory for single-family homes as of July 2016
Single-family median price up 12% over July 2015
Multi-family median price up 9% over June 2015
U.S. Age 65+ population by decade of birth
(in millions)
70 66 million
60
50 48 million
40
30
20
10
0
1960 1965 1970 1975 1980 1985 1990 1995 2000 2005 2010 2015 2020 2025
Pre-1930s 1930s 1940s 1950s 1960s
Florida annual permit activity(2)
Florida annual permit activity(2)
(in thousands)
300
250
200
150 20 year average
100
50
0
1996 1997 1998 1999 2000 2001 2002 2003 2004 2005 2006 2007 2008 2009 2010 2011 2012 2013 2014 2015
Single-family Multi-family
Sources: U.S. Census Bureau; John Burns Real Estate Consulting, LLC (1) Florida Department of Economic Opportunity – August 2016 (2) U.S. Census Bureau; data as of July 2016 (3) Florida Realtors ®
3
|
|
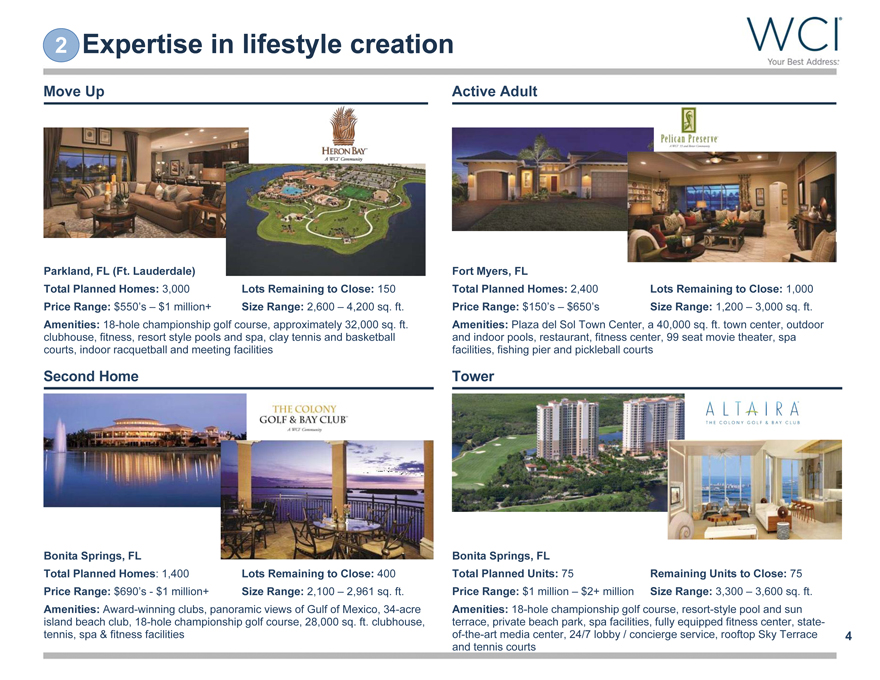
2 Expertise in lifestyle creation
Move Up Active Adult
Parkland, FL (Ft. Lauderdale)
Total Planned Homes: 3,000 Lots Remaining to Close: 150
Price Range: $550’s – $1 million+ Size Range: 2,600 – 4,200 sq. ft. Amenities: 18-hole championship golf course, approximately 32,000 sq. ft. clubhouse, fitness, resort style pools and spa, clay tennis and basketball courts, indoor racquetball and meeting facilities
Fort Myers, FL
Total Planned Homes: 2,400 Lots Remaining to Close: 1,000
Price Range: $150’s – $650’s Size Range: 1,200 – 3,000 sq. ft. Amenities: Plaza del Sol Town Center, a 40,000 sq. ft. town center, outdoor and indoor pools, restaurant, fitness center, 99 seat movie theater, spa facilities, fishing pier and pickleball courts
Tower
Second Home
Bonita Springs, FL
Total Planned Homes: 1,400 Lots Remaining to Close: 400
Price Range: $690’s - $1 million+ Size Range: 2,100 – 2,961 sq. ft. Amenities: Award-winning clubs, panoramic views of Gulf of Mexico, 34-acre island beach club, 18-hole championship golf course, 28,000 sq. ft. clubhouse, tennis, spa & fitness facilities of-
Bonita Springs, FL
Total Planned Units: 75 Remaining Units to Close: 75
Price Range: $1 million – $2+ million Size Range: 3,300 – 3,600 sq. ft. Amenities: 18-hole championship golf course, resort-style pool and sun terrace, private beach park, spa facilities, fully equipped fitness center, state-of-the-art media center, 24/7 lobby / concierge service, rooftop Sky Terrace and tennis courts
4
|
|
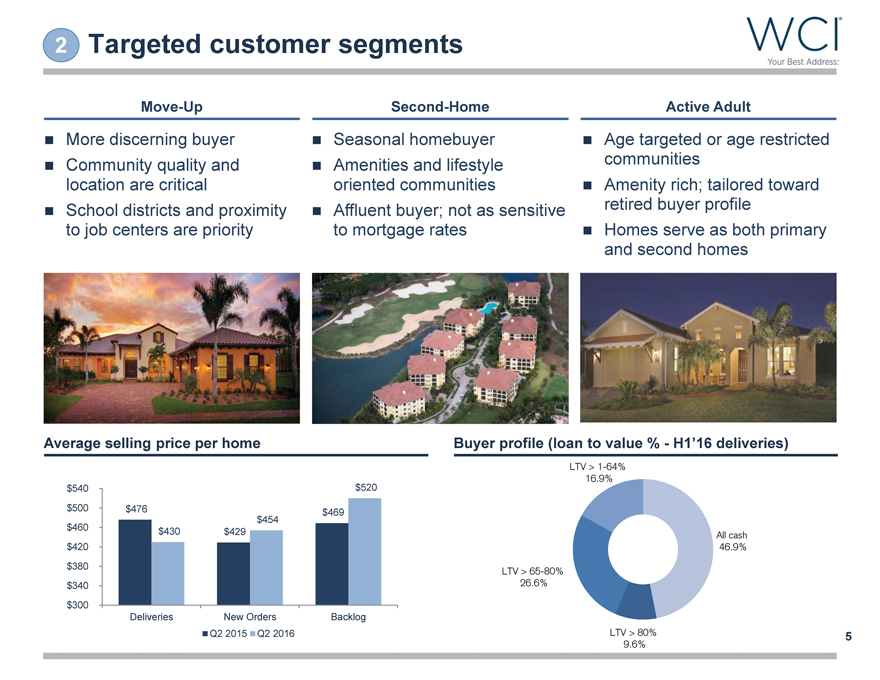
2 Targeted customer segments Move-Up Second-Home Active Adult More discerning buyer Seasonal homebuyer Age targeted or age restricted Community quality and Amenities and lifestyle communities location are critical oriented communities Amenity rich; tailored toward School districts and proximity Affluent buyer; not as sensitive retired buyer profile to job centers are priority to mortgage rates Homes serve as both primary and second homes Average selling price per home Buyer profile (loan to value %—H1’16 deliveries) LTV > 1-64% 16.9% $540 $ 520 $500 $476 $ 469 $ 454 $460 $ 430 $ 429 All cash $420 46.9% $380 LTV > 65-80% $340 26.6% $300 Deliveries New Orders Backlog Q2 2015 Q2 2016 LTV > 80% 5 9.6%
|
|
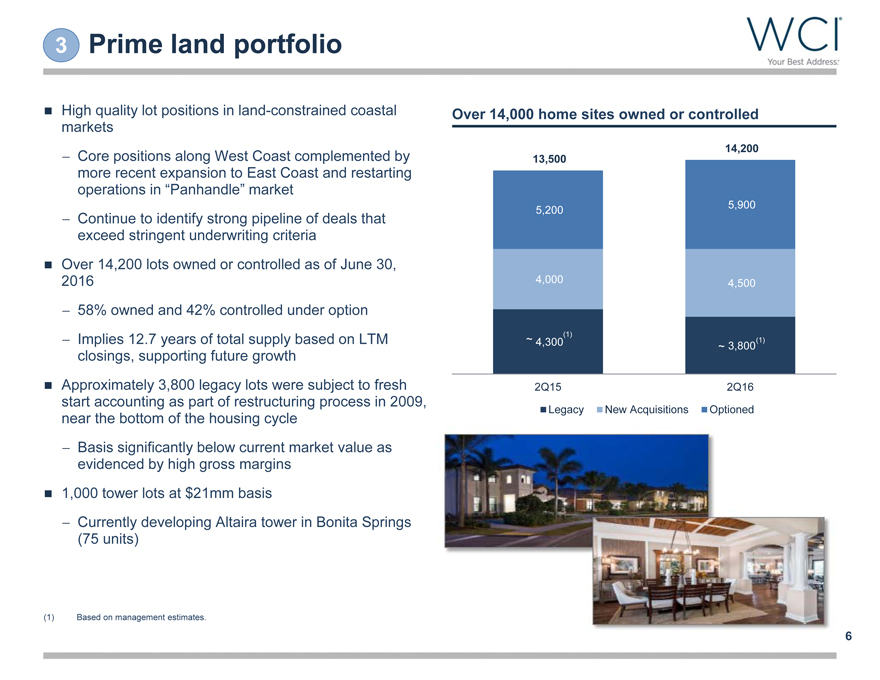
3 Prime land portfolio
High quality lot positions in land-constrained coastal markets
Core positions along West Coast complemented by more recent expansion to East Coast and restarting operations in “Panhandle” market
Continue to identify strong pipeline of deals that exceed stringent underwriting criteria Over 14,200 lots owned or controlled as of June 30, 2016
58% owned and 42% controlled under option
Implies 12.7 years of total supply based on LTM closings, supporting future growth Approximately 3,800 legacy lots were subject to fresh start accounting as part of restructuring process in 2009, near the bottom of the housing cycle
Basis significantly below current market value as evidenced by high gross margins 1,000 tower lots at $21mm basis
Currently developing Altaira tower in Bonita Springs (75 units)
Over 14,000 home sites owned or controlled
14,200
13,500
5,200 5,900
4,000 4,500
~ 4,300(1) (1)
~ 3,800
2Q15 2Q16
Legacy New Acquisitions Optioned
(1) Based on management estimates.
6
|
|
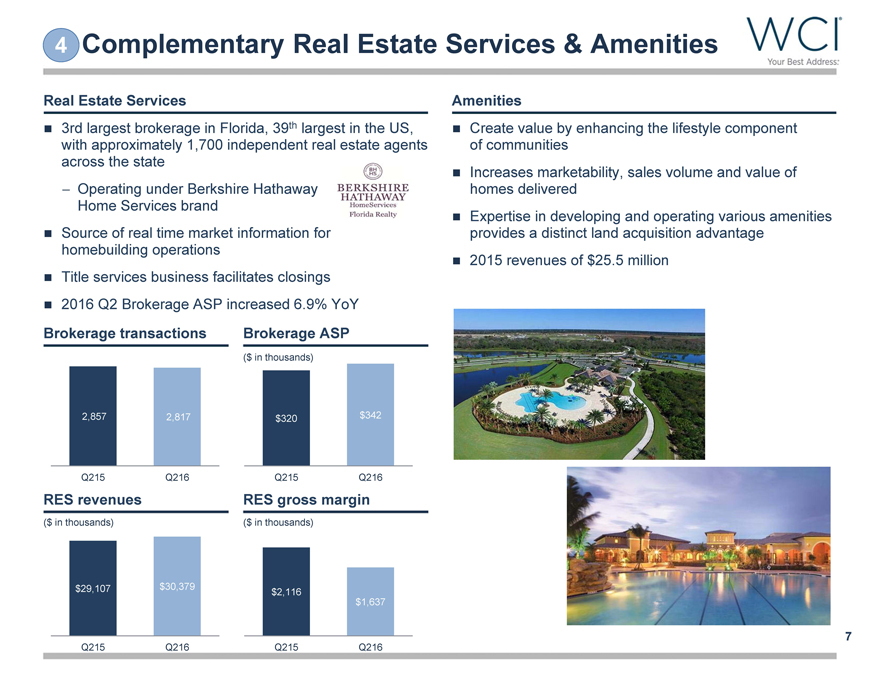
4 Complementary Real Estate Services & Amenities Real Estate Services Amenities 3rd largest brokerage in Florida, 39th largest in the US, Create value by enhancing the lifestyle component with approximately 1,700 independent real estate agents of communities across the state Increases marketability, sales volume and value of —Operating under Berkshire Hathaway homes delivered Home Services brand Expertise in developing and operating various amenities Source of real time market information for provides a distinct land acquisition advantage homebuilding operations 2015 revenues of $25.5 million Title services business facilitates closings 2016 Q2 Brokerage ASP increased 6.9% YoY Brokerage transactions Brokerage ASP ($ in thousands) 2,857 2,817 $320 $342 Q215 Q216 Q215 Q216 RES revenues RES gross margin ($ in thousands) ($ in thousands) $29,107 $30,379 $2,116 $1,637 7 Q215 Q216 Q215 Q216
|
|
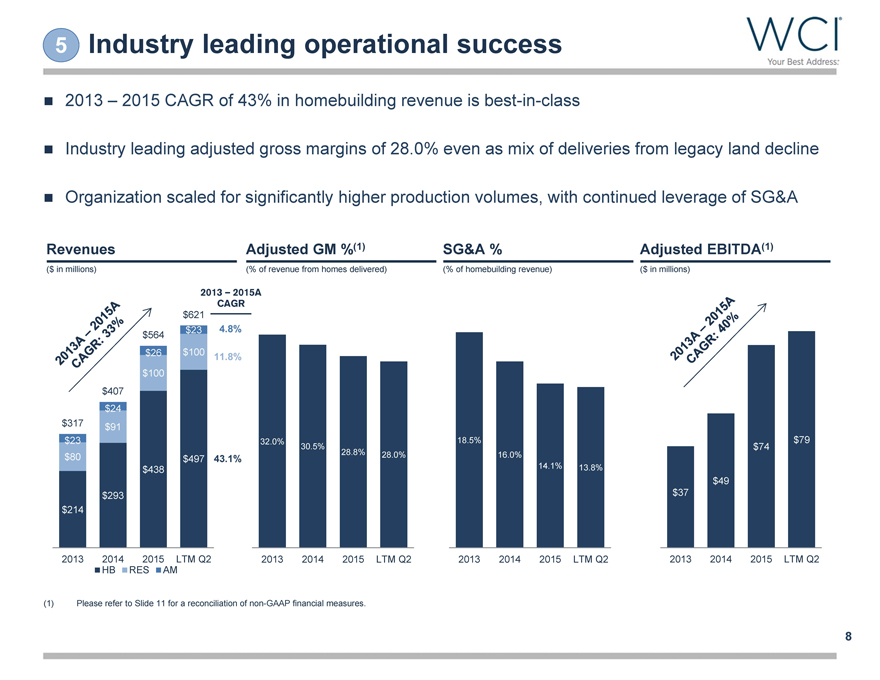
5 Industry leading operational success 2013 – 2015 CAGR of 43% in homebuilding revenue is best-in-class Industry leading adjusted gross margins of 28.0% even as mix of deliveries from legacy land decline Organization scaled for significantly higher production volumes, with continued leverage of SG&A Revenues Adjusted GM %(1) SG&A % Adjusted EBITDA(1) ($ in millions) (% of revenue from homes delivered) (% of homebuilding revenue) ($ in millions) 2013 – 2015A CAGR $621 $564 $23 4.8% $26 $100 11.8% $100 $407 $24 $317 $91 $23 32.0% 18.5% $79 30.5% $74 $80 $497 43.1% 28.8% 28.0% 16.0% $438 14.1% 13.8% $49 $293 $37 $214 2013 2014 2015 LTM Q2 2013 2014 2015 LTM Q2 2013 2014 2015 LTM Q2 2013 2014 2015 LTM Q2 HB RES AM (1) Please refer to Slide 11 for a reconciliation of non-GAAP financial measures. 8
|
|
Lennar transaction announcement On September 22, 2016, WCI announced it had entered into a definitive agreement to be acquired by Lennar for $23.50 per share —Implies an equity value of $643 million and total enterprise value of $809 million —Represents 1.3x price / book value as of June 30, 2016 Under the terms of the agreement, WCI may solicit alternative acquisition proposals from third parties during a 35-day “go-shop” period commencing on September 22, 2016 As detailed in the Lennar agreement, to qualify for the lower break fee parties must be designated by the WCI board on or before October 26, 2016. In order to qualify as a Superior Proposal, any alternative acquisition proposal must include a price and a definitive agreement and must be on terms, financial and otherwise, that would be more favorable to the holders of WCI common stock WCI has engaged Credit Suisse Securities (USA) LLC (“Credit Suisse”) as its financial advisor in connection with a potential sale of the Company. No personnel of the Company or any of its affiliates should be contacted without the prior consent of Credit Suisse. All communications or inquiries relating the Company should be directed to the following professionals at Credit Suisse: Eric Anderson David Luwisch Jim Cronin Vice Chairman Managing Director Director Real Estate Investment Banking Mergers & Acquisitions Real Estate Investment Banking Tel: (212) 538 2640 Tel: (310) 282 7454 Tel: (212) 325 7985 eric.anderson@credit-suisse.com david.luwisch@credit-suisse.com jim.cronin@credit-suisse.com 9
|
|
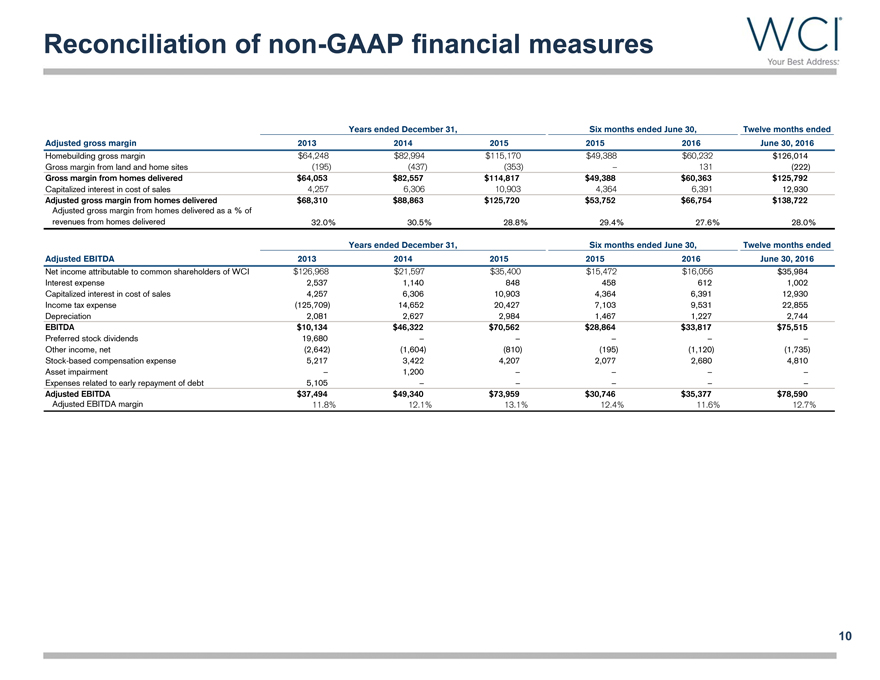
Reconciliation of non-GAAP financial measures
Years ended December 31, Six months ended June 30, Twelve months ended
Adjusted gross margin 2013 2014 2015 2015 2016 June 30, 2016
Homebuilding gross margin $64,248 $82,994 $115,170 $49,388 $60,232 $126,014
Gross margin from land and home sites (195) (437) (353) – 131 (222)
Gross margin from homes delivered $64,053 $82,557 $114,817 $49,388 $60,363 $125,792
Capitalized interest in cost of sales 4,257 6,306 10,903 4,364 6,391 12,930
Adjusted gross margin from homes delivered $68,310 $88,863 $125,720 $53,752 $66,754 $138,722
Adjusted gross margin from homes delivered as a % of
revenues from homes delivered 32.0% 30.5% 28.8% 29.4% 27.6% 28.0%
Years ended December 31, Six months ended June 30, Twelve months ended
Adjusted EBITDA 2013 2014 2015 2015 2016 June 30, 2016
Net income attributable to common shareholders of WCI $126,968 $21,597 $35,400 $15,472 $16,056 $35,984
Interest expense 2,537 1,140 848 458 612 1,002
Capitalized interest in cost of sales 4,257 6,306 10,903 4,364 6,391 12,930
Income tax expense (125,709) 14,652 20,427 7,103 9,531 22,855
Depreciation 2,081 2,627 2,984 1,467 1,227 2,744
EBITDA $10,134 $46,322 $70,562 $28,864 $33,817 $75,515
Preferred stock dividends 19,680 – – – – –
Other income, net (2,642) (1,604) (810) (195) (1,120) (1,735)
Stock-based compensation expense 5,217 3,422 4,207 2,077 2,680 4,810
Asset impairment – 1,200 – – – –
Expenses related to early repayment of debt 5,105 – – – – –
Adjusted EBITDA $37,494 $49,340 $73,959 $30,746 $35,377 $78,590
Adjusted EBITDA margin 11.8% 12.1% 13.1% 12.4% 11.6% 12.7%