Attached files
| file | filename |
|---|---|
| EX-32.2 - CERTIFICATION - WCI Communities, Inc. | d839632dex322.htm |
| EX-31.1 - CERTIFICATION - WCI Communities, Inc. | d839632dex311.htm |
| EX-21.1 - LIST OF SUBSIDIARIES - WCI Communities, Inc. | d839632dex211.htm |
| EX-32.1 - CERTIFICATION - WCI Communities, Inc. | d839632dex321.htm |
| EX-23.1 - CONSENT - WCI Communities, Inc. | d839632dex231.htm |
| EX-10.24 - WCI MANAGEMENT INCENTIVE COMPENSATION PLAN 2015 - WCI Communities, Inc. | d839632dex1024.htm |
| EX-31.2 - CERTIFICATION - WCI Communities, Inc. | d839632dex312.htm |
| EX-10.25 - 2015 REAL ESTATE SERVICES INCENTIVE COMPENSATION PLAN - WCI Communities, Inc. | d839632dex1025.htm |
| EXCEL - IDEA: XBRL DOCUMENT - WCI Communities, Inc. | Financial_Report.xls |
| EX-12.1 - STATEMENT OF THE COMPUTATIONS OF THE RATIO OF EARNINGS TO FIXED CHARGES - WCI Communities, Inc. | d839632dex121.htm |
Table of Contents
UNITED STATES
SECURITIES AND EXCHANGE COMMISSION
WASHINGTON, D.C. 20549
FORM 10-K
(Mark One)
| x | Annual Report Pursuant to Section 13 or 15(d) of the Securities Exchange Act of 1934 |
For the fiscal year ended December 31, 2014
or
| ¨ | Transition Report Pursuant to Section 13 or 15(d) of the Securities Exchange Act of 1934 |
For the transition period from to
Commission File Number: 001-36023
WCI COMMUNITIES, INC.
(Exact Name of Registrant as Specified in Its Charter)
| Delaware | 27-0472098 | |
| (State or Other Jurisdiction of Incorporation or Organization) |
(I.R.S. Employer Identification No.) | |
| 24301 Walden Center Drive Bonita Springs, Florida |
34134 | |
| (Address of Principal Executive Offices) | (Zip Code) | |
Registrant’s Telephone Number, Including Area Code: (239) 947-2600
Securities Registered Pursuant to Section 12(b) of the Act:
| Title of Each Class |
Name of Each Exchange on Which Registered | |
| Common Stock, $0.01 par value | New York Stock Exchange |
Securities Registered Pursuant to Section 12(g) of the Act: None
Indicate by check mark if the registrant is a well-known seasoned issuer, as defined in Rule 405 of the Securities Act. Yes ¨ No x
Indicate by check mark if the registrant is not required to file reports pursuant to Section 13 or Section 15(d) of the Act. Yes ¨ No x
Indicate by check mark whether the registrant (1) has filed all reports required to be filed by Section 13 or 15(d) of the Securities Exchange Act of 1934 during the preceding 12 months (or for such shorter period that the registrant was required to file such reports), and (2) has been subject to such filing requirements for the past 90 days. Yes x No ¨
Indicate by check mark whether the registrant has submitted electronically and posted on its corporate Web site, if any, every Interactive Data File required to be submitted and posted pursuant to Rule 405 of Regulation S-T (§ 232.405 of this chapter) during the preceding 12 months (or for such shorter period that the registrant was required to submit and post such files). Yes x No ¨
Indicate by check mark if disclosure of delinquent filers pursuant to Item 405 of Regulation S-K (§ 229.405 of this chapter) is not contained herein, and will not be contained, to the best of the registrant’s knowledge, in definitive proxy or information statements incorporated by reference in Part III of this Form 10-K or any amendment to this Form 10-K. x
Indicate by check mark whether the registrant is a large accelerated filer, an accelerated filer, a non-accelerated filer, or a smaller reporting company. See the definitions of “large accelerated filer,” “accelerated filer” and “smaller reporting company” in Rule 12b-2 of the Exchange Act.
| Large accelerated filer | ¨ | Accelerated filer | x | |||
| Non-accelerated filer | ¨ (Do not check if a smaller reporting company) | Smaller reporting company | ¨ | |||
Indicate by check mark whether the registrant is a shell company (as defined in Rule 12b-2 of the Act). Yes ¨ No x
As of June 30, 2014, the aggregate market value of the registrant’s voting and non-voting common equity held by non-affiliates was approximately $226.3 million, as determined by reference to the listed price of the registrant’s common stock as of the close of business on such day. For purposes of the foregoing calculation only, all directors and executive officers of the registrant were deemed to be affiliates.
Common shares outstanding as of February 25, 2015: 26,106,196
Documents Incorporated by Reference
Certain sections of the registrant’s definitive proxy statement, which is to be issued in connection with its 2015 Annual Meeting of Stockholders, have been incorporated by reference into Part III of this Form 10-K.
Table of Contents
WCI COMMUNITIES, INC.
ANNUAL REPORT ON FORM 10-K
FOR THE YEAR ENDED DECEMBER 31, 2014
| Page | ||||||
| Item 1. |
3 | |||||
| Item 1A. |
14 | |||||
| Item 1B. |
38 | |||||
| Item 2. |
38 | |||||
| Item 3. |
38 | |||||
| Item 4. |
39 | |||||
| Item 5. |
40 | |||||
| Item 6. |
42 | |||||
| Item 7. |
Management’s Discussion and Analysis of Financial Condition and Results of Operations |
43 | ||||
| Item 7A. |
67 | |||||
| Item 8. |
68 | |||||
| Item 9. |
Changes in and Disagreements With Accountants on Accounting and Financial Disclosure |
101 | ||||
| Item 9A. |
101 | |||||
| Item 9B. |
101 | |||||
| Item 10. |
102 | |||||
| Item 11. |
103 | |||||
| Item 12. |
Security Ownership of Certain Beneficial Owners and Management and Related Stockholder Matters |
103 | ||||
| Item 13. |
Certain Relationships and Related Transactions, and Director Independence |
104 | ||||
| Item 14. |
104 | |||||
| Item 15. |
104 | |||||
| 110 | ||||||
2
Table of Contents
CAUTIONARY NOTE REGARDING FORWARD-LOOKING STATEMENTS
Unless the context otherwise requires, the terms the “Company,” “we,” “us” and “our” in this Annual Report on Form 10-K refer to WCI Communities, Inc. and its subsidiaries and the term “WCI” refers only to WCI Communities, Inc.
Certain statements in this Annual Report on Form 10-K constitute “forward-looking statements” within the meaning of the federal securities laws. These forward-looking statements include statements regarding our business, financial condition, results of operations, cash flows, liquidity, prospects, growth strategies, the industry in which we operate and potential acquisitions. These forward-looking statements may be identified by terminology such as, ‘‘believe,’’ ‘‘estimate,’’ ‘‘project,’’ ‘‘anticipate,’’ ‘‘expect,’’ ‘‘seek,’’ ‘‘predict,’’ ‘‘contemplate,’’ ‘‘continue,’’ ‘‘possible,’’ ‘‘intend,’’ ‘‘may,’’ ‘‘might,’’ ‘‘will,’’ ‘‘could,’’ ‘‘would,’’ ‘‘should,’’ ‘‘forecast,’’ or ‘‘assume’’ or, in each case, the negative of such terms and other variations or comparable terminology. These forward-looking statements include matters that are not historical facts. Although we believe that the expectations reflected in the forward-looking statements contained in this Annual Report on Form 10-K are reasonable, we cannot guarantee future results. These statements involve known and unknown risks, uncertainties and other important factors that may cause our actual results, performance or achievements to be materially different from those expressed or implied by the forward-looking statements. We undertake no obligation to publicly update any forward-looking statements contained in this Annual Report on Form 10-K, whether as a result of new information, future events or otherwise. However, any further disclosures made on related subjects in subsequent reports on Forms 10-K, 10-Q and 8-K should be consulted. Information about important factors that could cause our actual results, performance or achievements to be materially different from those expressed or implied by our forward-looking statements is contained under the caption “Risk Factors” in Item 1A of Part I of this Annual Report on Form 10-K. Shareholders, investors and other interested parties should evaluate all forward-looking statements made in this Annual Report on Form 10-K in the context of these important risks and uncertainties.
| Item 1. | Business. |
Overview
We are a lifestyle community developer and luxury homebuilder of single- and multi-family homes in most of coastal Florida’s highest growth and largest markets, in which we own or control approximately 12,600 home sites as of December 31, 2014. We have established a reputation and strong brand recognition for developing amenity-rich, lifestyle-oriented master-planned communities. Our homes and communities are primarily targeted to move-up, second-home and active adult buyers. We intend to leverage our experience, operational platform and well-located land inventory, with an attractive book value, to capitalize on markets with favorable demographic and economic forecasts in order to grow our business.
WCI Communities, Inc. was incorporated in Delaware in 2009 and our predecessor company was founded in 1998. WCI Communities, Inc. operates as a holding company and has no independent assets or operations. All of its business and operational activity is conducted through its subsidiaries. Our company and certain of its subsidiaries emerged from bankruptcy on September 3, 2009 and operated as a privately held company until July 2013. On July 30, 2013, we completed the initial public offering of our common stock and issued 6,819,091 shares of common stock at a price to the public of $15.00 per share, which provided us with $90.3 million of net proceeds after deducting underwriting discounts and offering expenses payable by us. Shares of our common stock trade on the New York Stock Exchange under the ticker symbol “WCIC.”
We believe that our business is distinguished by our:
| • | significant, well-located, land inventory in developed and established communities; |
| • | proven leadership team, which has extensive experience in our markets; |
| • | expertise in, and reputation for, developing luxury lifestyle communities with well-managed amenities; |
| • | higher average selling prices and lower cancellation rates than most other public homebuilders; |
| • | significant percentage of all-cash buyers, attributed to our focus on a higher-end move-up, second-home and active adult buyer base; |
| • | strong focus and market positioning in most of coastal Florida’s highest growth and largest markets; |
| • | real estate services business segment, which provides us with additional opportunities to increase profitability as Florida home prices and new and existing home sales continue to recover; |
| • | solid gross margins from homes delivered (as evidenced by our 28.3% gross margin in 2014); |
| • | existing tower sites and our operational expertise provide us with future opportunities as demand for high-rise product returns; |
3
Table of Contents
| • | attractive book value of land inventories that were reset to then-current fair values in September 2009 (approximately 36% of our total owned and controlled home sites, or approximately 4,600 home sites, as of December 31, 2014); |
| • | significant deferred tax assets (most of which are expected to be utilized by us); and |
| • | well-capitalized balance sheet with sufficient liquidity for growth. |
Our business is organized into three operating segments: Homebuilding, Real Estate Services and Amenities. Our Homebuilding segment accounted for 71.9%, 67.4% and 61.0% of our total revenues for the years ended December 31, 2014, 2013 and 2012, respectively, and substantially all of our total gross margin during those years.
| • | Homebuilding: We design, sell and build homes ranging in price from approximately $150,000 to $1.3 million and in size from approximately 1,100 square feet to 4,500 square feet. Additionally, our land development expertise enhances our Homebuilding operations by enabling us to acquire and create larger, well-amenitized master-planned communities, control the timing of home site delivery and capture the opportunity to drive higher margins. As of December 31, 2014, we were actively selling in 37 different neighborhoods situated in 14 master-planned communities. During the year ended December 31, 2014, we delivered 644 homes with an average delivered price of $452,000, compared to 493 homes with an average delivered price of $433,000 during the year ended December 31, 2013 and 352 homes with an average delivered price of $396,000 during the year ended December 31, 2012. Our Homebuilding operations derive revenues from home deliveries and sales of land and home sites. Our revenues from home deliveries have grown rapidly to $291.3 million during the year ended December 31, 2014 from $213.5 million and $139.6 million during the years ended December 31, 2013 and 2012, respectively, a year-over-year increase of 36.4% in 2014. New orders increased from 531 and 453 during 2013 and 2012, respectively, to 743 during 2014, a year-over-year increase of 39.9%. As of December 31, 2014, we had a backlog of 392 homes contracted for sale at an aggregate purchase price of $205.3 million, compared to a backlog of 293 homes contracted for sale at an aggregate purchase price of $143.8 million as of December 31, 2013 and a backlog of 255 homes contracted for sale at an aggregate purchase price of $114.1 million as of December 31, 2012. We currently expect to close substantially all of the units that were in our backlog as of December 31, 2014 during the year ending December 31, 2015. |
| • | Real Estate Services: We operate a full-service real estate brokerage business under the Berkshire Hathaway HomeServices brand (prior to October 2013, we operated under the Prudential brand) and title services that complement our Homebuilding operations by providing us with additional opportunities to capitalize on increasing home prices throughout Florida. During 2013, our real estate brokerage business was the fourth-largest real estate brokerage in Florida and the 52nd largest in the U.S., both based on sales volume. Our real estate brokerage business derives revenues primarily from gross commission income from serving as the broker at the closing of real estate transactions. During the year ended December 31, 2014, our real estate services revenues were $90.6 million, an increase of 13.1% when compared to $80.1 million during the year ended December 31, 2013. For the year ended December 31, 2012, such revenues were $73.1 million. During the year ended December 31, 2014, through our exclusive relationships with approximately 1,600 independent licensed real estate agents, we represented either the buyer or seller in approximately 9,400 home sale transactions. During the years ended December 31, 2013 and 2012, we represented either the buyer or seller in approximately 9,000 and 9,100 home sale transactions, respectively. The average selling price on closed home sale transactions in our Real Estate Services business increased 11.2%, 8.9% and 7.0% during the years ended December 31, 2014, 2013 and 2012, respectively, when compared to the immediately preceding year. Our total retail sales volume was over $2.8 billion, $2.4 billion and $2.2 billion during 2014, 2013 and 2012, respectively. Our title and settlement services business earns revenues through fees charged in real estate transactions for rendering title and other settlement and non-settlement related services. We provide most of these services in connection with our real estate brokerage and Homebuilding operations. |
| • | Amenities: Within many of our communities, we may own and/or operate resort-style club and fitness facilities, championship golf courses, country clubs and marinas. We believe that these amenities offer our homebuyers a luxury lifestyle experience, enabling us to enhance the marketability, sales volume and value of the homes we deliver as compared to non-amenitized communities. Our Amenities operations derive revenues primarily from the sale of club memberships, membership dues, and golf and restaurant operations. During the year ended December 31, 2014, our Amenities revenues were $23.6 million, an increase of 1.7% when compared to $23.2 million during the year ended December 31, 2013. During the year ended December 31, 2012, our Amenities revenues were $21.0 million. |
See Management’s Discussion and Analysis of Financial Condition and Results of Operations in Item 7 of Part II of this Annual Report on Form 10-K and Note 17 to our audited consolidated financial statements in Item 8 of Part II of this Annual Report on Form 10-K for additional financial information about our segments.
4
Table of Contents
Our Industry
U.S. Housing Market
The U.S. housing market continues to improve from the cyclical low points reached during the 2008 to 2009 national recession. Between the 2005 market peak and the 2011 trough, new single-family housing sales declined 76%, according to data compiled by the U.S. Census Bureau, and median resale home prices declined 34%, as measured by the CoreLogic Case-Shiller Index. During 2011, early signs of a recovery began to materialize in many markets around the country as a result of an improving macroeconomic backdrop and a historically high level of housing affordability. During the years ended December 31, 2014 and 2013, total homebuilding permits increased 4.8% and 19.4%, respectively, when compared to the immediately preceding year. Data compiled by the U.S. Census Bureau indicates that new single-family home permits during 2014 have rebounded more than 50% from the 2011 trough; however, as of December 31, 2014, such new home permits still remain 63% below their peak levels in 2005.
Florida Housing Market
The Florida homebuilding market was the second-largest in the U.S., as measured by 2014 permit issuance (single- and multi-family permits), according to data compiled by the U.S. Census Bureau. While the Florida housing market experienced a deeper contraction than other regions in the country during the recent recession and total permits remain approximately 70% off peak levels, we believe that it is now recovering, primarily due to improving demographic trends, an improving economy, a mild climate and a low tax rate environment. During 2014, the U.S. Census Bureau announced that Florida had become the third most populous state, with approximately 800 people moving to the state every day. Since April 2012, Florida’s annual job growth rate has exceeded the national rate. During 2014, Florida’s job base grew by 3.0%, representing a gain of 230,600 jobs, outpacing the corresponding national job growth rate of 2.1%. The pricing environment in the Florida housing market compares favorably to national averages. According to CoreLogic, from December 2013 to December 2014 single-family home prices were up 5.0% nationally and 5.6% in Florida. In addition, according to CoreLogic, single-family home prices nationwide remain 13.4% below their peak and 33.5% below their peak in Florida. We believe that this and other positive statewide economic data and metrics illustrate an improving housing market and potential opportunity for future growth.
Homebuilding
Homebuilding Activities
We are a luxury homebuilder with a focus on creating an outstanding buyer experience and providing a high-quality product. Our core operating philosophy is to provide our homebuyers a positive, memorable experience from the time they walk into our sales office until well after we have delivered their home. We actively engage buyers in every aspect of the building process, from tailoring our product to their lifestyle needs, with attractive design selections, to providing them updates on the entire construction process up to the point of delivering their home. Additionally, we believe that we attract buyers to purchase homes in our master-planned communities because of their prime locations and the amenity offerings that we create. As a result, our selling process focuses on the quality of our amenities and the lifestyle they provide, in addition to the award-winning design and construction of our homes. Collectively, we believe that our processes and products lead to a more satisfied homeowner and increase the number of potential buyers referred to our communities by existing homeowners.
The luxury lifestyle communities that we develop are distinguished by many sought-after attributes and amenities. The homes that we design, sell and build are across a broad range of price points and sizes. To meet the varying needs and desires of our target homebuyers, we maintain the expertise to deliver a variety of new home product lines, which gives us an opportunity to increase our market share. Throughout our history, we have successfully delivered homes across a broad spectrum of product offerings, ranging from homes targeting buyers in smaller communities to luxury homes in well-amenitized communities. Our expertise allows for a diversified product strategy that enables us to better serve a wide range of buyers, adapt quickly to changing market conditions and optimize performance and returns while strategically reducing portfolio risk. In conjunction with our land acquisition process, we determine the profile of buyers to target and design neighborhoods and homes with the specific needs of those buyers in mind. Our Homebuilding operation has the flexibility to efficiently deliver an extensive range of single- and multi-family homes to target both buyers that may be looking for value-oriented product, as well as those desiring the most luxurious of homes.
Amenities at our communities are typically owned by us and eventually either turned over to community residents or sold. Within our communities, we offer award-winning single- and multi-family homes targeting move-up, second-home and active adult buyers. We believe that our strong brand reputation, well-amenitized communities and luxury product offerings allow us to offer our new homes at premium average selling prices relative to our peers. Furthermore, we believe that many of our targeted homebuyers are more likely to value and pay for the quality of lifestyle, construction and amenities for which we are known.
5
Table of Contents
We evaluate land opportunities using a comprehensive business model, which is focused on, among other things, demographic, macroeconomic and micro-market trends, to determine the appropriate positioning in the market and probability of success. We believe that we continue to obtain the “first look” at many quality land opportunities in our existing and target markets due to our reputation and relationships with local land sellers, brokers and investors. We also believe that our land development expertise enhances our Homebuilding operations by enabling us to acquire and create larger, well-amenitized master-planned communities, control the timing of home site delivery and capture the opportunity to drive higher margins. We also have the experience and internal expertise to entitle, reposition and/or rezone potential land acquisitions that we believe will help us achieve attractive returns in the future.
We benefit from a significant and well-located existing land inventory in most of coastal Florida’s highest growth and largest markets, in which we own or control approximately 12,600 home sites as of December 31, 2014. The majority of our land holdings are within mature, well-amenitized, developed communities that have an established demand for homes. We own all of the home sites for our current expected home deliveries through 2015. Our significant land inventory allows us to be opportunistic in identifying and pursuing new land acquisitions and protects us against potential land shortages in the majority of our markets that exhibit land supply constraints. Capitalizing on our longstanding relationships with local land sellers, brokers and investors, as well as our extensive knowledge of Florida markets, we intend to selectively acquire future home sites in other locations to complement our already attractive land portfolio. We believe that our brand strength and reputation as a homebuilder and developer of land provides land brokers and sellers with confidence that they can close transactions with us on a timely basis and with minimal execution risk. Additionally, our focus on larger tracts of land for developing multi-phase, master-planned communities provides us with the opportunity to use our land development expertise, which can add value through re-entitlements, repositioning and/or possible land sales to third-parties. We intend to opportunistically open neighborhoods from within our existing land holdings, as they contain significant capacity for additional development.
We generally begin a master-planned community by purchasing undeveloped or partially developed real estate. We then commence infrastructure improvements and build complementary amenities in accordance with the development permits. Construction is managed by our employees but the labor, materials and equipment are provided by third-party subcontractors. Depending on the size of the community, infrastructure improvements and amenity construction are sometimes completed in phases, limiting the upfront capital that is needed. Upon completion of the initial phases of community improvements, we sell and build homes designed to meet our target buyers’ tastes and desires.
Homes are designed to be cost effective and efficient to construct, while complying with zoning requirements and building codes, including Florida’s stringent hurricane and energy efficiency regulations. We have a core product line, which we use across multiple communities, where applicable, to maximize operational efficiency. We engage nationally recognized independent architects and consultants to create and modify new designs. Additionally, we regularly collect buyer feedback, including feedback from focus groups and buyer surveys, and incorporate that information into new home and community designs to help ensure our products reflect current market preferences.
In our neighborhoods, we typically offer a variety of floor plans. The exterior of most plans may be modified with a different elevation, including, but not limited to, varying the type of materials used, placement of windows, and roof line and garage orientation. Our buyers also have the ability to customize their homes through a wide selection of options and upgrades available at our design centers. We maintain design centers staffed with professional designers, where many of the options are displayed and demonstrated to assist a buyer’s selection process. These options add additional revenues and typically improve the margins on the homes that include them.
We act as the general contractor in the construction of our homes. Our employees provide the purchasing, construction management and quality assurance for the homes that we build, while third-party subcontractors provide the material and labor components of our homes. Our construction managers oversee the construction of our homes, coordinate the activities of subcontractors and suppliers, review the work of subcontractors for quality and cost controls and monitor compliance with zoning and building codes. At all stages of production, they coordinate the activities of subcontractors to meet our production schedules and quality standards. We typically do not maintain significant inventories of construction materials, except for work in progress materials for homes under construction. We compete with other homebuilders for qualified subcontractors, raw materials and home sites in the markets where we operate. Our construction times range from approximately four to 12 months for our single- and multi-family homes and will typically vary based on several factors, including the size and complexity of a home’s design, the availability of labor, materials and supplies, and weather conditions.
We hire experienced subcontractors to supply the trade labor and to procure some or all of the building materials required for production activities. As is typical in the homebuilding industry, we generally do not have long-term contractual commitments with our subcontractors, suppliers or laborers. However, we maintain longstanding mutually beneficial relationships with many of our subcontractors. We leverage our size and extensive relationships to maximize efficiencies, achieve cost savings and ensure consistent practices with our subcontractors.
6
Table of Contents
Our contracts with subcontractors require that they comply with all federal, state and local laws, rules, regulations and ordinances that are applicable to their work. We also require that our subcontractors meet performance standards, maintain general liability insurance and worker’s compensation insurance and hold or acquire all necessary licenses, permits and approvals before they begin work. Our contracts generally require subcontractors to indemnify us, our subsidiaries, affiliates, directors, officers, employees and other agents against all actions, lawsuits, proceedings, claims, demands, losses and expenses arising from or related to acts or omissions by or on behalf of the subcontractors in connection with their work, as well as for any violation of or failure to comply with legal requirements. Upon commencement of a project, subcontractors are responsible for any damage or loss that occurs at the work site until we give final acceptance. While we contract with an Occupational Health and Safety Administration (“OSHA”) certified safety trainer to inspect all of our jobsites and maintain a comprehensive safety program across all of our projects, our subcontractors are ultimately responsible for managing the safety of their own employees.
Sales and Marketing
Our sales and marketing program employs a multi-faceted approach to attract and source potential homebuyers. We market our communities through our website, traditional media, social media and advertising outlets, among other marketing initiatives. We also leverage our extensive homebuyer database to develop strategically targeted electronic and direct marketing campaigns. The amenities in our communities enhance our brand and drive awareness through events such as the annual Franklin Templeton Shark Shootout, a PGA-sponsored event in our Tiburón community. We conduct local community focus groups with our homebuyers, people actively looking for a home and local realtors to better understand our customers and the critical factors in their buying decisions. We also develop communications and promotions targeted specifically for our extensive real estate broker network, as they are integral to our marketing process and impact our sales activities in many of our communities.
Our sales efforts are typically supported by sales centers with community scale models and displays. The sales centers are staffed with our licensed in-house commissioned sales personnel, armed with in-depth knowledge of our products and communities. We also maintain professionally decorated model homes demonstrating the features of our homes and the community lifestyle. These models are decorated based on the lifestyle of the targeted homebuyer. We believe that model homes play an integral role in the home buying process for a homebuyer and we will typically offer at least one fully decorated model per neighborhood.
Home construction is not typically started without a binding sales agreement; however, we employ a limited speculative homebuilding program where we start construction of a home without an associated new order. We typically sell our speculative homes while they are under construction or shortly after completion. As of December 31, 2014, we had an aggregate of 58 completed speculative homes and 201 speculative homes under construction. We continually monitor our speculative home needs based on market demand.
To purchase a home, a potential homebuyer will enter into a sales agreement and, in the case of a single-family home, provide us with a non-refundable earnest money cash deposit. In the case of sales of some of our multi-family homes that are considered condominium units under Florida law, the sales agreement and cash deposit are subject to a short rescission period. Once this period lapses, the agreement becomes binding on both parties and the cash deposit becomes non-refundable, subject to Florida law. Generally, the deposit requirement for a single- or multi-family home is approximately 10% to 20% of the total purchase price. Furthermore, homebuyers are generally required to make additional deposits when they select options or upgrade features for their homes. Our sales contracts stipulate that when homebuyers cancel their contracts with us (after any cure period), we have the right to retain their earnest money and option deposits, subject to Florida law. Our reported new orders include the number and value of contracts net of any cancellations occurring during the reporting period. Only outstanding sales agreements that have been signed by both the homebuyer and us are reported and included in our backlog.
Our sales agreements are generally not conditioned on the buyer securing financing. Given our target buyer demographics, on average, our homebuyers tend to rely less on mortgage financing for their purchases and typically provide higher deposits and down payments, compared to homebuyers nationally. During the years ended December 31, 2014, 2013 and 2012, approximately 58%, 44% and 44%, respectively, of our homebuyers were all-cash buyers, which we believe compares favorably to other publicly traded homebuilding companies and our peers. This positive homebuyer trend was a contributing factor to our low cancellation rates of 6.8%, 4.7% and 3.0% of our gross orders during 2014, 2013 and 2012, respectively, which we believe also compare favorably to most other public homebuilders in the U.S. during such years. We believe that our homes and communities will continue to be sought after as the U.S. population continues to age and seek second-home and retirement lifestyle communities, particularly now that they are increasingly able to sell their primary or current homes, given the improving national housing market. Between 2010 and 2030, the number of Florida residents who are 55 years old and over is expected to grow approximately 50% and we believe that we are well-positioned to capitalize on this trend, specifically in the communities that we offer for active adult and second-home buyers.
7
Table of Contents
Our Communities
The table below sets forth summary information about our Florida-based communities.
| As of December 31, 2014 | Year Ended December 31, 2014 |
Year Ended December 31, 2013 |
Year Ended December 31, 2012 |
|||||||||||||||||||||||||||||||||||||
| Community (City) |
Remaining Home Sites Owned and Controlled (1) |
Active Selling Neighborhoods (2) |
Homes Delivered |
Average Delivered Price ($ in thousands) |
Homes Delivered |
Average Delivered Price ($ in thousands) |
Homes Delivered |
Average Delivered Price ($ in thousands) |
||||||||||||||||||||||||||||||||
| Backlog | ||||||||||||||||||||||||||||||||||||||||
| Units | Contract Value ($ in thousands) |
|||||||||||||||||||||||||||||||||||||||
| Active Communities (3): |
||||||||||||||||||||||||||||||||||||||||
| Heron Bay (Parkland) |
168 | 2 | 55 | $ | 39,488 | 58 | $ | 699 | 109 | $ | 573 | $ | 70 | $ | 506 | |||||||||||||||||||||||||
| Estates at Tuscany (Delray Beach) (4) |
8 | — | — | — | — | — | — | — | — | — | ||||||||||||||||||||||||||||||
| Tiburón (Naples) |
30 | — | 30 | 24,952 | 47 | 879 | 35 | 896 | 31 | 847 | ||||||||||||||||||||||||||||||
| Livingston Lakes (Naples) |
230 | 1 | 2 | 503 | — | — | — | — | — | — | ||||||||||||||||||||||||||||||
| Artesia (Naples) |
595 | 4 | 8 | 2,648 | — | — | — | — | — | — | ||||||||||||||||||||||||||||||
| Raffia Preserve (Naples) |
359 | 2 | 21 | 10,174 | 4 | 454 | — | — | — | — | ||||||||||||||||||||||||||||||
| LaMorada (Naples) |
347 | — | — | — | — | — | — | — | — | — | ||||||||||||||||||||||||||||||
| Talis Park (Naples) (4) (5) |
90 | 1 | 18 | 14,519 | — | — | — | — | — | — | ||||||||||||||||||||||||||||||
| The Colony Golf & Bay Club (Bonita Springs) (6) |
414 | 2 | 36 | 26,775 | 61 | 639 | 8 | 590 | — | — | ||||||||||||||||||||||||||||||
| Pelican Preserve (Fort Myers) |
965 | 6 | 40 | 12,985 | 178 | 334 | 110 | 306 | 102 | 265 | ||||||||||||||||||||||||||||||
| Hampton Park (Fort Myers) |
313 | 3 | 40 | 12,264 | 61 | 330 | 36 | 328 | 2 | 324 | ||||||||||||||||||||||||||||||
| Miromar Lakes (Fort Myers) (4) |
10 | 1 | 3 | 1,595 | 12 | 536 | — | — | — | — | ||||||||||||||||||||||||||||||
| Shadow Wood Preserve (Fort Myers) (4) |
18 | 1 | 1 | 672 | 1 | 760 | — | — | — | — | ||||||||||||||||||||||||||||||
| Timberwood Preserve (Fort Myers) |
43 | — | — | — | — | — | — | — | — | — | ||||||||||||||||||||||||||||||
| Venetian Golf & River Club (Venice) |
222 | 4 | 44 | 17,312 | 87 | 352 | 63 | 354 | 33 | 311 | ||||||||||||||||||||||||||||||
| Sarasota National (Venice) |
1,505 | 5 | 44 | 14,815 | 47 | 334 | — | — | — | — | ||||||||||||||||||||||||||||||
| Rosedale (Bradenton) (4) |
150 | — | — | — | — | — | — | — | — | — | ||||||||||||||||||||||||||||||
| Tidewater Preserve (Bradenton) |
254 | 4 | 39 | 17,438 | 88 | 404 | 60 | 380 | 29 | 351 | ||||||||||||||||||||||||||||||
| Westshore Yacht Club (Tampa) (6) |
214 | 1 | 11 | 9,172 | — | — | 36 | 331 | 23 | 457 | ||||||||||||||||||||||||||||||
|
|
|
|
|
|
|
|
|
|
|
|
|
|
|
|||||||||||||||||||||||||||
| Total Active Communities |
5,935 | 37 | 392 | $ | 205,312 | 644 | 457 | 290 | ||||||||||||||||||||||||||||||||
|
|
|
|
|
|
|
|
|
|||||||||||||||||||||||||||||||||
|
|
Total Closed-Out Communities |
|
— | — | 36 | 346 | 62 | 311 | ||||||||||||||||||||||||||||||||
|
|
|
|
|
|
|
|||||||||||||||||||||||||||||||||||
|
|
Total Homes Delivered |
|
644 | 452 | 493 | 433 | 352 | 396 | ||||||||||||||||||||||||||||||||
|
|
|
|
|
|
|
|||||||||||||||||||||||||||||||||||
| Other Communities (7): |
||||||||||||||||||||||||||||||||||||||||
| Parkland Bay (Parkland) |
514 | |||||||||||||||||||||||||||||||||||||||
| Arborwood (Fort Myers) |
719 | |||||||||||||||||||||||||||||||||||||||
| Multi-Family Parcel (Fort Myers) |
236 | |||||||||||||||||||||||||||||||||||||||
| Multi-Family Parcel (Fort Myers) |
48 | |||||||||||||||||||||||||||||||||||||||
| Master-Planned Parcel (Fort Myers) |
180 | |||||||||||||||||||||||||||||||||||||||
| Hammock Bay (Naples) (6) |
232 | |||||||||||||||||||||||||||||||||||||||
| Hammock Dunes (Palm Coast) (4) (6) |
128 | |||||||||||||||||||||||||||||||||||||||
| Lost Key Golf & Beach Club (Perdido Key) (6) (8) |
551 | |||||||||||||||||||||||||||||||||||||||
| Lost Key Marina & Yacht Club (Pensacola) (6) |
70 | |||||||||||||||||||||||||||||||||||||||
|
|
|
|||||||||||||||||||||||||||||||||||||||
| Total Other Communities |
2,678 | |||||||||||||||||||||||||||||||||||||||
|
|
|
|||||||||||||||||||||||||||||||||||||||
| Total Communities |
8,613 | |||||||||||||||||||||||||||||||||||||||
|
|
|
|||||||||||||||||||||||||||||||||||||||
| Controlled Home Sites (9): |
||||||||||||||||||||||||||||||||||||||||
| Master-Planned Parcel (Naples) |
64 | |||||||||||||||||||||||||||||||||||||||
| Master-Planned Parcel (St. Johns County) |
850 | |||||||||||||||||||||||||||||||||||||||
| Master-Planned Parcel (St. Lucie County) |
3,000 | |||||||||||||||||||||||||||||||||||||||
| Multi-Family Parcel (Manatee County) |
92 | |||||||||||||||||||||||||||||||||||||||
|
|
|
|||||||||||||||||||||||||||||||||||||||
| Total Controlled Home Sites |
4,006 | |||||||||||||||||||||||||||||||||||||||
|
|
|
|||||||||||||||||||||||||||||||||||||||
| Total Owned and Controlled Home Sites |
12,619 | |||||||||||||||||||||||||||||||||||||||
|
|
|
|||||||||||||||||||||||||||||||||||||||
| (1) | Amounts are approximate and include home sites in our backlog. Such amounts are subject to change based on, among other things, future site planning, as well as zoning and permit changes. Existing entitlements are equal to or greater than our planned home sites. |
| (2) | Represents neighborhoods where (i) we have sold at least one home during the current year and one or more units remain available to sell at the end of such year or (ii) we have two or more units available to sell at the end of the current year and have sold one or more homes in a prior year. |
| (3) | Represents communities and land positions in which we are actively selling homes or developing home sites. |
| (4) | Represents home sites in a master-planned community in which we are not the developer. |
| (5) | During the years ended December 31, 2014 and 2013, we entered into option contracts for the purchase of 90 home sites. As of December 31, 2014, we had purchased and closed on 42 home sites and controlled the remaining 48 home sites. |
| (6) | Represents communities with land entitled for tower units, consisting of: The Colony Golf & Bay Club (three sites/316 planned units), Westshore Yacht Club (two sites/160 planned units), Hammock Bay (two sites/232 planned units), Hammock Dunes (two sites/128 planned units), Lost Key Golf & Beach Club (two sites/122 planned units) and Lost Key Marina & Yacht Club (one site/70 planned units). |
| (7) | Represents communities and land positions in which we do not have active Homebuilding operations as of December 31, 2014 (the aggregate book value thereof on such date was $43.9 million). These communities are in various states of entitlements, product planning or market analysis and represent planned communities that will increase our neighborhood and order counts going forward. |
| (8) | Based on changes to our future site plan, the remaining home sites were reduced by approximately 50% from December 31, 2013 to December 31, 2014. In addition, certain home sites also have entitlements for an aggregate of 500 hotel units. |
| (9) | Represents home sites under land purchase contracts. Lot option contracts are included in active communities. There can be no assurances that we will acquire any of these home sites on the terms or within the timing anticipated, or at all, or that we will proceed to sell and build homes on any of the land we own, control or acquire. See “Risk Factors—Risks Related to Our Business—We may not be successful in our efforts to identify, complete or integrate acquisitions, which could adversely affect our results of operations and future growth.” in Item 1A of Part I of this Annual Report on Form 10-K. |
8
Table of Contents
Home Sites by Development Status
The table below sets forth summary information about the development status of our home sites as of December 31, 2014 (amounts are approximate and are subject to change based on, among other things, future site planning, as well as zoning and permit changes).
| Development Status |
Owned | Controlled (1) | Total | |||||||||
| Single- and multi-family home sites: |
||||||||||||
| Finished |
2,024 | 92 | 2,116 | |||||||||
| Partially developed |
2,814 | — | 2,814 | |||||||||
| Raw |
2,747 | 3,914 | 6,661 | |||||||||
|
|
|
|
|
|
|
|||||||
| Total single- and multi-family home sites |
7,585 | 4,006 | 11,591 | |||||||||
| Tower sites (partially developed) |
1,028 | — | 1,028 | |||||||||
|
|
|
|
|
|
|
|||||||
| Total |
8,613 | 4,006 | 12,619 | |||||||||
|
|
|
|
|
|
|
|||||||
| (1) | See footnote (9) to the “Our Communities” table above. |
Warranty
We generally provide our single- and multi-family homebuyers with a one to three-year limited warranty for all material and labor and a ten-year warranty for certain structural defects. Warranty reserves are established by charging cost of sales and establishing a warranty liability upon each home delivery. The amounts charged are estimated by us to be adequate to cover expected warranty-related costs under all unexpired warranty obligation periods. Our warranty reserves are based on historical warranty cost experience and are adjusted as appropriate to reflect qualitative risks associated with the homes constructed.
We require our subcontractors to meet performance standards and maintain adequate insurance coverage to protect us against construction defects and bodily injury claims. As a result, claims relating to workmanship and materials are generally the primary responsibility of our subcontractors.
Real Estate Services
Real Estate Brokerage
We operate a full-service real estate brokerage business as Berkshire Hathaway HomeServices Florida Realty in most of the largest metropolitan areas in Florida through our wholly-owned subsidiary Watermark Realty, Inc. (“Watermark”). As of December 31, 2014, we had 40 brokerage offices. Our real estate brokerage business positions us to benefit from the growth in Florida resale home prices, supplementing our ability to capitalize on new home sales through our Homebuilding segment. As distressed home sales as a percent of total home sales continue to drop and new home sales as a percent of total sales continue to increase, we expect the average selling price of homes across Florida to appreciate, driving margin growth in our real estate brokerage business. As our real estate brokerage business is highly scalable, we believe that there are opportunities to further improve our profitability by growing our geographic footprint organically, through opportunistic acquisitions and “roll-in” brokerages. Watermark also helps provide valuable real-time insight into market trends, buyer preferences and demand for different products and locations, which we will continue to use to evaluate land opportunities, community and amenity plans and home designs in our Homebuilding operations. This insight is gained by, among other things, monthly surveys and focus groups comprised of our knowledgeable and local real estate agents, as well as analyzing data derived from our information systems.
9
Table of Contents
We compete with national and regional independent real estate organizations, other national real estate franchisors, franchisees of local and regional real estate franchisors, discount brokerages and smaller niche companies competing in local areas. We also compete with those entities when hiring and retaining qualified licensed independent sales agents. Generally, we enter into independent contractor agreements with qualified licensed independent real estate agents to retain their professional services for soliciting buyers, tenants, sellers and landlords of residential properties. Such agreements govern how earned commissions are split between our agents and Watermark along with any additional fees charged to the agents for support services provided by us. Pursuant to such agreements, we do not have an employer-employee relationship with these real estate agents and, as a result, we do not control the manner and means by which these real estate agents operate, and are not obligated to withhold income taxes, social security taxes, disability, workers’ compensation or unemployment insurance payments, unless required by law. We also do not provide for any minimum salary payment, sick pay, vacation pay, health insurance or any other benefits. Our contracts require that the real estate agents comply with all applicable laws, rules, regulations and codes of ethics and maintain all necessary licenses. Our agents negotiate all of the terms and conditions of commissions charged to clients and we are not liable to the agents for commission payments until transactions are fully closed and full funding to Watermark has occurred.
We manage the inherent risks involved with our collective real estate transactions through Watermark’s Professional Liability Risk Management Program. Through this program, we assess and apply our resources to reduce and finance any identified professional liability loss exposure. To finance and limit the impact of such exposures, we maintain professional liability insurance policies to cover losses due to errors or omissions committed for or on behalf of our operations in Florida. We otherwise require that the real estate agents maintain automobile liability insurance and indemnify Watermark, us, our subsidiaries, affiliates, shareholders, directors, officers, employees and other representatives from any liability caused by the agent’s negligence, fraud or omissions, as well as any claims arising out of the agent’s personal activities.
Watermark currently does business as Berkshire Hathaway HomeServices Florida Realty pursuant to a franchise agreement with BHH Affiliates, LLC (the “Berkshire Agreement”) that became effective during October 2013 and made us one of the first franchisees to operate under the new Berkshire Hathaway HomeServices brand name. We believe that this new brand strengthens our ability to take advantage of the improving resale home market. From June 1999 to September 2013, we operated under the Prudential brand.
Pursuant to the Berkshire Agreement, we have the exclusive right to provide real estate brokerage services using the brand name in Broward, Lee and Martin Counties, and in portions of Collier, Miami-Dade, Palm Beach and Saint Lucie Counties, all of which are in Florida. We pay annual and monthly royalties and fees based on gross revenues. Under the Berkshire Agreement, we must comply with operating standards and terms and conditions imposed by the franchisor and must obtain its consent to open new operating locations or operate other businesses within the insurance or real estate brokerage industries. The Berkshire Agreement permits the franchisor to terminate the agreement in certain cases, such as a failure by us to meet certain obligations thereunder, bankruptcy, abandonment of the franchise, assignment of the franchise without the franchisor’s consent or material violations of any federal, state or local laws and regulations. If the Berkshire Agreement terminates due to our failure to comply with its terms and conditions, we may be liable for a termination payment.
Title Insurance and Settlement Services
In a majority of real estate transactions, a buyer will choose, or will be required, to purchase title insurance that will protect the buyer and/or the mortgage lender against loss or damage in the event that title is not properly transferred and to ensure free and clear ownership of the property by the buyer. Our title and settlement services business assists with the closing of a real estate transaction by providing full-service title and settlement (i.e., closing and escrow) services to individuals, real estate companies, including our company-owned real estate brokerage and relocation services businesses, and independent mortgage lenders. On August 1, 2014, we changed the d/b/a of our title and settlement services business from Florida Title & Guarantee to Florida Title & Guarantee Agency (collectively referred to hereinafter as “Florida Title & Guarantee Agency”). Our title business also allows us to better manage the closing process for our new home deliveries by providing a level of visibility and control over the home closing process in situations where homebuyers choose to use our title services. During the years ended December 31, 2014, 2013 and 2012, approximately 80%, 76% and 82%, respectively, of our home deliveries were settled by Florida Title & Guarantee Agency, and our Homebuilding and brokerage businesses provided for approximately 93%, 92% and 88%, respectively, of Florida Title & Guarantee Agency’s total title services revenues. As part of our title services, we also act as a title agent for a variety of large national underwriters and derive revenues from commissions on title insurance premiums and settlement services in respect of our homebuyers, third-party residential closings and commercial closings.
10
Table of Contents
Amenities
Our recreational amenities, including championship golf courses with clubhouses, fitness, spa, tennis and recreational facilities, walking trails, resort style pools, marinas, movie theaters, town centers, and a variety of restaurants, are central to our mission of delivering luxury lifestyle experiences to our homebuyers. Our Amenities operations derive revenues primarily from the sale of club memberships, membership dues, and golf and restaurant operations. Amenities at our communities are owned by either community residents or non-residents in equity membership programs, unaffiliated third-parties, community homeowners’ associations, or retained by us. As of December 31, 2014, we had approximately 5,700 members across all of our owned and managed clubs. As we plan the development of new communities, the ownership of the amenities is structured to cater to the preferences and expectations of community residents, and provide us with a specific exit plan, which may include a sale to the community homeowners association or a third-party as communities and their related amenities mature.
Amenities offer our homebuyers a luxury lifestyle experience, enabling us to enhance the marketability and sales value of the homes we deliver, as compared to non-amenitized communities. The amenities in our communities enhance our brand and drive awareness through events such as the annual Franklin Templeton Shark Shootout, a PGA-sponsored event in our Tiburón community. We continue to re-invest in our community amenities to adapt to changing demographics and homebuyer preferences to ensure they maintain their luxury appeal.
Other Investments
We selectively enter into business relationships through partnerships and joint ventures with unrelated parties. These partnerships and joint ventures will typically acquire, develop, market and operate homebuilding, timeshare, amenities and/or real estate services projects. As of December 31, 2014 and 2013, we were the general partner and a limited partner in Pelican Landing Golf Resort Ventures Limited Partnership (the “Golf Resort”) and a limited partner in Pelican Landing Timeshare Ventures Limited Partnership (the “Timeshare Venture”). The Golf Resort, a certified Audubon International Golf Signature Sanctuary, operates an 18-hole, Raymond Floyd-designed, public golf course, known as Raptor Bay Golf Club, in Bonita Springs, Florida. The Timeshare Venture operates a vacation ownership condominium complex in Bonita Springs, known as Hyatt Coconut Plantation, and sells vacation ownership intervals at the property by conveying fee title to buyers subject to a time-share plan.
Seasonality
We have historically experienced, and in the future expect to continue to experience, variability in our operating results on a quarterly basis in each of our three operating segments. Because many of our Florida homebuyers prefer to close on their new home purchases before the winter, the fourth quarter of each calendar year often produces a disproportionately large portion of our annual Homebuilding revenues, income and cash flows. Activity in our realty brokerage operations is greater during the spring and summer months as (i) buyers with families generally move when their children are out of school and (ii) Florida’s seasonal residents tend to make resale home purchases prior to leaving for the summer. These factors typically result in a larger portion of Real Estate Services revenues, income and cash flows during the second and third quarters of each calendar year. In addition, many of our club members spend the winter months in Florida, thereby producing a disproportionately large portion of our annual Amenities revenues and cash flows during that time period. Accordingly, revenues and operating results for our three operating segments may fluctuate significantly on a quarterly basis and we must maintain sufficient liquidity to meet short-term operating requirements.
As a result of seasonal activity, our results of operations during any given quarter are not necessarily representative of the results that we expect for the full calendar year or subsequent quarterly reporting periods. We expect these seasonal patterns to continue, although they may be affected by economic conditions in the homebuilding and real estate industry and other interrelated factors.
In contrast to our typical seasonal results, weakness in U.S. homebuilding market conditions during recent years has mitigated our historical seasonal variations. Although we may experience our typical historical seasonal pattern in the future, we can make no assurances as to when or whether this pattern will recur. See “Risk Factors—Risks Related to Our Business—Our quarterly operating results may fluctuate because of the seasonal nature of our business and other factors.” in Item 1A of Part I of this Annual Report on Form 10-K.
Raw Materials
The principal raw materials used in the construction of our homes are concrete and forest products. In addition, we use a variety of other construction materials in the homebuilding process, including drywall, plumbing and electrical items. Typically, all the raw materials and most of the components used in our business are readily available in the U.S. Most of our standard items are carried by major suppliers. We attempt to enhance the efficiency of our operations by using, where practical, standardized materials that are commercially available on competitive terms from a variety of sources. Moreover, our purchasing programs for certain building materials, appliances, fixtures and other items allow us to benefit from large quantity purchase discounts and, where available, manufacturer or supplier rebates. We continue to monitor the supply markets to achieve the best prices available. However, a rapid increase in the number of homes started could cause shortages in the availability of such materials, thereby leading to delays in the delivery of homes under construction. See “Risk Factors—Risks Related to Our Business—Labor and raw materials and building supply shortages and price fluctuations and other problems in the construction of our communities could delay or increase the costs of home construction and adversely affect our operating results.” in Item 1A of Part I of this Annual Report on Form 10-K.
11
Table of Contents
Competition
We compete in each of our markets with other local, regional and national homebuilders. We not only compete for homebuyers, but also for desirable land assets, financing, building materials, skilled management talent and trade labor. We also compete with other housing alternatives, such as existing home sales (including lender-owned homes acquired through foreclosure or short sales) and rental housing. We believe that we have a competitive advantage in attracting many of our targeted homebuyers, as they are more likely to value and pay for the quality of lifestyle, construction and amenities in the well-amenitized, master-planned communities for which we are known.
Certain of our homebuilding competitors, including larger public companies, may have long-standing relationships with local labor, materials suppliers or land sellers in certain areas, which may provide them an advantage in their respective regions or local markets. They may also have longer operating histories, better relationships with suppliers and subcontractors and may have more resources or lower cost of capital than us. These competitive conditions may adversely affect our business, financial condition and results of operations by decreasing our revenues, impairing our ability to successfully execute our land acquisition and land asset management strategies, increasing our costs and/or diminishing growth in our Homebuilding segment.
Our real estate brokerage business competes with national and regional independent real estate organizations, other national real estate franchisors, franchisees of local and regional real estate franchisors, discount brokerages and smaller niche companies competing in local areas. Real estate brokers compete for sales and marketing business primarily on the basis of services offered, reputation, utilization of technology, personal contacts and brokerage commission. Additionally, the real estate brokerage industry has minimal barriers to entry for new participants, including participants pursuing non-traditional methods of marketing real estate, such as Internet-based brokerage or brokers who discount their commissions.
Government Regulation, Health and Safety and Environmental Matters
Government Regulation
Our Homebuilding segment operations, including land development activities, are subject to extensive federal, state and local statutes, ordinances, rules and regulations, zoning and land use, building, employment and worker health and safety regulation. These laws and regulations affect all aspects of the homebuilding process and can substantially delay or increase the costs of Homebuilding activities, even on land for which we already have approvals. In addition, larger land parcels are generally undeveloped and may not have all of the governmental approvals necessary to develop and construct homes. If we are unable to obtain these approvals or obtain approvals that restrict our ability to use the land in ways that we did not anticipate, the value of the parcel will be negatively impacted. During the development process, we must obtain a number of approvals from various governmental authorities that regulate matters such as: permitted land uses, levels of density and architectural designs; the level of energy efficiency our homes are required to achieve; the building of roadways and creation of traffic control mechanisms and the installation of utility services, such as water, sewage and waste disposal, drainage and storm water control, electricity and natural gas; the dedication of acreage for open space, parks, schools and other community services; and the preservation of habitat for endangered species and wetlands, storm water control and other environmental matters. These government entities often have broad discretion in exercising their approval authority. The approval process can be lengthy and cause significant delays or permanently halt the development process. The approval process may also be opposed by neighboring landowners, consumer or environmental groups, among others, and that in turn can cause significant delays or permanently halt the development process. In addition, new housing developments are often subject to various assessments for schools, parks, streets, highways and other public improvements. Our projects may also contain water features such as lakes or marinas for boating or other recreational activities. These water features may be subject to governmental regulations that could result in high or unexpected maintenance costs. Additionally, local governments in some of the areas where we operate have approved, and others where we operate or may operate in the future may also approve, various “slow growth” or “no growth” homebuilding initiatives and other ballot measures that could negatively impact the availability of land and building opportunities within those jurisdictions.
Our condominiums in Florida are subject to Florida law and administrative regulations, which, among other things, cover the requirements for gaining approval of our projects and funding reserves for each condominium. In connection with our development of condominiums and the offering of condominium units for sale, we must submit regulatory filings in accordance with applicable laws and regulations.
We are also subject to state legislation and Internal Revenue Service rulings pertaining to community development districts or similar development authorities (collectively, “CDDs”). A CDD is a local, special purpose government framework authorized by Florida’s Uniform Community Development District Act of 1980, as amended, and provides a mechanism to manage and finance the infrastructure required to develop new communities. CDDs are legal entities with the ability to enter into contracts, own property, sue and be sued, and impose and levy taxes and/or assessments. CDDs are subject to audit and rulings from the Internal Revenue Service with respect to the tax-exempt status of their bonds.
12
Table of Contents
We are subject to various laws and regulations containing general standards for and limitations on the conduct of real estate brokers and sales associates, including those relating to the licensing of brokers and sales associates, administration of escrow funds, collection of commissions, advertising and consumer disclosures. Under Florida law, real estate brokers are responsible for the conduct of their brokerage business, including the supervision of their sales associates. Although real estate sales agents historically have been classified as independent contractors, rules and interpretations of federal and state employment laws and regulations could change, including those governing employee classification and wage and hour regulations, and those changes may impact industry practices and our real estate brokerage operations.
Our title subsidiary must comply with various real estate and other laws and regulations that impose licensing and other compliance requirements on our title insurance business. Our title and brokerage practices are also subject to regulation by the Consumer Financial Protection Bureau under the Dodd-Frank Wall Street Reform and Consumer Protection Act. In addition, in order for our homebuyers to obtain Federal Housing Administration-insured or Veterans Administration-guaranteed mortgages, we must build our homes in compliance with the regulations issued by those agencies. We are a licensed contractor registered in Florida and must comply with applicable laws and regulations.
Although we believe that, in all material respects, our operations are in full compliance with applicable federal, state and local requirements, our operations may be materially impacted and our growth and development opportunities may be limited and more costly as a result of legislative, regulatory or municipal requirements. See “Risk Factors—Risks Related to Our Business—We are subject to extensive governmental regulation, which may substantially increase our costs of doing business and negatively impact our financial condition and results of operations. Failure to comply with laws and regulations by our employees or representatives may harm us.” in Item 1A of Part I of this Annual Report on Form 10-K.
Health and Safety
We consider health, safety and accident prevention to be of primary importance in all phases of our Homebuilding operation and administration. To comply with the provisions of OSHA, we have established and implemented a health and safety program. This program includes informing employees of our health and safety policies and procedures, conducting documented safety inspections and meetings, and applying corrective action for failure to comply with applicable laws and standards. We contract with a trainer who performs OSHA and certified CPR and First Aid training and monitors and inspects our jobsites. Our subcontractors are required to maintain health and safety programs that meet all applicable laws and standards, and provide competent persons on our jobsites who are able to conduct adequate health and safety training, and ensure that tools and equipment are in a safe condition.
Environmental Matters
We are also subject to various federal, state and local environmental laws and regulations relating to the operation of our properties, which are administered by numerous federal, state and local governmental agencies. We expect that increasingly stringent laws and regulations will be imposed on homebuilders in the future. As climate change concerns grow, legislation and regulatory activity of this nature is expected to continue and become more onerous. Additionally, environmental and energy efficiency requirements imposed by government regulations could add to building costs and have an adverse impact on the availability and price of certain raw materials such as lumber, which in turn could reduce our profitability.
From time to time, the U.S. Environmental Protection Agency and similar federal or state agencies conduct inspections of our properties for compliance with these environmental laws and a failure to strictly comply may result in an assessment of fines and penalties and an obligation to undertake corrective actions. Any such enforcement actions may increase our costs. See “Risk Factors—Risks Related to our Business—Compliance with applicable environmental laws may substantially increase our costs of doing business, which could negatively impact our financial condition and results of operations.” in Item 1A of Part I of this Annual Report on Form 10-K.
Under various environmental laws and regulations, current or former owners or operators of real estate, whether leased or owned, as well as certain other categories of parties, may be required to investigate and clean up hazardous or toxic substances or petroleum product releases, and may be held liable to a governmental entity or to third-parties for related damages, including bodily injury, and investigation and clean-up costs incurred by such parties in connection with the contamination, regardless of whether such contamination or environmental conditions were created by the current or prior owner or tenant, or by a third-party or neighboring property. The costs of any required removal, investigation or remediation of such substances or the costs of defending against environmental claims may be substantial. The presence of such substances, or the failure to remediate such substances properly, may also adversely affect our ability to sell the land or to borrow using the land as security. Although environmental site assessments conducted at our properties have not revealed any environmental liability that we believe would have a material adverse effect on our business, financial condition or results of operations, nor are we aware of any material environmental liability or concerns, there can be no assurances that the environmental assessments that we have undertaken have revealed all potential environmental liabilities, or that an environmental condition does not otherwise exist as to any one or more of our properties that could have a material adverse effect on our business, financial condition or results of operations.
13
Table of Contents
Employees
As of December 31, 2014, we had 667 full-time year-round employees, of which 193 were Homebuilding and corporate employees, 132 were Real Estate Services employees and 342 were Amenities employees. While our Homebuilding and corporate employees oversee our Homebuilding operations, we hire experienced third-party subcontractors to supply the trade labor and to procure some or all of the building materials required for all production activities. Moreover, as of December 31, 2014, we had exclusive relationships with approximately 1,600 independent licensed real estate agents through our real estate brokerage business.
Intellectual Property
We own certain logos and trademarks that are important to our overall branding and sales strategy. As of December 31, 2014, we owned over 40 registered trademarks and over 100 domain names.
Information Technology
We use information technology and other computer resources to carry out important operational and marketing activities, as well as to maintain our business and employee records. Many of these resources are provided to us and/or maintained on our behalf by third-party service providers pursuant to agreements that specify certain security and service level standards. See “Risk Factors—Risks Related to Our Business—Information technology failures, data security breaches and other similar adverse events could harm our business.” in Item 1A of Part I of this Annual Report on Form 10-K.
Insurance
We maintain insurance through third-party commercial insurers, subject to deductibles and self-insured amounts, to protect against various risks associated with our activities, including, among other things, general liability, property, workers’ compensation, automobile and employee fidelity and management liability. Litigation is managed by our legal department with assistance from our risk management team on insurance coverage matters and other division personnel as required. We are focused on claim prevention through training, standardized documentation and centralized processes.
Available Information
We maintain a website at www.wcicommunities.com where we make available, free of charge, documents that we file with, or furnish to, the Securities and Exchange Commission (the “SEC”), including our Annual Reports on Form 10-K, Quarterly Reports on Form 10-Q, Current Reports on Form 8-K, proxy statements, registration statements and any amendments to those reports. We make this information available as soon as reasonably practicable after we electronically file such materials with, or furnish such information to, the SEC. Our SEC reports can be found under Investor Relations on our website. The information contained in, or that can be accessed through, our website is not incorporated by reference and is not a part of this or any other report that we file with, or furnish to, the SEC.
| Item 1A. | Risk Factors. |
Certain factors may have a material adverse effect on our business, financial condition, results of operations and/or cash flows. Shareholders, investors and other interested parties should carefully consider the risk factors set forth below and the other information included elsewhere in this Annual Report on Form 10-K. If any of the events described below occur or if our actual results, performance or achievements differ materially from those expressed or implied by the forward-looking statements included in this Annual Report in Form 10-K, our business, financial condition, results of operations and/or cash flows could be materially impaired and the trading price of our common stock could decline. Shareholders, investors and other interested parties should be aware that the risk factors described below and the other information set forth elsewhere in this Annual Report on Form 10-K may not describe every risk facing our company. Additional risks and uncertainties not currently known to us or that we currently deem to be immaterial may also materially adversely affect our business, financial condition, results of operations and/or cash flows.
Risks Related to Our Business
The recent improvement in housing market conditions following a prolonged and severe housing downturn may not continue, and any slowing or reversal of the present housing recovery may materially and adversely affect our business and results of operations.
During the three-year period ended December 31, 2014, several housing markets stabilized and began recovering after years of weak demand and excess supply during the housing downturn. In these markets, there were generally more sales of new and resale homes, higher selling prices and fewer homes available for sale, in each case as compared to the prior year. There were also more overall housing starts and construction permits authorized in the U.S., reflecting increased construction activity. These trends have been driven in large part by record-low interest rates for mortgage loans that, in combination with relatively low home selling prices, have made homeownership more affordable compared to historical levels and to rental housing costs, which have been rising over the past few years.
14
Table of Contents
With the emerging housing recovery, we and other homebuilders generally reported increased orders and deliveries and better year-over-year financial results during the three-year period ended December 31, 2014. While some of the many negative factors that contributed to the housing downturn may have moderated, several remain, and they could return and/or intensify to inhibit any future improvement in housing market conditions. These negative factors include (i) weak general economic and employment growth that, among other things, restrains consumer incomes, consumer confidence and demand for homes; (ii) elevated levels of mortgage loan delinquencies, defaults and foreclosures that could add to a “shadow inventory” of lender-owned homes that may be sold in competition with new and other resale homes at low “distressed” prices or that generate short sales activity at such price levels; (iii) a significant number of homeowners whose outstanding principal balance on their mortgage loan exceeds the market value of their home, which undermines their ability to purchase another home that they otherwise might desire and be able to afford; (iv) volatility and uncertainty in U.S. financial, credit and consumer lending markets amid slow growth or recessionary conditions; and (v) tight lending standards and practices for mortgage loans that limit consumers’ ability to qualify for mortgage financing to purchase a home, including increased minimum credit score requirements, credit risk/mortgage loan insurance premiums and/or other fees and required down payment amounts, more conservative appraisals, higher loan-to-value ratios and extensive buyer income and asset documentation requirements. Additional headwinds may come from the efforts and proposals of lawmakers to reduce the debt of the federal government and/or solve state budget shortfalls through tax increases and/or spending cuts, and/or government shutdowns, and financial markets’ and businesses’ reactions to those efforts and proposals, which could impair economic growth. Given these factors, we can provide no assurances that the present housing recovery will continue or gain further momentum, whether overall in the U.S. or in Florida.
The present housing recovery is relative to an extremely low level of consumer demand for homes, home sales and new residential construction activity, reflecting the severity of the housing downturn. Even with the industry upturn, sales, deliveries, revenues and profitability remain well below, and may not return to, the peak levels reached shortly before the housing downturn began. If the present housing recovery stalls or does not continue at the same pace, or any or all of the negative factors described above persist or worsen, particularly if there is limited economic growth or a decline, low growth or decreases in employment and consumer incomes, and/or continued stringent mortgage lending standards and practices, there would likely be a corresponding adverse effect on our business and our consolidated financial statements, including, but not limited to, the number of homes we deliver, our average selling prices, the amount of revenues we generate and our ability to operate profitably, and the effect may be material.
Our business is cyclical and significantly affected by changes in general and local economic conditions.
Demand for new homes is cyclical and highly sensitive to economic conditions over which we have no control, including changes in:
| • | short- and long-term interest rates; |
| • | inflation; |
| • | employment levels and job and personal income growth; |
| • | housing demand from population growth, household formation and other demographic changes, among other factors; |
| • | availability and pricing of mortgage financing for homebuyers; |
| • | consumer confidence generally and the confidence of potential homebuyers in particular; |
| • | U.S. and global financial system and credit market stability; |
| • | private party and government mortgage loan programs (including changes in Federal National Mortgage Association (“Fannie Mae”), Federal Home Loan Mortgage Corporation (“Freddie Mac”) and the Federal Housing Administration (the “FHA”), or successor agencies, conforming mortgage loan limits, credit risk/mortgage loan insurance premiums and/or other fees, down payment requirements and underwriting standards), and federal and state regulation, oversight and legal action regarding lending, appraisal, foreclosure and short sale practices; |
| • | federal and state personal income tax rates and provisions, including provisions for the deduction of mortgage loan interest payments, real estate taxes and other expenses; |
15
Table of Contents
| • | supply of and prices for available new or resale homes (including lender-owned homes) and other housing alternatives, such as apartments, single-family rentals and other rental housing; |
| • | the rate at which “shadow inventory” enters into the housing market; |
| • | homebuyer interest in our current or new product designs and new home community locations, and general consumer interest in purchasing a home compared to choosing other housing alternatives; and |
| • | real estate taxes. |
Adverse changes in these conditions may affect our business generally or may be more prevalent or concentrated in particular regions or localities in which we operate. Economic conditions in some of our markets continue to be characterized by varying levels of uncertainty. Any deterioration in economic conditions or continuation of uncertain economic conditions would have a material adverse effect on our business.
Adverse changes in economic conditions can also cause demand and prices for our homes to diminish or cause us to take longer to build our homes and make it more costly for us to do so. We may not be able to recover these increased costs by raising prices because of weak market conditions and because the price of each home we sell is usually set several months before the home is delivered, as many buyers sign their home purchase contracts before construction begins. The potential difficulties described above could impact our buyers’ ability to obtain suitable financing and cause some homebuyers to cancel or refuse to honor their home purchase contracts altogether. In addition, because we primarily target buyers for homes in luxury lifestyle communities, we may be more susceptible to adverse changes in general and local economic conditions.
Our geographic concentration in Florida could adversely affect us if the homebuilding industry in Florida should decline.
During each of the years ended December 31, 2014, 2013 and 2012, substantially all of our revenues were generated from our Florida operations. During the downturn from 2006 to 2010, the value of land, the demand for new homes and home selling prices declined substantially in Florida, which materially and adversely impacted our business, financial condition and results of operations. Although the Florida housing market continues to recover, we cannot predict the extent or timing of its further recovery, if at all. There can be no assurances that our business, financial condition and results of operations will not be further adversely affected if the conditions in Florida do not continue to improve or any improvement takes place over an extended period of time. Because our operations are concentrated in Florida, a prolonged economic downturn in one or more Florida markets could have a material adverse effect on our business, financial condition and results of operations, and a disproportionately greater impact on us than other homebuilders with more geographically diversified operations. Slower rates of population growth or population declines in our Florida markets could affect the demand for housing, causing home prices in these markets to fall, and adversely affect our business, financial condition and results of operations. Additionally, if buyer demand for new homes in Florida weakens, home selling prices may decline, which will adversely impact our profitability.
Our quarterly operating results may fluctuate because of the seasonal nature of our business and other factors.
We have historically experienced, and in the future expect to continue to experience, variability in our operating results on a quarterly basis in each of our three operating segments. Because many of our Florida homebuyers prefer to close on their new home purchases before the winter, the fourth quarter of each calendar year often produces a disproportionately large portion of our annual Homebuilding revenues, income and cash flows. Activity in our realty brokerage operations is greater during the spring and summer months as (i) buyers with families generally move when their children are out of school and (ii) Florida’s seasonal residents tend to make resale home purchases prior to leaving for the summer. These factors typically result in a larger portion of Real Estate Services revenues, income and cash flows during the second and third quarters of each calendar year. In addition, many of our club members spend the winter months in Florida, thereby producing a disproportionately large portion of our annual Amenities revenues and cash flows during that time period. Accordingly, revenues and operating results for our three operating segments may fluctuate significantly on a quarterly basis and we must maintain sufficient liquidity to meet short-term operating requirements. Additionally, delays, severe weather, natural disasters or significant negative economic events that occur in the fall or early winter may have a disproportionate effect on our revenues, income and cash flows. We believe that quarter to quarter comparisons of our results should not be relied upon as an indicator of future performance. As a result of such fluctuations, the price of our common stock may experience volatility. See “Business—Seasonality” in Item 1 of Part I of this Annual Report on Form 10-K and “Management’s Discussion and Analysis of Financial Condition and Results of Operations—Seasonality” in Item 7 of Part II of this Annual Report on Form 10-K.
16
Table of Contents
We may not be able to maintain our Homebuilding segment gross margins in the future.
Our Homebuilding segment gross margin percentages during the years ended December 31, 2014, 2013 and 2012 were 28.4%, 30.0% and 31.4%, respectively. Our Homebuilding gross margins during such three-year period were favorably impacted by the low book value of our land, which was reset to then-current fair value during September 2009 in accordance with fresh start accounting requirements upon our emergence from bankruptcy. We expect that homes delivered from communities we owned in September 2009 that were reset to then-current fair values will have a gross margin percentage approximately 5% to 10% higher than homes delivered from our most recent land acquisitions. As of December 31, 2014, approximately 36% of our total owned and controlled home sites, or approximately 4,600 home sites, benefited from being reset to fair value in September 2009. While we currently have a portion of our land inventory at an attractive book value when compared to the current fair value of that land, based on the prices of the land we have purchased more recently, and as we acquire and develop land in the future at then-current market prices, we anticipate that the favorable impact of our low book value land on our Homebuilding gross margin will lessen in the future. Additionally, the opportunity to purchase substantially finished home sites in desirable locations is becoming increasingly more limited and competitive. As a result, we are spending more on land development, as we are purchasing more undeveloped land and partially finished home sites. Moreover, weak general economic conditions, including low employment and population growth, future competition and other factors may impact our ability to realize sales prices in excess of the book value of our land inventory or to continue to increase our home selling prices and increase sales in new communities and neighborhoods. These factors could impact our ability to maintain our current level of Homebuilding gross margin in the future.
The homebuilding industry and housing market are very competitive and such conditions could adversely affect our business or our financial results.
The homebuilding industry is highly competitive. Homebuilders compete not only for homebuyers, but also for desirable land assets, financing, building materials, and skilled management talent and trade labor. We compete in each of our markets with other local, regional and national homebuilders. Other homebuilders also have long-standing relationships with local labor, materials suppliers or land sellers in certain areas, which may provide an advantage in their respective regions or local markets. In addition, a number of our primary competitors are relatively larger companies, have longer operating histories, have higher business volumes, have relationships with more suppliers and subcontractors and may have more resources or a lower cost of capital than us. We may be at a competitive disadvantage with regard to certain competitors whose operations are more geographically diversified than ours, as those competitors may be better able to withstand any future downturn in the Florida housing market. While we do not provide any mortgage brokerage services, several of our competitors do offer such services, which may give them with a competitive advantage. We also compete with other housing alternatives, such as existing home sales (including lender-owned homes acquired through foreclosure or short sales) and rental housing. The competitive conditions in the homebuilding industry can result in:
| • | difficulty in our acquiring raw materials, skilled management and trade labor at acceptable prices; |
| • | our selling homes at lower prices; |
| • | our offering or increasing sales incentives, discounts or price concessions for our homes; |
| • | our delivering fewer homes; |
| • | our incurring higher construction and land costs; |
| • | our selling fewer homes or experiencing higher home purchase contract cancellations by buyers; |
| • | impairments in the value of our real estate inventories and other assets; |
| • | difficulty in acquiring desirable land assets that meet our investment return criteria, and in selling our interests in land assets that no longer meet such criteria on favorable terms or at all; |
| • | delays in the construction of our homes; and |
| • | difficulty in securing external financing, surety bonds (performance and financial) or letters of credit facilities on favorable terms. |
These competitive conditions may adversely affect our business, financial condition and results of operations by decreasing our revenues, impairing our ability to successfully execute our land acquisition and land asset management strategies, increasing our costs and/or diminishing growth in our Homebuilding segment.
Labor and raw materials and building supply shortages and price fluctuations and other problems in the construction of our communities could delay or increase the costs of home construction and adversely affect our operating results.
The homebuilding industry has, from time to time, experienced labor and raw material shortages and has been adversely affected by volatility in global commodity prices. In particular, shortages and fluctuations in the prices for labor, concrete, drywall, lumber or other important raw materials could result in delays in the start or completion of, or increase the cost of, developing one or more of our communities. These labor and material shortages can be more severe during periods of strong demand for housing or during periods where the regions in which we operate experience natural disasters that have a significant impact on existing residential and commercial structures. The cost of labor and raw materials may also be adversely affected during periods of shortage or high inflation. We have also observed that the cost of labor and raw materials has been increasing as a result of an improving housing market in Florida. If sales prices of homes do not keep pace with these increased costs, our gross margins could be negatively affected. During the recent economic downturn, a large number of qualified tradespeople went out of business or otherwise exited the market, which may limit capacity for new construction until the labor base grows. In addition, the cost of petroleum products, which are used to deliver our materials, fluctuates and may be subject to increased volatility as a result of geopolitical events or accidents, which could affect the price of our important raw materials. Shortages and price increases could cause delays in and increase our costs of home construction, which in turn could have a material adverse effect on our business, financial condition and results of operations.
17
Table of Contents
We must also contend with other risks associated with construction activities, including the inability to obtain insurance or obtaining insurance at significantly increased rates, cost overruns, labor disputes, unforeseen environmental or engineering problems, work stoppages and natural disasters, any of which could delay construction and result in a substantial increase in costs that would reduce our profitability. Claims may be asserted against us for construction defects, architectural and/or design defects, personal injury or property damage, product liability and warranty claims, and these claims may give rise to liability. Where we hire contractors, if there are unforeseen events like the bankruptcy of, or an uninsured or under-insured loss claimed against, our contractors, we may become responsible for the losses or other obligations of the contractors, which may materially and adversely affect our business, financial condition and results of operations. Should losses in excess of insured limits occur, the losses could adversely affect our business, financial condition and results of operations. In addition, our results of operations could be negatively impacted in the event that a contractor for our residential construction experiences significant cost overruns or delays and is not able to satisfactorily address such issues or if buyers make claims for rescission arising out of substantial delays in completion of a building and their units.
Because our business depends on the acquisition of new land, a shortage of available land could limit our ability to develop new communities, increase land costs and reduce our revenues and/or negatively affect our results of operations.
Our long-term success and growth strategy depend, in part, on the continued availability of suitable land at acceptable prices. The availability of land for purchase at favorable prices depends on a number of factors outside of our control. We may compete for available land with entities that possess significantly greater financial, marketing and other resources. In addition, we may be unable to obtain financing to purchase new land on satisfactory terms or at all. Competition generally may reduce the amount of land available and the willingness of sellers to sell at reasonable prices, increasing the cost of such land. Restrictive governmental regulations, including, but not limited to, zoning regulations and environmental requirements, may also affect the availability and market value of land. If sufficient suitable land opportunities do not become available, it could limit our ability to develop new communities, increase land costs and negatively impact our business, financial condition and results of operations.
If the market value of our land inventory decreases, our results of operations could be adversely affected by impairments and write-downs.
The risk of owning developed and undeveloped land can be substantial for us. Our current growth strategy will require us to invest a significant portion of our capital in new land acquisitions over the next several years. The successful execution of this strategy will significantly increase the amount of land that we hold. The market value of the undeveloped land, buildable home sites and housing inventories we hold can fluctuate significantly as a result of changing economic and market conditions. There is an inherent risk that the value of the land owned by us may decline after being purchased. The valuation of property is inherently subjective and based on the individual characteristics of each property. In certain circumstances, a grant of entitlements or development agreement with respect to a particular parcel of land may include restrictions on the transfer of such entitlements to a buyer of such land, which may increase our exposure to decreases in the price of such entitled land by restricting our ability to sell it for its full entitled value. We may have acquired options on or bought and developed land at a cost that we will not be able to fully recover or on which we cannot build and sell homes profitably. In addition, our deposits for home sites controlled under option or similar contracts may be put at risk. Factors such as changes in regulatory requirements and applicable laws (including in relation to building regulations, taxation and planning), political conditions, the condition of financial markets, both local and national economic conditions, the financial condition of buyers, potentially adverse tax consequences, and interest and inflation rate fluctuations subject valuations to uncertainty. Moreover, all valuations are made on the basis of assumptions that may not prove to reflect economic or demographic reality. If housing demand decreases below what we anticipated when we acquired our inventory or land development costs increase beyond our anticipated construction costs, our profitability may be adversely affected and we may not be able to recover our costs when we sell and build homes.
During several years prior to 2012, we experienced negative economic and market conditions, which resulted in the impairment of a number of our land positions. Generally, we record asset impairment losses when we determine that our estimates of the future undiscounted cash flows from an operation will not be sufficient to recover the carrying value of that asset. During the year ended December 31, 2014, we recorded an asset impairment charge of $1.2 million because the estimated undiscounted cash flow for one of our Amenities assets did not exceed its carrying value; however, we did not record any such charges during the years ended December 31, 2013 and 2012. We regularly review the value of our land holdings and continue to review our holdings on a periodic basis. If economic or market conditions deteriorate, we may impair additional land holdings and projects, write off option deposits (if applicable), sell homes or land at a loss, and/or hold land or homes in inventory longer than planned. Additionally, inventory carrying costs can be significant, particularly if inventory must be held for longer than planned, which can trigger asset impairments in a poorly performing project or market. If, as planned, we significantly increase the amount of land we hold over the next several years, we will also materially increase our exposure to the risks associated with owning land, which means that if economic and market conditions deteriorate, this deterioration would have a significantly greater adverse impact on our business, financial condition and results of operations.
18
Table of Contents
If we are not able to develop our communities successfully and in a timely manner, our revenues, financial condition and results of operations may be adversely impacted.
Before a community generates any revenues, material expenditures are required to acquire land, to obtain or renew permits, development approvals and entitlements and to construct significant portions of project infrastructure, amenities, model homes and sales facilities. There may be a lag between the time we acquire land or options for land for development or developed home sites and the time we can bring the communities to market and sell homes. We can also experience significant delays in obtaining permits, development approvals and entitlements. Additionally, we may also have to renew existing permits and there can be no assurances that these permits will be renewed. Lag time varies on a project-by-project basis depending on the complexity of the project, its stage of development when acquired, and the regulatory and community issues involved. Litigation challenging project approvals could also add additional time to the development approval process. As a result of these possible lag times, we face the risk that demand for housing may decline during this period and we will not be able to dispose of developed properties on undeveloped land or home sites acquired for development at expected prices or within anticipated time frames or at all. The market value of home inventories, undeveloped land, options for land and developed home sites can fluctuate significantly because of changing market conditions. In addition, inventory carrying costs (including interest on funds used to acquire land or build homes) can be significant and can adversely affect our performance. Furthermore, after a delay, we may face increased development costs due to prices that exceed our expectations as a result of inflation or other matters that are beyond our control.
It generally takes several years for a community development project to achieve cumulative positive cash flow. Moreover, there is a higher degree of risk to our homebuilding operations if we expand our business in the future beyond the current well-established markets or outside of Florida. Our inability to develop and market our communities successfully and to generate positive cash flows from these operations in a timely manner would have a material adverse effect on our financial condition and results of operations. In addition, if we experience delays that result in a decline in market values of our home inventories, undeveloped land, and options for land and developed home sites, we may be forced to sell homes or other property at a loss or for prices that generate lower profit margins than we anticipate. We may also be required to make material write-downs of the book value of our real estate assets if values decline.
In the past, we have incurred losses and we may have difficulty maintaining and/or increasing profitability in the future.
Subsequent to our emergence from bankruptcy in September 2009, there were quarters and years where the Company experienced losses from continuing operations before income taxes. Notwithstanding our return to operating profitability during the years ended December 31, 2014 and 2013, we may not be able to maintain and/or increase profitability on a quarterly or annual basis in the future. If our revenues grow more slowly than we anticipate, or if our operating expenses exceed our expectations and cannot be adjusted accordingly, our business will be harmed. As a result, the price of our common stock may decline. For a more complete description of our historical operating results, see: (i) Selected Financial Data in Item 6 of Part II of this Annual Report on Form 10-K; (ii) Management’s Discussion and Analysis of Financial Condition and Results of Operations in Item 7 of Part II of this Annual Report on Form 10-K; and (iii) our audited consolidated financial statements in Item 8 of Part II of this Annual Report on Form 10-K.
We may re-enter the tower business in the future and, as a result, we may incur significant pre-construction costs and be subject to costly delays and unfavorable changes in market conditions, each of which could adversely affect our business, liquidity, financial condition and results of operations.
Before a tower generates any Homebuilding segment revenues, we may make material expenditures to, among other things: (i) acquire land; (ii) obtain permits, development approvals and entitlements; (iii) market units within the tower; and (iv) design and construct the building. It typically takes several years for us to acquire the land and construct, market and deliver units in a tower. Completion times vary on a building-by-building basis depending on the complexity of the project, its stage of development when acquired and the regulatory and community issues involved. As a result of such potential delays in completing a tower, we face the risk that the demand for our towers may decline during the extended period needed to ready the units for sale and, therefore, we may be forced to sell units at a loss or for prices that generate lower gross margins than we initially anticipated. Furthermore, if construction is delayed, we may face increased construction and other related costs as a result of inflation or other factors beyond our control, which could have an adverse effect on our business, liquidity, financial condition and results of operations. If real estate values decline during the construction period or before we can sell the units, we may be required to recognize material write-downs of the book value of our towers because the carrying costs of such towers may not be fully recoverable.
19
Table of Contents
The tower business is subject to significant swings in delivery volume due to the extended construction time for towers, the levels of pre-sale activity and the relatively short delivery time of pre-sold units once a building is completed.
If we re-enter the tower business and our volume of business is substantive, our quarterly operating results will fluctuate depending on the construction time for our towers, the levels of pre-sale activity and the relatively short delivery time of pre-sold units once a building is completed. Depending on the number of towers that are completed during any given quarterly period, our future operating results may be uneven and may be marked by lower revenues and earnings in some quarters when compared to other quarters.
Our business and results of operations are dependent on the availability and skill of subcontractors.
All of our residential construction work is done by third-party subcontractors with us acting as the general contractor. Accordingly, the timing and quality of our construction depend on the availability and skill of our subcontractors. While we anticipate being able to obtain sufficient materials and reliable subcontractors during times of material shortages and believe that our relationships with subcontractors are good, we do not have long-term contractual commitments with any subcontractors, and there can be no assurances that skilled subcontractors will continue to be available at reasonable rates and in the areas where we conduct our operations. The inability to contract with skilled subcontractors at reasonable costs on a timely basis could have a material adverse effect on our business, financial condition and results of operations.
Moreover, despite our quality control efforts, we may discover that our subcontractors were engaging in improper construction practices or installing defective materials in our homes. When we discover these issues, we, generally through our subcontractors, repair the homes in accordance with our new home warranty policy and as required by law. We typically reserve approximately 0.5% of the selling price of each home we sell to provide customer service to our homebuyers, which is subject to change based on our actual warranty experience. These reserves are established based on market practices, our historical experiences and our judgment of the qualitative risks associated with the types of homes built. However, the cost of satisfying our warranty and other legal obligations in these instances may be significantly higher than our warranty reserves, and we may be unable to recover the cost of repair from our subcontractors. Regardless of the steps we take, we can, in some instances, be subject to fines or other penalties, and our reputation may be injured.
Additionally, although subcontractors are independent of the homebuilders that contract with them under normal management practices and the terms of trade contracts and subcontracts within the homebuilding industry, if regulatory agencies deem the employees of our subcontractors to be our employees, we could be responsible for wage, hour and other employment-related liabilities of our subcontractors.
We are subject to extensive governmental regulation, which may substantially increase our costs of doing business and negatively impact our financial condition and results of operations. Failure to comply with laws and regulations by our employees or representatives may harm us.
Our Homebuilding segment operations, including land development activities, are subject to extensive federal, state and local statutes, ordinances, rules and regulations, including environmental, zoning and land use, building, employment and worker health and safety regulations. These regulations affect all aspects of the homebuilding process and can substantially delay or increase the costs of homebuilding activities, even on land for which we already have approvals. In addition, larger land parcels are generally undeveloped and may not have all of the governmental approvals necessary to develop and construct homes. If we are unable to obtain these approvals or obtain approvals that restrict our ability to use the land in ways that we do not anticipate, the value of the parcel will be negatively impacted. During the development process, we must obtain a number of approvals from various governmental authorities that regulate matters such as:
| • | permitted land uses, levels of density and architectural designs; |
| • | the building of roadways and creation of traffic control mechanisms and the installation of infrastructure for utility services, such as water, sewage and waste disposal, drainage and storm water control, electricity and natural gas; |
| • | the dedication of acreage for open space, parks, schools and other community services; and |
| • | the preservation of habitat for endangered species and wetlands, storm water control and other environmental matters. |
20
Table of Contents
These government entities often have broad discretion in exercising their approval authority. The approval process can be lengthy and cause significant delays or result in a temporary or permanent halt to the development process. The approval process may involve public input and public hearings and may also be opposed by neighboring landowners, consumer or environmental groups, among others, which in turn can also cause significant delays or permanently halt the development process. Litigation challenging government approvals could also cause significant delays or halt the development process. Delays or a temporary or permanent halt in the development process can cause substantial increases to development costs, delays in constructing and selling homes, or cause us to abandon the project and to sell the affected land at a loss, which in turn could harm our results of operations.
Additionally, new housing developments are often subject to various assessments for schools, parks, streets, highways and other public improvements. The costs of these assessments can be substantial and can cause increases in the effective prices of our homes, which in turn could reduce our sales and/or profitability.
Our projects may also contain water features such as lakes or marinas for boating or other recreational activities. These water features may be subject to governmental regulations that could result in high maintenance costs. Additionally, there is the potential for liability related to the recreational use of such water features by residents and guests.
As climate change concerns grow, legislation and regulatory activity is expected to continue and become more onerous. Similarly, energy-related initiatives will impact a wide variety of companies throughout the world and because our operations are heavily dependent on significant amounts of raw materials, such as lumber, steel and concrete, these initiatives could have an indirect adverse effect on our business, financial condition and results of operations to the extent the suppliers of our materials are burdened with expensive or onerous energy or environmental-related regulations. Additionally, energy efficiency requirements imposed by government regulations on new housing development could add to building costs, which in turn could reduce profitability.
Our title insurance operations are subject to applicable insurance and other laws and regulations. Failure to comply with these requirements can lead to administrative enforcement actions, the loss of required licenses and other required approvals, claims for monetary damages or demands for loan repurchase from investors, and rescission or voiding of the loan by the homebuyer.
Florida has enacted legislation to regulate homeowner associations, which affects the master and condominium associations we manage or control in our communities. Furthermore, we are also subject to state legislation and Internal Revenue Service rulings pertaining to community development districts or similar development authorities (collectively, “CDDs”). A CDD is a local, special purpose government framework authorized by Florida’s Uniform Community Development District Act of 1980, as amended, and provides a mechanism to manage and finance the infrastructure required to develop new communities. CDDs are legal entities with the ability to enter into contracts, own property, sue and be sued, and impose and levy taxes and/or assessments. CDDs are subject to audit and rulings from the Internal Revenue Service with respect to the tax-exempt status of their bonds.
It is possible that individuals acting on our behalf (including our contractors and their subcontractors) could intentionally or unintentionally violate some of the foregoing federal, state and local laws and regulations. Although we endeavor to take immediate corrective action if we become aware of such violations, we may incur fines or penalties as a result of those actions and our reputation with governmental agencies and our buyers may be damaged. Furthermore, other acts of bad judgment may also result in negative financial consequences.
Compliance with applicable environmental laws may substantially increase our costs of doing business, which could negatively impact our financial condition and results of operations.
We are subject to various federal, state and local environmental laws and regulations relating to the operation of our properties, which are administered by numerous federal, state and local governmental agencies. Our growth and development opportunities may be limited and more costly as a result of legislative, regulatory or municipal requirements. Compliance with these laws and regulations may also restrict or delay our homebuilding activity. The inability to grow our business or pay these costs could reduce our profitability. Additionally, our operating costs may also be affected by our compliance with, or our being subject to, environmental laws, ordinances and regulations relating to hazardous or toxic substances of, under, or in our properties. These costs could be significant and could result in decreased profitability or the inability to develop our land as originally intended.
Despite our past ability to obtain necessary permits and approvals for our communities, we anticipate that increasingly stringent requirements will be imposed on developers and homebuilders in the future. Although we cannot predict the effect of these requirements, they could result in time-consuming and expensive compliance programs and substantial expenditures, which could cause delays and increase our costs of operations. We may also become subject to challenges by third-parties, such as environmental groups or neighborhood associations, under environmental laws and regulations regarding the permits and other approvals for our projects and operations. In those cases where an endangered or threatened species is involved and related agency rule-making and/or litigation is ongoing, the outcome of such rule-making and litigation can be unpredictable and can result in unplanned or unforeseeable restrictions on or the prohibition of development and building activity in identified environmentally sensitive areas. In addition, the continued effectiveness of permits already granted or approvals already obtained is dependent on many factors, some of which are beyond our control, such as changes in policies, rules and regulations and their interpretation and application. Environmental regulations can also have an adverse impact on the availability and price of certain raw materials such as lumber.
21
Table of Contents
From time to time, the U.S. Environmental Protection Agency and similar federal or state agencies conduct inspections of our properties for compliance with these environmental laws and regulations and a failure to strictly comply may result in an assessment of fines and penalties and an obligation to undertake corrective actions. Any such enforcement actions may increase our costs.
Under various environmental laws and regulations, current or former owners or operators of real estate, whether leased or owned, as well as certain other categories of parties, may be required to investigate and clean up hazardous or toxic substances or petroleum product releases, and may be held liable to a governmental entity or to third-parties for related damages, including bodily injury, and investigation and clean-up costs incurred by such parties in connection with the contamination, regardless of whether such contamination or environmental conditions were created by the current or prior owner or tenant, or by a third-party or neighboring property. The costs of any required removal, investigation or remediation of such substances or the costs of defending against environmental claims may be substantial. The presence of such substances, or the failure to remediate such substances properly, may also adversely affect our ability to sell the land or to borrow using the land as security. Although environmental site assessments conducted at our properties have not revealed any environmental liability that we believe would have a material adverse effect on our business, financial condition or results of operations, and we are not aware of any material environmental liability or concerns, there can be no assurances that the environmental assessments that we have undertaken have revealed all potential environmental liabilities, or that an environmental condition does not otherwise exist as to any one or more of our properties that could have a material adverse effect on our business, financial condition or results of operations.
Government entities in regions where we operate have adopted or may adopt slow growth or no growth initiatives, which could adversely affect our ability to build or timely build in these areas.
Local governments in some of the areas where we operate have approved, and others where we operate or may operate in the future may also approve, various “slow growth” or “no growth” homebuilding initiatives and other ballot measures that could negatively impact the availability of land and building opportunities within those jurisdictions. Approval of “slow growth,” “no growth” or similar initiatives (including the effect of these initiatives on existing entitlements and zoning) could adversely affect our ability to build or timely build and sell homes in the affected markets and/or create additional administrative and regulatory requirements and costs, which, in turn, could have an adverse effect on our business, financial condition and results of operations.
Substantial increases in mortgage interest rates or the unavailability of mortgage financing could lead to fewer home sales, which would reduce our revenues.
Our Homebuilding and Real Estate Services segments depend on the ability of some homebuyers to obtain financing for the purchase of their homes. Since 2009, the mortgage lending industry in the U.S. has experienced significant instability, beginning with increased defaults on subprime loans and other nonconforming loans and compounded by expectations of increasing interest payment requirements and further defaults. This in turn resulted in a decline in the market value of many mortgage loans and related securities. Lenders, regulators and others questioned the adequacy of lending standards and other credit requirements for several loan products and programs offered in recent years. Credit requirements have tightened, and investor demand for mortgage loans and mortgage-backed securities has declined. The deterioration in credit quality during the downturn had caused almost all lenders to stop offering subprime mortgages and most other loan products that do not conform to standards set by Fannie Mae, Freddie Mac and the FHA. Fewer loan products, tighter loan qualifications and a reduced willingness of lenders to make loans may continue to make it more difficult for certain buyers to finance the purchase of our homes. These developments may delay the continued improvement in the housing market. If our potential homebuyers, the buyers of our homebuyers’ existing homes or other customers of our Real Estate Services businesses cannot obtain suitable financing, our business, financial condition and results of operations could be adversely affected.
As a result of the turbulence in the credit markets and mortgage finance industry, the federal government has taken on a significant role in supporting mortgage lending through its conservatorship of Fannie Mae and Freddie Mac, both of which purchase home mortgages and mortgage-backed securities originated by mortgage lenders, and its insurance of mortgages originated by lenders through the FHA. The liquidity provided by Fannie Mae and Freddie Mac to the mortgage industry has been very important to the housing market. Several federal government officials have proposed changing the nature of the relationship between Fannie Mae and Freddie Mac and the federal government and even nationalizing or eliminating these entities entirely. If Fannie Mae and Freddie Mac were dissolved or if the federal government determined to stop providing liquidity support to the mortgage market, there would be a reduction in the availability of the financing provided by these institutions. Any such reduction would likely have an adverse effect on interest rates, mortgage availability and the sales of new homes. It is also possible that these entities, as reformed, or the successors to these entities may require changes to the way title insurance is priced or delivered, changes to standard policy terms or other changes, which may make the title insurance business less profitable and adversely affect our title insurance operations.
22
Table of Contents
Moreover, the FHA insures mortgage loans that generally have lower loan payment requirements and qualification standards compared to conventional guidelines, and as a result, can be a source for financing the sale of our homes. In recent years, lenders have taken a more conservative view of FHA guidelines causing significant tightening of borrower eligibility for approval. Availability of condominium financing and minimum credit score benchmarks has reduced opportunity for those buyers. In the near future, further restrictions are expected on FHA-insured loans, including limitations on seller-paid closing costs and concessions. This or any other restriction may negatively affect the availability or affordability of FHA financing, which could adversely affect the volume of homes sold to those buyers seeking FHA financing.
The passage of the Dodd-Frank Wall Street Reform and Consumer Protection Act (the “Dodd-Frank Act”) in July 2010 implemented new requirements relating to residential mortgages and mortgage lending practices. These include, among other things, minimum underwriting standards, limitations on certain fees and incentive arrangements, retention of credit risk and remedies for borrowers in foreclosure proceedings. The effect of such provisions may reduce the availability of loans to borrowers and/or increase the costs to borrowers to obtain such loans. Any such reduction could adversely affect our home sales, financial condition and results of operations.
Our ability to utilize our net operating loss carryforwards is limited as a result of previous “ownership changes” as defined in Section 382 of the Internal Revenue Code of 1986, as amended, and may become further limited if we experience future ownership changes under Section 382 or if we do not generate enough taxable income in the future.
As of December 31, 2014, we had recorded a deferred tax asset of $110.8 million, which was net of a valuation allowance of $70.5 million. Additionally, at such date, we had (i) $303.9 million of net operating loss (“NOL”) carryforwards for federal income tax purposes and (ii) $278.4 million of NOL carryforwards for Florida income and franchise tax purposes, a portion of which were subject to our deferred tax asset valuation allowance. Under federal income tax law, we generally can use our NOL carryforwards (and certain related tax credits) to offset ordinary taxable income, thereby reducing our federal income tax liability, for up to 20 years from the year in which the losses were generated, after which time they will expire. State NOL carryforwards (and certain related tax credits) generally may be used to offset future state taxable income for a period of time ranging from 5 to 20 years from the year in which the losses were generated, depending on the state, after which time they will expire. Moreover, the rate at which we can utilize our federal NOL carryforwards is also limited (which could result in NOL carryforwards expiring prior to their use) each time we experience an “ownership change,” as determined under Section 382 of the Internal Revenue Code of 1986, as amended (“Section 382”). A Section 382 ownership change generally occurs if one or more shareholders who are each deemed to own at least 5% of our stock increase their ownership by more than 50 percentage points over their lowest ownership percentage within a rolling three-year period. If an ownership change occurs, Section 382 generally imposes an annual limit on the amount of post-ownership change federal taxable income that may be offset with pre-ownership change federal NOL carryforwards equal to the product of the total value of our outstanding equity immediately prior to the ownership change (reduced by certain items specified in Section 382) and the federal long-term tax-exempt rate in effect at the time of the ownership change. We have previously experienced ownership changes affecting our current federal NOL carryforwards. Most states, including Florida, have statutes or provisions in their tax codes that function similar to the federal rules under Section 382. Moreover, our ability to use our federal and state NOL carryforwards may be limited if we fail to generate enough taxable income in the future before they expire, which may be the result of changes in the markets in which we do business, our profitability and/or general economic conditions. Existing and future limitations under Section 382 and other similar statutes and our inability to generate enough taxable income in the future could result in a substantial portion of our federal and state NOL carryforwards expiring before they are used and, therefore, could reduce the value of our deferred tax assets. If our future results of operations are less than projected or if the timing and jurisdiction of our future taxable income varies from our estimates, an increase in the Company’s deferred tax asset valuation allowance may be required at that time, thereby resulting in an increase in the Company’s income tax provision for financial reporting purposes. Furthermore, our expectations for the use of our deferred tax assets are based on numerous assumptions and we can give no assurances that these assumptions will be accurate.
We may not be successful in our efforts to identify, complete or integrate acquisitions, which could adversely affect our results of operations and future growth.
A principal component of our business strategy is to continue to grow profitably in a controlled manner, including, where appropriate, through land and other acquisitions. Any future acquisitions, especially those beyond our current well-established markets or outside of Florida, would be accompanied by risks such as:
| • | our inability to obtain development and other approvals from various governmental authorities necessary to close acquisitions; |
| • | the overvaluation of our targeted acquisitions; |
| • | diversion of our management’s attention from ongoing business concerns; |
23
Table of Contents
| • | our potential inability to maximize our financial and strategic position through the successful incorporation or disposition of operations; |
| • | difficulties in assimilating the operations and personnel of acquired companies or businesses; and |
| • | difficulties involved in acquisitions that are outside of our existing markets. |
Moreover, acquisitions may require us to incur or assume additional indebtedness, resulting in increased leverage. Any significant acquisition may result in a weakening of our financial condition and an increase in our cost of borrowing. Acquisitions may also require us to issue additional equity, resulting in dilution to existing shareholders.
We cannot guarantee that we will be successful in implementing our acquisition strategy, and growth may not continue at historical levels, or at all. The failure to identify or complete acquisitions, or successfully execute our plans for an acquisition, could adversely affect our future growth. Specifically, any delays or difficulties encountered prior to or after the closing of such acquisitions could increase our costs and otherwise adversely affect our business, financial condition and results of operations.
While we typically enter into purchase or option contracts for the acquisition of land, there can be no assurances that even after execution of these contracts we will be able to consummate these acquisitions on the terms included therein or at all, because, but not limited to, of our inability to obtain governmental approvals and entitlements, matters uncovered during due diligence, including environmental and title matters, and other regulatory and community issues. Moreover, in cases where we do not go forward with an acquisition, we may lose our deposits and/or be unable to recover our due diligence, development and other transaction costs. When we enter into non-binding letters of intent for land acquisitions, for example, it is also possible that we may choose not to, or may be unable to, for reasons beyond our control, enter into binding agreements. Additionally, in any land acquisition, we may underestimate land development costs, which could reduce our profitability.
Even if we overcome these challenges and risks, we may not realize the anticipated benefits of these acquisitions and there may be other unanticipated or unidentified effects. While we would typically seek protection through warranties and indemnities, as applicable, significant liabilities may not be identified during due diligence or come to light after the expiration of any warranty or indemnity periods. Additionally, while we would seek to limit our ongoing exposure, for example, through liability caps and period limits on warranties and indemnities in the case of disposals, some warranties and indemnities may give rise to unexpected and significant liabilities. Any claims arising in the future may adversely affect our business, financial condition and results of operations.
We participate in certain joint ventures where we may be adversely impacted by the failure of the joint venture or the other partners in the joint venture to fulfill their obligations.
We selectively enter into business relationships through partnerships and joint ventures with unrelated third-parties. These partnerships and joint ventures have historically been utilized to acquire, develop, market and operate timeshare, golf course and other amenity projects. Our joint venture operations face all of the inherent risks associated with real estate and construction, such as obtaining permits, complying with applicable federal, state and local laws and regulations, and obtaining financing, that are described elsewhere in this “Risk Factors” section. We face the additional risk that our partners may not meet their financial obligations or could have or develop business interests, policies or objectives that are inconsistent with ours. Therefore, we depend heavily on the other partners in each joint venture to both cooperate and make mutually acceptable decisions regarding the conduct of the business and affairs of the joint venture and ensure that they, and the joint venture, fulfill their respective obligations to us and to third-parties. If the other partners in our joint ventures do not provide such cooperation or fulfill those obligations due to their financial condition, strategic business interests (which may be contrary to ours), or otherwise, we may be required to spend additional resources and suffer losses, each of which could be significant. Moreover, our ability to recoup such expenditures and losses by exercising remedies against such partners may be limited due to potential legal defenses they may have, their respective financial condition and other circumstances. Furthermore, the termination of a joint venture may also give rise to lawsuits and legal costs.
Although our joint ventures do not have outstanding debt, the partners may agree to incur debt to fund partnership and joint venture operations in the future. If our joint ventures incur indebtedness in the future, the lenders may require us and the other partners to provide guarantees and indemnities to the lenders with respect to the joint venture’s debt, which may be triggered under certain conditions when the joint venture fails to fulfill its obligations under its loan agreements.
Tax law and interest rate changes could make home ownership more expensive or less attractive.
Tax law changes could make home ownership more expensive or less attractive. Certain expenses of owning a home, including mortgage interest expense and real estate taxes, generally are deductible expenses for an individual’s federal and, in some cases, state income taxes subject to various limitations under current tax law. Various proposals have been publicly discussed to limit mortgage interest deductions and repeal or otherwise limit the taxable income gain exclusion attributable to the sale of a principal residence. If the federal government or a state government changes its income tax laws, including as some lawmakers have proposed, to eliminate or substantially modify these income tax deductions without offsetting provisions, then the after-tax cost of owning a new home would increase substantially for many of our potential buyers. These circumstances could adversely impact demand for and/or selling prices of new homes.
24
Table of Contents
Increases in property tax rates by local governmental authorities, as experienced in response to reduced federal and state funding, could adversely affect the ability of potential buyers to obtain financing or their desire to purchase new homes. Fees imposed on developers to fund schools, open spaces, road improvements, and/or provide low and moderate income housing, could increase our costs and have an adverse effect on our business, financial condition and results of operations.
Additionally, the availability of mortgage financing and increases in interest rates as a result of changes to U.S. monetary policies could significantly increase the costs of owning a home by making it more costly or extremely difficult to obtain financing, which in turn would adversely impact the demand for, and the selling prices of, homes. Any increases in interest rates could adversely affect our business, financial condition and results of operations.
Our sales, revenues, financial condition and results of operations may be adversely affected by natural disasters.
The Florida climate presents risks of natural disasters. To the extent that hurricanes, severe storms, floods, wildfires, soil subsidence and other weather-related and geological events, including sinkholes, or other natural disasters or similar events occur, our business may be adversely affected by requiring us to delay or halt construction, experience shortages in labor and raw materials, or to perform potentially costly repairs to our projects under construction and unsold homes. There is also the possibility of environmental disasters occurring, such as oil spills in the Gulf of Mexico, which could result in costly repairs to our properties in affected areas and negatively impact the demand for new homes in those areas and otherwise adversely affect our business operations in the affected areas. There is also growing concern from the scientific community that an increase in average temperatures globally due to emissions of greenhouse gases and other human activities will cause significant changes in global weather patterns and, as a result, increase the frequency and severity of natural disasters. In the future, certain losses may not be insurable and a sizable uninsured loss could materially affect our business. In addition, due to the concentrated nature of our operations, natural disasters affecting more than one of our Florida markets could result in a relatively greater impact on our results of operations than they might have on other companies that have a more diversified portfolio of operations. See “—Our geographic concentration in Florida could adversely affect us if the homebuilding industry in Florida should decline.”
We may suffer uninsured losses or suffer material losses in excess of insurance limits.
We could suffer physical damage to property and liabilities resulting in losses that may not be fully compensated by insurance. Additionally, certain types of risks, such as personal injury claims, may be, or may become in the future, either uninsurable or not economically insurable, or may not be currently or in the future covered by our insurance policies. Should an uninsured loss or a loss in excess of insured limits occur, we could incur a financial loss or lose capital invested in the affected property as well as anticipated future income from that property. Moreover, we have a number of properties in Florida that are susceptible to hurricanes and tropical storms. While we generally carry windstorm and flood coverage with respect to these properties, the policies contain per occurrence deductibles and aggregate loss limits and sub-limits that limit the amount of proceeds that we may be able to recover. Additionally, we could be liable to repair damage or meet liabilities caused by uninsured or excluded risks. We may be liable for any debt or other financial obligations related to affected property. Material losses or liabilities in excess of insurance proceeds may occur in the future.
We act as a title agent and are subject to audits and contractual obligations due to our title insurance operations.
We act as a title agent for underwriters through our subsidiary, Watermark Realty, Inc. The title insurance industry is closely regulated by the Florida Department of Financial Services, Office of Insurance Regulation, which issues regulations that impose licensing and other compliance requirements on our title insurance business and require that we offer title insurance products in accordance with a promulgated rate schedule.
As a result of our position as a title agent, we are subject to regular and routine audits by title insurance underwriters for which we issue title policies. These audits review our compliance and risk management pertaining to escrow procedures, as well as our regulatory and underwriting procedures. Additionally, we are subject to compliance with the procedures imposed by our agency contracts with underwriters. Title agencies are subject to liability in the event of any breach thereof arising from deviations from the agency contract requirements, including indemnifying the underwriter for claims.
25
Table of Contents
Our real estate brokerage business is generally subject to intense competition.
We compete with national and regional independent real estate organizations, other national real estate franchisors, franchisees of local and regional real estate franchisors, discount brokerages and smaller niche companies competing in local areas. Real estate brokers compete for sales and marketing business primarily on the basis of services offered, reputation, utilization of technology, personal contacts and brokerage commission.
The real estate brokerage industry has minimal barriers to entry for new participants, including participants pursuing non-traditional methods of marketing real estate, such as Internet-based brokerage or brokers who discount their commissions. Discount brokers have had varying degrees of success and, while they were negatively impacted by the prolonged downturn in the residential housing market, they may adjust their business model and increase their market presence in the future. Listing aggregators and other web-based real estate service providers may also begin to compete for our company-owned brokerage business by establishing relationships with independent real estate agents and/or buyers and sellers of homes.
We also compete for the services of qualified licensed independent real estate agents. Some of the firms competing for real estate agents use a different model to compensate their agents, whereby agents are compensated for the revenue generated by other agents that they recruit to those firms. This model may be appealing to certain agents and hinder our ability to attract and retain those agents. The ability of our brokerage offices to retain independent real estate agents is generally subject to numerous factors, including the sales commissions that they receive and their perception of brand value. Competition for real estate agents could reduce our commissions, after giving effect to the split with independent real estate agents, and possibly increase our marketing costs.
Independent real estate agents that work for our real estate brokerage business could take actions that could harm our business and results of operations.
The real estate agents that work for our real estate brokerage business are independent contractors and, as such, are not our employees, and we do not exercise control over their day-to-day activities. If these independent real estate agents were to provide a diminished quality of service to buyers, our image and reputation may suffer materially, thereby adversely affect our business and results of operations. Additionally, independent real estate agents may engage or be accused of engaging in unlawful or tortious acts such as, for example, violating the anti-discrimination requirements of the Fair Housing Act. Such acts or the accusation of such acts could harm our image, reputation and goodwill.
Our real estate brokerage business must comply with the requirements governing the licensing and conduct of real estate brokerage and brokerage-related businesses in the jurisdictions in which we do business.
We are subject to various laws and regulations containing general standards for and limitations on the conduct of real estate brokers and sales associates, including those relating to the licensing of brokers and sales associates, administration of escrow funds, collection of commissions, advertising and consumer disclosures. Under Florida law, real estate brokers are responsible for the conduct of their brokerage business, including the supervision of their sales associates. Although real estate sales agents historically have been classified as independent contractors, rules and interpretations of federal and state employment laws and regulations could change, including those governing employee classification and wage and hour regulations, and those changes may impact industry practices and our real estate brokerage operations. Our brokerage practices are also subject to regulation by the Consumer Financial Protection Bureau.
Our development and construction of condominiums and subdivisions are subject to claims from the related condominium association and/or homeowners association at each project.
A portion of our business is dedicated to the formation of condominiums, which are governed by condominium associations. Although we retain control of the condominium associations at a number of our projects, we are required to transfer control of the condominium association’s board of directors once we trigger one of several statutory thresholds, with the most likely triggers being tied to the sale of not less than a majority of units to third-party owners. Although we maintain reserves for turnover purposes, transfer of control can result in claims with respect to deficiencies in operating funds and reserves, construction defects and other condominium-related matters by the condominium association and/or the third-party condominium unit owners. Any such material claims, including those in excess of our established reserves, could negatively affect our reputation in condominium development and ultimately have a material adverse effect on our operations as a whole.
A portion of our business is dedicated to the formation of subdivisions, which are governed by homeowners associations. As with condominium associations, although we retain control of the homeowners associations at a number of our projects, we are required to transfer control of the homeowners association’s board of directors once we trigger one of several statutory thresholds, with the most likely triggers being tied to the sale of not less than a majority of subdivided home sites to third-party owners. Transfer of control can result in claims with respect to deficiencies in operating funds and reserves (to the extent applicable), construction defects and other subdivision-related matters by the homeowners association and/or the third-party subdivided lot owners. Any such material claims, including those in excess of our established reserves (if any), could negatively affect our reputation in subdivision development and ultimately have a material adverse effect on our operations as a whole.
26
Table of Contents
Shortfalls in association revenues leading to increased levels of homeowner association deficit funding could negatively affect our business.
As a developer, we typically deficit fund the homeowner associations we control until the turnover of the association to the residents. If we have insufficient sales of homes in any community or if the number of delinquencies with respect to the payment of association assessments by the homeowners increases in any of our communities (in each case resulting in shortfalls in association revenues), our deficit funding levels may increase from historical levels, which could have an adverse impact on our financial condition and results of operations.
Increased insurance risk and adverse changes in economic conditions could negatively affect our business.
Insurance and surety companies are continuously re-examining their business risks and, in connection therewith, have taken actions, including increasing premiums, requiring higher self-insured retentions and deductibles, requiring additional collateral on surety bonds, reducing limits, restricting coverage, imposing exclusions, such as mold damage, sinkholes, sabotage and terrorism, and refusing to underwrite certain risks and classes of business. Any increased premiums, mandated exclusions, changes in limits, changes in coverage, changes in terms and conditions or reductions in the amounts of bonding capacity available may adversely affect our ability to obtain appropriate insurance coverage at a reasonable cost, which could have a material adverse effect on our financial condition and results of operations.
Warranty, liability and other claims that arise in the ordinary course of business may be costly, which could adversely affect our business.
As a homebuilder, we have been, and continue to be, subject to construction, architectural and design defects, product liability and home warranty claims in the ordinary course of business, including claims related to moisture intrusion and mold. These claims are common to the homebuilding industry and can be costly.
In certain legal proceedings, plaintiffs may seek class action status with potential class sizes that vary from case to case. Class action lawsuits can be costly to defend and, if we were to lose any certified class action lawsuit, could result in substantial potential liability for us. We record reserves, if necessary, for such matters in our consolidated financial statements. With respect to certain general liability exposures, including construction defects, moisture intrusion and related mold claims and product liability, the interpretation of underlying current and future trends, assessment of claims and the related liability and reserve estimation process is highly judgmental due to the complex nature of these exposures, with each exposure exhibiting unique characteristics. Furthermore, once claims are asserted for construction defects, it is difficult to determine the extent to which the assertion of these claims will expand geographically.
Although we maintain warranty and other reserves, we obtain insurance for construction defect claims and generally seek to require our subcontractors and design professionals to indemnify us for some portion of a liability arising from their work. Such policies and reserves may not be available or adequate to cover our ultimate liability for damages, costs of repairs and/or the expense of litigation surrounding claims. Future claims may also arise out of uninsurable events or circumstances not covered by insurance and not subject to effective indemnification agreements with our subcontractors. In addition, our future results of operations could be materially adversely affected by changes in our estimates and assumptions pertaining to these proceedings or due to the ultimate resolution of any related litigation. Furthermore, one or more of our insurance carriers could become insolvent. Any actual or threatened claim against us, regardless of its merit, may lead to negative publicity, which could adversely affect our business, reputation and home sales.
We may lose or fail to attract and retain key employees and management personnel.
An important aspect of our competitiveness is our ability to attract and retain key employees and management personnel. Our ability to do so is influenced by a variety of factors, including the compensation we award, changes in immigration laws, trends in labor force migration and other fluctuations in the labor market. If any of our key personnel were to cease employment with us, our operating results could suffer. Our ability to retain our key personnel or to attract suitable replacements should any members of our management team leave is dependent on the competitive nature of the employment market. Furthermore, the process of attracting and retaining suitable replacements for key personnel whose services we may lose would result in transition costs and would divert the attention of other members of our senior management away from our existing operations. In addition, we do not maintain key person insurance in respect of any members of our senior management team. The loss of any of our management members or key personnel could adversely impact our business, financial condition and results of operations.
27
Table of Contents
To effectively compete in our industry, we must ensure that the experience and knowledge of our employees is institutionalized and is not lost when personnel leave us due to retirement, redundancy or other reasons. Failure to do so would adversely affect our standard of service to our homebuyers and other customers, financial condition and results of operations.
We may be subject to claims that were not discharged in our bankruptcy proceedings, which could have an adverse effect on our results of operations and profitability.
On September 3, 2009, our predecessor company and certain of its subsidiaries (collectively, the “Debtors”) emerged from bankruptcy pursuant to a plan of reorganization filed by the Debtors that was declared effective on such date. Substantially all of the material claims relating to the operation of our business prior to September 3, 2009 were discharged and resolved pursuant to the plan of reorganization and the related confirmation order issued by the U.S. Bankruptcy Court for the District of Delaware in Wilmington. Although the plan of reorganization contains various mechanisms and provisions intended to protect us from any liability for any act or omission prior to September 3, 2009 or a condition in existence as of such date, some claimants have attempted and may continue to attempt to characterize their respective claims as arising after September 3, 2009 even though such acts, omissions, or conditions arose prior to September 3, 2009. The ultimate resolution of any such claims and other obligations, including the matter discussed under Legal Proceedings in Item 3 of Part I of this Annual Report on Form 10-K, may have a material adverse effect on our results of operations and profitability.
Inflation may result in increased costs that we may not be able to recoup if housing demand declines.
Inflation can have an adverse impact on our results of operations because increasing costs of land, materials and labor may require us to increase the selling prices of our homes to maintain satisfactory gross margins. If there is a reversal or slowing of the current housing market recovery, we may not be able to sufficiently increase our home selling prices due to, among other things, competition in the industry. In such an environment, we may not be able to raise home prices enough to keep up with the rate of inflation and our gross margins could decrease. Ultimately, we might need to decrease home selling prices, which could further reduce our gross margins and require us to reduce the carrying value of our land inventory. Moreover, our cost of capital increases as a result of inflation and the purchasing power of our cash resources declines. Current or future efforts by the government to stimulate the economy may yield higher inflation and cause an adverse impact on our business, financial condition and results of operations.
An increase in home order cancellations could adversely impact our financial condition and results of operations.
During the years ended December 31, 2014, 2013 and 2012, 6.8%, 4.7% and 3.0% of our total home orders were cancelled, respectively. In the normal course of business, buyers contracted to buy a home occasionally do not close on the transaction whether due to the economic downturn, failure to satisfy contingencies, mutual termination, default by the buyer or otherwise. An increase in the rate or number of cancellations may adversely impact our home sales revenues and results of operations, as well as our backlog. In cases of cancellations, we remarket the home and usually keep any deposits that we are permitted to retain. These deposits may not cover the additional carrying costs and costs to resell the home.
Real estate investments are relatively illiquid and we may be unable to quickly sell our properties for satisfactory prices in response to adverse changes in economic or financial conditions.
Due to the relative lack of liquidity in real estate investments, we may be limited in our ability to respond to changes in economic or financial conditions by quickly selling our properties. As a result, we may be forced to hold properties that do not generate any revenues. Alternatively, we may be compelled to sell homes or land at a loss. Under either scenario, we may be required to record impairment charges. Additionally, we face the general unpredictability of the real estate market and may not always know whether we can sell homes at the prices we set or how long it may take to find a buyer and close the sale of a property.
Poor relations with the residents of our communities could negatively impact sales, which could cause our revenues and/or results of operations to decline.
As a community developer, we may be expected by community residents from time to time to resolve any real or perceived issues or disputes that may arise in connection with the operation, development and/or turnover of our communities. Any efforts made by us in resolving these issues or disputes could be deemed unsatisfactory by the affected residents and any subsequent action by these residents could negatively impact sales, which could cause our revenues and/or results of operations to decline. In addition, we could be required to make material expenditures related to the settlement of such issues or disputes or modify our community development plans, which could adversely affect our business, financial condition and results of operations.
28
Table of Contents
We may become subject to litigation, which could materially and adversely affect us.
In the future, we may become subject to litigation, including claims relating to our operations, securities offerings or otherwise in the ordinary course of business. Some of these claims may result in significant defense costs and potentially significant judgments against us, some of which are not, or cannot be, insured against. We cannot be certain of the ultimate outcomes of any claims that may arise in the future. Resolution of these types of matters against us may result in significant fines, judgments or settlements, which, if uninsured, or if the fines, judgments and settlements exceed insured levels, could adversely impact our earnings and cash flows, thereby materially and adversely affecting us. Litigation or the resolution of litigation may affect the availability or cost of our insurance coverage, which could materially and adversely impact us, expose us to increased risks that would be uninsured, and materially and adversely impact our ability to attract directors and officers.
A major health and safety incident could adversely affect our operations, create potential liabilities and harm our reputation.
Construction sites and our Homebuilding segment pose inherent health and safety risks to our employees and others. Due to regulatory requirements and the scale of our business, our health and safety performance is vital to the continued success of our business. A major health and safety incident may cause us to incur penalties and could expose us to liabilities. In addition, we may face significant negative publicity, which would adversely affect our reputation and relationships with members of the community, regulatory agencies, suppliers and contractors.
Information technology failures, data security breaches and other similar adverse events could harm our business.
We rely on information technology and other computer resources to perform important operational and marketing activities as well as to maintain our business and employee records and financial data. Many of these resources are provided to us and/or maintained on our behalf by third-party service providers pursuant to agreements that specify certain security and service level standards. Our computer systems are subject to damage or interruption from power outages, computer attacks by hackers, viruses, catastrophes, hardware and software failures and breach of data security protocols by our personnel. Although we have implemented administrative and technical controls and taken other actions to minimize the risk of cyber incidents and otherwise protect our information technology, computer intrusion efforts are becoming increasingly sophisticated and even the controls that we have installed might be breached. If we were to experience a significant period of disruption in our information technology systems that involve interactions with customers or suppliers, it could result in the loss of sales and customers and significant incremental costs, which could adversely affect our business. Additionally, security breaches of our information technology systems could result in the misappropriation or unauthorized disclosure of proprietary, personal and confidential information, which could result in significant financial or reputational damage to us.
We may face utility or resource shortages or cost fluctuations, which could have an adverse effect on our operations.
A shortage of utilities or natural resources in geographic areas in which we operate may make it difficult for us to obtain regulatory approvals to begin our projects. Our existing projects may also be delayed, which would impose additional costs and jeopardize our ability to complete construction and meet our contractual obligations. Such shortages could adversely affect our inventories, particularly concrete and drywall, and could reduce demand for our homes and adversely affect our business. Additionally, municipalities may restrict or place moratoriums on the availability of utilities, such as water and sewer taps. Those potential actions may cause delays in our projects, increase our costs or limit our ability to operate in those geographic areas, each of which could adversely affect our business and results of operations.
Geopolitical risks and market disruption could adversely affect our business, liquidity, financial condition and results of operations.
Geopolitical events, acts of war or terrorism or any outbreak or escalation of hostilities throughout the world or health pandemics, may have a substantial impact on the economy, consumer confidence, the housing market, our employees and our customers. Historically, perceived threats to national security and other actual or potential conflicts or wars and related geopolitical risks have also created significant economic and political uncertainties. If any such events were to occur, or there was a perception that they were about to occur, they could have a material adverse impact on our business, liquidity, financial condition and results of operations.
29
Table of Contents
Risks Related to Our Indebtedness
We intend to use leverage in executing our business strategy, which may adversely affect our business, financial condition and results of operations.
We intend to employ prudent levels of leverage to finance our business, including the acquisition and development of our home sites and construction of our homes. As of December 31, 2014, we had $250.0 million of total aggregate principal amount of debt outstanding. During August 2013, we completed the issuance of our 6.875% Senior Notes due 2021 in the aggregate principal amount of $200.0 million (the “Original 2021 Notes”) at an issue price of 100.0%. We used $127.0 million of the net proceeds from the Original 2021 Notes offering to voluntarily prepay the entire outstanding principal amount of our Senior Secured Term Notes due 2017, of which $125.0 million in aggregate principal amount was outstanding, at a price equal to 101% of the principal amount, plus accrued and unpaid interest. During June 2014, we completed the issuance of additional 6.875% Senior Notes due 2021 in the aggregate principal amount of $50.0 million (the “Supplemental 2021 Notes”) at an issue price of 102.5%, plus accrued and unpaid interest from February 15, 2014 to June 26, 2014. Collectively, the Original 2021 Notes and the Supplemental 2021 Notes are referred to herein as the “2021 Notes.” We have been using and expect to continue to use the remainder of the net proceeds from the Original 2021 Notes offering and the net proceeds from the Supplemental 2021 Notes offering for general corporate purposes, including the acquisition and development of land and home construction. Additionally, during August 2013, we entered into a four-year senior unsecured revolving credit facility in an aggregate amount of up to $75.0 million (the “Revolving Credit Facility”). As of December 31, 2014, we had $257.8 million of available liquidity from cash and cash equivalents, the Revolving Credit Facility and our five-year $10.0 million senior secured loan with Stonegate Bank (the “Stonegate Loan”). See Note 10 to our audited consolidated financial statements in Item 8 of Part II of this Annual Report on Form 10-K for further discussion of our debt obligations.
Our board of directors will consider a number of factors when evaluating our level of indebtedness and when making decisions regarding the incurrence of new indebtedness, including the purchase price of assets to be acquired with debt financing, the estimated market value of our assets and the ability of particular assets, and the Company as a whole, to generate cash flow to cover the expected debt service. As a means of sustaining our long-term financial health and limiting our exposure to unforeseen dislocations in the debt and financing markets, we currently expect to remain conservatively capitalized. However, our amended and restated certificate of incorporation and amended and restated bylaws do not contain a limitation on the amount of debt that we may incur and our board of directors may change our target debt levels at any time without the approval of our shareholders, subject to the covenants contained in our existing debt agreements.
Our use of debt capital could subject us to many risks that, if realized, would adversely affect us, including the risk that:
| • | our cash flow from operations may be insufficient to make required payments of principal and interest on our debt, which would likely result in an acceleration of such debt; |
| • | our debt may limit our flexibility in planning for, or reacting to, changes in our business and the industry in which we operate; |
| • | our debt may increase our vulnerability to adverse economic and industry conditions with no assurances that investment yields will increase with higher financing costs; |
| • | our debt may limit our ability to obtain additional financing to fund real estate inventories, capital expenditures and acquisitions, particularly when the availability of financing in the capital markets is limited; and |
| • | we may be required to dedicate a larger portion of our cash flow from operations to payments on our debt, thereby reducing funds available for operations and capital expenditures, future investment opportunities or other purposes. |
If we do not have sufficient funds to repay our debt at maturity, it may be necessary to refinance our debt through additional debt or equity financings. If, at the time of any refinancing, prevailing interest rates or other factors result in higher interest rates on refinancings, increases in interest expense could adversely affect our cash flows and results of operations. If we are unable to refinance our debt on acceptable terms, we may be forced to dispose of our assets on disadvantageous terms, potentially resulting in losses. To the extent we cannot meet any future debt service obligations, we will risk losing some or all of our assets that may be pledged to secure our obligations to foreclosure. Certain of our debt agreements have, and any additional debt agreements that we enter into in the future may contain, specific cross-default provisions with respect to specified other indebtedness, giving holders of certain debt the right to declare a default if we are in default under other loans in some circumstances. Defaults under our debt agreements could have a material adverse effect on our business, financial condition and results of operations. Moreover, certain of our current debt has, and any additional debt we subsequently incur may have, a floating rate of interest. Higher interest rates could increase debt service requirements on our current floating rate debt and on any floating rate debt we subsequently incur, and could reduce funds available for operations, future business opportunities or other purposes.
30
Table of Contents
If we cannot obtain letters of credit and surety bonds, our ability to operate may be restricted.
We use letters of credit and surety bonds (performance and financial) to guarantee our performance under various land development and construction agreements, land purchase obligations, escrow agreements, financial guarantees and other arrangements, primarily with governmental authorities. Under Florida law, we also need surety bonds to use homebuyers’ escrowed deposits for construction purposes, unless homebuyers waive their escrow rights. As of December 31, 2014, we had $2.3 million of outstanding letters of credit. Performance bonds do not have stated expiration dates; rather, we are released from the bonds as the contractual performance is completed. Our performance and financial bonds, which totaled $37.7 million as of December 31, 2014, are typically outstanding over a period of approximately one to five years or longer, depending on, among other things, the pace of development. Our estimated exposure on the outstanding performance and financial bonds as of December 31, 2014 was $21.7 million, primarily based on development remaining to be completed. Our ability to obtain additional letters of credit and surety bonds primarily depends on our credit rating, capitalization, working capital, past performance, management expertise and certain external factors, including the capacity of the markets for such financial instruments. We must also fully indemnify providers of surety bonds. Letters of credit and surety bond providers consider these factors in addition to our performance and claims record and provider-specific underwriting standards, which may change from time to time. If banks were to decline to issue letters of credit or surety companies were to decline to issue performance and financial bonds, or if we are required to provide credit enhancement, such as cash deposits, our ability to operate could be significantly restricted, thereby having an adverse effect on our business, liquidity, financial condition and results of operations.
We may need additional financing to fund our operations or expand our business and if we are unable to obtain sufficient financing or such financing is obtained on adverse terms, we may not be able to operate or expand our business as planned, which could adversely affect our results of operations and future growth.
Our access to additional third-party sources of financing will depend, in part, on:
| • | general market conditions; |
| • | the market’s perception of our growth potential; |
| • | with respect to acquisition and/or development financing, the market’s perception of the value of the land parcels to be acquired and/or developed; |
| • | our debt levels; |
| • | our expected results of operations; |
| • | our cash flow; and |
| • | the market price of our common stock. |
The homebuilding industry is capital-intensive and we incur significant costs in the early stages of our projects to acquire land parcels and begin development. In addition, if housing markets are not favorable or permitting and development takes longer than anticipated, we may be required to hold our investments in land for extended periods of time. Additionally, domestic financial markets have experienced unusual volatility, uncertainty and a tightening of liquidity in both the debt and equity capital markets. Credit spreads for major sources of capital widened significantly during the U.S. credit crisis as investors demanded a higher risk premium. Given the recent volatility in the capital and credit markets, potential lenders may be unwilling or unable to provide us with financing that is attractive to us or may charge us prohibitively high fees to obtain financing. Consequently, there is greater uncertainty regarding our ability to access the credit market to attract financing on reasonable terms.
Our ability to make payments on and to refinance our indebtedness and to fund planned expenditures for land acquisitions, development and construction will depend on our ability to generate cash in the future. If our business does not achieve the levels of profitability or generate the amount of cash that we anticipate or if we expand through acquisitions or organic growth faster than anticipated, we may need to seek additional debt or equity financing to operate and expand our business.
Based on our current operations, recent capital raising activities and anticipated growth, we believe that we can meet our cash requirements for the year ending December 31, 2015 with existing cash and cash equivalents and cash flow from operating activities (including sales of homes and land). To a large extent, though, our ability to generate cash flow from operating activities is subject to general economic, financial, competitive, legislative and regulatory factors, as well as other factors that are beyond our control. We can provide no assurances that our business will generate cash flow from operating activities in an amount sufficient to enable us to fund our liquidity needs. Further, our capital requirements may vary materially from those currently planned if, for example, our revenues do not reach expected levels or we incur unforeseen capital expenditures and/or make investments to maintain our competitive position. Accordingly, as necessary, we may seek alternative financing, such as selling additional debt or equity securities or divesting assets or operations. We can provide no assurances that we will be able to consummate any such transactions on favorable terms, if at all. Moreover, if we do raise additional funds through the incurrence of debt, we will incur increased debt service costs and may become subject to additional restrictive financial and other covenants. We may also choose to raise additional funds through equity, which would result in dilution to existing shareholders. Any inability to generate sufficient cash flow, refinance our debt or incur additional debt on favorable terms could adversely affect our financial condition and could cause us to be unable to service our debt and may delay or prevent the expansion of our business or otherwise require us to forego market opportunities.
31
Table of Contents
Our ability to obtain third-party financing may be negatively affected by any downgrade of our credit rating by a rating agency.
Our corporate credit rating and the rating of the 2021 Notes affect, among other things, our ability to access new capital, especially debt. We consider the availability of third-party financing to be a key component of our long-term strategy to grow our business. As such, a portion of our future access to capital may be through the issuance of notes and other debt securities. Downgrades in our corporate credit rating or the rating of the 2021 Notes could: (i) make it difficult for us to sell debt securities in the future; (ii) result in more stringent covenants and higher interest rates with regard to any debt securities that we may issue in the future; and (iii) otherwise impair our ability to obtain financing on terms that are favorable to us. Each of these circumstances could adversely impact our business and future operations.
Our indebtedness may restrict our ability to pursue our business strategies.
The indenture governing the 2021 Notes, the credit agreement governing the Revolving Credit Facility and the senior loan agreement governing the Stonegate Loan restrict, and any debt we incur in the future will likely restrict, our ability to take specific actions even if we believe that such actions may be in our best interests. These include, but are not limited to, covenants (financial and otherwise) generally affecting our ability, subject to certain exceptions and exemptions, to:
| • | incur additional indebtedness; |
| • | declare or pay dividends, redeem stock or make other distributions on capital stock; |
| • | make investments; |
| • | create liens; |
| • | place restrictions on the ability of our subsidiaries to pay dividends or make other payments to WCI; |
| • | merge or consolidate, or sell, transfer, lease or dispose of substantially all of our assets; |
| • | sell assets; and |
| • | enter into transactions with affiliates. |
Additionally, the credit agreement governing the Revolving Credit Facility contains customary affirmative covenants and certain financial maintenance covenants, including a minimum consolidated tangible net worth covenant, a consolidated leverage ratio covenant and a covenant requiring either minimum liquidity or maintenance of a consolidated interest coverage ratio according to a schedule set forth in such credit agreement.
Our ability to comply with these covenants and restrictions may be affected by events beyond our control. If we breach any of these covenants (financial or otherwise) or restrictions, we could be in default under our existing debt arrangements or any other future financing arrangement we enter into. This circumstance would permit the holders of the 2021 Notes, the lenders under the Revolving Credit Facility or Stonegate Bank to take certain actions, including declaring the 2021 Notes, the Revolving Credit Facility or the Stonegate Loan, as applicable, due and payable, together with accrued and unpaid interest. If the 2021 Notes, the Revolving Credit Facility, the Stonegate Loan or any other future financing arrangement that we enter into were to be accelerated, our assets, in particular our liquid assets, may be insufficient to repay our indebtedness. A default could also significantly limit our financing alternatives, which could cause us to curtail our investment activities and/or dispose of assets when we otherwise would not choose to do so. The occurrence of any default could have a material adverse effect on our business, financial condition and results of operations. See “Management’s Discussion and Analysis of Financial Condition and Results of Operations—Liquidity and Capital Resources” in Item 7 of Part II of this Annual Report on Form 10-K.
32
Table of Contents
Risks Related to Our Organization and Ownership of Our Common Stock
Because of their significant stock ownership, our principal shareholders have substantial influence over our business, and their interests may differ from our interests or those of our other shareholders.
As of February 25, 2015, Monarch Alternative Capital LP and certain of its affiliates (collectively, “Monarch”) and Stonehill Institutional Partners, L.P. and certain of its affiliates (collectively, “Stonehill,” and together with Monarch, the “Principal Investors”) owned approximately 27.8% and 25.7% of our common stock, respectively. Due to their ownership, the Principal Investors have the power to control us and our subsidiaries, including the power to elect a majority of our directors, agree to sell or otherwise transfer a controlling stake in us and determine the outcome of all actions requiring a majority shareholder approval. Additionally, pursuant to stockholders agreements that we entered into with each of the Principal Investors in connection with the completion of an initial public offering of 6,819,091 shares of our common stock during July 2013 (the “Initial Public Offering”), for so long as a Principal Investor holds at least 60% of the shares of our common stock held by it at the consummation of our Initial Public Offering, such Principal Investor has the right to nominate two directors to our board of directors and one director to each board committee (subject to applicable independence requirements of each committee). When a Principal Investor owns less than 60%, but at least 20%, of the shares of our common stock held by it at the consummation of our Initial Public Offering, such Principal Investor is entitled to nominate one director to our board of directors and each board committee (subject to applicable independence requirements of each committee). As of February 25, 2015, each of the Principal Investors held more than 60% of the shares of our common stock held by it at the consummation of our Initial Public Offering. Under the stockholders agreements, we also agreed to use commercially reasonable efforts to take all necessary and desirable actions within our control to cause the election, removal and replacement of such directors in accordance with the stockholders agreements and applicable law. Each Principal Investor also has agreed to vote for the other’s board nominees in accordance with the terms of a separate voting agreement between the Principal Investors.
The interests of the Principal Investors may differ from our interests or those of our other shareholders and the concentration of control in the Principal Investors will limit other shareholders’ ability to influence corporate matters. The concentration of ownership and voting power of the Principal Investors may also delay, defer or even prevent an acquisition by a third-party or other change of control of the Company and may make some transactions more difficult or impossible without their support, even if such actions are in the best interests of our other shareholders. Therefore, the concentration of voting power among the Principal Investors may have an adverse effect on the price of our common stock. We may also take actions that our other shareholders do not view as beneficial, which may adversely affect our results of operations and financial condition and cause the price of our common stock to decline.
The share price for our common stock may fluctuate significantly.
The market price of our common stock may be significantly affected by factors such as quarterly variations in our results of operations, changes in government regulations, the announcement of new contracts and acquisitions by us or our competitors, general market conditions specific to the homebuilding industry, changes in general economic and political conditions, volatility in the financial markets, changes in interest rates, threatened or actual litigation and government investigations, an adverse market reaction to the level of our indebtedness, the addition or departure of key personnel, actions taken by our shareholders, including the sale or disposition of their shares of our common stock, speculation in the press or investment community, changes in accounting principles, differences between our actual financial and operating results and those expected by investors and analysts and changes in analysts’ recommendations or projections. These and other factors may lower the market price of our common stock, regardless of our actual operating performance.
Furthermore, in recent years the stock market has experienced significant price and volume fluctuations. This volatility has had a significant impact on the market price of securities issued by many companies, including companies in our industry. The changes frequently appear to occur without regard to the operating performance of the affected companies. Hence, the price of our common stock could fluctuate based on factors that have little or nothing to do with us, and these fluctuations could materially reduce the price of our common stock.
We are an emerging growth company and, as a result of the reduced disclosure and governance requirements applicable to emerging growth companies, our common stock may be less attractive to investors.
We qualify as an emerging growth company, as defined in the Jumpstart our Business Startups Act of 2012, and we are eligible to take advantage of exemptions from certain reporting requirements applicable to other public companies, but not to emerging growth companies, including, but not limited to, allowing less than five years of selected financial data in Item 6 of Part II of this Annual Report on Form 10-K, an exemption from the auditor attestation requirement of Section 404 of the Sarbanes-Oxley Act of 2002 (the “Sarbanes-Oxley Act”), reduced disclosure about executive compensation arrangements pursuant to the rules applicable to smaller reporting companies and no requirement to seek non-binding advisory votes on executive compensation or golden parachute arrangements. We have elected to adopt these reduced disclosure requirements. We may take advantage of these provisions until we are no longer an emerging growth company. We will remain an emerging growth company until the earlier of (i) the last day of the fiscal year (a) following the fifth anniversary of the completion of our Initial Public Offering, (b) in which we have total annual gross revenues of at least $1.0 billion or (c) in which we are deemed to be a large accelerated filer, which means the market value of our common stock that is held by non-affiliates exceeds $700.0 million as of the prior June 30th, and (ii) the date on which we have issued more than $1.0 billion in non-convertible debt during the prior three-year period. We cannot predict if investors will find our common stock less attractive as a result of our taking advantage of these exemptions. If some investors find our common stock less attractive as a result of our elections, there may be a less active trading market for our common stock and our stock price may be more volatile.
33
Table of Contents
The obligations associated with being a public company require significant resources and management attention.
We are subject to the reporting requirements of the Securities Exchange Act of 1934, as amended, which require that we file annual, quarterly and current reports with respect to our business and financial condition, and the rules and regulations implemented by the Securities and Exchange Commission, the Sarbanes-Oxley Act, the Dodd-Frank Act, the Public Company Accounting Oversight Board and the New York Stock Exchange (the “NYSE”), each of which imposes additional reporting and other obligations on public companies. The aforementioned reporting requirements and obligations increase after a registrant is no longer deemed to be an emerging growth company. As a public company, we are required to:
| • | prepare and distribute periodic reports and other shareholder communications in compliance with federal securities laws and NYSE rules; |
| • | have expanded the roles and duties of our board of directors and committees thereof; |
| • | have a nominating committee; |
| • | have internal audit functions; |
| • | institute more comprehensive financial reporting and disclosure compliance functions; |
| • | maintain new internal policies, including those relating to trading in our securities, disclosure controls and procedures and internal control over financial reporting; |
| • | involve and retain to a greater degree outside legal counsel, accountants and consultants in the activities listed above; |
| • | enhance our investor relations function; |
| • | retain additional personnel; |
| • | comply with NYSE listing standards; and |
| • | comply with the Sarbanes-Oxley Act. |
We expect these rules and regulations to increase our legal and financial compliance costs and to make some activities more time-consuming and costly. Currently, we are unable to estimate or otherwise quantify these future costs with any degree of certainty. However, the expenses incurred by public companies for reporting and corporate governance purposes have increased dramatically in recent years and we do not expect that that trend will significantly change. A number of these requirements have, and will require us to continue to, carry out activities we have not done previously as a private company and complying with such requirements may divert management’s attention from other business concerns, which could have a material adverse effect on our business, financial condition, results of operations and cash flows.
Additionally, changing laws, regulations and standards relating to corporate governance and public disclosure are creating uncertainty for public companies, increasing legal and financial compliance costs and making some activities more time-consuming. These laws, regulations and standards are subject to varying interpretations, in many cases due to their lack of specificity, and, as a result, their application in practice may evolve over time as new guidance is provided by regulatory and governing bodies. This environment could result in continuing uncertainty regarding compliance matters and higher costs necessitated by ongoing revisions to disclosure and governance practices. We have invested, and intend to continue to invest, resources to comply with evolving laws, regulations and standards, and this investment may result in increased general and administrative expenses and a diversion of management’s time and attention from revenue-generating activities to compliance activities. If our efforts to comply with new laws, regulations and standards differ from the intentions of regulatory or governing bodies due to ambiguities related to their application and practice, regulatory authorities may initiate legal proceedings against us and our business may be adversely affected.
Complying with all of the requirements of being a public company has increased our general and administrative expenses during the years ended December 31, 2014 and 2013. In the future, we may utilize funds to pay such public company expenses that would otherwise be used to expand our business and achieve our strategic objectives. Additionally, we expect that it may be difficult and expensive to maintain director and officer liability insurance and, accordingly, we may be required to accept reduced policy limits and coverage or incur substantially higher costs to obtain the same or similar coverage. As a result, it may be more difficult for us to attract and retain qualified persons to serve on our board of directors or as executive officers. Furthermore, if we are unable to satisfy our obligations as a public company, we could be subject to delisting of our common stock, fines, sanctions and other regulatory action and potentially civil litigation.
34
Table of Contents
The failure to maintain effective internal control over financial reporting in accordance with Section 404(a) of the Sarbanes-Oxley Act could have a material adverse effect on our business and stock price.
We are required to maintain internal control over financial reporting in a manner that meets the standards of publicly traded companies as promulgated under Section 404(a) of the Sarbanes-Oxley Act (“Section 404(a)”). As such, we completed the necessary evaluative procedures during the year ended December 31, 2014 and issued our annual report on internal control over financial reporting, which can be found in Item 9A of Part II of this Annual Report on Form 10-K. Additionally, once we are no longer an emerging growth company, our independent registered public accounting firm will be required to attest to the effectiveness of our internal control over financial reporting on an annual basis. The rules governing the standards that must be met for our management to assess our internal control over financial reporting are complex and require significant documentation, testing and, if necessary, remediation.
Internal control over financial reporting is a process designed to provide reasonable assurance regarding the reliability of financial reporting and the preparation of financial statements in accordance with U.S. generally accepted accounting principles. During the year ended December 31, 2014, we reviewed, documented and tested our internal control over financial reporting based on the requirements of Section 404(a) and interpretive guidance thereunder. In the future, we may encounter problems or delays when implementing any changes necessary to make a favorable assessment of our internal control over financial reporting. Additionally, we may encounter problems or delays in completing the implementation of any required improvements and receiving a favorable attestation report in connection with the attestation provided by our independent registered public accounting firm. If we cannot favorably assess the effectiveness of our internal control over financial reporting in the future or if our independent registered public accounting firm is unable to provide an unqualified attestation report on our internal controls, investors could lose confidence in our reported financial information and the price of our common stock could decline.
Moreover, the existence of a material weakness or significant deficiency would require management to devote considerable time and incur significant costs to remediate any such matter. Moreover, management may not be able to remediate any identified material weakness or significant deficiency in a timely manner. The existence of a material weakness in our internal control over financial reporting could also result in errors in our consolidated financial statements that could require us to restate such financial statements, cause us to fail to meet our reporting obligations and cause investors to lose confidence in our reported financial information, each of which could materially and adversely affect us.
Provisions of our charter documents or Delaware law could delay, discourage or prevent an acquisition of the Company, even if the acquisition would be beneficial to our shareholders, and could make it more difficult for shareholders to change our management.
Our amended and restated certificate of incorporation and amended and restated bylaws may discourage, delay or prevent a merger, acquisition or other change in control that shareholders may consider favorable, including transactions in which shareholders might otherwise receive a premium for their shares of our common stock. In addition, these provisions may frustrate or prevent any attempt by our shareholders to replace or remove our current management by making it more difficult to replace or remove our board of directors. These provisions include the following:
| • | no cumulative voting in the election of directors, which limits the ability of minority shareholders to elect director candidates; |
| • | the exclusive right of our board of directors to fill a vacancy created by the expansion of the board of directors or the resignation, death or removal of a director, which prevents shareholders from being able to fill vacancies on our board of directors; |
| • | the ability of our board of directors to authorize the issuance of shares of preferred stock and to determine the price and other terms of those shares, including preferences and voting rights, without the approval of our shareholders, which could be used to significantly dilute the ownership of a hostile acquirer; |
| • | the ability of our board of directors to alter our amended and restated bylaws without obtaining the approval of our shareholders; |
| • | the required approval of at least 662/3% of the outstanding shares entitled to vote at an election of directors to adopt, amend or repeal our amended and restated bylaws or repeal the provisions of our amended and restated certificate of incorporation regarding the election and removal of directors; |
| • | a prohibition on shareholder action by written consent, which forces shareholder action to be taken at an annual or special meeting of our shareholders; |
| • | no requirement that a special meeting of shareholders be called at the request of shareholders, other than at the request of either of the Principal Investors, so long as one of them or both together hold at least 10% of our outstanding shares, which may delay the ability of our shareholders to force consideration of a proposal or to take action, including the removal of directors; and |
35
Table of Contents
| • | advance notice procedures that shareholders must comply with in order to nominate candidates to our board of directors or to propose matters to be acted upon at a shareholders’ meeting, which may discourage or deter a potential acquirer from conducting a solicitation of proxies to elect the acquirer’s own slate of directors or otherwise attempting to obtain control of us. |
We have also opted out of Section 203 of the Delaware General Corporation Law (“Section 203”), which regulates corporate takeovers. However, our charter contains provisions that are similar to Section 203. Specifically, our amended and restated certificate of incorporation provides that we may not engage in certain “business combinations” with any “interested stockholder” for a three-year period following the time that the person became an interested stockholder, unless:
| • | prior to the time that person became an interested stockholder, our board of directors approved either the business combination or the transaction that resulted in the person becoming an interested stockholder; |
| • | upon consummation of the transaction that resulted in the person becoming an interested stockholder, the interested stockholder owned at least 85% of the voting stock of the Company outstanding at the time the transaction commenced, excluding certain shares; or |
| • | at or subsequent to the time the person became an interested stockholder, the business combination is approved by our board of directors and by the affirmative vote of at least 662/3% of the outstanding voting stock that is not owned by the interested stockholder. |
Generally, a business combination includes a merger, consolidation, asset or stock sale or other transaction resulting in a financial benefit to the interested stockholder. Subject to certain exceptions, an interested stockholder is a person who, together with that person’s affiliates and associates, owns, or within the previous three years owned, 15% or more of our voting stock. However, in our case, the Principal Investors and any of their affiliates and subsidiaries and any of their direct or indirect transferees receiving 15% or more of our voting stock will not be deemed to be interested stockholders regardless of the percentage of our voting stock owned by them and, accordingly, will not be subject to such restrictions. This provision could prohibit or delay mergers or other takeover or change in control attempts with respect to us and, accordingly, may discourage attempts to acquire the Company.
The provisions in our amended and restated certificate of incorporation and amended and restated bylaws and the Delaware General Corporation Law could limit the price that investors are willing to pay in the future for shares of our common stock.
Claims for indemnification by our directors and officers may reduce our available funds to satisfy successful third-party claims against us and may reduce the amount of money available to us.
Our amended and restated certificate of incorporation and amended and restated bylaws provide that we will indemnify our directors and officers, in each case to the fullest extent permitted by Delaware law. In addition, we have entered into, and expect to continue to enter into, agreements to indemnify our directors, executive officers and other employees, as determined by our board of directors. Under the terms of such indemnification agreements, we are required to indemnify each of our directors and officers, to the fullest extent permitted by Delaware law, if the basis of the indemnitee’s involvement was by reason of the fact that the indemnitee is or was a director, or officer, of the Company or any of its subsidiaries or was serving at the Company’s request in an official capacity for another entity. We must indemnify our officers and directors against all reasonable fees, expenses, charges and other costs of any type or nature whatsoever, including any and all expenses and obligations paid or incurred in connection with investigating, defending, being a witness in, participating in (including on appeal), or preparing to defend, be a witness or participate in any completed, actual, pending or threatened action, lawsuit, claim or proceeding, whether civil, criminal, administrative or investigative, or establishing or enforcing a right to indemnification under the indemnification agreement. The indemnification agreements also require us, if so requested, to advance within 30 days of such request all reasonable fees, expenses, charges and other costs that such director or officer incurred, provided that such person will return any such advance if it is ultimately determined that such person is not entitled to indemnification by us. Our amended and restated bylaws also require that such person return any advance if it is ultimately determined that such person is not entitled to indemnification by us. Any claims for indemnification by our directors and officers may reduce our available funds to satisfy successful third-party claims against us.
A substantial portion of our total outstanding shares of common stock may be sold into the market at any time. This could cause the market price of our common stock to drop significantly, even if our business is doing well.
The market price of our common stock could decline as a result of sales of a large number of shares of our common stock or the perception that such sales could occur. These sales, or the possibility that these sales may occur, might also make it more difficult for us to sell equity securities in the future at a time and price that we deem appropriate. As of February 25, 2015, we had 26,106,196 shares of outstanding common stock. All shares of our common stock sold in the Initial Public Offering are freely tradable without restriction under the Securities Act of 1933, as amended (the “Securities Act”), except for any shares that are held or acquired by our affiliates, as that term is defined in the Securities Act.
36
Table of Contents
Shareholders holding 13,964,121 shares of our common stock as of February 25, 2015, or approximately 53.5% of our outstanding common stock, have the right, subject to various conditions and limitations, to include their shares of our common stock in registration statements relating to our securities, including our Registration Statement on Form S-3 (File No. 333-200330) that was declared effective by the Securities and Exchange Commission on December 1, 2014 (the “Shelf Registration Statement”). If the offer and sale of these shares are registered, they will be freely tradable without restriction under the Securities Act. Shares of common stock sold under such registration statements can be freely sold in the public market. In the event such registration rights are exercised and a large number of shares of common stock are sold in the public market, such sales could reduce the trading price of our common stock.
Under certain employee stock-based incentive compensation plans that we adopted during 2013 (the “2013 Plans”), we are authorized to issue up to 2,987,000 shares of our common stock. We registered all such shares under the Securities Act on a registration statement on Form S-8. These shares, once issued and released from any restrictions thereon, will be able to be freely sold in the public market, subject to sale limitations contained in the 2013 Plans, as applicable, Rule 10b5-1 sales plans, if any, and volume limitations applicable to affiliates under Rule 144 of the Securities Act. As of February 25, 2015, 1,200,740 shares of our common stock were subject to outstanding awards under the 2013 Plans and 1,756,598 shares of common stock were reserved and available for issuance under such plans. Furthermore, we also have 758,399 shares of our common stock reserved and available for issuance under our Long Term Equity Incentive Plan (the “2010 Equity Plan”); however, given our recent adoption of the 2013 Plans, we do not currently expect to make any further grants under the 2010 Equity Plan. For further discussion of our employee stock-based incentive compensation plans, see Note 15 to our audited consolidated financial statements in Item 8 of Part II of this Annual Report on Form 10-K.
In the future, we may also issue common stock or other securities if we need to raise additional capital. The number of new shares of our common stock issued in connection with raising additional capital could constitute a material portion of the then outstanding shares of our common stock.
Future offerings of debt securities, which would rank senior to our common stock upon our bankruptcy or liquidation, and future offerings of equity securities that may be senior to our common stock for the purposes of dividend and liquidating distributions, may adversely affect the market price of our common stock.
In the future, we may attempt to increase our capital resources by making offerings of debt securities or additional offerings of equity securities, in each case, in private transactions exempt from registration under the Securities Act or pursuant to registration statements relating to our securities, including the Shelf Registration Statement. Upon bankruptcy or liquidation, holders of our debt securities and shares of preferred stock and lenders with respect to other borrowings will receive a distribution of our available assets prior to the holders of our common stock. Additional equity offerings may dilute the holdings of our existing shareholders or reduce the market price of our common stock, or both, and may result in future limitations under Section 382 that could reduce the rate at which we utilize our NOL carryforwards. Preferred stock, if issued, could have a preference on liquidating distributions or a preference on dividend payments, or both, that could limit our ability to make a dividend distribution to the holders of our common stock. Our decision to issue securities in any future offering will depend on market conditions and other factors beyond our control. As a result, we cannot predict or estimate the amount, timing or nature of our future offerings, if any, and holders of our common stock bear the risk of our future offerings reducing the market price of our common stock and diluting their ownership interests in the Company.
Future sales and issuances of our common stock or rights to purchase common stock could result in dilution of the percentage ownership of our shareholders and could cause our stock price to decline.
We may issue additional securities in the future. Sales and issuances of our common stock or rights to purchase our common stock in the future could result in substantial dilution to our existing shareholders. We may sell common stock, convertible securities and other equity securities in one or more transactions at prices and in a manner as we may determine from time to time. If we sell any such securities in future transactions, investors may be materially diluted. New investors in such future transactions could gain rights, preferences and privileges senior to those of the holders of our common stock.
We do not expect to pay any cash dividends in the foreseeable future.
We intend to retain our future earnings, if any, in order to reinvest in the development and growth of our business and, therefore, we do not intend to pay dividends on our common stock for the foreseeable future. Any future determination to pay dividends will be at the discretion of our board of directors and will depend on our financial condition, results of operations, capital requirements and such other factors as our board of directors deems relevant. Additionally, under the indenture governing the 2021 Notes, the credit agreement governing the Revolving Credit Facility and any other future financing arrangement we enter into, we may be unable to pay cash dividends to our shareholders. Accordingly, shareholders may need to sell their shares of our common stock to realize a return on their investment and they may not be able to sell those shares at or above the price they paid for them.
37
Table of Contents
If securities analysts do not publish favorable reports about the Company or if we, or our industry, are the subject of unfavorable commentary, the price of our common stock could decline.
The trading price for our common stock will depend, in part, on the research and reports about the Company that are published by financial and market analysts. Such analysts could issue negative commentary about the Company or our industry, or they could downgrade our common stock. We may also be unable to ensure that the Company receives sufficient research coverage and has visibility in the market. As a result of any of these factors, the price of our common stock may decline.
Non-U.S. holders may be subject to U.S. federal income tax on gains realized from the sale or other disposition of our common stock.
Due to our holdings in U.S. real property interests, we believe that we currently are, and will continue to remain being for the foreseeable future, a “U.S. real property holding corporation” for U.S. federal income tax purposes. As a result, a non-U.S. holder generally will be subject to U.S. federal income tax on any gain realized on a sale or other disposition of our common stock, unless our common stock is regularly traded on an established securities market (such as the NYSE) and such non-U.S. holder did not actually or constructively own more than 5% of our common stock at any time during the shorter of (i) the five-year period preceding the date of the sale or other disposition and (ii) the non-U.S. holder’s holding period in such common stock. In addition, a 10% withholding tax could apply to the gross proceeds from a sale or other disposition of our common stock by a non-U.S. holder if our common stock is not regularly traded on an established securities market. A non-U.S. holder also will be required to file a U.S. federal income tax return for any taxable year in which it realizes a gain from the sale or other disposition of our common stock that is subject to U.S. federal income tax. Non-U.S. holders should consult with their own tax advisors concerning the consequences of disposing of our common stock. For purposes of this paragraph, a “non-U.S. holder” is a beneficial owner of our common stock that is an individual, corporation, trust or estate that is not a “United States person” for U.S. federal income tax purposes.
| Item 1B. | Unresolved Staff Comments. |
None.
| Item 2. | Properties. |
As of December 31, 2014, we owned approximately 271,000 square feet of amenity space and 57,000 square feet of sales office space throughout Florida. Additionally, we lease approximately 28,000 square feet of office space in Bonita Springs, Florida, which serves as our corporate headquarters, and approximately 168,000 square feet of office space in various other locations throughout Florida, which serves as branch office space for our Real Estate Services businesses. We believe that our facilities are suitable and adequate for our needs. The lease for our corporate headquarters expires on February 28, 2016. We are considering a lease renewal at the existing location, as well as various other alternatives.
| Item 3. | Legal Proceedings. |
On August 4, 2008, our predecessor company and certain of its subsidiaries (the “Debtors”) filed voluntary petitions for reorganization relief under the provisions of Chapter 11 of Title 11 (“Chapter 11”) of the U.S. Bankruptcy Code in the U.S. Bankruptcy Court for the District of Delaware in Wilmington (the ‘‘Bankruptcy Court’’). The Chapter 11 cases are referred to herein as the “Chapter 11 Cases.” The Debtors’ second amended joint plan of reorganization (the “Plan”) was declared effective on September 3, 2009 and the Debtors emerged from bankruptcy on that date. WCI is responsible for satisfying only those claims against the Debtors as specified in the Plan and the related confirmation order. However, WCI and certain of its subsidiaries have been subject to actions for certain alleged acts, omissions, transactions or other activities of certain of the Debtors that occurred or came into existence prior to September 3, 2009, including the action pertaining to the Chapter 11 Cases that is described below.
38
Table of Contents
The Lesina at Hammock Bay Condominium Association, Inc. (the “Lesina Association”) administers and manages a luxury condominium tower in Collier County, Florida, which was built and developed by one of the Debtors. The Lesina Association originally filed a proof of claim in the Chapter 11 Cases on February 2, 2009 in an unliquidated amount. On April 11, 2012, the Lesina Association filed a motion in the Bankruptcy Court requesting a declaration from the Bankruptcy Court that its claims arose after September 3, 2009 and that the Lesina Association is therefore entitled to commence a state court action for warranty claims against WCI. WCI opposed this motion. During May 2013, the Bankruptcy Court granted the Lesina Association’s motion and determined that the Plan does not bar the Lesina Association from pursuing its statutory warranty claims and assessment claims against WCI. During May 2013, WCI filed a Notice of Appeal of the decision with the U.S. District Court for the District of Delaware and, in July 2013, the Lesina Association filed its state court action in the Circuit Court of the Twentieth Judicial Circuit in and for Collier County, Florida. Such lawsuit includes the general contractor, architect and several subcontractors as parties who may be liable to the Lesina Association. We dispute the allegations made in this action and are vigorously defending this action. A tentative trial court date is scheduled for December 1, 2015. We are unable to estimate the amount of any potential loss because of the nature of the claims and the number of parties who are, or may be, liable to the Lesina Association; however, we believe that any potential losses related to this matter will not be material to our consolidated financial condition, results of operations and cash flows.
We are subject to various other claims, complaints and other legal actions arising in the normal course of business. These matters are subject to many uncertainties and the outcomes of these matters are not within our control and may not be known for prolonged periods of time. Nevertheless, we believe that the outcome of any of these currently existing proceedings, even if determined adversely, will not have a material adverse effect on our consolidated financial condition, results of operations or cash flows.
| Item 4. | Mine Safety Disclosures. |
Not applicable.
39
Table of Contents
| Item 5. | Market for Registrant’s Common Equity, Related Stockholder Matters and Issuer Purchases of Equity Securities. |
General
Unless the context otherwise requires, the terms the “Company,” “we,” “us” and “our” in Part II of this Annual Report on Form 10-K refer to WCI Communities, Inc. and its subsidiaries and the term “WCI” refers only to WCI Communities, Inc.
On July 22, 2013, the Company filed with the Secretary of State of the state of Delaware an amendment to its then existing amended and restated certificate of incorporation to, among other things, effectuate (i) a 10.3 for 1 stock split of its common stock and (ii) an increase of its authorized capital stock to 150,000,000 shares of common stock. Additionally, on July 24, 2013, the Company filed with the Secretary of State of the state of Delaware a new amended and restated certificate of incorporation, which, among other things, converted all of its Series A, B, C, D and E common stock into a single class of common stock. All share and per share amounts of the Company’s common stock have been retroactively adjusted in this Annual Report on Form 10-K to reflect the common stock split, the new authorized share amounts and the conversion of our Series A, B, C, D and E common stock into a single class of common stock.
The table below summarizes the number of shares of our common stock that we repurchased from an officer of the Company during the three months ended December 31, 2014. Such shares were not repurchased pursuant to a publicly announced plan or program. Those shares were repurchased to facilitate income tax withholding payments pertaining to a stock-based compensation award that vested during the three months ended December 31, 2014.
| Period |
Total Number of Shares Purchased |
Average Price Paid Per Share |
Total Number of Shares Purchased as Part of a Publicly Announced Plan or Program |
Maximum Number of Shares That May Yet Be Purchased Under the Plan or Program |
||||||||||||
| October 1, 2014 to October 31, 2014 |
— | $ | — | — | — | |||||||||||
| November 1, 2014 to November 30, 2014 |
7,043 | 18.60 | — | — | ||||||||||||
| December 1, 2014 to December 31, 2014 |
— | — | — | — | ||||||||||||
|
|
|
|||||||||||||||
| 7,043 | ||||||||||||||||
|
|
|
|||||||||||||||
Market Information
Our common stock began trading on the New York Stock Exchange (the “NYSE”) on July 25, 2013 under the symbol “WCIC.” Prior to that date, there was no public market for our common stock. The table below sets forth the reported high and low sales prices per share of our common stock on the NYSE for the periods indicated.
| High | Low | |||||||
| Year ended December 31, 2014: |
||||||||
| First quarter |
$ | 21.28 | $ | 17.57 | ||||
| Second quarter |
20.70 | 17.97 | ||||||
| Third quarter |
20.24 | 17.09 | ||||||
| Fourth quarter |
19.69 | 17.08 | ||||||
| Period from July 25, 2013 to September 30, 2013 |
$ | 17.77 | $ | 14.50 | ||||
| Period from October 1, 2013 to December 31, 2013 |
20.00 | 16.36 | ||||||
As of February 25, 2015, there were 26,106,196 shares of our common stock outstanding that were held by approximately 73 record holders. The number of holders of record is based on the actual number of holders registered at such date and does not include holders of shares in “street name” or persons, partnerships, associations, corporations or other entities in security position listings maintained by depositories.
Dividend Policy
Historically, including the years ended December 31, 2014 and 2013, we have not paid cash dividends on our common stock. We currently intend to retain future earnings, if any, to finance the development and expansion of our business and, therefore, we do not intend to pay cash dividends on our common stock for the foreseeable future. Moreover, as discussed in Note 10 to our audited consolidated financial statements in Item 8 of Part II of this Annual Report on Form 10-K, our ability to pay cash dividends on our common stock is limited by the agreements and an indenture governing our debt obligations. Any future determination to pay dividends will be at the discretion of our board of directors and will depend on our financial condition, results of operations, capital requirements, restrictions contained in any financing agreements and such other factors as our board of directors deems relevant.
40
Table of Contents
Stock Performance Graph
The stock performance graph below illustrates the cumulative total shareholder return on our common stock for the period from July 25, 2013 (the first day of trading for our common stock on the NYSE) to December 31, 2014, as compared to the Standard & Poor’s 500 Index and the Standard & Poor’s Composite 1500 Homebuilding Index. The comparison assumes (i) a hypothetical investment of $100 in our common stock and the two abovementioned indices on July 25, 2013 and (ii) the full reinvestment of all dividends; however, we have not declared any dividends on our common stock during the indicated period. Shareholder returns over the indicated period are based on historical data and should not be considered indicative of future shareholder returns. The stock performance graph does not reflect or endorse our forecast of future financial performance.
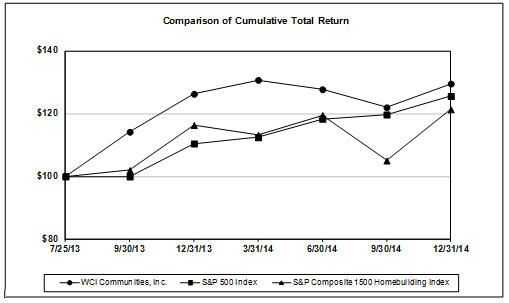
| Company / Index |
Base Period 7/25/13 |
Quarter Ended | ||||||||||||||||||||||||||
| 9/30/13 | 12/31/13 | 3/31/14 | 6/30/14 | 9/30/14 | 12/31/14 | |||||||||||||||||||||||
| WCI Communities, Inc. |
$ | 100.00 | $ | 114.15 | $ | 126.26 | $ | 130.69 | $ | 127.71 | $ | 121.96 | $ | 129.50 | ||||||||||||||
| S&P 500 Index |
100.00 | 99.91 | 110.41 | 112.40 | 118.29 | 119.62 | 125.52 | |||||||||||||||||||||
| S&P Composite 1500 Homebuilding Index |
100.00 | 101.96 | 116.32 | 113.20 | 119.51 | 105.01 | 121.28 | |||||||||||||||||||||
In the above stock performance graph, we use the same methods of presentation and assumptions for calculating our cumulative total shareholder return calculation as those used by the selected indices. The Standard & Poor’s 1500 Composite Homebuilding Index is a widely-recognized index comprised of large, mid and small cap national homebuilders. We believe that a comparison of our cumulative total shareholder return to this index represents a meaningful analysis for shareholders, investors and other interested parties.
Notwithstanding any general incorporation language to the contrary, the above stock performance graph and any related information shall not be deemed to be incorporated by reference into any of our filings with the Securities and Exchange Commission (the “SEC”) under the Securities Act of 1933, as amended, or the Securities Exchange Act of 1934, as amended (the “Exchange Act”), except to the extent that we specifically identify such information for incorporation by reference into such filings, and should not be deemed to be “soliciting material,” or to be “filed” with the SEC or subject to Regulation 14A or 14C, or to the liabilities of Section 18 of the Exchange Act.
41
Table of Contents
| Item 6. | Selected Financial Data. |
The selected consolidated financial data included in the tables below should be read in conjunction with (i) Management’s Discussion and Analysis of Financial Condition and Results of Operations in Item 7 of Part II of this Annual Report on Form 10-K and (ii) our audited consolidated financial statements and related notes thereto in Item 8 of Part II of this Annual Report on Form 10-K. The selected consolidated statements of operations data and the selected consolidated balance sheet data were derived from, and are qualified by reference to, our audited consolidated financial statements and related notes thereto (our audited consolidated balance sheets as of December 31, 2012 and 2011 and our consolidated statement of operations for the year ended December 31, 2011 are not included in this Annual Report on Form 10-K). All per share data in the tables below gives effect to the 10.3 for 1 stock split of our common stock that occurred on July 22, 2013 (see Notes 1 and 14 to our audited consolidated financial statements).
We have elected to utilize the reduced disclosure requirements available to emerging growth companies under the Jumpstart our Business Startups Act of 2012, including the presentation of only four years of selected financial data in the tables below. See “Management’s Discussion and Analysis of Financial Condition and Results of Operations—Implications of Being an Emerging Growth Company” in Item 7 of Part II of this Annual Report on Form 10-K.
| Years Ended December 31, | ||||||||||||||||
| 2014 | 2013 | 2012 | 2011 | |||||||||||||
| (in thousands, except per share amounts) | ||||||||||||||||
| Consolidated statements of operations data: |
||||||||||||||||
| Total revenues (1) |
$ | 407,003 | $ | 317,349 | $ | 241,008 | $ | 144,272 | ||||||||
| Gross margin (1) (2) |
82,541 | 65,324 | 44,293 | (8,882 | ) | |||||||||||
| Income (loss) from continuing operations before income taxes (1) (2) (3) (4) |
36,036 | 20,776 | (4,305 | ) | (54,453 | ) | ||||||||||
| Net income (loss) (5) |
21,384 | 146,485 | 50,634 | (46,325 | ) | |||||||||||
| Net income (loss) attributable to common shareholders of WCI Communities, Inc. (6) |
21,597 | 126,968 | 50,823 | (47,125 | ) | |||||||||||
| Earnings (loss) per share attributable to common shareholders of WCI Communities, Inc.: |
||||||||||||||||
| Basic |
||||||||||||||||
| Continuing operations |
$ | 0.83 | $ | 5.88 | $ | 3.33 | $ | (4.90 | ) | |||||||
| Discontinued operations |
— | — | 0.19 | 0.13 | ||||||||||||
|
|
|
|
|
|
|
|
|
|||||||||
| Earnings (loss) per share |
$ | 0.83 | $ | 5.88 | $ | 3.52 | $ | (4.77 | ) | |||||||
|
|
|
|
|
|
|
|
|
|||||||||
| Diluted |
||||||||||||||||
| Continuing operations |
$ | 0.82 | $ | 5.86 | $ | 3.31 | $ | (4.90 | ) | |||||||
| Discontinued operations |
— | — | 0.19 | 0.13 | ||||||||||||
|
|
|
|
|
|
|
|
|
|||||||||
| Earnings (loss) per share |
$ | 0.82 | $ | 5.86 | $ | 3.50 | $ | (4.77 | ) | |||||||
|
|
|
|
|
|
|
|
|
|||||||||
| Weighted average number of shares of common stock outstanding: |
||||||||||||||||
| Basic |
26,021 | 21,586 | 14,445 | 9,883 | ||||||||||||
| Diluted |
26,292 | 21,680 | 14,515 | 9,883 | ||||||||||||
| December 31, | ||||||||||||||||
| 2014 | 2013 | 2012 | 2011 | |||||||||||||
| (in thousands) | ||||||||||||||||
| Consolidated balance sheet data: |
||||||||||||||||
| Cash and cash equivalents |
$ | 174,756 | $ | 213,352 | $ | 81,094 | $ | 43,350 | ||||||||
| Real estate inventories |
449,249 | 280,293 | 183,168 | 158,332 | ||||||||||||
| Total assets |
805,310 | 685,486 | 347,262 | 305,010 | ||||||||||||
| Total debt obligations (7) |
251,179 | 200,000 | 122,729 | 139,584 | ||||||||||||
| Total liabilities |
370,867 | 275,622 | 178,657 | 236,450 | ||||||||||||
| Total equity, including noncontrolling interests (8) |
434,443 | 409,864 | 168,605 | 68,560 | ||||||||||||
| (1) | Amounts exclude our discontinued operations. |
| (2) | During the years ended December 31, 2014 and 2011, we recorded asset impairment charges aggregating $1.2 million and $11.4 million, respectively. The details of our 2014 impairment charge are discussed in Note 5 to the audited consolidated financial statements in Item 8 of Part II of this Annual Report on Form 10-K. |
| (3) | As discussed in Note 10 to our audited consolidated financial statements, we recorded expenses related to early repayment of debt of $5.1 million and $17.0 million during the years ended December 31, 2013 and 2012, respectively. |
| (4) | Noncontrolling interests for continuing operations were not material to any other years presented in the above tables. |
| (5) | Our income tax expense from continuing operations during the year ended December 31, 2014 was $14.7 million, compared to income tax benefits from continuing operations of $125.7 million, $52.2 million and $6.1 million during the years ended December 31, 2013, 2012 and 2011, respectively. These significant year-over-year fluctuations were primarily due to the accounting afforded our substantial net operating loss carryforwards, valuation allowances and unrecognized income tax benefits. Our income tax provisions for 2014, 2013 and 2012 are discussed in Note 12 to the audited consolidated financial statements. |
42
Table of Contents
| (6) | As discussed in Note 14 to the audited consolidated financial statements, the net income (loss) attributable to common shareholders of WCI Communities, Inc. was affected by preferred stock dividends aggregating $19.7 million during the year ended December 31, 2013. |
| (7) | As discussed in Note 10 to the audited consolidated financial statements, we issued new debt during each of the years ended December 31, 2014, 2013 and 2012. We also voluntarily prepaid certain debt during each of the years ended December 31, 2013 and 2012. |
| (8) | We have not declared or paid any dividends on our common stock during the years presented in the above tables. |
| Item 7. | Management’s Discussion and Analysis of Financial Condition and Results of Operations. |
The following discussion should be read in conjunction with, and is qualified in its entirety by, the audited consolidated financial statements and related notes included in Item 8 of Part II of this Annual Report on Form 10-K and our “Cautionary Note Regarding Forward-Looking Statements” included elsewhere in this Annual Report on Form 10-K. This item and the related discussion contain forward-looking statements reflecting current expectations that involve risks and uncertainties. Actual results and the timing of events may differ materially from those indicated in such forward-looking statements. Factors that may cause such differences include, but are not limited to, those discussed under “Cautionary Note Regarding Forward-Looking Statements” included elsewhere in this Annual Report on Form 10-K and “Risk Factors” in Item 1A of Part I of this Annual Report on Form 10-K. Many of the amounts and percentages in this discussion have been rounded for convenience of presentation.
Company Overview
During the year ended December 31, 2014, we continued to benefit from the positive momentum in the Florida housing market, which has largely been driven by attractive home affordability, low levels of home inventory in many of the markets that we serve, historically low mortgage rates, increasing consumer confidence levels and an overall improvement in the economy. More recently, on a national level, rising home prices, fluctuating interest rates and continued strict mortgage underwriting guidelines have somewhat moderated the demand for new homes. However, we continue to experience year-over-year improvement in customer traffic and new orders in our active selling neighborhoods. Increased scale in our homebuilding operations has also resulted in an increase in home deliveries during the year ended December 31, 2014 when compared to the prior year.
We accessed the debt and equity capital markets during the years ended December 31, 2014 and 2013, receiving total net proceeds of $336.2 million from an initial public offering of our common stock and two separate issuances of our 6.875% Senior Notes due 2021, including the sale of an aggregate principal amount of $50.0 million of such 6.875% Senior Notes due 2021 during June 2014 at an issue price of 102.5%. For further discussion of such transactions, see below under “Liquidity and Capital Resources—Initial Public Offering and Senior Notes.” Additionally, during August 2013, we entered into a four-year senior unsecured revolving credit facility in an aggregate amount of up to $75.0 million.
We continue to capitalize on the improving Florida housing market by differentiating ourselves from our competition by offering luxury lifestyle communities and award-winning homes in most of coastal Florida’s highest growth markets. The move-up, second-home and active adult buyers that we target continue to exhibit favorable demographic trends, strong demand indicators and financial stability. Moreover, the Florida economy and housing market have been demonstrating favorable trends in recent years in respect of: (i) population growth; (ii) job growth; (iii) household growth; (iv) the growth of building permits in comparison to national results; and (v) the new and resale markets for single- and multi-family homes. Overall, our positive operating results and capital markets activity during the years ended December 31, 2014 and 2013 have strengthened our financial position, which was demonstrated by solid improvements in most of our key financial and operating metrics. We believe that our strong balance sheet and significant liquidity position us to take advantage of the improving Florida economy and housing market through both the increasing scale of our existing land holdings and future acquisitions.
Opportunities to purchase land in desirable locations at a reasonable price are becoming increasingly more limited and competitive. However, we acquired approximately 2,100 home sites for $101.4 million during the year ended December 31, 2014 and approximately 1,900 home sites for $70.7 million during the year ended December 31, 2013. As of December 31, 2014, we owned and controlled approximately 12,600 home sites of which approximately 8,600 were owned and 4,000 were controlled by us. Outstanding land purchase contracts as of February 25, 2015 totaled approximately 4,100 home sites in 18 planned neighborhoods, situated in six master-planned communities throughout Florida, for an aggregate purchase price of $62.7 million. Deposits related to these outstanding purchase contracts consisted of $0.3 million that are non-refundable and $0.7 million that are refundable due to being in the early stages of our various inspection periods. There can be no assurances that we will acquire any of the land under contract on the terms or within the timing anticipated, or at all. For further discussion of certain risks related to the Company’s land acquisitions, see “Risk Factors—Risks Related to Our Business—We may not be successful in our efforts to identify, complete or integrate acquisitions, which could adversely affect our results of operations and future growth.” in Item 1A of Part I of this Annual Report on Form 10-K.
43
Table of Contents
Summary Company Operating Results
We continued to experience solid operating and financial performance during the year ended December 31, 2014, including an increase in total revenues to $407.0 million, or 28.3%, compared to $317.3 million during the year ended December 31, 2013. Such increase was primarily due to a 36.8% improvement in our Homebuilding segment revenues, which was driven by a 30.6% increase in home deliveries and a 4.4% increase in the average selling price per home delivered. Additionally, year-over-year revenues from our Real Estate Services and Amenities segments grew 13.1% and 1.7%, respectively. Consolidated gross margin during the years ended December 31, 2014 and 2013 was $82.5 million and $65.3 million, respectively. The 2014 gross margin increase of $17.2 million included (i) improvement of approximately $18.8 million in our Homebuilding segment, which was primarily due to an increase in homes delivered and the average selling price per home delivered, partially offset by gross margin erosion of 170 basis points related to shifting product mix, and (ii) improvement of $0.3 million at our Amenities segment prior to a 2014 impairment charge. Such improvements in gross margin were partially offset by (i) a decline of $0.6 million in our Real Estate Services segment and (ii) an impairment charge of $1.2 million for one of our Amenities assets.
Our income from continuing operations before income taxes was $36.0 million and $20.8 million during the years ended December 31, 2014 and 2013, respectively, a 73.1% year-over-year increase. The improved 2014 operating results were primarily due to: (i) the abovementioned net improvement in consolidated gross margin; (ii) $5.1 million of expenses related to early repayment of debt during 2013 that that did not recur during 2014; (iii) a reduction of $1.8 million in our stock-based and other non-cash long-term incentive compensation expense during 2014; and (iv) less interest expense during 2014, primarily due to a greater portion of our interest incurred being capitalized. Partially offsetting these items were (i) an increase in certain selling, general and administrative expenses, primarily due to increases in salaries and benefits, a full year of public company expenses and increased direct marketing and sales office expenses as a result of our increased neighborhood count, and (ii) a decline in other income of $1.0 million.
Net income attributable to common shareholders of WCI Communities, Inc. was $21.6 million and $127.0 million during the years ended December 31, 2014 and 2013, respectively. This year-over-year change was primarily due to income tax expense of $14.7 million during 2014, compared to an income tax benefit of $125.7 million during 2013, which was principally attributable to a reversal of deferred tax asset valuation allowances during such year. Partially offsetting these items were (i) $19.7 million of preferred stock dividends during 2013 ($19.0 million of which was non-cash and related to the exchange of our Series A preferred stock for common stock) that did not recur during 2014 and (ii) certain factors impacting our operations, which are described in the immediately preceding paragraph.
As of December 31, 2014, our cash and cash equivalents were $174.8 million, a decrease of $38.6 million from $213.4 million as of December 31, 2013. Such decrease was primarily due to our continued investment in land, land development and home construction that is reflected in our increased real estate inventories, partially offset by (i) the cash flow generated by the 644 homes that we delivered during the year ended December 31, 2014 and (ii) total proceeds of $72.9 million that we received from the issuance of $50.0 million in aggregate principal amount of our 6.875% Senior Notes due 2021 during June 2014 and the sale of certain community development district bonds during April 2014. The net increase in our real estate inventories of $158.7 million during the year ended December 31, 2014 was primarily due to $101.4 million of land acquisitions along with land development and home construction spending within our communities. As of December 31, 2014, our net debt to net capitalization was 14.8%. See below under “Non-GAAP Measures” for additional information about our net debt to net capitalization measure, including a reconciliation to the most directly comparable measure in our audited consolidated financial statements in Item 8 of Part II of this Annual Report on Form 10-K.
Due to continued improvement in the Florida housing market and growth in our active selling neighborhoods, new orders increased to 743 homes during the year ended December 31, 2014, an increase of 212 homes, or 39.9%, from 531 homes during the year ended December 31, 2013. As of December 31, 2014, the value of our backlog was $205.3 million, an increase of $61.5 million, or 42.8%, from $143.8 million as of December 31, 2013. We had 392 homes in backlog as of December 31, 2014, an increase of 99 homes, or 33.8%, from 293 homes as of December 31, 2013. The increase in backlog units was primarily due to our increase in new orders. An improvement of 6.7% in the average selling price of our backlog units to $524,000 also contributed to the increase in the value of our backlog as of December 31, 2014. During the year ended December 31, 2014, our cancellation rate as a percent of gross new orders was 6.8% and our all-cash buyers as a percent of total home buyers was approximately 58%. As of December 31, 2014, our average customer deposit as a percent of a home’s selling price in our backlog was 14.4%. Our low cancellation rate, high customer deposit percentage and historically high percentage of all-cash buyers reflect a high quality backlog given our move-up, second-home and active adult buyers.
Non-GAAP Measures
In addition to the results reported in accordance with U.S. generally accepted accounting principles (“GAAP”), we have provided information in this Annual Report on Form 10-K relating to adjusted gross margin from homes delivered, EBITDA and Adjusted EBITDA (both such terms are defined below), and net debt to net capitalization.
44
Table of Contents
Adjusted Gross Margin from Homes Delivered
We calculate adjusted gross margin from homes delivered by subtracting the gross margin from land and home sites, if any, from Homebuilding gross margin to arrive at gross margin from homes delivered. Adjusted gross margin from homes delivered is calculated by adding asset impairments, if any, and capitalized interest in cost of sales to gross margin from homes delivered. Management uses adjusted gross margin from homes delivered to evaluate operating performance in our Homebuilding segment and make strategic decisions regarding sales price, construction and development pace, product mix and other operating decisions. We believe that adjusted gross margin from homes delivered is relevant and useful to shareholders, investors and other interested parties for evaluating our comparative operating performance from period to period and among companies within the homebuilding industry as it is reflective of overall profitability during any given reporting period. This measure is considered a non-GAAP financial measure and should be considered in addition to, rather than as a substitute for, the comparable GAAP financial measures when evaluating our operating performance. Although other companies in the homebuilding industry report similar information, the methods used by such companies may differ from our methodology and, therefore, may not be comparable. We urge shareholders, investors and other interested parties to understand the methods used by other companies in the homebuilding industry to calculate gross margins and any adjustments to such amounts before comparing our measures to those of such other companies.
The table below reconciles adjusted gross margin from homes delivered to the most directly comparable GAAP financial measure, Homebuilding gross margin, for the years presented herein. For a detailed discussion of Homebuilding gross margin, see “Consolidated Results of Operations” below.
| Years Ended December 31, | ||||||||||||
| 2014 | 2013 | 2012 | ||||||||||
| ($ in thousands) | ||||||||||||
| Homebuilding gross margin |
$ | 82,994 | $ | 64,248 | $ | 46,140 | ||||||
| Less: gross margin from land and home sites |
437 | 195 | 2,177 | |||||||||
|
|
|
|
|
|
|
|||||||
| Gross margin from homes delivered |
82,557 | 64,053 | 43,963 | |||||||||
| Add: capitalized interest in cost of sales |
6,306 | 4,257 | 2,301 | |||||||||
|
|
|
|
|
|
|
|||||||
| Adjusted gross margin from homes delivered |
$ | 88,863 | $ | 68,310 | $ | 46,264 | ||||||
|
|
|
|
|
|
|
|||||||
| Gross margin from homes delivered as a percentage of revenues from homes delivered |
28.3 | % | 30.0 | % | 31.5 | % | ||||||
|
|
|
|
|
|
|
|||||||
| Adjusted gross margin from homes delivered as a percentage of revenues from homes delivered |
30.5 | % | 32.0 | % | 33.2 | % | ||||||
|
|
|
|
|
|
|
|||||||
EBITDA and Adjusted EBITDA
Adjusted EBITDA measures performance by adjusting net income (loss) attributable to common shareholders of WCI Communities, Inc. to exclude, if any, interest expense, capitalized interest in cost of sales, income taxes, depreciation (‘‘EBITDA’’), preferred stock dividends, income (loss) from discontinued operations, other income, stock-based and other non-cash long-term incentive compensation expense, asset impairments and expenses related to early repayment of debt. We believe that the presentation of Adjusted EBITDA provides useful information to shareholders, investors and other interested parties regarding our results of operations because it assists those parties and us when analyzing and benchmarking the performance and value of our business. We also believe that Adjusted EBITDA is useful as a measure of comparative operating performance from period to period and among companies in the homebuilding industry as it is reflective of changes in pricing decisions, cost controls and other factors that affect operating performance, and it removes the effects of our capital structure (such as preferred stock dividends and interest expense), asset base (primarily depreciation), items outside of our control (primarily income taxes) and the volatility related to the timing and extent of non-operating activities (such as discontinued operations and asset impairments). Accordingly, we believe that this measure is useful for comparing general operating performance from period to period. Other companies may define Adjusted EBITDA differently and, as a result, our measure of Adjusted EBITDA may not be directly comparable to Adjusted EBITDA of other companies. Although we use Adjusted EBITDA as a financial measure to assess the performance of our business, the use of Adjusted EBITDA is limited because it does not include certain material costs, such as interest and income taxes, necessary to operate our business. Adjusted EBITDA and EBITDA should be considered in addition to, and not as substitutes for, net income (loss) in accordance with GAAP as a measure of performance. Our presentation of EBITDA and Adjusted EBITDA should not be construed as an indication that our future results will be unaffected by unusual or nonrecurring items. Our EBITDA-based measures have
45
Table of Contents
limitations as analytical tools and, therefore, shareholders, investors and other interested parties should not consider them in isolation or as substitutes for analyses of our results as reported under GAAP. Some such limitations are:
| • | they do not reflect the impact of earnings or charges resulting from matters that we consider not to be indicative of our ongoing operations; |
| • | they are not adjusted for all non-cash income or expense items that are reflected in our consolidated statements of cash flows; |
| • | they do not reflect the interest that is necessary to service our debt; and |
| • | other companies in our industry may calculate these measures differently than we do, thereby limiting their usefulness as comparative measures. |
Because of these limitations, our EBITDA-based measures are not intended to be alternatives to net income (loss), indicators of our operating performance, alternatives to any other measure of performance in conformity with GAAP or alternatives to cash flow provided by (used in) operating activities as measures of liquidity. Shareholders, investors and other interested parties should therefore not place undue reliance on our EBITDA-based measures or ratios calculated using those measures. Our GAAP-based measures can be found in our audited consolidated financial statements in Item 8 of Part II of this Annual Report on Form 10-K.
The table below reconciles EBITDA and Adjusted EBITDA to the most directly comparable GAAP financial measure, net income attributable to common shareholders of WCI Communities, Inc., for the years presented herein.
| Years Ended December 31, | ||||||||||||
| 2014 | 2013 | 2012 | ||||||||||
| ($ in thousands) | ||||||||||||
| Net income attributable to common shareholders of WCI Communities, Inc. |
$ | 21,597 | $ | 126,968 | $ | 50,823 | ||||||
| Interest expense |
1,140 | 2,537 | 6,978 | |||||||||
| Capitalized interest in cost of sales (1) |
6,306 | 4,257 | 2,304 | |||||||||
| Income tax expense (benefit) (2) |
14,652 | (125,709 | ) | (52,233 | ) | |||||||
| Depreciation |
2,627 | 2,081 | 2,000 | |||||||||
|
|
|
|
|
|
|
|||||||
| EBITDA |
46,322 | 10,134 | 9,872 | |||||||||
| Preferred stock dividends (3) |
— | 19,680 | — | |||||||||
| Income from discontinued operations |
— | — | (2,706 | ) | ||||||||
| Other income, net (4) |
(1,604 | ) | (2,642 | ) | (7,493 | ) | ||||||
| Stock-based and other non-cash long-term incentive compensation expense (5) |
3,422 | 5,217 | 705 | |||||||||
| Asset impairment (6) |
1,200 | — | — | |||||||||
| Expenses related to early repayment of debt (7) |
— | 5,105 | 16,984 | |||||||||
|
|
|
|
|
|
|
|||||||
| Adjusted EBITDA |
$ | 49,340 | $ | 37,494 | $ | 17,362 | ||||||
|
|
|
|
|
|
|
|||||||
| Adjusted EBITDA margin |
12.1 | % | 11.8 | % | 7.2 | % | ||||||
|
|
|
|
|
|
|
|||||||
| (1) | Represents capitalized interest expensed in cost of sales on home deliveries and land and home site sales. |
| (2) | Represents the Company’s income taxes from continuing operations as reported in its consolidated statements of operations. |
| (3) | Represents a reduction in net income attributable to WCI Communities, Inc. pertaining to its preferred stock wherein we (i) exchanged 903,825 shares of our common stock (valued at $19.0 million) for 10,000 outstanding shares of our Series A preferred stock during July 2013 and (ii) paid $0.7 million in cash to purchase the one outstanding share of our Series B preferred stock during April 2013. All such shares of preferred stock, which were carried at a nominal value on our consolidated balance sheets, have been cancelled and retired. In accordance with Accounting Standards Codification 260, Earnings Per Share, paragraph 10-S99-2, any difference between the consideration transferred to our preferred stock shareholders and the corresponding book value has been (i) characterized as a preferred stock dividend in the Company’s consolidated statements of operations during the year that the related transaction was completed and (ii) deducted from net income attributable to WCI Communities, Inc. to arrive at net income attributable to common shareholders of WCI Communities, Inc. |
46
Table of Contents
| (4) | Represents the Company’s other income, net as reported in its consolidated statements of operations. |
| (5) | Represents expenses recorded in the Company’s consolidated statements of operations related to its stock-based and other non-cash long-term incentive compensation plans. |
| (6) | Represents an impairment charge recorded in the Company’s consolidated statements of operations during the year ended December 31, 2014 in connection with the write-down to fair value of one of its Amenities assets. |
| (7) | Represents expenses related to early repayment of debt as reported in the Company’s consolidated statements of operations, including (i) $5.1 million of write-offs of unamortized debt discount and debt issuance costs and a prepayment premium related to our voluntary prepayment of the entire outstanding principal amount of the Company’s Senior Secured Term Notes due 2017 in August 2013 and (ii) the write-off of $17.0 million of unamortized debt discount and debt issuance costs related to the repayment and retirement of our senior subordinated secured term loan in June 2012. |
Net Debt to Net Capitalization
We believe that net debt to net capitalization provides useful information to shareholders, investors and other interested parties regarding our financial position and cash and debt management. It is also a relevant financial measure for understanding the leverage employed in our operations and as an indicator of our ability to obtain future financing.
We believe that by deducting cash and cash equivalents from our outstanding debt, we provide a measure of our debt that considers our cash position. Furthermore, we believe that this approach provides useful information because the ratio of debt to capital does not consider our cash and cash equivalents and we believe that a debt ratio net of cash, such as net debt to net capitalization, provides supplemental information by which our financial position may be considered. Shareholders, investors and other interested parties may also find this information to be helpful when comparing our leverage to the leverage of our competitors that present similar information.
The table below presents the computations of our net debt to net capitalization and reconciles such amounts to the most directly comparable GAAP financial measure, debt to capital.
| December 31, | ||||||||
| 2014 | 2013 | |||||||
| ($ in thousands) | ||||||||
| Senior Notes due 2021 |
$ | 251,179 | $ | 200,000 | ||||
| Total equity |
434,443 | 409,864 | ||||||
|
|
|
|
|
|||||
| Total capital |
$ | 685,622 | $ | 609,864 | ||||
|
|
|
|
|
|||||
| Debt to capital (1) |
36.6 | % | 32.8 | % | ||||
|
|
|
|
|
|||||
| Senior Notes due 2021 |
$ | 251,179 | $ | 200,000 | ||||
| Less: unamortized premium |
1,179 | — | ||||||
|
|
|
|
|
|||||
| Principal amount of Senior Notes due 2021 |
250,000 | 200,000 | ||||||
| Less: cash and cash equivalents |
174,756 | 213,352 | ||||||
|
|
|
|
|
|||||
| Net debt |
75,244 | (13,352 | ) | |||||
| Total equity |
434,443 | 409,864 | ||||||
|
|
|
|
|
|||||
| Net capitalization |
$ | 509,687 | $ | 396,512 | ||||
|
|
|
|
|
|||||
| Net debt to net capitalization (2) |
14.8 | % | NM | (3) | ||||
|
|
|
|
|
|||||
| (1) | Debt to capital is computed by dividing the carrying value of our Senior Notes due 2021, as reported on our consolidated balance sheets, by total capital as calculated above. The Senior Notes due 2021 were our only outstanding debt as of December 31, 2014 and 2013. |
| (2) | Net debt to net capitalization is computed by dividing net debt by net capitalization. |
| (3) | Net debt to net capitalization as of December 31, 2013 is not meaningful (“NM”) because our net debt was less than zero on such date. |
47
Table of Contents
Consolidated Results of Operations
WCI Communities, Inc.
Consolidated Statements of Operations
(in thousands)
| Years Ended December 31, | ||||||||||||
| 2014 | 2013 | 2012 | ||||||||||
| Revenues |
||||||||||||
| Homebuilding |
$ | 292,785 | $ | 214,016 | $ | 146,926 | ||||||
| Real estate services |
90,582 | 80,096 | 73,070 | |||||||||
| Amenities |
23,636 | 23,237 | 21,012 | |||||||||
|
|
|
|
|
|
|
|||||||
| Total revenues |
407,003 | 317,349 | 241,008 | |||||||||
|
|
|
|
|
|
|
|||||||
| Cost of Sales |
||||||||||||
| Homebuilding |
209,791 | 149,768 | 100,786 | |||||||||
| Real estate services |
88,094 | 76,972 | 71,675 | |||||||||
| Amenities |
25,377 | 25,285 | 24,254 | |||||||||
| Asset impairment |
1,200 | — | — | |||||||||
|
|
|
|
|
|
|
|||||||
| Total cost of sales |
324,462 | 252,025 | 196,715 | |||||||||
|
|
|
|
|
|
|
|||||||
| Gross margin |
82,541 | 65,324 | 44,293 | |||||||||
|
|
|
|
|
|
|
|||||||
| Selling, general and administrative expenses |
46,969 | 39,548 | 32,129 | |||||||||
| Interest expense |
1,140 | 2,537 | 6,978 | |||||||||
| Other income, net |
(1,604 | ) | (2,642 | ) | (7,493 | ) | ||||||
| Expenses related to early repayment of debt |
— | 5,105 | 16,984 | |||||||||
|
|
|
|
|
|
|
|||||||
| 46,505 | 44,548 | 48,598 | ||||||||||
|
|
|
|
|
|
|
|||||||
| Income (loss) from continuing operations before income taxes |
36,036 | 20,776 | (4,305 | ) | ||||||||
| Income tax expense (benefit) from continuing operations |
14,652 | (125,709 | ) | (52,233 | ) | |||||||
|
|
|
|
|
|
|
|||||||
| Income from continuing operations |
21,384 | 146,485 | 47,928 | |||||||||
| Income from discontinued operations, net of tax |
— | — | 118 | |||||||||
| Gain on sale of discontinued operations, net of tax |
— | — | 2,588 | |||||||||
|
|
|
|
|
|
|
|||||||
| Net income |
21,384 | 146,485 | 50,634 | |||||||||
| Net loss from continuing operations attributable to noncontrolling interests |
213 | 163 | 189 | |||||||||
|
|
|
|
|
|
|
|||||||
| Net income attributable to WCI Communities, Inc. |
21,597 | 146,648 | 50,823 | |||||||||
| Preferred stock dividends |
— | (19,680 | ) | — | ||||||||
|
|
|
|
|
|
|
|||||||
| Net income attributable to common shareholders of WCI Communities, Inc. |
$ | 21,597 | $ | 126,968 | $ | 50,823 | ||||||
|
|
|
|
|
|
|
|||||||
48
Table of Contents
Year Ended December 31, 2014 Compared to the Year Ended December 31, 2013
Homebuilding
| Years Ended December 31, | ||||||||
| 2014 | 2013 | |||||||
| ($ in thousands) | ||||||||
| Homebuilding revenues |
$ | 292,785 | $ | 214,016 | ||||
| Homes delivered |
291,285 | 213,479 | ||||||
| Land and home sites |
1,500 | 537 | ||||||
| Homebuilding gross margin |
82,994 | 64,248 | ||||||
| Homebuilding gross margin percentage |
28.3 | % | 30.0 | % | ||||
| Homes delivered (units) |
644 | 493 | ||||||
| Average selling price per home delivered |
$ | 452 | $ | 433 | ||||
| New orders for homes (units) (1) |
743 | 531 | ||||||
| Contract values of new orders (1) |
$ | 351,918 | $ | 243,196 | ||||
| Average selling price per new order (1) |
474 | 458 | ||||||
| Cancellation rate (2) |
6.8 | % | 4.7 | % | ||||
| Backlog (units) (3) |
392 | 293 | ||||||
| Backlog contract values (3) |
$ | 205,312 | $ | 143,819 | ||||
| Average selling price in backlog (3) |
524 | 491 | ||||||
| Active selling neighborhoods at year-end |
37 | 25 | ||||||
| (1) | New orders represent orders for homes, including the amount (in units) and contract values, net of any cancellations, occurring during the reporting year. |
| (2) | Represents the number of orders canceled during the year divided by the number of gross orders executed during such year (excludes cancellations and gross orders related to customer home site transfers). |
| (3) | Backlog only includes orders for homes at the end of the reporting year that have a binding sales agreement signed by both the homebuyer and us where the home has yet to be delivered to the homebuyer. |
Total homebuilding revenues during the year ended December 31, 2014 were $292.8 million, an increase of $78.8 million, or 36.8%, from $214.0 million during the year ended December 31, 2013. Such increase was primarily due to a: (i) 151-unit, or 30.6%, increase in homes delivered; (ii) 4.4% increase in the average selling price of homes delivered; and (iii) $1.0 million increase in land and home site revenues. The increase in home deliveries was reflective of the continued ramp up in our operations. Additionally, an improved pricing environment and shifting product mix drove the increase in average selling prices of homes delivered.
Homebuilding gross margin during the year ended December 31, 2014 was $83.0 million, an increase of $18.8 million, from $64.2 million during the year ended December 31, 2013. Homebuilding gross margin as a percent of revenues decreased to 28.3% for the year ended December 31, 2014 from 30.0% for the year ended December 31, 2013. Such decrease resulted from shifting product mix as partially evidenced by an increase of 150 basis points in our home site cost of sales as a percent of homes delivered revenues. This increase related to shifting product mix as well as a greater percentage of deliveries from recent land acquisitions, which do not benefit from low book value land related to fresh start accounting (as discussed below). Partially offsetting the decrease in our gross margin percentage were: (i) favorable warranty experience; (ii) an increase in vendor rebates; and (iii) the reversal of a sales incentive reserve for club membership upgrades that expired unused on December 31, 2014, which collectively had an aggregate favorable impact of 60 basis points on our 2014 gross margin.
Our homebuilding cost of sales and, therefore, our homebuilding gross margins during the years ended December 31, 2014 and 2013 were favorably impacted by the low book value of our land, which was reset to fair value during September 2009 in accordance with fresh start accounting requirements upon our emergence from bankruptcy (see Note 1 to our audited consolidated financial statements in Item 8 of Part II of this Annual Report on Form 10-K). During the year ended December 31, 2013, all of our home deliveries were generated from communities that we owned in September 2009, compared to approximately 90% of our corresponding home deliveries during the year ended December 31, 2014. The favorable impact of fresh start accounting contributed to a home site cost of sales as a percent of homes delivered revenues of 16.2% and 14.7% during the years ended December 31, 2014 and 2013, respectively. Fluctuations of the home site cost of sales percentage are primarily due to shifting product mix. Generally, we expect that homes delivered from communities we owned in September 2009 have a gross margin percentage approximately 5% to 10% higher than homes delivered from our more recent land acquisitions.
49
Table of Contents
As of December 31, 2014, approximately 36% of our total owned and controlled home sites, or approximately 4,600 home sites, benefited from being reset to fair value during September 2009. Due to the longer duration of our master-planned communities, we expect to continue to benefit from our favorable land book value for at least the next several years. However, based on the prices of land that we have purchased more recently, and as we acquire and develop land in the future at then-current market prices, we anticipate that the favorable impact of our low book value land on our homebuilding gross margin will lessen in the future. The low carrying value of our land is a significant driver of our gross margin from homes delivered of 28.3% and 30.0% during the years ended December 31, 2014 and 2013, respectively.
We delivered 644 homes during the year ended December 31, 2014, an increase of 151 units, or 30.6%, from the 493 homes delivered during the year ended December 31, 2013. The increase in deliveries during 2014 was primarily due to a larger backlog at December 31, 2013, compared to the backlog at December 31, 2012, along with having more neighborhoods delivering homes during 2014 when compared to 2013. The average selling price per home delivered during the year ended December 31, 2014 was $452,000, an increase of $19,000, or 4.4%, from $433,000 during the year ended December 31, 2013. An improved pricing environment and shifting product mix drove the increase in average selling prices of homes delivered.
During the year ended December 31, 2014, we generated 743 new orders, an increase of 212 new orders, or 39.9%, from 531 new orders during the year ended December 31, 2013. Such increase was primarily due to (i) continued momentum within our active selling neighborhoods and (ii) an increase in our active selling neighborhood count from 25 at December 31, 2013 to 37 at December 31, 2014. Contract values of new orders during the year ended December 31, 2014 were $351.9 million, an increase of $108.7 million, or 44.7%, from $243.2 million during the year ended December 31, 2013, primarily due to the 212-unit increase in new order activity and an improvement in the average selling price per unit of new orders to $474,000 during 2014 from $458,000 during 2013. The increase in our new order average selling price per unit during the year ended December 31, 2014 was primarily due to sales mix and strategic price increases in certain of our neighborhoods as the overall housing market continued to improve.
Our backlog contract value as of December 31, 2014 was $205.3 million, an increase of $61.5 million, or 42.8%, from $143.8 million as of December 31, 2013. An increase in the average selling price of our backlog units from $491,000 to $524,000, or 6.7%, contributed to the increase in our backlog contract value as of December 31, 2014. Additionally, we had 392 units in backlog as of December 31, 2014, an increase of 99 units, or 33.8%, from 293 units as of December 31, 2013. The increase in backlog was primarily due to continued improvement in the housing market, which was evidenced by our increase in new orders.
Real Estate Services
| Years Ended December 31, | ||||||||
| 2014 | 2013 | |||||||
| ($ in thousands) | ||||||||
| Real estate services revenues |
$ | 90,582 | $ | 80,096 | ||||
| Real estate brokerage |
86,564 | 76,406 | ||||||
| Title services |
4,018 | 3,690 | ||||||
| Real estate services gross margin |
2,488 | 3,124 | ||||||
| Real estate services gross margin percentage |
2.7 | % | 3.9 | % | ||||
| Real estate brokerage closed home sales transactions |
9,411 | 9,028 | ||||||
| Real estate brokerage average home sale selling price |
$ | 298 | $ | 268 | ||||
| Title services closing transactions |
2,498 | 2,544 | ||||||
Real estate services revenues during the year ended December 31, 2014 were $90.6 million, an increase of $10.5 million, or 13.1%, from $80.1 million during the year ended December 31, 2013. Such improvement was primarily due to an increase of 13.3% in real estate brokerage revenues, resulting from: (i) revenues associated with certain real estate brokerage offices that we acquired in late 2013 and early 2014; (ii) an 11.2% increase in average home sale selling price; and (iii) a 4.2% increase in closed home sales transactions. The increase in average home sale selling price during the year ended December 31, 2014 was generally aligned with improved pricing evidenced in the broader housing market, as well as a shifting mix in our real estate brokerage business from lower-priced, distressed home sales to higher-priced home sales. The increase in closed home sales transactions during the year ended December 31, 2014 was primarily due to the favorable effects from our recent acquisitions, partially offset by a decline at the real estate brokerage offices that we owned and operated during the entirety of 2014 and 2013. Title services revenues increased 8.9% during 2014 primarily due to more buyers from our Homebuilding segment who elected to use our title company, partially offset by fewer captured transactions from our company-owned real estate brokerage and less refinancing activity.
50
Table of Contents
Real estate services gross margin during the year ended December 31, 2014 was $2.5 million, a decrease of $0.6 million, or 19.4%, from $3.1 million during the year ended December 31, 2013. Such decrease was primarily due to incremental costs during 2014 associated with certain real estate brokerage offices that we acquired in late 2013 and early 2014, including higher commission splits during the post-acquisition transitional period, and other costs to improve and enhance the infrastructure of our real estate services business, partially offset by the margin associated with higher real estate brokerage revenues during such year. Real estate brokerage commissions and other variable costs as a percent of real estate brokerage revenues were 75.5% during the year ended December 31, 2014, an increase of 120 basis points, from 74.3% during the year ended December 31, 2013. Among other things, this increase was due to higher average commission splits being paid to our agents during 2014, which is a result of our top performers generating a greater percentage of home sales transactions, and the effects from our recent acquisitions.
Amenities
| Years Ended December 31, | ||||||||
| 2014 | 2013 | |||||||
| (in thousands) | ||||||||
| Revenues |
$ | 23,636 | $ | 23,237 | ||||
| Amenities gross margin |
(1,741 | ) | (2,048 | ) | ||||
Total amenities revenues during the year ended December 31, 2014 were $23.6 million, an increase of $0.4 million, or 1.7%, from $23.2 million during the year ended December 31, 2013. We generated $10.4 million of membership dues during 2014, compared to $9.7 million during 2013, an increase of $0.7 million. Club operating revenues were $12.5 million during the year ended December 31, 2014, compared to $12.3 million during the year ended December 31, 2013, an increase of $0.2 million. The increases in membership dues and club operating revenues were primarily due to a 10% increase in our membership base as of the end of the year, which accounted for more food and beverage, golf, tennis and fitness revenues being generated at our clubs. The membership base increase was driven by both new members from the sale of memberships and marina slips, as well as new members resulting from home deliveries in communities with bundled amenities for which we do not charge an initiation fee. Membership and marina slip sales revenues were $0.7 million and $1.2 million during the years ended December 31, 2014 and 2013, respectively.
Total amenities gross margin during the year ended December 31, 2014 was ($1.7) million (before the asset impairment charge discussed below), representing an improvement of $0.3 million when compared to ($2.0) million during the year ended December 31, 2013. Such improvement was primarily due to incremental revenues covering a greater portion of the fixed operating and maintenance costs to run our clubs, along with improvements in our variable expenses, such as merchandise and food and beverage costs, as a percent of revenues.
Asset Impairment
During the year ended December 31, 2013, we did not record any impairments on real estate inventories or other long-lived assets because (i) those assets meeting the criteria as held for sale, if any, had fair values in excess of their carrying values and (ii) those assets classified as held and used had undiscounted cash flows in excess of their carrying values. However, we recorded a $1.2 million impairment charge during the year ended December 31, 2014 in connection with the write-down to fair value of one of our Amenities assets where such asset’s estimated undiscounted cash flow did not exceed its carrying value. We also continue to monitor the values of certain of our land and Amenities assets to determine whether to hold them for future development or sell them at current market prices. If we choose to market any of our assets for sale, this action may potentially lead to the recording of impairment charges on those assets.
See Note 5 to our audited consolidated financial statements in Item 8 of Part II of this Annual Report on Form 10-K for further discussion of our 2014 asset impairment.
Selling, General and Administrative Expenses
Selling, general and administrative (“SG&A”) expenses were $47.0 million during the year ended December 31, 2014, an increase of $7.5 million, or 19.0%, from $39.5 million during the year ended December 31, 2013. Sales and marketing expenses, which pertain to our homebuilding operations and are comprised of commissions paid to our licensed in-house sales personnel and third-party real estate brokers, direct marketing expenses and sales office expenses, increased $3.6 million, or 24.0%, to $18.6 million during 2014, compared to $15.0 million during 2013. This increase was primarily due to increases in commissions directly related to our increase in home deliveries, along with greater direct marketing and sales office expenses as a result of our increased neighborhood count. As a percent of revenues from homes delivered, the related commission expense improved to 3.6% during 2014, compared to 3.9% during 2013. General and administrative expenses increased $3.9 million during the year ended December 31, 2014, compared to the year ended December 31, 2013, primarily due to (i) additional compensation expense supporting our growing operations and (ii) a full year of public company expenses during 2014, compared to a partial year during 2013. These items were partially offset by: (i) a decrease of $1.8 million in stock-based and other non-cash long-term incentive compensation expense during the year ended December 31, 2014 related to the stock-based and other long-term incentive compensation plans that we adopted during 2013; (ii) lower fees for attorneys and other professionals; and (iii) less real estate tax expense due to a greater portion being capitalized during 2014. As a percent of homebuilding revenues, SG&A expenses declined to 16.0% during the year ended December 31, 2014 from 18.5% during the year ended December 31, 2013.
51
Table of Contents
Interest Expense
Interest expense is primarily interest incurred on our debt but not capitalized. Interest expense was $1.1 million during the year ended December 31, 2014, a decrease of $1.4 million, or 56.0%, from $2.5 million during the year ended December 31, 2013. Such decrease was primarily due to a greater portion of our interest incurred being capitalized as a result of increased construction and community development spending and lower effective interest rates on our debt arrangements, partially offset by higher weighted average borrowings during 2014.
Other Income, net
During the years ended December 31, 2014 and 2013, other income was $1.6 million and $2.6 million, respectively. Other income during 2014 included $1.0 million of net recoveries and reductions in certain accruals and reserves related to various matters, along with other miscellaneous items, including $0.3 million of interest income. Other income during 2013 included $2.4 million of net recoveries and reductions in certain accruals related to various legal settlements, along with other miscellaneous items, including $0.2 million of interest income.
Expenses Related to Early Repayment of Debt
During August 2013, we completed the issuance of $200.0 million in aggregate principal amount of our 6.875% Senior Notes due 2021. Among other things, we used $127.0 million of the net proceeds from that offering to voluntarily prepay the entire outstanding principal amount of our Senior Secured Term Notes due 2017, of which $125.0 million in aggregate principal amount was outstanding, at a price equal to 101% of the principal amount, plus accrued and unpaid interest. In connection therewith, we recognized $5.1 million of expenses related to early repayment of debt during 2013, including the abovementioned prepayment premium of $1.2 million and write-offs of unamortized debt discount and deferred financing costs totaling $3.9 million.
See Note 10 to our audited consolidated financial statements in Item 8 of Part II of this Annual Report on Form 10-K for further discussion of our debt obligations.
Income Taxes
During the year ended December 31, 2014, income tax expense from continuing operations was $14.7 million. After excluding the net loss attributable to noncontrolling interests, which is not tax-effected in the Company’s consolidated financial statements, our effective income tax rate for continuing operations was 40.4% during 2014. Such rate was higher than the customary blended federal and state income tax rate primarily due to certain non-deductible stock-based compensation expense, partially offset by (i) a reduction in the Company’s deferred tax asset valuation allowances and (ii) the recognition of a state tax refund receivable pertaining to a prior period.
During the year ended December 31, 2013, our income tax benefit from continuing operations was $125.7 million, which was primarily due to the reversal of $125.6 million of deferred tax asset valuation allowances. Accordingly, our effective income tax rate during 2013 is not meaningful because there is no correlation between such rate and the corresponding income from continuing operations before income taxes. Our income tax provision from continuing operations during 2013 was otherwise nominal, which was primarily due to changes in our deferred tax asset valuation allowances offsetting any income tax expense.
As of December 31, 2014, we had a deferred tax asset of $110.8 million, which was net of a valuation allowance of $70.5 million. As a result of prior changes in ownership under Section 382 of the Internal Revenue Code of 1986, as amended (“Section 382”), our deferred tax assets are subject to certain limitations and our ability to recognize a tax benefit from certain unrealized built-in losses may be limited depending on, among other things, when, and at what price, we sell the underlying assets. For federal and state income tax purposes, assets with built-in losses sold prior to January 1, 2014 were generally subject to an annual limitation of approximately $85,000 and those sold on or after such date currently will not be subject to limitations. As of December 31, 2014, $116.8 million of our deferred tax assets represents federal and state net operating loss carryforwards, of which $62.6 million is generally subject to an annual deduction limitation of approximately $85,000 or deemed unusable and the tax-effected amount thereof is fully reserved by the Company in its valuation allowance. The remaining $54.2 million of such net operating loss carryforwards is not currently subject to limitations. However, a change in ownership under Section 382, which may occur in the future, would place additional limitations on our ability to use built-in losses and net operating loss carryforwards that are not currently subject to limitations. See “Risk Factors—Risks Related to Our Business—Our ability to utilize our net operating loss carryforwards is limited as a result of previous “ownership changes” as defined in Section 382 of the Internal Revenue Code of 1986, as amended, and may become further limited if we experience future ownership changes under Section 382 or if we do not generate enough taxable income in the future.” in Item 1A of Part I of this Annual Report on Form 10-K.
See Note 12 to our audited consolidated financial statements in Item 8 of Part II of this Annual Report on Form 10-K for further discussion of our income taxes.
52
Table of Contents
Preferred Stock Dividends
As it pertains to our preferred stock, we (i) exchanged 903,825 shares of our common stock (valued at $19.0 million) for 10,000 outstanding shares of our Series A preferred stock during July 2013 and (ii) paid $0.7 million in cash to purchase the one outstanding share of our Series B preferred stock during April 2013. All such shares of preferred stock, which were carried at a nominal value on our consolidated balance sheets, have been cancelled and retired. In accordance with Accounting Standards Codification 260, Earnings Per Share, paragraph 10-S99-2, any difference between the consideration transferred to our preferred stock shareholders and the corresponding book value has been (i) characterized as a preferred stock dividend in the Company’s consolidated statements of operations during the year that the related transaction was completed and (ii) deducted from net income attributable to WCI Communities, Inc. to arrive at net income attributable to common shareholders of WCI Communities, Inc. for purposes of calculating earnings per share. The preferred stock dividend related to the retirement of our Series A preferred stock did not have an impact on our total equity because the liquidating dividend reduced additional paid-in capital by the same amount as the common stock issued in exchange for the Series A preferred stock.
Year Ended December 31, 2013 Compared to the Year Ended December 31, 2012
Homebuilding
| Years Ended December 31, | ||||||||
| 2013 | 2012 | |||||||
| ($ in thousands) | ||||||||
| Homebuilding revenues |
$ | 214,016 | $ | 146,926 | ||||
| Homes delivered |
213,479 | 139,551 | ||||||
| Land and home sites |
537 | 7,375 | ||||||
| Homebuilding gross margin |
64,248 | 46,140 | ||||||
| Homebuilding gross margin percentage |
30.0 | % | 31.4 | % | ||||
| Homes delivered (units) |
493 | 352 | ||||||
| Average selling price per home delivered |
$ | 433 | $ | 396 | ||||
| New orders for homes (units) (1) |
531 | 453 | ||||||
| Contract values of new orders (1) |
$ | 243,196 | $ | 184,381 | ||||
| Average selling price per new order (1) |
458 | 407 | ||||||
| Cancellation rate (2) |
4.7 | % | 3.0 | % | ||||
| Backlog (units) (3) |
293 | 255 | ||||||
| Backlog contract values (3) |
$ | 143,819 | $ | 114,063 | ||||
| Average selling price in backlog (3) |
491 | 447 | ||||||
| Active selling neighborhoods at year-end |
25 | 20 | ||||||
| (1) | New orders represent orders for homes, including the amount (in units) and contract values, net of any cancellations, occurring during the reporting year. |
| (2) | Represents the number of orders canceled during the year divided by the number of gross orders executed during such year (excludes cancellations and gross orders related to customer home site transfers). |
| (3) | Backlog only includes orders for homes at the end of the reporting year that have a binding sales agreement signed by both the homebuyer and us where the home has yet to be delivered to the homebuyer. |
53
Table of Contents
Total homebuilding revenues for the year ended December 31, 2013 were $214.0 million, an increase of $67.1 million, or 45.7%, from $146.9 million for the year ended December 31, 2012. Such increase was primarily due to a 141-unit, or 40.1%, increase in homes delivered and a 9.3% increase in the average selling price of homes delivered. The increase in home deliveries is reflective of the continued ramp up in operations as many of our communities were reopened in 2012 and 2011. Additionally, an improved pricing environment and shifting product mix drove the increase in average selling prices of homes delivered. The improvement in revenues from home deliveries was partially offset by a $6.8 million decrease in land and home site revenues due to no non-core parcel sales during 2013.
Homebuilding gross margin for the year ended December 31, 2013 was $64.2 million, an increase of $18.1 million, from $46.1 million for the year ended December 31, 2012. Homebuilding gross margin as a percent of revenues decreased to 30.0% for the year ended December 31, 2013 from 31.4% for the year ended December 31, 2012, resulting from shifting product mix.
Our homebuilding cost of sales and, therefore, our homebuilding gross margins during the years ended December 31, 2013 and 2012 were favorably impacted by the low book value of our land, which was reset to fair value during September 2009 in accordance with fresh start accounting requirements upon our emergence from bankruptcy (see Note 1 to our audited consolidated financial statements in Item 8 of Part II of this Annual Report on Form 10-K). During 2013 and 2012, all of our home deliveries were generated from communities that we owned in September 2009. The favorable impact of fresh start accounting contributed to a home site cost of sales as a percentage of homes delivered revenues of 14.7% and 13.9% during the years ended December 31, 2013 and 2012, respectively. Fluctuations of the home site cost of sales percentage are primarily due to product mix shifts. Generally, we expect that homes delivered from communities we owned in September 2009 have a gross margin percentage approximately 5% to 10% higher than homes delivered from our more recent land acquisitions.
As of December 31, 2013, approximately 69% of our total owned and controlled home sites, or approximately 5,900 home sites, benefited from being reset to fair value during September 2009. Due to the longer duration of our master-planned communities, we expect to continue to benefit from our favorable land book value for at least the next several years. However, based on the prices of the land we have purchased more recently, and as we acquire and develop land in the future at then-current market prices, we anticipate that the favorable impact of our low book value land on our homebuilding gross margin will lessen in the future. The low carrying value of our land is also a significant driver of our gross margin from homes delivered of 30.0% and 31.5% during the years ended December 31, 2013 and 2012, respectively.
We delivered 493 homes during the year ended December 31, 2013, an increase of 141 units, or 40.1%, from the 352 homes delivered during the year ended December 31, 2012. The increase in deliveries during 2013 was primarily due to a larger backlog at December 31, 2012, compared to the backlog at December 31, 2011, along with having more neighborhoods delivering homes and a greater number of deliveries per neighborhood during 2013 when compared to 2012. Additionally, improved evenflow scheduling was another factor in us generating more deliveries during 2013 compared to 2012. The average selling price per home delivered during 2013 was $433,000, an increase of $37,000, or 9.3%, from $396,000 during 2012. An improved pricing environment and shifting product mix drove the increase in average selling prices of homes delivered.
New orders during the year ended December 31, 2013 were 531 homes, an increase of 78 homes, or 17.2%, from 453 homes during the year ended December 31, 2012. Such increase was primarily due to continued momentum within our active selling neighborhoods, along with an increase in our active selling neighborhood count from 20 at December 31, 2012 to 25 at December 31, 2013. Contract values of new orders during 2013 were $243.2 million, an increase of $58.8 million, or 31.9%, from $184.4 million during 2012, primarily due to the 78-unit increase in new order activity and an improvement in average selling price of new orders to $458,000 during the year ended December 31, 2013 from $407,000 during the year ended December 31, 2012. The increase in our new order average selling prices during 2013 was primarily due to sales mix and strategic price increases as the overall housing market continued to improve.
Our backlog contract value as of December 31, 2013 was $143.8 million, an increase of $29.7 million, or 26.0%, from $114.1 million as of December 31, 2012. An increase in the average selling price of our backlog units from $447,000 to $491,000, or 9.8%, resulted in an increase in the contract values of our backlog at December 31, 2013. Additionally, we had 293 units in backlog as of December 31, 2013, an increase of 38 units, or 14.9%, from 255 units as of December 31, 2012. The increase in backlog was primarily due to continued improvement in the housing market, which was evidenced by our increase in new orders.
54
Table of Contents
Real Estate Services
| Years Ended December 31, | ||||||||
| 2013 | 2012 | |||||||
| ($ in thousands) | ||||||||
| Real estate services revenues |
$ | 80,096 | $ | 73,070 | ||||
| Real estate brokerage |
76,406 | 69,772 | ||||||
| Title services |
3,690 | 3,298 | ||||||
| Real estate services gross margin |
3,124 | 1,395 | ||||||
| Real estate services gross margin percentage |
3.9 | % | 1.9 | % | ||||
| Real estate brokerage closed home sales transactions |
9,028 | 9,070 | ||||||
| Real estate brokerage average home sale selling price |
$ | 268 | $ | 246 | ||||
| Title services closing transactions |
2,544 | 2,395 | ||||||
Real estate services revenues during the year ended December 31, 2013 were $80.1 million, an increase of $7.0 million, or 9.6%, from $73.1 million during the year ended December 31, 2012. The $7.0 million increase was primarily due to a $6.6 million increase in real estate brokerage revenues resulting from an 8.9% increase in average home selling price on consistent year-over-year closed home sale transactions. Flat closed home sales transactions resulted from a shifting mix as lower-priced, distressed inventory was being replaced with higher-priced homes. Additionally, title services revenues increased by $0.4 million during 2013 as a result of a greater number of captured transactions from our company-owned real estate brokerage and our new home deliveries.
Real estate services gross margin during the year ended December 31, 2013 was $3.1 million, an increase of $1.7 million, or 121.4%, from $1.4 million during the year ended December 31, 2012. The $1.7 million increase was primarily due to the margin associated with higher real estate brokerage revenues. Real estate brokerage commissions and other variable costs as a percent of real estate brokerage revenues were 74.3% during the year ended December 31, 2013, an increase of 100 basis points, from 73.3% during the year ended December 31, 2012. Among other things, this increase was due to higher average commission splits being paid to our agents during 2013, primarily resulting from our top performers generating a greater percentage of home sales transactions. As a result of incremental revenues covering a greater portion of the fixed operating costs in our real estate brokerage business, our real estate services gross margin percentage increased to 3.9% during the year ended December 31, 2013 from 1.9% during the year ended December 31, 2012.
Amenities
| Years Ended December 31, | ||||||||
| 2013 | 2012 | |||||||
| (in thousands) | ||||||||
| Revenues |
$ | 23,237 | $ | 21,012 | ||||
| Amenities gross margin |
(2,048 | ) | (3,242 | ) | ||||
Total amenities revenues during the year ended December 31, 2013 were $23.2 million, an increase of $2.2 million, or 10.5%, from $21.0 million during the year ended December 31, 2012. We generated $9.7 million of membership dues during the year ended December 31, 2013, compared to $9.0 million during the year ended December 31, 2012, an increase of $0.7 million. Club operating revenues were $12.3 million during 2013, compared to $10.8 million during 2012, an increase of $1.5 million. The increases in membership dues and club operating revenues were primarily due to a 10% increase in our membership base, which accounted for more food and beverage, golf, tennis, and fitness revenues being generated at our clubs. The membership base increase was driven by both new members from the sale of memberships and marina slips, as well as new members resulting from home deliveries in communities with bundled amenities for which we do not charge an initiation fee. Membership and marina slip sales revenues were consistent at $1.2 million during both the years ended December 31, 2013 and 2012.
Total amenities gross margin during the year ended December 31, 2013 was ($2.0) million, representing an improvement of $1.2 million when compared to ($3.2) million during the year ended December 31, 2012. Such improvement was primarily due to incremental revenues covering a greater portion of the fixed operating and maintenance costs to run our clubs, along with improvements in our variable expenses, such as merchandise and food and beverage costs, as a percent of revenues.
55
Table of Contents
Selling, General and Administrative Expenses
Selling, general and administrative (“SG&A”) expenses were $39.5 million during the year ended December 31, 2013, an increase of $7.4 million, or 23.1%, from $32.1 million during the year ended December 31, 2012. Sales and marketing expenses, which pertain to our homebuilding operations and are comprised of commissions paid to our licensed in-house sales personnel and third-party real estate brokers, direct marketing expenses and sales office expenses, increased $1.6 million, or 11.9%, to $15.0 million during 2013, compared to $13.4 million during 2012. This increase was primarily due to an increase in commissions directly related to our increase in home deliveries, partially offset by a reduction in direct marketing expenses. As a percent of revenues from homes delivered, the related commission expense improved to 3.9% during 2013, compared to 4.4% during 2012. General and administrative expenses increased $5.8 million during the year ended December 31, 2013, compared to the year ended December 31, 2012, primarily due to incremental expense of $4.5 million that we recorded during 2013 related to the stock-based and other long-term incentive compensation plans that we adopted during 2013, along with additional annual compensation expense supporting our growing operations and incremental audit and legal fees as a result of becoming a public company during 2013. As a percent of homebuilding revenues, SG&A expenses declined to 18.5% during 2013 from 21.9% during 2012.
Interest Expense
Interest expense is primarily interest incurred on our debt but not capitalized. Interest expense was $2.5 million during the year ended December 31, 2013, a decrease of $4.5 million, or 64.3%, from $7.0 million during the year ended December 31, 2012. Such decrease was primarily due to a greater portion of our interest incurred being capitalized as a result of increased construction and community development spending and lower effective interest rates on our debt arrangements, partially offset by higher weighted average borrowings during 2013.
Other Income, net
During the years ended December 31, 2013 and 2012, other income was $2.6 million and $7.5 million, respectively. Other income during 2013 included $2.4 million of net recoveries and reductions in certain accruals related to various legal settlements, along with other miscellaneous items, including $0.2 million of interest income. Other income during 2012 included $3.2 million of net recoveries on various settlements, $1.1 million from sales of prepaid impact fees credits, $1.0 million from the return of escrow funds related to a legal reserve, $0.8 million of interest income, $0.7 million from gains on sales of property and equipment and $0.7 million of other miscellaneous items.
Expenses Related to Early Repayment of Debt
During August 2013, we completed the issuance of $200.0 million in aggregate principal amount of our 6.875% Senior Notes due 2021. Among other things, we used $127.0 million of the net proceeds from that offering to voluntarily prepay the entire outstanding principal amount of our Senior Secured Term Notes due 2017, of which $125.0 million in aggregate principal amount was outstanding, at a price equal to 101% of the principal amount, plus accrued and unpaid interest. In connection therewith, we recognized $5.1 million of expenses related to early repayment of debt during 2013, including the abovementioned prepayment premium of $1.2 million and write-offs of unamortized debt discount and deferred financing costs totaling $3.9 million.
During June 2012, we prepaid our senior subordinated secured term loan, which had an outstanding balance of $162.4 million, with the net proceeds from the issuance of our Senior Secured Term Notes due 2017 and $50.0 million of common stock issued to certain of our then-existing shareholders or their affiliates in an equity rights offering. As a result of these transactions, we wrote-off $17.0 million of unamortized debt discount and deferred financing costs associated with our senior subordinated secured term loan, which was recorded as expenses related to early repayment of debt during the year ended December 31, 2012.
See Notes 10 and 14 to our audited consolidated financial statements in Item 8 of Part II of this Annual Report on Form 10-K for further discussion of our debt obligations and equity rights offering, respectively.
Income Taxes
During the years ended December 31, 2013 and 2012, our income tax benefit from continuing operations was $125.7 million and $52.2 million, respectively, which was primarily due to the reversal of (i) $125.6 million of deferred tax asset valuation allowances during 2013 and (ii) $50.5 million of income tax reserves during 2012 that resulted from the successful completion of an audit by the Internal Revenue Service pertaining to the 2003 to 2008 tax years. Additionally, the income tax benefit from continuing operations during 2012 was offset by income tax expense of $1.8 million related to our discontinued operations. As a result of these items, our effective income tax rates for such years are not meaningful because there is no correlation between such rates and the corresponding income (loss) from continuing operations before income taxes. Our income tax provision for both years was otherwise nominal, which was primarily due to changes in our deferred tax asset valuation allowances offsetting any income tax expense. See Note 12 to our audited consolidated financial statements in Item 8 of Part II of this Annual Report on Form 10-K for further discussion of our income taxes.
56
Table of Contents
Discontinued Operations
During the year ended December 31, 2012, certain of our retained and operated amenities, which were characterized as assets held for sale, qualified as discontinued operations. Accordingly, the related results of operations and any gain (loss) on the sale of the underlying asset group are required to be reported separately from continuing operations in our consolidated statements of operations. We had no such amenities or other assets held for sale during the year ended December 31, 2013.
During the year ended December 31, 2012, we sold (i) a sports amenity club for $5.5 million (excluding closing costs) and recorded a pretax profit of $2.3 million and (ii) a sports amenity club for $5.9 million and recorded a pretax profit of $2.0 million. Other than these two dispositions, our 2012 activity pertaining to discontinued operations was nominal. See Note 7 to our audited consolidated financial statements in Item 8 of Part II of this Annual Report on Form 10-K for further discussion of our discontinued operations. As part of our ongoing operating strategy, we will continue to execute on specific exit plans related to our amenities assets, which may include a sale to the related community homeowners’ association or a third-party as such communities and their related amenities mature.
Preferred Stock Dividends
As it pertains to our preferred stock, we (i) exchanged 903,825 shares of our common stock (valued at $19.0 million) for 10,000 outstanding shares of our Series A preferred stock during July 2013 and (ii) paid $0.7 million in cash to purchase the one outstanding share of our Series B preferred stock during April 2013. All such shares of preferred stock, which were carried at a nominal value on our consolidated balance sheets, have been cancelled and retired. In accordance with Accounting Standards Codification 260, Earnings Per Share, paragraph 10-S99-2, any difference between the consideration transferred to our preferred stock shareholders and the corresponding book value has been (i) characterized as a preferred stock dividend in the Company’s consolidated statements of operations during the year that the related transaction was completed and (ii) deducted from net income attributable to WCI Communities, Inc. to arrive at net income attributable to common shareholders of WCI Communities, Inc. for purposes of calculating earnings per share. The preferred stock dividend related to the retirement of our Series A preferred stock did not have an impact on our total equity because the liquidating dividend reduced additional paid-in capital by the same amount as the common stock issued in exchange for the Series A preferred stock.
Liquidity and Capital Resources
Overview
We rely on our ability to finance our operations by generating cash flows, accessing the debt and equity capital markets and independently obtaining letters of credit and surety bonds to finance our projects and provide financial guarantees. Our principal uses of capital are for home construction, land acquisition and development and operating expenses. Our working capital needs depend on proceeds from home deliveries and land and home site sales, fees generated from our Real Estate Services businesses, sales of amenities memberships and related annual dues and club operations. We remain focused on generating positive margins in our Homebuilding operations and acquiring desirable land positions that will keep us positioned for future growth.
Cash flows for each of our communities depend on their stage in the development cycle and can differ substantially from reported earnings. Early stages of development or expansion require significant cash outlays for land acquisitions, entitlements and other approvals, and construction of model homes, roads, utilities, general landscaping and other amenities. Because these costs are a component of our inventory and are not recognized in our consolidated statement of operations until a home is delivered, we incur significant cash outlays prior to our recognition of earnings. In the later stages of community development, cash inflows may significantly exceed earnings reported for financial statement purposes because the cash outflow associated with home and land construction was previously incurred.
We are actively acquiring and developing land in our markets to maintain and grow our supply of home sites. As a result, we expect that cash outlays for land purchases and land development will exceed our cash generated by operating activities. During the year ended December 31, 2014, we generated cash by delivering 644 homes, spent $101.4 million to purchase approximately 2,100 home sites, invested $54.3 million on land development and started construction of 874 homes. The opportunity to purchase substantially finished home sites in desirable locations is becoming increasingly limited and more competitive. As a result, we are spending, and plan to spend more, on land development, as we expect to purchase more undeveloped land and partially finished home sites.
57
Table of Contents
We exercise strict controls, including those related to cash outlays for land and real estate inventory acquisition and development, and we believe that we have a prudent strategy for company-wide cash management. We require multiple party account control and authorization for payments. We competitively bid each phase of the development and construction process and closely manage production schedules and payments. Land acquisition decisions are reviewed and analyzed by our executive management team and are approved by the land committee of our board of directors or our full board of directors, depending on the size of the investment. As of December 31, 2014, we had $174.8 million of cash and cash equivalents, a $38.6 million decrease from December 31, 2013, primarily as a result of our continued investment in land, land development and home construction that is reflected in our increased real estate inventories, partially offset by (i) the cash flow generated by the 644 homes delivered during the year ended December 31, 2014 and (ii) total proceeds of $72.9 million that we received from the issuance of $50.0 million in aggregate principal amount of our 6.875% Senior Notes due 2021 during June 2014 and the sale of certain community development district bonds during April 2014. The 2014 net increase in our real estate inventories of $158.7 million was primarily due to $101.4 million of land acquisitions along with land development and home construction spending within our communities. We intend to generate cash from sales of our real estate inventories but we intend to redeploy the net cash generated from such sales to acquire and develop strategic and well-positioned home sites that represent opportunities to generate desired margins, as well as for other operating purposes.
We intend to employ both debt and equity as part of our ongoing financing strategies, coupled with redeployment of cash flows from operating activities, to provide ourselves with the financial flexibility to access capital on the best terms available. In that regard, we expect to employ prudent levels of leverage to finance the acquisition and development of home sites and the construction of homes. Most recently, our primary sources of liquidity for operations have been cash flow from operations and debt and equity financing. Subject to the covenants contained in the agreements governing our existing indebtedness, we may, from time to time, repurchase or refinance all or a portion of our existing indebtedness and/or access the debt and equity capital markets. We have an effective shelf registration statement on file with the Securities and Exchange Commission that can be used to register offerings of debt and equity securities in the future.
Initial Public Offering and Senior Notes
During 2014 and 2013, we accessed the debt and equity capital markets, which provided us with a long-tenured conservative capital structure with ample liquidity and operational flexibility to support future growth. On July 30, 2013, we completed an initial public offering of our common stock and issued 6,819,091 shares at a price to the public of $15.00 per share, which provided us with $90.3 million of net proceeds after deducting underwriting discounts and offering expenses payable by us. During August 2013, we completed the issuance of our 6.875% Senior Notes due 2021 in the aggregate principal amount of $200.0 million (the “Original 2021 Notes”) at an issue price of 100.0%. The net proceeds from the offering of the Original 2021 Notes (the “Original 2021 Notes Offering”) were $195.5 million after deducting fees and expenses payable by us. We used $127.0 million of the net proceeds from the Original 2021 Notes Offering to voluntarily prepay the entire outstanding principal amount of our Senior Secured Term Notes due 2017, of which $125.0 million in aggregate principal amount was outstanding, at a price equal to 101% of the principal amount, plus accrued and unpaid interest. During June 2014, we completed the issuance of additional 6.875% Senior Notes due 2021 in the aggregate principal amount of $50.0 million (the “Supplemental 2021 Notes”) at an issue price of 102.5%, plus accrued and unpaid interest from February 15, 2014 to June 26, 2014. The net proceeds from the offering of the Supplemental 2021 Notes (the “Supplemental 2021 Notes Offering”), excluding accrued interest of $1.3 million paid to us by the initial holder of the Supplemental 2021 Notes, were $50.4 million after deducting fees and expenses payable by us. We have been using and expect to continue to use the remainder of the net proceeds from the Original 2021 Notes Offering and the net proceeds from the Supplemental 2021 Notes Offering for general corporate purposes, including the acquisition and development of land and home construction.
After giving effect to these recent capital market transactions and based on our current operations and anticipated growth, we believe that we can meet our cash requirements for the year ending December 31, 2015 with existing cash and cash equivalents and cash flow from operating activities (including sales of homes and land). To a large extent, though, our ability to generate cash flow from operating activities is subject to general economic, financial, competitive, legislative and regulatory factors, as well as other factors that are beyond our control. We can provide no assurances that our business will generate cash flow from operating activities in an amount sufficient to enable us to fund our liquidity needs. Further, our capital requirements may vary materially from those currently planned if, for example, our revenues do not reach expected levels or we incur unforeseen capital expenditures and/or make investments to maintain our competitive position. Accordingly, as necessary, we may seek alternative financing, such as selling additional debt or equity securities or divesting assets or operations. We can provide no assurances that we will be able to consummate any such transactions on favorable terms, if at all. Any inability to generate sufficient cash flow, refinance our debt or incur additional debt on favorable terms could adversely affect our financial condition and could cause us to be unable to service our debt and may delay or prevent the expansion of our business or otherwise require us to forego market opportunities. For further discussion of certain financing and other related risks facing our business and operations, see “Risk Factors—Risks Related to Our Indebtedness—We may need additional financing to fund our operations or expand our business and if we are unable to obtain sufficient financing or such financing is obtained on adverse terms, we may not be able to operate or expand our business as planned, which could adversely affect our results of operations and future growth.” in Item 1A of Part I of this Annual Report on Form 10-K.
58
Table of Contents
We intend to maintain adequate liquidity and a strong balance sheet and we will continue to evaluate opportunities to access the debt and equity capital markets as they become available. If deemed appropriate, we will use our effective shelf registration statement on file with the Securities and Exchange Commission to register offerings of debt and/or equity securities in the future.
Revolving Credit Arrangements
On August 27, 2013, we entered into a four-year senior unsecured revolving credit facility that allows us to borrow up to $75.0 million on a revolving basis, of which up to $50.0 million may be used for letters of credit. The commitment under such revolving credit facility is limited by a borrowing base calculation based on certain asset values as set forth in the underlying loan agreement. As of February 25, 2015, there were no amounts drawn on the revolving credit facility or any limitations on our borrowing capacity thereunder, leaving the full amount available to us on such date.
During February 2013, WCI and WCI Communities, LLC (collectively, the “WCI Parties”) entered into a five-year $10.0 million secured senior loan with Stonegate Bank (the “Stonegate Loan”). During its initial 36 months, the loan is structured as a revolving credit facility. During the subsequent 24 months, the loan converts to a term loan with principal and interest to be paid monthly. During the initial 36 months of the loan, the WCI Parties also have the ability to request standby letters of credit up to an aggregate amount of $5.0 million at any given time. Each outstanding letter of credit will correspondingly reduce the availability under the revolving credit facility. As of February 25, 2015, there were no amounts drawn on the Stonegate Loan; however, $2.0 million of letters of credit have been issued thereunder on such date, limiting the borrowing capacity to $8.0 million.
For a detailed description of our revolving credit arrangements, see Note 10 to our audited consolidated financial statements in Item 8 of Part II of this Annual Report on Form 10-K.
Letters of Credit and Surety Bonds
We use letters of credit and surety bonds (performance and financial) to guarantee our performance under various land development and construction agreements, land purchase obligations, escrow agreements, financial guarantees and other arrangements. As of December 31, 2014, we had $2.3 million of outstanding letters of credit. Performance bonds do not have stated expiration dates; rather, we are released from the bonds as the contractual performance is completed. Our performance and financial bonds, which totaled $37.7 million as of December 31, 2014, are typically outstanding over a period of approximately one to five years or longer, depending on, among other things, the pace of development. Our estimated exposure on the outstanding performance and financial bonds as of December 31, 2014 was $21.7 million, primarily based on development remaining to be completed. If banks were to decline to issue letters of credit or surety companies were to decline to issue performance and financial bonds, our ability to operate could be significantly restricted and that circumstance could have an adverse effect on our business, liquidity and results of operations. Information about risk factors that have the potential to affect us is contained under the caption “Risk Factors” in Item 1A of Part I of this Annual Report on Form 10-K.
Cash Flows
We intend to use our available liquidity, which includes our cash and cash equivalents and, if necessary, borrowings under our revolving credit arrangements, for general corporate purposes, including the acquisition and development of land and home construction. The table below summarizes our cash flows as reported in our audited consolidated statements of cash flows in Item 8 of Part II of this Annual Report on Form 10-K.
| Years Ended December 31, | ||||||||||||
| 2014 | 2013 | 2012 | ||||||||||
| (in thousands) | ||||||||||||
| Sources (uses) of cash and cash equivalents: |
||||||||||||
| Net cash provided by (used in) operating activities |
$ | (105,925 | ) | $ | (22,581 | ) | $ | 22,014 | ||||
| Net cash provided by (used in) investing activities |
(2,977 | ) | (1,977 | ) | 11,605 | |||||||
| Net cash provided by financing activities |
70,306 | 156,816 | 4,125 | |||||||||
|
|
|
|
|
|
|
|||||||
| Net increase (decrease) in cash and cash equivalents |
(38,596 | ) | 132,258 | 37,744 | ||||||||
| Cash and cash equivalents at the beginning of the year |
213,352 | 81,094 | 43,350 | |||||||||
|
|
|
|
|
|
|
|||||||
| Cash and cash equivalents at the end of the year |
$ | 174,756 | $ | 213,352 | $ | 81,094 | ||||||
|
|
|
|
|
|
|
|||||||
59
Table of Contents
Operating Activities
During the years ended December 31, 2014 and 2013, net cash used in operating activities was $105.9 million and $22.6 million, respectively. The $83.3 million increase in net cash used in operating activities during 2014 was primarily due to: (i) a $60.1 million net increase in real estate inventories activity, which amount includes year-over-year increased expenditures for land acquisition ($30.7 million), land development ($29.9 million) and home construction ($74.4 million), partially offset by higher homebuilding cost of sales during 2014; (ii) the receipt of a $16.8 million federal income tax refund during 2013, compared to $0.2 million of federal income tax payments during 2014; and (iii) a $15.7 million unfavorable change in other assets and liabilities. Such increases in cash used in operating activities were partially offset by a $9.9 million improvement in net income during 2014 after giving effect to certain non-cash adjustments and the expenses related to early repayment of debt during 2013.
During the year ended December 31, 2013, net cash used in operating activities was $22.6 million, compared to net cash provided by operating activities of $22.0 million during the year ended December 31, 2012. The $44.6 million increase in net cash used in operating activities during 2013 was primarily due to a $75.1 million net increase in real estate inventories activity, which amount includes year-over-year increased expenditures for land acquisition ($67.7 million), land development ($8.8 million) and home construction ($34.9 million), partially offset by higher homebuilding cost of sales during 2013. Such 2013 increase in cash used in operating activities was partially offset by: (i) a $10.4 million improvement in net income after giving effect to certain non-cash adjustments; (ii) receipt of a $16.8 million federal income tax refund; and (iii) a $2.6 million favorable change in other assets and liabilities.
Investing Activities
Net cash used in investing activities during the years ended December 31, 2014 and 2013 was $3.0 million and $2.0 million, respectively, compared to net cash provided by investing activities of $11.6 million during the year ended December 31, 2012. Additions to property and equipment were the Company’s only investing activity during 2014. During 2013, we had $2.6 million of additions to property and equipment, which was partially offset by a $0.6 million distribution of capital from an unconsolidated joint venture. During 2012, we received: (i) $10.1 million in proceeds from the sales of discontinued operations as we divested our legacy non-core amenities assets; (ii) a $1.9 million distribution of capital from an unconsolidated joint venture; and (iii) $0.7 million of proceeds from sales of property and equipment. These items were partially offset by $1.1 million of additions to property and equipment during 2012.
Financing Activities
Net cash provided by financing activities was $70.3 million, $156.8 million and $4.1 million during the years ended December 31, 2014, 2013 and 2012, respectively. Net cash provided by financing activities during 2014 consisted of proceeds of (i) $51.2 million from our issuance of the Supplemental 2021 Notes ($50.0 million in aggregate principal amount at an issue price of 102.5%) and (ii) $21.7 million that we received from the sale of certain community development district bonds. Those cash receipts were partially offset by: (i) payments of $1.2 million for debt issuance costs; (ii) payments of $1.2 million on community development district obligations; (iii) payments of $0.3 million to acquire treasury stock to facilitate income tax withholding payments on behalf of certain officers and employees of the Company who had stock-based compensation awards that vested during 2014; and (iv) a distribution of $0.1 million to noncontrolling interests in one of the Company’s joint ventures.
Net cash provided by financing activities during 2013 consisted of the proceeds from our issuance of (i) the Original 2021 Notes ($200.0 million in aggregate principal amount at an issue price of 100.0%) and (ii) 6,819,091 shares of common stock during our initial public offering (net proceeds of $90.3 million after deducting underwriting discounts and offering expenses payable by us). Those items were partially offset by: (i) the repayment of our Senior Secured Term Notes due 2017 ($126.3 million); (ii) payments of $5.7 million for debt issuance costs; (iii) payments of $0.8 million on community development district obligations; and (iv) a $0.7 million payment to purchase the one outstanding share of the Company’s Series B preferred stock.
Net cash provided by financing activities during 2012 primarily consisted of the proceeds from (i) the issuance of our Senior Secured Term Notes due 2017 in the aggregate principal amount of $125.0 million, net of a $2.5 million discount, and $50.0 million of our common stock, net of $1.7 million of issuance costs, and (ii) the exercise of $0.5 million in stock options. Those items were partially offset by: (i) the repayment of $162.4 million on our senior subordinated secured term loan; (ii) payments of $3.5 million for debt issuance costs; and (iii) payments of $1.2 million on community development district obligations.
60
Table of Contents
Off-Balance Sheet Arrangements and Contractual Obligations
We selectively enter into business relationships in the form of partnerships and joint ventures with unrelated parties. These partnerships and joint ventures are used to acquire, develop, market and operate homebuilding, amenities and real estate projects. In connection with the operation of these partnerships and joint ventures, the partners may agree to make additional cash contributions to the partnerships pursuant to the partnership agreements. We believe that future contributions, if required, will not have a significant impact on our liquidity or financial condition. Should we fail to make required contributions, if any, we may lose some or all of our interest in such partnerships or joint ventures.
In the normal course of business, we may enter into contractual arrangements to acquire developed and/or undeveloped land parcels and home sites. We are subject to customary obligations associated with entering into contracts for the purchase of land and improved home sites. These purchase contracts typically require a cash deposit and the purchase of properties under these contracts is generally contingent on the satisfaction of certain requirements by the sellers, including obtaining applicable property and development entitlements. We also use option contracts with land sellers as a method of acquiring land in staged takedowns to help us manage the financial and market risk associated with land holdings and to reduce the use of funds from our available financing sources. Option contracts generally require a non-refundable deposit for the right to acquire home sites over a specified period of time at pre-determined prices. We generally have the right, at our sole discretion, to terminate our obligations under both purchase and option contracts by forfeiting our cash deposit with no further financial responsibility to the land seller. As of December 31, 2014, the remaining aggregate purchase price under land purchase contracts, net of deposits and other related payments, was approximately $59.6 million, which controlled approximately 4,100 planned home sites. As of such date, we had made non-refundable deposits aggregating $0.3 million for those contracts. There can be no assurances that we will acquire any of the land under contract on the terms or within the timing anticipated, or at all. For further discussion of certain risks related to the Company’s land acquisitions, see “Risk Factors—Risks Related to Our Business—We may not be successful in our efforts to identify, complete or integrate acquisitions, which could adversely affect our results of operations and future growth.” in Item 1A of Part I of this Annual Report on Form 10-K.
Our utilization of land option contracts is dependent on, among other things, the availability and willingness of sellers to enter into option takedown arrangements, the availability of capital to financial intermediaries to finance the development of optioned home sites, general housing market conditions and local market dynamics. Options may be more difficult to procure from land sellers in strong housing markets.
As of December 31, 2014, contractual obligations for the next five years and thereafter, including principal and interest on our debt obligations, are summarized in the table below. We excluded $40.0 million of community development district obligations from the table because of the uncertainty of the amounts that will ultimately be paid by us and the timing of any such payments. For a detailed description of such obligations, see below and Note 9 to our audited consolidated financial statements in Item 8 of Part II of this Annual Report on Form 10-K.
| Payments Due During the Periods Indicated | ||||||||||||||||||||
| Less Than 1 Year |
1 to 3 Years | 3 to 5 Years | Thereafter | Totals | ||||||||||||||||
| (in thousands) | ||||||||||||||||||||
| Operating leases (1) |
$ | 5,653 | $ | 5,128 | $ | 2,172 | $ | 442 | $ | 13,395 | ||||||||||
| Capital leases |
274 | 499 | 117 | — | 890 | |||||||||||||||
| Senior Notes due 2021 (2) |
17,188 | 34,375 | 34,375 | 284,375 | 370,313 | |||||||||||||||
| Land purchase obligations (3) |
6,552 | 53,006 | — | — | 59,558 | |||||||||||||||
|
|
|
|
|
|
|
|
|
|
|
|||||||||||
| Totals |
$ | 29,667 | $ | 93,008 | $ | 36,664 | $ | 284,817 | $ | 444,156 | ||||||||||
|
|
|
|
|
|
|
|
|
|
|
|||||||||||
| (1) | For a detailed description of our operating leases, see Note 13 to our audited consolidated financial statements in Item 8 of Part II of this Annual Report on Form 10-K. |
| (2) | As of December 31, 2014, our 6.875% Senior Notes due 2021 represented our only outstanding long-term debt obligation. Contractual interest and principal payments over the term of such debt arrangement are included in the above table. For a detailed description of our 6.875% Senior Notes due 2021, see Note 10 to our audited consolidated financial statements in Item 8 of Part II of this Annual Report on Form 10-K. |
| (3) | The amount in the above table represents the remaining aggregate purchase price under land purchase contracts, net of deposits and other related payments, as of December 31, 2014. |
As of December 31, 2014, we had no outstanding borrowings under our variable-rate debt arrangements. Moreover, as of such date, we did not have any off-balance sheet arrangements, other than the letters of credit and surety bonds discussed in Note 13 to our audited consolidated financial statements in Item 8 of Part II of this Annual Report on Form 10-K.
61
Table of Contents
Community Development District or Similar Development Authority (“CDD”) Obligations
In connection with the development of certain of our communities, community development or improvement districts may use bond financing to fund construction or acquisition of certain on-site and off-site infrastructure improvements at or near those communities. We utilize two primary types of bonds issued by the district, type “A” and “B,” which are used to reimburse us for construction or acquisition of certain infrastructure improvements. The “A” bond is the portion of a bond offering that is ultimately intended to be assumed by the end-user (homeowner) and the “B” bond is our obligation. The obligation to pay principal and interest on the bonds issued by the districts is assigned to each parcel within the district and the district has a lien on each parcel at the time the district adopts its fees and assessments for the applicable fiscal year. If the owner of the parcel does not pay this obligation, the district can foreclose on the lien. The bonds, including interest and redemption premiums, if any, and the associated lien on the property are typically payable, secured and satisfied by revenues, fees or assessments levied on the property benefited. The total amount of community development district and improvement district bond obligations issued and outstanding with respect to our communities was $68.4 million and $33.0 million as of December 31, 2014 and 2013, respectively. Bond obligations as of December 31, 2014 mature at various times during the years 2018 through 2039. As of December 31, 2014 and 2013, we recorded CDD bond obligations of $40.0 million and $7.3 million, respectively, net of debt discounts of $2.4 million and $1.4 million, respectively, which represented the estimated amount of bond obligations that we may be required to pay based on our proportionate share of property owned within our communities. For a detailed description of our CDD obligations, see Note 9 to our audited consolidated financial statements in Item 8 of Part II of this Annual Report on Form 10-K.
During April 2013, we acquired property, which was secured by an existing CDD obligation, and the related $24.0 million of CDD bonds issued and outstanding. Through April 15, 2014, we were both an owner of property subject to a CDD obligation as well as the holder of the related CDD bonds. In accordance with Accounting Standards Codification Subtopic 405-20, Extinguishments of Liabilities, we accounted for the CDD obligation as a debt extinguishment to the extent of our obligation to repay the related CDD bond obligations. As a result, $23.6 million of the $24.0 million CDD obligation, which related to the property owned by us, was not recorded as a CDD obligation on our consolidated balance sheets prior to April 16, 2014. On such date, we sold $23.6 million of the aforementioned CDD bonds and received proceeds, including accrued and unpaid interest, of $22.7 million. The scheduled debt service payment on May 1, 2014 satisfied all of the other CDD bonds previously held by us. Accordingly, we are no longer the holder of any such CDD bonds. As a result of these transactions, the Company’s CDD obligations increased by $21.7 million during the year ended December 31, 2014, which represented our discounted proportionate share of the outstanding CDD bonds.
Inflation and Mortgage Interest Rates
We and the homebuilding industry may be adversely affected by inflation, primarily as it relates to increased costs to finance our land acquisitions, make land improvements, purchase raw materials and pay subcontractor labor. If we are unable to recover these increased costs through higher selling prices to homebuyers, our gross margins could be adversely impacted. Because the selling prices of our homes in backlog are fixed at the time a buyer enters into a contract to acquire a home, any inflation in raw material and labor costs that are greater than those anticipated may result in lower gross margins. Over the past three years, the impact of inflation has not been material to our results of operations.
Increases in home mortgage interest rates may also make it more difficult for our buyers to qualify for home mortgage loans, potentially decreasing our home sales.
Seasonality
We have historically experienced, and in the future expect to continue to experience, variability in our operating results on a quarterly basis in each of our three operating segments. Because many of our Florida homebuyers prefer to close on their new home purchases before the winter, the fourth quarter of each calendar year often produces a disproportionately large portion of our annual Homebuilding revenues, income and cash flows. Activity in our realty brokerage operations is greater during the spring and summer months as (i) buyers with families generally move when their children are out of school and (ii) Florida’s seasonal residents tend to make resale home purchases prior to leaving for the summer. These factors typically result in a larger portion of Real Estate Services revenues, income and cash flows during the second and third quarters of each calendar year. In addition, many of our club members spend the winter months in Florida, thereby producing a disproportionately large portion of our annual Amenities revenues and cash flows during that time period. Accordingly, revenues and operating results for our three operating segments may fluctuate significantly on a quarterly basis and we must maintain sufficient liquidity to meet short-term operating requirements.
As a result of seasonal activity, our results of operations during any given quarter are not necessarily representative of the results that we expect for the full calendar year or subsequent quarterly reporting periods. We expect these seasonal patterns to continue, although they may be affected by economic conditions in the homebuilding and real estate industry and other interrelated factors.
62
Table of Contents
In contrast to our typical seasonal results, weakness in U.S. homebuilding market conditions during recent years has mitigated our historical seasonal variations. Although we may experience our typical historical seasonal pattern in the future, we can make no assurances as to when or whether this pattern will recur. See “Risk Factors—Risks Related to Our Business—Our quarterly operating results may fluctuate because of the seasonal nature of our business and other factors.” in Item 1A of Part I of this Annual Report on Form 10-K.
Critical Accounting Policies and Estimates
A comprehensive enumeration of our significant accounting policies is presented in Note 2 to our audited consolidated financial statements in Item 8 of Part II of this Annual Report on Form 10-K. Our discussion and analysis of the financial condition and results of operations of the Company are based on its consolidated financial statements, which have been prepared in conformity with U.S. generally accepted accounting principles (“GAAP”). The preparation of financial statements in conformity with GAAP requires management to make estimates and assumptions that affect the reported amounts of assets and liabilities at the date of the consolidated financial statements and the reported amounts of revenues and expenses during the reporting periods. Management bases its estimates and judgments on historical experience and various other factors that are believed to be reasonable under the circumstances, the results of which form the basis for making determinations about the carrying value of assets and liabilities that are not readily apparent from other sources. Management evaluates such estimates and judgments on an ongoing basis and makes changes and modifications as deemed necessary. Actual results could significantly differ from those estimates and judgments if conditions in the future are different than initially anticipated. Moreover, using different assumptions, projections and forecasts in our critical accounting estimates could have a material impact on our consolidated financial statements. See “Cautionary Note Regarding Forward-Looking Statements” included elsewhere in this Annual Report on Form 10-K. We consider the critical accounting policies described below to be those that require management to make significant estimates and judgments when preparing the Company’s consolidated financial statements.
Real Estate Inventories and Capitalized Interest
Real estate inventories consist of land and land improvements, homes under construction or completed and investments in amenities. Total land and common development costs are apportioned to each home, lot, amenity or parcel using the relative sales value method, while site-specific development costs are allocated directly to the benefited land. Investments in amenities include costs associated with the construction of clubhouses, golf courses, marinas, tennis courts and various other recreational facilities, which we intend to recover through equity membership and marina slip sales.
All of our real estate inventories are reviewed for recoverability on a quarterly basis, as our inventory is considered “long-lived” in accordance with Accounting Standards Codification (“ASC”) 360, Property, Plant, and Equipment (“ASC 360”). Impairment charges are recorded to write down an asset to its estimated fair value if the undiscounted cash flows expected to be generated by the asset are lower than its carrying amount. Our determination of fair value is based on projections and estimates. Changes in these expectations may lead to a change in the outcome of our impairment analysis and actual results may also differ from our assumptions. Each community, land parcel or amenity asset is evaluated individually. For those assets deemed to be impaired, the recognized impairment is measured as the amount by which the assets’ carrying amount exceeds their fair value. Further discussion of asset impairments is included in Note 5 to our audited consolidated financial statements in Item 8 of this Annual Report on Form 10-K.
We construct amenities in conjunction with the development of certain planned communities and account for the related costs in accordance with ASC 330, Inventories. Our amenities are transferred to common interest realty associations (“CIRAs”), sold as equity membership clubs, sold separately or retained and operated by us. The cost of amenities conveyed to a CIRA is classified as a common cost of the community and included in real estate inventories. This cost is allocated to cost of sales on the basis of the relative sales value of the homes sold. The cost of amenities sold as equity membership clubs is included in real estate inventories, classified as investments in amenities (Note 3 to our audited consolidated financial statements in Item 8 of this Annual Report on Form 10-K). Costs of amenities retained and operated by us are accounted for as property and equipment.
In accordance with ASC 835, Interest, interest incurred relating to land under development and construction of homes is capitalized to real estate inventories during the active development period. For homes under construction, we include the underlying developed land costs and in-process homebuilding costs in our determination of capitalized interest. Capitalization ceases upon substantial completion of a home, with the related capitalized interest being charged to cost of sales when the home is delivered.
Interest incurred relating to the construction of amenities is capitalized to real estate inventories for equity membership clubs or property and equipment for clubs to be retained and operated by us. Interest capitalized to real estate inventories is charged to cost of sales as related homes, home sites, amenity memberships and parcels are delivered. Interest capitalized to property and equipment is depreciated using the straight-line method over the estimated useful lives of the related assets.
63
Table of Contents
Property and Equipment
Included in property and equipment are recreational amenity assets that are considered held and used. With respect to these assets, if events or changes in circumstances, such as a significant decline in membership or membership pricing, significant increases in operating costs or changes in use, indicate that their carrying values may be impaired, an impairment analysis is performed in accordance with ASC 360. Our analysis consists of determining whether an asset’s carrying amount will be recovered from its undiscounted estimated future cash flows, including estimated residual cash flows such as the sale of the asset. These cash flows are estimated based on various assumptions that are subject to economic and market uncertainties, including, among other things, demand for golf memberships, competition within the market, changes in membership pricing and costs to operate each property. If the carrying amount of an asset exceeds the sum of its undiscounted future operating and residual cash flows, an impairment charge is recorded for the difference between the estimated fair value of the asset and its net carrying amount. We estimate the fair value of an asset by using discounted cash flow analyses. There were no impairment charges recorded during the years ended December 31, 2014, 2013 and 2012 related to property and equipment.
Goodwill
Goodwill represents the excess of the estimated fair value of a business over its identifiable tangible and intangible net assets. ASC 350, Intangibles—Goodwill and Other (“ASC 350”), provides guidance on accounting for intangible assets. Among other things, ASC 350 eliminates the amortization of goodwill for companies that meet the prescribed definition of a public business entity. Pursuant to the provisions of ASC 350, goodwill is tested for impairment, at a minimum, once a year. Evaluating goodwill for impairment is a two-step process that involves the determination of the fair values and the carrying values of reporting units that have goodwill. A reporting unit is a component of an operating segment for which discrete financial information is available and reviewed by management on a regular basis. All of our goodwill pertains to reporting units under our real estate services operating segment.
Pursuant to the provisions of ASC 350, as amended, entities have the option of performing a qualitative assessment before calculating the fair value of a reporting unit when testing goodwill for impairment. If the fair value of the reporting unit is determined, based on qualitative factors, to be “more-likely-than-not” less than the carrying amount of the reporting unit, then the two-step goodwill impairment test must be performed.
Certain estimates and judgments are inherent in our determination of the fair value of a reporting unit, including the interpretation of current economic indicators and market valuations, as well as strategic plans with regard to our operations. We typically use a revenue or income approach to determine the estimated fair values of our reporting units when performing our goodwill impairment test. The income approach establishes fair value by methods that discount or capitalize revenues, earnings and/or cash flows using a discount or capitalization rate that reflects market rate of return expectations, market conditions and the risks of the relative investment. If the estimated fair value of a reporting unit is less than its carrying value, then the second step of the goodwill impairment test is performed to measure the amount of the impairment charge, if any. The impairment charge is determined by comparing the implied fair value of the reporting unit’s goodwill to the corresponding carrying value. The implied fair value of goodwill represents the excess of the fair value of the reporting unit over amounts assigned to its net assets.
We review goodwill annually (or whenever qualitative indicators of impairment exist) for impairment. There were no goodwill impairment charges recorded during the years ended December 31, 2014, 2013 and 2012.
Warranty Reserves
We generally provide our single- and multi-family homebuyers with a limited one to three-year warranty, respectively, for all material and labor and a 10-year warranty for certain structural defects. Warranty reserves have been established by charging cost of sales and crediting a warranty liability for each home delivered. The amounts charged are estimated by management to be adequate to cover expected warranty-related costs for all unexpired warranty obligation periods. Our warranty reserves are based on historical warranty cost experience and are adjusted, as appropriate, to reflect qualitative risks associated with the homes constructed. Our actual costs and expenditures under our various warranty programs could significantly differ from the estimates used to estimate the warranty reserves that have been recorded in the Company’s consolidated balance sheets (Note 8 to our audited consolidated financial statements in Item 8 of this Annual Report on Form 10-K).
Revenue and Profit Recognition
Homebuilding revenues and related profits are recognized in accordance with ASC 360 at the time of delivery under the full accrual method for single- and multi-family homes. Under the full accrual method, revenues and related profits are recognized when collectability of the sales price is reasonably assured and the earnings process is substantially complete. When a sale does not meet the requirements for income recognition, profit is deferred until such requirements are met and the related sold inventory is classified as completed inventory.
64
Table of Contents
Real estate services revenues, which include real estate brokerage and title services operations, are recognized upon the closing of a sales contract.
Revenues from amenity operations include the sale of equity memberships and marina slips, nonequity memberships, membership dues and fees for services provided. Equity memberships entitle buyers to a future ownership interest in the amenity facility upon turnover of the club to the membership in addition to the right to use the facilities in accordance with the terms of the membership agreement. Nonequity memberships only entitle buyers with the right to use the amenity facilities in accordance with the terms of the membership agreement. Equity membership and marina slip sales are recognized at the time of closing. Equity membership sales and the related cost of sales are initially recorded under the deposit or cost recovery method. Revenue recognition for each equity club program is reevaluated on a periodic basis based on changes in circumstances. If we can demonstrate that it is likely that we will recover proceeds in excess of the remaining carrying value and no material contingencies exist, such as a developer rescission clause, the full accrual method is then applied. Nonrefundable nonequity memberships entitle buyers to the right to use the respective amenity facility over its useful life and are sold separately from homes within our communities. Nonequity membership initiation fees are deferred and amortized to amenities revenues over 20 years, representing the membership period, which is based on the estimated average depreciable life of the amenities facilities. This treatment most closely matches revenues with the expenses of operating the club over the membership period. Both equity and nonequity memberships require members to pay membership dues that are billed in advance on either an annual or quarterly basis and are recorded as deferred revenue and then recognized as revenues ratably over the term of the membership period. Revenues for services are recorded when the service is provided.
Revenues and profits from land sales, which are included in homebuilding revenues and gross margin, respectively, in the Company’s consolidated statements of operations, are recognized at the time of closing. Revenues and related profits are recognized in full when collectability of the sales price is reasonably assured and the earnings process is substantially complete. When a sale does not meet the requirements for income recognition, profit is deferred under the deposit method and the related inventory is classified as completed inventory. The deferred income is recognized when our involvement is completed.
Sales incentives, such as reductions in listed sales prices of homes, golf club memberships and marina slips, are treated as a reduction of revenues. Sales incentives, such as free products or services, are classified as cost of sales.
Also, see below under “Recently Issued Accounting Pronouncement” for certain related accounting guidance that the Company will be required to adopt during the year ending December 31, 2017 and interim reporting periods during that year.
Home Cost of Sales
Cost of home deliveries includes direct home construction costs, land acquisition, land development and related costs, both incurred and estimated to be incurred, warranty costs, closing costs, development period interest and other common costs. We use the specific identification method for the purpose of accumulating home construction costs. Land acquisition and land development costs are allocated to each home site within a subdivision based on the relative fair values of the home sites prior to home construction. We recognize all home cost of sales when a home is delivered on a house-by-house basis.
Real Estate Brokerage Cost of Sales
Real estate brokerage revenues primarily consist of the gross commission income that we receive on real estate transactions for which we acted as the broker. We pay a portion of the commission received to the independent real estate agents that work with our real estate brokerage operations. These commissions are a direct cost of real estate brokerage revenues and are included in real estate services cost of sales in the Company’s consolidated statements of operations. Real estate services cost of sales also includes overhead costs associated with the Company’s realty brokerage and title services businesses.
Amenities Cost of Sales
Amenities cost of sales consists of: (i) allocated costs associated with the construction of clubhouses, golf courses, marinas and various other recreational facilities related to the sale of equity memberships and marina slips; (ii) direct costs of food, beverage and merchandise sold; and (iii) overhead associated with club and marina operations.
Income Taxes
We account for income taxes in accordance with ASC 740, Income Taxes (“ASC 740”), which requires the recognition of income taxes currently payable or receivable, as well as deferred tax assets and liabilities resulting from temporary differences between the amounts reported for financial statement purposes and the amounts reported for income tax purposes at each balance sheet date using enacted statutory tax rates for the years in which taxes are expected to be paid, recovered or settled. Changes in tax rates are recognized in earnings in the period in which the changes are enacted.
65
Table of Contents
ASC 740 requires that companies assess whether deferred tax asset valuation allowances should be established based on consideration of all of the available evidence using a “more-likely-than-not” standard. A valuation allowance must be established when it is more-likely-than-not that some or all of a company’s deferred tax assets will not be realized. We assess our deferred tax assets on a quarterly basis to determine if valuation allowances are required. When making a determination as to the adequacy of our deferred tax asset valuation allowance, we consider all of the available objectively verifiable positive and negative evidence, including, among other things, whether the Company is in a cumulative loss position, projected future taxable income by taxing jurisdiction, statutory limitations on the Company’s tax carryforwards and credits, tax planning strategies, recent financial operations, scheduled reversals of deferred tax liabilities, and the macroeconomic environment and the homebuilding industry. If we determine that the Company will not be able to realize some or all of its deferred tax assets in the future, a valuation allowance will be recorded through the provision for income taxes.
Significant judgment is applied in assessing whether deferred tax assets will be realized in the future. Ultimately, such realization depends on the existence of sufficient taxable income in the appropriate taxing jurisdiction in either the carryback or carryforward periods under existing tax laws. Forming a conclusion that a valuation allowance is not needed is difficult when there is negative evidence such as cumulative losses in recent years. In that circumstance, our valuation assessment emphasizes, among other things, the nature, frequency and magnitude of current and cumulative income and losses, forecasts of future profitability, the duration of statutory carryback or carryforward periods, our experience with net operating loss and tax credit carryforwards being used before their expiration and, if necessary, tax planning alternatives. Our assessment of the need for a deferred tax asset valuation allowance also includes assessing the likely future tax consequences of events that have been recognized in the Company’s consolidated financial statements and its tax returns. Changes in existing tax laws or rates could affect our actual tax results and future business results may affect the amount of the Company’s deferred tax liabilities or the deferred tax asset valuation allowance. Our accounting for deferred tax assets represents our best estimate of future events. Due to uncertainties in the estimation process, particularly with respect to changes in facts and circumstances in future reporting periods, including carryforward period assumptions, actual results could differ from our estimates. Our assumptions require significant judgment because the homebuilding industry is cyclical and highly sensitive to changes in economic conditions. If the Company’s future results of operations are less than projected or if the timing and jurisdiction of its future taxable income varies from our estimates, there may be insufficient objectively verifiable positive evidence to support a more-likely-than-not assessment of the Company’s deferred tax assets and an increase in our valuation allowance may be required at that time for some or all of such deferred tax assets.
ASC 740 defines the methodology for recognizing the benefits of tax return positions as well as guidance regarding the measurement of the resulting tax benefits. ASC 740 requires an enterprise to recognize the financial statement effects of a tax position when it is “more-likely-than-not” (defined as a likelihood of more than 50%), based solely on the technical merits, that the position will be sustained upon examination. A tax position that meets the more-likely-than-not recognition threshold is measured to determine the amount of benefit to be recognized in the financial statements based on the largest amount of benefit that is greater than 50% likely of being realized upon ultimate settlement with a taxing authority that has full knowledge of all relevant information. If a tax position does not meet the more-likely-than-not recognition threshold, despite our belief that its filing position is supportable, the benefit of that tax position is not recognized in the Company’s consolidated financial statements and we are required to accrue potential interest and penalties until the uncertainty is resolved. The evaluation of whether a tax position meets the more-likely-than-not recognition threshold requires a substantial degree of judgment by us based on the individual facts and circumstances. Actual results could differ from our estimates. ASC 740 also provides guidance for income tax accounting regarding derecognition, classification, interest and penalties, accounting in interim periods, disclosure and transition.
Recently Issued Accounting Pronouncement
On May 28, 2014, the Financial Accounting Standards Board issued Accounting Standards Update 2014-09, Revenue from Contracts with Customers (“ASU 2014-09”). Among other things, ASU 2014-09 outlines a framework for a single comprehensive model that entities can use when accounting for revenue and supersedes most current revenue recognition guidance, including that which pertains to specific industries such as homebuilding (e.g., sales of real estate, etc.). The core principle of ASU 2014-09 is that an entity should recognize revenue to depict the transfer of promised goods or services in an amount that reflects the consideration to which the entity expects to be entitled in exchange for such goods and services. ASU 2014-09 also requires expanded quantitative and qualitative disclosures that will enable the users of an entity’s financial statements to understand the nature, amount, timing and uncertainty of revenue and cash flows arising from contracts with customers. Public entities are required to adopt ASU 2014-09 during annual reporting periods beginning after December 15, 2016 and interim reporting periods during the year of adoption. An entity may adopt ASU 2014-09 using either a full retrospective approach for each prior reporting period presented or a modified retrospective approach. Under the latter approach an entity will (i) recognize the cumulative effect of initially applying ASU 2014-09 as an adjustment to the opening balance of its retained earnings or accumulated deficit during the annual reporting period that includes the date of initial application of ASU 2014-09 and (ii) provide certain supplemental disclosures during reporting periods that include the date of initial application of ASU 2014-09. Early adoption of ASU 2014-09 is not permitted by public entities. Due to the recent issuance of the new accounting and disclosure guidance under ASU 2014-09 and the complex analyses required thereunder, we have not yet determined the impact thereof on our consolidated financial statements or the method of adoption that the Company will apply.
66
Table of Contents
Implications of Being an Emerging Growth Company
We qualify as an emerging growth company as defined in the Jumpstart our Business Startups Act of 2012 (the “JOBS Act”). An emerging growth company may take advantage of specified reduced reporting and other burdens that are otherwise applicable generally to public companies. Among other things, these provisions include:
| • | allowing less than five years of selected financial data; |
| • | an exemption from the auditor attestation requirement in the assessment of our internal control over financial reporting pursuant to the Sarbanes-Oxley Act of 2002 (the “Sarbanes-Oxley Act”); |
| • | an exemption from new or revised financial accounting standards until they would apply to private companies and compliance with any new requirements adopted by the Public Company Accounting Oversight Board requiring mandatory audit firm rotation; |
| • | reduced disclosure about the emerging growth company’s executive compensation arrangements; and |
| • | no requirement to seek non-binding advisory votes on executive compensation or golden parachute arrangements. |
The JOBS Act permits emerging growth companies to take advantage of an extended transition period to comply with new or revised accounting standards applicable to public companies. We have elected to “opt out” of this provision. Therefore, we will timely comply with new or revised accounting standards when they are applicable to public companies. This decision to opt out of the extended transition period is irrevocable.
We have elected to adopt the reduced disclosure requirements available to emerging growth companies, including only providing four years of selected financial data in Item 6 of Part II of this Annual Report on Form 10-K. As a result of this election, the information that we provided in this Annual Report on Form 10-K may be different than the information that shareholders, investors and other interested parties may receive from other public companies in which they hold equity interests. Additionally, it is possible that some shareholders, investors and other interested parties will find our common stock less attractive as a consequence of our election, which may result in a less active trading market for our common stock and more volatility in our stock price.
We may take advantage of the provisions under the JOBS Act until we are no longer an emerging growth company. We will remain an emerging growth company until the earlier of (i) the last day of the fiscal year (a) following the fifth anniversary of the completion of our initial public offering, (b) in which we have total annual gross revenues of at least $1.0 billion or (c) in which we are deemed to be a large accelerated filer, which means the market value of our common stock that is held by non-affiliates exceeds $700.0 million as of the prior June 30th, and (ii) the date on which we have issued more than $1.0 billion in non-convertible debt during the prior three-year period. We may choose to take advantage of some but not all of the reduced disclosure requirements.
| Item 7A. | Quantitative and Qualitative Disclosures About Market Risk. |
We are exposed to market risks related to fluctuations in interest rates on our variable-rate debt, including future borrowings, if any, under the Stonegate Loan and our $75.0 million unsecured revolving credit facility. As of December 31, 2014, we had no outstanding borrowings under such revolving credit facilities. However, assuming that (i) the Stonegate Loan and our unsecured revolving credit facility had been fully drawn at December 31, 2014 (i.e., $10.0 million and $75.0 million, respectively) and (ii) no interest expense is capitalized, a hypothetical 100 basis point increase in interest rates on our variable-rate debt would increase our annual interest expense by approximately $850,000.
For variable-rate debt, interest rate changes generally do not affect the fair value of the debt instrument but do impact future earnings and cash flows, assuming other factors are held constant. We did not use swaps, forward or option contracts on interest rates or commodities, or other types of derivative financial instruments during the year ended December 31, 2014. We have not entered into, and currently do not hold, derivatives for trading or speculative purposes.
We have no principal debt maturities on our fixed-rate debt until the year ending December 31, 2021, at which time the entire $250.0 million outstanding balance under our 6.875% Senior Notes due 2021 will be due and payable. As of December 31, 2014, the estimated fair value and carrying amount of such indebtedness were $251.9 million and $251.2 million, respectively.
67
Table of Contents
| Item 8. | Financial Statements and Supplementary Data. |
INDEX TO CONSOLIDATED FINANCIAL STATEMENTS
68
Table of Contents
Report of Independent Registered Public Accounting Firm
The Board of Directors and Shareholders of
WCI Communities, Inc.
We have audited the accompanying consolidated balance sheets of WCI Communities, Inc. and subsidiaries (the Company) as of December 31, 2014 and 2013, and the related consolidated statements of operations, shareholders’ equity, and cash flows for each of the three years in the period ended December 31, 2014. These financial statements are the responsibility of the Company’s management. Our responsibility is to express an opinion on these financial statements based on our audits.
We conducted our audits in accordance with the standards of the Public Company Accounting Oversight Board (United States). Those standards require that we plan and perform the audit to obtain reasonable assurance about whether the financial statements are free of material misstatement. We were not engaged to perform an audit of the Company’s internal control over financial reporting. Our audits included consideration of internal control over financial reporting as a basis for designing audit procedures that are appropriate in the circumstances, but not for the purpose of expressing an opinion on the effectiveness of the Company’s internal control over financial reporting. Accordingly, we express no such opinion. An audit also includes examining, on a test basis, evidence supporting the amounts and disclosures in the financial statements, assessing the accounting principles used and significant estimates made by management, and evaluating the overall financial statement presentation. We believe that our audits provide a reasonable basis for our opinion.
In our opinion, the financial statements referred to above present fairly, in all material respects, the consolidated financial position of WCI Communities, Inc. and subsidiaries at December 31, 2014 and 2013, and the consolidated results of their operations and their cash flows for each of the three years in the period ended December 31, 2014, in conformity with U.S. generally accepted accounting principles.
/s/ Ernst & Young LLP
Certified Public Accountants
Miami, Florida
February 25, 2015
69
Table of Contents
Consolidated Balance Sheets
(in thousands, except share and per share amounts)
| December 31, | ||||||||
| 2014 | 2013 | |||||||
| Assets |
||||||||
| Cash and cash equivalents |
$ | 174,756 | $ | 213,352 | ||||
| Restricted cash |
12,125 | 8,911 | ||||||
| Notes and accounts receivable |
5,637 | 7,107 | ||||||
| Real estate inventories |
449,249 | 280,293 | ||||||
| Property and equipment, net |
25,021 | 24,479 | ||||||
| Other assets |
20,179 | 18,178 | ||||||
| Deferred tax assets, net of valuation allowances |
110,823 | 125,646 | ||||||
| Goodwill |
7,520 | 7,520 | ||||||
|
|
|
|
|
|||||
| Total assets |
$ | 805,310 | $ | 685,486 | ||||
|
|
|
|
|
|||||
| Liabilities and Equity |
||||||||
| Accounts payable |
$ | 20,040 | $ | 22,113 | ||||
| Accrued expenses and other liabilities |
68,986 | 32,807 | ||||||
| Customer deposits |
30,662 | 20,702 | ||||||
| Senior notes, including unamortized premium of $1,179 at December 31, 2014 |
251,179 | 200,000 | ||||||
|
|
|
|
|
|||||
| Total liabilities |
370,867 | 275,622 | ||||||
|
|
|
|
|
|||||
| WCI Communities, Inc. shareholders’ equity: |
||||||||
| Preferred stock, $0.01 par value; 15,000,000 shares authorized, none issued |
— | — | ||||||
| Common stock, $0.01 par value; 150,000,000 shares authorized, |
259 | 258 | ||||||
| Additional paid-in capital |
302,111 | 298,530 | ||||||
| Retained earnings |
130,581 | 108,984 | ||||||
| Treasury stock, at cost, 43,778 shares and 27,037 shares at December 31, 2014 and 2013, respectively |
(505 | ) | (196 | ) | ||||
|
|
|
|
|
|||||
| Total WCI Communities, Inc. shareholders’ equity |
432,446 | 407,576 | ||||||
| Noncontrolling interests in consolidated joint ventures |
1,997 | 2,288 | ||||||
|
|
|
|
|
|||||
| Total equity |
434,443 | 409,864 | ||||||
|
|
|
|
|
|||||
| Total liabilities and equity |
$ | 805,310 | $ | 685,486 | ||||
|
|
|
|
|
|||||
See accompanying notes to consolidated financial statements.
70
Table of Contents
Consolidated Statements of Operations
(in thousands, except per share amounts)
| Years Ended December 31, | ||||||||||||
| 2014 | 2013 | 2012 | ||||||||||
| Revenues |
||||||||||||
| Homebuilding |
$ | 292,785 | $ | 214,016 | $ | 146,926 | ||||||
| Real estate services |
90,582 | 80,096 | 73,070 | |||||||||
| Amenities |
23,636 | 23,237 | 21,012 | |||||||||
|
|
|
|
|
|
|
|||||||
| Total revenues |
407,003 | 317,349 | 241,008 | |||||||||
|
|
|
|
|
|
|
|||||||
| Cost of Sales |
||||||||||||
| Homebuilding |
209,791 | 149,768 | 100,786 | |||||||||
| Real estate services |
88,094 | 76,972 | 71,675 | |||||||||
| Amenities |
25,377 | 25,285 | 24,254 | |||||||||
| Asset impairment |
1,200 | — | — | |||||||||
|
|
|
|
|
|
|
|||||||
| Total cost of sales |
324,462 | 252,025 | 196,715 | |||||||||
|
|
|
|
|
|
|
|||||||
| Gross margin |
82,541 | 65,324 | 44,293 | |||||||||
|
|
|
|
|
|
|
|||||||
| Selling, general and administrative expenses |
46,969 | 39,548 | 32,129 | |||||||||
| Interest expense |
1,140 | 2,537 | 6,978 | |||||||||
| Other income, net |
(1,604 | ) | (2,642 | ) | (7,493 | ) | ||||||
| Expenses related to early repayment of debt |
— | 5,105 | 16,984 | |||||||||
|
|
|
|
|
|
|
|||||||
| 46,505 | 44,548 | 48,598 | ||||||||||
|
|
|
|
|
|
|
|||||||
| Income (loss) from continuing operations before income taxes |
36,036 | 20,776 | (4,305 | ) | ||||||||
| Income tax expense (benefit) from continuing operations |
14,652 | (125,709 | ) | (52,233 | ) | |||||||
|
|
|
|
|
|
|
|||||||
| Income from continuing operations |
21,384 | 146,485 | 47,928 | |||||||||
| Income from discontinued operations, net of tax |
— | — | 118 | |||||||||
| Gain on sale of discontinued operations, net of tax |
— | — | 2,588 | |||||||||
|
|
|
|
|
|
|
|||||||
| Net income |
21,384 | 146,485 | 50,634 | |||||||||
| Net loss from continuing operations attributable to noncontrolling interests |
213 | 163 | 189 | |||||||||
|
|
|
|
|
|
|
|||||||
| Net income attributable to WCI Communities, Inc. |
21,597 | 146,648 | 50,823 | |||||||||
| Preferred stock dividends |
— | (19,680 | ) | — | ||||||||
|
|
|
|
|
|
|
|||||||
| Net income attributable to common shareholders of WCI Communities, Inc. |
$ | 21,597 | $ | 126,968 | $ | 50,823 | ||||||
|
|
|
|
|
|
|
|||||||
| Earnings per share attributable to common shareholders of WCI Communities, Inc.: |
||||||||||||
| Basic |
||||||||||||
| Continuing operations |
$ | 0.83 | $ | 5.88 | $ | 3.33 | ||||||
| Discontinued operations |
— | — | 0.19 | |||||||||
|
|
|
|
|
|
|
|||||||
| Earnings per share |
$ | 0.83 | $ | 5.88 | $ | 3.52 | ||||||
|
|
|
|
|
|
|
|||||||
| Diluted |
||||||||||||
| Continuing operations |
$ | 0.82 | $ | 5.86 | $ | 3.31 | ||||||
| Discontinued operations |
— | — | 0.19 | |||||||||
|
|
|
|
|
|
|
|||||||
| Earnings per share |
$ | 0.82 | $ | 5.86 | $ | 3.50 | ||||||
|
|
|
|
|
|
|
|||||||
| Weighted average number of shares of common stock outstanding: |
||||||||||||
| Basic |
26,021 | 21,586 | 14,445 | |||||||||
|
|
|
|
|
|
|
|||||||
| Diluted |
26,292 | 21,680 | 14,515 | |||||||||
|
|
|
|
|
|
|
|||||||
| Net income attributable to WCI Communities, Inc.: |
||||||||||||
| Income from continuing operations |
$ | 21,597 | $ | 146,648 | $ | 48,117 | ||||||
| Income from discontinued operations |
— | — | 2,706 | |||||||||
|
|
|
|
|
|
|
|||||||
| Net income attributable to WCI Communities, Inc. |
$ | 21,597 | $ | 146,648 | $ | 50,823 | ||||||
|
|
|
|
|
|
|
|||||||
See accompanying notes to consolidated financial statements.
71
Table of Contents
Consolidated Statements of Shareholders’ Equity
Years Ended December 31, 2014, 2013 and 2012
(in thousands)
| Series A | Series B | Additional Paid-in Capital |
Retained Earnings (Accumulated Deficit) |
|||||||||||||||||||||||||||||||||||||||||
| Preferred Stock |
Preferred Stock |
Common Stock | Treasury | Noncontrolling | ||||||||||||||||||||||||||||||||||||||||
| Shares | Amount | Shares | Amount | Shares | Amount | Stock | Interests | Total | ||||||||||||||||||||||||||||||||||||
| Balance at January 1, 2012 |
10 | $ | — | — | $ | — | 9,958 | $ | 100 | $ | 154,462 | $ | (88,487 | ) | $ | (155 | ) | $ | 2,640 | $ | 68,560 | |||||||||||||||||||||||
| Net income (loss) |
— | — | — | — | — | — | — | 50,823 | — | (189 | ) | 50,634 | ||||||||||||||||||||||||||||||||
| Stock-based and other non-cash long-term incentive compensation expense |
— | — | — | — | — | — | 705 | — | — | — | 705 | |||||||||||||||||||||||||||||||||
| Stock issued pursuant to stock-based incentive compensation plans and related tax matters |
— | — | — | — | 111 | 1 | (1 | ) | — | — | — | — | ||||||||||||||||||||||||||||||||
| Purchases of treasury stock |
— | — | — | — | — | — | — | — | (41 | ) | — | (41 | ) | |||||||||||||||||||||||||||||||
| Exercise of stock options |
— | — | — | — | 80 | 1 | 486 | — | — | — | 487 | |||||||||||||||||||||||||||||||||
| Issuance of common stock |
— | — | — | — | 7,923 | 79 | 48,181 | — | — | — | 48,260 | |||||||||||||||||||||||||||||||||
|
|
|
|
|
|
|
|
|
|
|
|
|
|
|
|
|
|
|
|
|
|
|
|||||||||||||||||||||||
| Balance at December 31, 2012 |
10 | — | — | — | 18,072 | 181 | 203,833 | (37,664 | ) | (196 | ) | 2,451 | 168,605 | |||||||||||||||||||||||||||||||
| Net income (loss) |
— | — | — | — | — | — | — | 146,648 | — | (163 | ) | 146,485 | ||||||||||||||||||||||||||||||||
| Stock-based and other non-cash long-term incentive compensation expense |
— | — | — | — | — | — | 5,217 | — | — | — | 5,217 | |||||||||||||||||||||||||||||||||
| Stock dividend paid to Series A preferred shareholders |
— | — | — | — | 904 | 9 | (9 | ) | — | — | — | — | ||||||||||||||||||||||||||||||||
| Retirement of Series A preferred shares |
(10 | ) | — | — | — | — | — | — | — | — | — | — | ||||||||||||||||||||||||||||||||
| Cash dividend paid to Series B preferred shareholder |
— | — | — | — | — | — | (700 | ) | — | — | — | (700 | ) | |||||||||||||||||||||||||||||||
| Issuance of common stock |
— | — | — | — | 6,819 | 68 | 90,189 | — | — | — | 90,257 | |||||||||||||||||||||||||||||||||
|
|
|
|
|
|
|
|
|
|
|
|
|
|
|
|
|
|
|
|
|
|
|
|||||||||||||||||||||||
| Balance at December 31, 2013 |
— | — | — | — | 25,795 | 258 | 298,530 | 108,984 | (196 | ) | 2,288 | 409,864 | ||||||||||||||||||||||||||||||||
| Net income (loss) |
— | — | — | — | — | — | — | 21,597 | — | (213 | ) | 21,384 | ||||||||||||||||||||||||||||||||
| Stock-based and other non-cash long-term incentive compensation expense |
— | — | — | — | — | — | 3,422 | — | — | — | 3,422 | |||||||||||||||||||||||||||||||||
| Stock issued pursuant to stock-based incentive compensation plans and related tax matters |
— | — | — | — | 55 | 1 | 159 | — | — | — | 160 | |||||||||||||||||||||||||||||||||
| Purchases of treasury stock |
— | — | — | — | — | — | — | — | (309 | ) | — | (309 | ) | |||||||||||||||||||||||||||||||
| Distributions to noncontrolling interests |
— | — | — | — | — | — | — | — | — | (78 | ) | (78 | ) | |||||||||||||||||||||||||||||||
|
|
|
|
|
|
|
|
|
|
|
|
|
|
|
|
|
|
|
|
|
|
|
|||||||||||||||||||||||
| Balance at December 31, 2014 |
— | $ | — | — | $ | — | 25,850 | $ | 259 | $ | 302,111 | $ | 130,581 | $ | (505 | ) | $ | 1,997 | $ | 434,443 | ||||||||||||||||||||||||
|
|
|
|
|
|
|
|
|
|
|
|
|
|
|
|
|
|
|
|
|
|
|
|||||||||||||||||||||||
See accompanying notes to consolidated financial statements.
72
Table of Contents
Consolidated Statements of Cash Flows
(in thousands)
| Years Ended December 31, | ||||||||||||
| 2014 | 2013 | 2012 | ||||||||||
| Operating activities |
||||||||||||
| Net income |
$ | 21,384 | $ | 146,485 | $ | 50,634 | ||||||
| Adjustments to reconcile net income to net cash provided by (used in) operating activities: |
||||||||||||
| Amortization of debt issuance costs |
846 | 627 | 400 | |||||||||
| Amortization of debt (premium) discount |
(71 | ) | 243 | 1,545 | ||||||||
| Expenses related to early repayment of debt |
— | 5,105 | 16,984 | |||||||||
| Non-cash addition to senior subordinated secured term loan for PIK interest |
— | — | 6,930 | |||||||||
| Non-cash change in unrecognized tax benefit |
— | — | (50,498 | ) | ||||||||
| Depreciation |
2,627 | 2,081 | 2,000 | |||||||||
| Provision for (recovery of) bad debts |
(3 | ) | 263 | 286 | ||||||||
| Gain on sale of discontinued operations |
— | — | (4,265 | ) | ||||||||
| (Gain) loss on sale of property and equipment |
— | 72 | (718 | ) | ||||||||
| Deferred income tax expense |
15,463 | — | — | |||||||||
| Reversals of deferred tax asset valuation allowances |
(480 | ) | (125,646 | ) | — | |||||||
| Stock-based and other non-cash long-term incentive compensation expense |
3,422 | 5,217 | 705 | |||||||||
| Asset impairment |
1,200 | — | — | |||||||||
| Changes in assets and liabilities: |
||||||||||||
| Restricted cash |
(3,214 | ) | 1,964 | 9,935 | ||||||||
| Notes and accounts receivable |
1,473 | (1,698 | ) | 265 | ||||||||
| Real estate inventories |
(158,659 | ) | (98,511 | ) | (23,452 | ) | ||||||
| Other assets, excluding income taxes receivable |
(430 | ) | 2,360 | 1,123 | ||||||||
| Income taxes receivable |
(569 | ) | 16,754 | (699 | ) | |||||||
| Accounts payable and other liabilities |
1,286 | 17,322 | 5,742 | |||||||||
| Customer deposits |
9,960 | 4,781 | 5,097 | |||||||||
| Equity compensation excess income tax benefits |
(160 | ) | — | — | ||||||||
|
|
|
|
|
|
|
|||||||
| Net cash provided by (used in) operating activities |
(105,925 | ) | (22,581 | ) | 22,014 | |||||||
|
|
|
|
|
|
|
|||||||
| Investing activities |
||||||||||||
| Distributions of capital from an unconsolidated joint venture |
— | 577 | 1,939 | |||||||||
| Additions to property and equipment |
(2,977 | ) | (2,554 | ) | (1,077 | ) | ||||||
| Proceeds from the sale of property and equipment |
— | — | 674 | |||||||||
| Proceeds from the sale of discontinued operations |
— | — | 10,069 | |||||||||
|
|
|
|
|
|
|
|||||||
| Net cash provided by (used in) investing activities |
(2,977 | ) | (1,977 | ) | 11,605 | |||||||
|
|
|
|
|
|
|
|||||||
| Financing activities |
||||||||||||
| Proceeds from the issuance of common stock, net |
— | 90,257 | 48,260 | |||||||||
| Proceeds from the issuance of senior notes |
51,250 | 200,000 | — | |||||||||
| Proceeds from the issuance of senior secured term notes, net |
— | — | 122,500 | |||||||||
| Repayment of senior secured term notes |
— | (126,250 | ) | — | ||||||||
| Repayment of senior subordinated secured term loan |
— | — | (162,412 | ) | ||||||||
| Payments of debt issuance costs |
(1,213 | ) | (5,703 | ) | (3,495 | ) | ||||||
| Proceeds from the sale of community development district bonds |
21,673 | — | — | |||||||||
| Payments of community development district obligations |
(1,177 | ) | (788 | ) | (1,174 | ) | ||||||
| Payment of preferred stock dividend |
— | (700 | ) | — | ||||||||
| Proceeds from the exercise of stock options |
— | — | 487 | |||||||||
| Purchases of treasury stock |
(309 | ) | — | (41 | ) | |||||||
| Distributions to noncontrolling interests |
(78 | ) | — | — | ||||||||
| Equity compensation excess income tax benefits |
160 | — | — | |||||||||
|
|
|
|
|
|
|
|||||||
| Net cash provided by financing activities |
70,306 | 156,816 | 4,125 | |||||||||
|
|
|
|
|
|
|
|||||||
| Net increase (decrease) in cash and cash equivalents |
(38,596 | ) | 132,258 | 37,744 | ||||||||
| Cash and cash equivalents at the beginning of the year |
213,352 | 81,094 | 43,350 | |||||||||
|
|
|
|
|
|
|
|||||||
| Cash and cash equivalents at the end of the year |
$ | 174,756 | $ | 213,352 | $ | 81,094 | ||||||
|
|
|
|
|
|
|
|||||||
| Supplemental disclosures |
||||||||||||
| Cash paid during the year for: |
||||||||||||
| Interest, net of amounts capitalized |
$ | (611 | ) | $ | (3,245 | ) | $ | (2,532 | ) | |||
| Income taxes |
245 | — | — | |||||||||
| Noncash transactions associated with community development district obligations: |
||||||||||||
| Liabilities assumed by homebuyers |
$ | 3,032 | $ | 2,486 | $ | 1,492 | ||||||
| Liabilities assumed by WCI Communities, Inc. |
14,719 | — | — | |||||||||
| Additions to real estate inventories |
14,108 | — | — | |||||||||
| Increase in other assets |
611 | — | — | |||||||||
See accompanying notes to consolidated financial statements.
73
Table of Contents
Notes to Consolidated Financial Statements
December 31, 2014
| 1. | Organization and Description of the Business |
WCI Communities, Inc. is a lifestyle community developer and luxury homebuilder in several of Florida’s coastal markets. Unless the context otherwise requires, the terms the “Company,” “we,” “us” and “our” in these notes to the consolidated financial statements refer to WCI Communities, Inc. and its subsidiaries and the term “WCI” refers only to WCI Communities, Inc. Our business is organized into three operating segments: homebuilding, real estate services and amenities. Our homebuilding operations design, sell and build single- and multi-family homes, targeting move-up, second-home and active adult buyers. Our real estate services businesses include real estate brokerage and title services. Our amenities operations own and/or operate golf courses and country clubs, marinas and resort-style amenity facilities within certain of our communities.
On August 4, 2008, WCI’s predecessor company and certain subsidiaries (collectively, the “Debtors”) filed voluntary petitions for reorganization relief under the provisions of Chapter 11 of Title 11 of the U.S. Bankruptcy Code in the U.S. Bankruptcy Court for the District of Delaware. The Debtors filed a joint plan of reorganization (the “Reorganization”), which was declared effective on September 3, 2009, and the Debtors emerged from bankruptcy on that date. In conjunction with the emergence from bankruptcy, WCI was formed as a holding company that owns 100% of the equity in WCI Communities, LLC and WCI Communities Management, LLC.
On July 30, 2013, the Company completed its initial public offering (the “Initial Public Offering”), issuing 6,819,091 shares of its common stock at a price to the public of $15.00 per share. The shares trade on the New York Stock Exchange under the ticker symbol “WCIC.” The net proceeds from the sale of common stock in the Initial Public Offering were $90.3 million after deducting underwriting discounts and offering expenses payable by the Company. The Company used the net proceeds from the offering for general corporate purposes, including the acquisition and development of land and home construction.
| 2. | Summary of Significant Accounting Policies |
Basis of Presentation
The accompanying consolidated financial statements have been prepared in accordance with U.S. generally accepted accounting principles (“GAAP”), as contained in the Financial Accounting Standards Board’s Accounting Standards Codification (“ASC”).
The consolidated financial statements include the accounts of the Company, its wholly-owned subsidiaries and certain joint ventures, which are not variable interest entities (“VIEs”), as defined under ASC 810, Consolidation (“ASC 810”), but over which the Company has the ability to exercise control. In accordance with ASC 323, Investments—Equity Method and Joint Ventures, the equity method of accounting is applied to those investments in joint ventures that are not VIEs and the Company has either less than a controlling interest, substantive participating rights or is not the primary beneficiary, as defined in ASC 810. All material intercompany balances and transactions have been eliminated in consolidation. Also, see below under “Recently Issued Accounting Pronouncements” for certain accounting guidance that the Company will be required to adopt during the year ending December 31, 2016 and interim reporting periods during that year.
We record our investments in unconsolidated joint ventures in other assets in the accompanying consolidated balance sheets. Equity in earnings from unconsolidated joint ventures has been included in other income, net in the accompanying consolidated statements of operations; however, such amounts, if any, were nominal during each of the years in the three-year period ended December 31, 2014. During April 2013 and December 2012, we received distributions of $0.6 million and $1.9 million, respectively, in respect of our 49.9% ownership interest in Florida Home Finance Group LLC. Such entity was a joint venture that offered mortgage banking services. In connection with those payments, the joint venture was dissolved. We accounted for our investment in Florida Home Finance Group LLC under the equity method.
The Company’s operations involve real estate development and sales and, as such, it is not possible to precisely measure the duration of its operating cycle. The accompanying consolidated balance sheets of the Company have been prepared on an unclassified basis in accordance with real estate industry practice.
All share and per share amounts of the Company’s common stock have been retroactively adjusted in the accompanying consolidated financial statements and notes to reflect the stock split, the new authorized share amounts and the conversion of our Series A, B, C, D and E common stock into a single class of common stock that are discussed in Note 14.
74
Table of Contents
Use of Estimates
The preparation of financial statements in conformity with GAAP requires management to make estimates and assumptions that affect the amounts reported in the Company’s consolidated financial statements and accompanying notes. Actual results could significantly differ from those estimates.
Cash and Cash Equivalents and Concentration of Credit Risk
We consider all highly liquid instruments with an original maturity of three months or less to be cash equivalents. As of December 31, 2014 and 2013, cash and cash equivalents included $2.0 million and $0.4 million, respectively, of amounts in transit from title companies for transactions that closed at or near year-end.
As of December 31, 2014 and 2013, substantially all of our cash balances were held on deposit with two financial institutions. If those financial institutions fail to perform their duties under the terms of our depository agreements, we could incur a significant loss or be denied access to cash in our operating accounts.
Restricted Cash
Restricted cash consists primarily of funds held in escrow accounts representing customer deposits restricted as to use and cash collateral in support of outstanding letters of credit and other bank financing arrangements. We receive cash earnest money deposits from our customers who enter into home sales contracts. We are precluded from using such deposits in construction unless the customer waives the requirement to escrow deposit funds or we take measures to release state-imposed restrictions, which may include posting escrow bonds. We had $4.5 million and $8.3 million outstanding in escrow bonds at December 31, 2014 and 2013, respectively, which were used to release restrictions on customer deposits.
As of December 31, 2014 and 2013, our restricted cash included $11.0 million and $6.4 million, respectively, related to customer deposits. Restricted cash also included $1.1 million and $2.5 million of cash collateral in support of outstanding letters of credit and other bank financing arrangements as of December 31, 2014 and 2013, respectively.
Notes and Accounts Receivable
Notes receivable are generated through the normal course of business and are related to amenity membership sales that are collateralized by liens on memberships sold. Accounts receivable are generated through the normal course of amenity and other business operations and are unsecured. We assess the collectability of notes and accounts receivable and the need for an allowance for doubtful accounts based on a detail review of the individual notes and accounts receivable, collection histories and the number of days the accounts are delinquent. Notes and accounts receivable were recorded net of allowances for doubtful accounts of $0.4 million at both December 31, 2014 and 2013.
Real Estate Inventories and Capitalized Interest
Real estate inventories consist of land and land improvements, homes under construction or completed and investments in amenities. Costs capitalized to land and land improvements primarily include: (i) land acquisition costs; (ii) land development costs; (iii) entitlement costs; (iv) capitalized interest; (v) capitalized real estate taxes; (vi) capitalized association deficit funding; and (vii) certain indirect land development overhead costs. Land costs are transferred from land and land improvements to homes under construction or completed at the commencement of construction of the home. Components of homes under construction or completed include: (i) land costs transferred from land and land improvements; (ii) direct construction costs associated with the home; (iii) engineering, permitting and other fees; (iv) capitalized interest; and (v) certain indirect construction overhead costs. Total land and common development costs are apportioned to each home, lot, amenity or parcel using the relative sales value method, while site-specific development costs are allocated directly to the benefited land. Investments in amenities include costs associated with the construction of clubhouses, golf courses, marinas, tennis courts and various other recreational facilities, which we intend to recover through equity membership and marina slip sales.
All of our real estate inventories are reviewed for recoverability on a quarterly basis, as our inventory is considered “long-lived,” in accordance with ASC 360, Property, Plant, and Equipment (“ASC 360”). Impairment charges are recorded to write down an asset to its estimated fair value if the undiscounted cash flows expected to be generated by the asset are lower than its carrying amount. Our determination of fair value is based on projections and estimates. Changes in these expectations may lead to a change in the outcome of our impairment analysis and actual results may also differ from our assumptions. Each community, land parcel or amenity asset is evaluated individually. For those assets deemed to be impaired, the recognized impairment is measured as the amount by which the assets’ carrying amount exceeds their fair value. Further discussion of real estate asset impairments is included in Note 5.
75
Table of Contents
We construct amenities in conjunction with the development of certain planned communities and account for the related costs in accordance with ASC 330, Inventories. Our amenities are transferred to common interest realty associations (“CIRAs”), sold as equity membership clubs, sold separately or retained and operated by us. The cost of amenities conveyed to a CIRA is classified as a common cost of the community and included in real estate inventories. This cost is allocated to cost of sales on the basis of the relative sales value of the homes sold. The cost of amenities sold as equity membership clubs is included in real estate inventories, classified as investments in amenities (Note 3). Costs of amenities retained and operated by us are accounted for as property and equipment.
In accordance with ASC 835, Interest, interest incurred relating to land under development and construction of homes is capitalized to real estate inventories during the active development period. For homes under construction, we include the underlying developed land costs and in-process homebuilding costs in our determination of capitalized interest. Capitalization ceases upon substantial completion of a home, with the related capitalized interest being charged to cost of sales when the home is delivered.
Interest incurred relating to the construction of amenities is capitalized to real estate inventories for equity membership clubs or property and equipment for clubs to be retained and operated by us. Interest capitalized to real estate inventories is charged to cost of sales as related homes, home sites, amenity memberships and parcels are delivered. Interest capitalized to property and equipment is depreciated using the methodology described below under “Property and Equipment.”
Property and Equipment
Property and equipment is carried at cost less accumulated depreciation. Expenditures for maintenance and repairs are charged to expense as incurred. Costs of major renewals and improvements, which extend the useful lives of the underlying assets, are capitalized. Depreciation is computed using the straight-line method over the estimated useful lives of the related assets.
Included in property and equipment are recreational amenity assets that are considered held and used. With respect to these assets, if events or changes in circumstances, such as a significant decline in membership or membership pricing, significant increases in operating costs or changes in use, indicate that their carrying values may be impaired, an impairment analysis is performed in accordance with ASC 360. Our analysis consists of determining whether an asset’s carrying amount will be recovered from its undiscounted estimated future cash flows, including estimated residual cash flows such as the sale of the asset. These cash flows are estimated based on various assumptions that are subject to economic and market uncertainties, including, among other things, demand for golf memberships, competition within the market, changes in membership pricing and costs to operate each property. If the carrying amount of an asset exceeds the sum of its undiscounted future operating and residual cash flows, an impairment charge is recorded for the difference between the estimated fair value of the asset and its net carrying amount. We estimate the fair value of an asset by using discounted cash flow analyses. There were no impairment charges recorded during the years ended December 31, 2014, 2013 and 2012 related to property and equipment.
Assets of Discontinued Operations
Assets that meet certain criteria prescribed in ASC 360 are characterized as assets of discontinued operations in our consolidated balance sheets and recorded at the lower of their carrying values or fair values, less the projected costs to sell. When determining the fair values of those assets, we consider factors such as current sales prices for comparable assets in the area, recent market analyses/studies, appraisals, any recent legitimate offers and listing prices of similar assets (i.e., Level 2 inputs under the GAAP fair value hierarchy that is described in Note 11). If the estimated fair value of an affected asset, less the projected costs to sell, is less than its current carrying value, the asset is written down to its estimated fair value, less the projected costs to sell. There were no such asset impairment charges recorded during the years ended December 31, 2014, 2013 and 2012.
Further discussion of our discontinued operations is included in Note 7. Also, see below under “Recently Issued Accounting Pronouncements” for certain related accounting guidance that the Company adopted during the year ended December 31, 2014.
Debt Issuance Costs, Debt Premiums/Discounts and Related Other
Debt issuance costs and debt premiums/discounts are amortized to interest expense using the effective interest method over the estimated economic life of the underlying debt instrument.
In connection with transactions that involve our debt instruments, including those described in Note 10, we evaluate and assess the accounting for such transactions in accordance with, among other things, the provisions of ASC 470-50, Debt—Modifications and Extinguishments (“ASC 470-50”). ASC 470-50 provides guidance as to (i) whether a transaction should be treated as an extinguishment of debt or a debt modification and (ii) the handling of new and legacy debt issuance costs. The application of ASC 470-50 during the three years ended December 31, 2014 did not have a material impact on the Company.
76
Table of Contents
Goodwill
Goodwill represents the excess of the estimated fair value of a business over its identifiable tangible and intangible net assets. ASC 350, Intangibles—Goodwill and Other (“ASC 350”), provides guidance on accounting for intangible assets. Among other things, ASC 350 eliminates the amortization of goodwill for companies that meet the prescribed definition of a public business entity. Pursuant to the provisions of ASC 350, goodwill is tested for impairment, at a minimum, once a year. Evaluating goodwill for impairment is a two-step process that involves the determination of the fair values and the carrying values of reporting units that have goodwill. A reporting unit is a component of an operating segment for which discrete financial information is available and reviewed by management on a regular basis. All of our goodwill pertains to reporting units under our real estate services operating segment.
Pursuant to the provisions of ASC 350, as amended, entities have the option of performing a qualitative assessment before calculating the fair value of a reporting unit when testing goodwill for impairment. If the fair value of the reporting unit is determined, based on qualitative factors, to be “more-likely-than-not” less than the carrying amount of the reporting unit, then the two-step goodwill impairment test must be performed.
Certain estimates and judgments are inherent in our determination of the fair value of a reporting unit, including the interpretation of current economic indicators and market valuations, as well as strategic plans with regard to our operations. We typically use a revenue or income approach to determine the estimated fair values of our reporting units when performing our goodwill impairment test. The income approach establishes fair value by methods that discount or capitalize revenues, earnings and/or cash flows using a discount or capitalization rate that reflects market rate of return expectations, market conditions and the risks of the relative investment. If the estimated fair value of a reporting unit is less than its carrying value, then the second step of the goodwill impairment test is performed to measure the amount of the impairment charge, if any. The impairment charge is determined by comparing the implied fair value of the reporting unit’s goodwill to the corresponding carrying value. The implied fair value of goodwill represents the excess of the fair value of the reporting unit over amounts assigned to its net assets.
We review goodwill annually (or whenever qualitative indicators of impairment exist) for impairment. There were no goodwill impairment charges recorded during the years ended December 31, 2014, 2013 and 2012.
Warranty Reserves
We generally provide our single- and multi-family homebuyers with a limited one to three-year warranty, respectively, for all material and labor and a 10-year warranty for certain structural defects. Warranty reserves have been established by charging cost of sales and crediting a warranty liability for each home delivered. The amounts charged are estimated by management to be adequate to cover expected warranty-related costs for all unexpired warranty obligation periods. Our warranty reserves are based on historical warranty cost experience and are adjusted, as appropriate, to reflect qualitative risks associated with the homes constructed. Our actual costs and expenditures under our various warranty programs could significantly differ from the estimates used to estimate the warranty reserves that have been recorded in the accompanying consolidated balance sheets (Note 8).
Loss Contingencies
We regularly review the status of the Company’s legal matters and assess the potential financial exposure thereof. If the potential loss from any claim or lawsuit is considered probable and the amount can be reasonably estimated, the Company records a reserve. Judgment is required when determining probability and whether an exposure is reasonably estimable. The actual costs resulting from the final resolution of claims and lawsuits may vary from management’s estimates because, among other things, estimating such financial exposure requires the consideration of uncertainties. As additional information becomes available, the Company’s potential liability is reassessed and, as a result thereof, we may revise and adjust our estimates at that time. Changes in estimates of financial exposure for loss contingencies could have a material impact on the Company’s consolidated financial position and results of operations in the future. Attorneys’ fees and other costs of defending the Company in respect of claims and lawsuits are expensed in the period that such fees and costs are incurred.
See Note 13 for information regarding certain of the Company’s loss contingencies.
Customer Deposits
Customer deposits represent amounts received from customers under real estate and amenity sales contracts.
77
Table of Contents
Revenue and Profit Recognition
Homebuilding revenues and related profits are recognized in accordance with ASC 360 at the time of delivery under the full accrual method for single- and multi-family homes. Under the full accrual method, revenues and related profits are recognized when collectability of the sales price is reasonably assured and the earnings process is substantially complete. When a sale does not meet the requirements for income recognition, profit is deferred until such requirements are met and the related sold inventory is classified as completed inventory.
Real estate services revenues, which include real estate brokerage and title services operations, are recognized upon the closing of a sales contract.
Revenues from amenity operations include the sale of equity memberships and marina slips, nonequity memberships, membership dues and fees for services provided. Equity memberships entitle buyers to a future ownership interest in the amenity facility upon turnover of the club to the membership in addition to the right to use the facilities in accordance with the terms of the membership agreement. Nonequity memberships only entitle buyers with the right to use the amenity facilities in accordance with the terms of the membership agreement. Equity membership and marina slip sales are recognized at the time of closing. Equity membership sales and the related cost of sales are initially recorded under the deposit or cost recovery method. Revenue recognition for each equity club program is reevaluated on a periodic basis based on changes in circumstances. If we can demonstrate that it is likely that we will recover proceeds in excess of the remaining carrying value and no material contingencies exist, such as a developer rescission clause, the full accrual method is then applied. Nonrefundable nonequity memberships entitle buyers to the right to use the respective amenity facility over its useful life and are sold separately from homes within our communities. Nonequity membership initiation fees are deferred and amortized to amenities revenues over 20 years, representing the membership period, which is based on the estimated average depreciable life of the amenities facilities. This treatment most closely matches revenues with the expenses of operating the club over the membership period. Both equity and nonequity memberships require members to pay membership dues that are billed in advance on either an annual or quarterly basis and are recorded as deferred revenue and then recognized as revenues ratably over the term of the membership period. Revenues for services are recorded when the service is provided.
Revenues and profits from land sales, which are included in homebuilding revenues and gross margin, respectively, in the Company’s consolidated statements of operations, are recognized at the time of closing. Revenues and related profits are recognized in full when collectability of the sales price is reasonably assured and the earnings process is substantially complete. When a sale does not meet the requirements for income recognition, profit is deferred under the deposit method and the related inventory is classified as completed inventory. The deferred income is recognized when our involvement is completed.
Sales incentives, such as reductions in listed sales prices of homes, golf club memberships and marina slips, are treated as a reduction of revenues. Sales incentives, such as free products or services, are classified as cost of sales.
Also, see below under “Recently Issued Accounting Pronouncements” for certain related accounting guidance that the Company will be required to adopt during the year ending December 31, 2017 and interim reporting periods during that year.
Home Cost of Sales
Cost of home deliveries includes direct home construction costs, land acquisition, land development and related costs, both incurred and estimated to be incurred, warranty costs, closing costs, development period interest and other common costs. We use the specific identification method for the purpose of accumulating home construction costs. Land acquisition and land development costs are allocated to each home site within a subdivision based on the relative fair values of the home sites prior to home construction. We recognize all home cost of sales when a home is delivered on a house-by-house basis.
Real Estate Brokerage Cost of Sales
Real estate brokerage revenues primarily consist of the gross commission income that we receive on real estate transactions for which we acted as the broker. We pay a portion of the commission received to the independent real estate agents that work with our real estate brokerage operations. These commissions are a direct cost of real estate brokerage revenues and are included in real estate services cost of sales in the Company’s consolidated statements of operations. Real estate services cost of sales also includes overhead costs associated with the Company’s realty brokerage and title services businesses.
Amenities Cost of Sales
Amenities cost of sales consists of: (i) allocated costs associated with the construction of clubhouses, golf courses, marinas and various other recreational facilities related to the sale of equity memberships and marina slips; (ii) direct costs of food, beverage and merchandise sold; and (iii) overhead associated with club and marina operations.
78
Table of Contents
Income Taxes
We account for income taxes in accordance with ASC 740, Income Taxes (“ASC 740”), which requires the recognition of income taxes currently payable or receivable, as well as deferred tax assets and liabilities resulting from temporary differences between the amounts reported for financial statement purposes and the amounts reported for income tax purposes at each balance sheet date using enacted statutory tax rates for the years in which taxes are expected to be paid, recovered or settled. Changes in tax rates are recognized in earnings in the period in which the changes are enacted.
ASC 740 requires that companies assess whether deferred tax asset valuation allowances should be established based on consideration of all of the available evidence using a “more-likely-than-not” standard. A valuation allowance must be established when it is more-likely-than-not that some or all of a company’s deferred tax assets will not be realized. We assess our deferred tax assets on a quarterly basis to determine if valuation allowances are required. When making a determination as to the adequacy of our deferred tax asset valuation allowance, we consider all of the available objectively verifiable positive and negative evidence, including, among other things, whether the Company is in a cumulative loss position, projected future taxable income by taxing jurisdiction, statutory limitations on the Company’s tax carryforwards and credits, tax planning strategies, recent financial operations, scheduled reversals of deferred tax liabilities, and the macroeconomic environment and the homebuilding industry. If we determine that the Company will not be able to realize some or all of its deferred tax assets in the future, a valuation allowance will be recorded through the provision for income taxes.
Significant judgment is applied in assessing whether deferred tax assets will be realized in the future. Ultimately, such realization depends on the existence of sufficient taxable income in the appropriate taxing jurisdiction in either the carryback or carryforward periods under existing tax laws. Forming a conclusion that a valuation allowance is not needed is difficult when there is negative evidence such as cumulative losses in recent years. In that circumstance, our valuation assessment emphasizes, among other things, the nature, frequency and magnitude of current and cumulative income and losses, forecasts of future profitability, the duration of statutory carryback or carryforward periods, our experience with net operating loss and tax credit carryforwards being used before their expiration and, if necessary, tax planning alternatives. Our assessment of the need for a deferred tax asset valuation allowance also includes assessing the likely future tax consequences of events that have been recognized in the Company’s consolidated financial statements and its tax returns. Changes in existing tax laws or rates could affect our actual tax results and future business results may affect the amount of the Company’s deferred tax liabilities or the deferred tax asset valuation allowance. Our accounting for deferred tax assets represents our best estimate of future events. Due to uncertainties in the estimation process, particularly with respect to changes in facts and circumstances in future reporting periods, including carryforward period assumptions, actual results could differ from our estimates. Our assumptions require significant judgment because the homebuilding industry is cyclical and highly sensitive to changes in economic conditions. If the Company’s future results of operations are less than projected or if the timing and jurisdiction of its future taxable income varies from our estimates, there may be insufficient objectively verifiable positive evidence to support a more-likely-than-not assessment of the Company’s deferred tax assets and an increase in our valuation allowance may be required at that time for some or all of such deferred tax assets.
ASC 740 defines the methodology for recognizing the benefits of tax return positions as well as guidance regarding the measurement of the resulting tax benefits. ASC 740 requires an enterprise to recognize the financial statement effects of a tax position when it is “more-likely-than-not” (defined as a likelihood of more than 50%), based solely on the technical merits, that the position will be sustained upon examination. A tax position that meets the more-likely-than-not recognition threshold is measured to determine the amount of benefit to be recognized in the financial statements based on the largest amount of benefit that is greater than 50% likely of being realized upon ultimate settlement with a taxing authority that has full knowledge of all relevant information. If a tax position does not meet the more-likely-than-not recognition threshold, despite our belief that its filing position is supportable, the benefit of that tax position is not recognized in the Company’s consolidated financial statements and we are required to accrue potential interest and penalties until the uncertainty is resolved. The evaluation of whether a tax position meets the more-likely-than-not recognition threshold requires a substantial degree of judgment by us based on the individual facts and circumstances. Actual results could differ from our estimates. ASC 740 also provides guidance for income tax accounting regarding derecognition, classification, interest and penalties, accounting in interim periods, disclosure and transition.
Advertising Costs
Advertising costs consist primarily of television, radio, newspaper, direct mail, billboard, brochures and other media advertising programs. We expense advertising costs related to our homebuilding operations as incurred to selling, general and administrative expenses in the Company’s consolidated statements of operations. Tangible advertising costs, such as architectural models and visual displays, are capitalized to real estate inventories. Advertising costs related to our real estate services and amenities operations are expensed as incurred to their respective cost of sales in the Company’s consolidated statements of operations. Total advertising expense was $5.2 million, $4.7 million and $5.0 million during the years ended December 31, 2014, 2013 and 2012, respectively.
79
Table of Contents
Earnings (Loss) Per Share
We compute basic earnings (loss) per share by dividing net income (loss) attributable to common shareholders of WCI Communities, Inc. by the weighted average number of outstanding common shares during the period. Diluted earnings per share gives effect to the potential dilution that could occur if securities or contracts to issue common stock, which would be dilutive, were exercised or converted into common stock or resulted in the issuance of common stock that then shared in our earnings. During periods of net losses attributable to common shareholders of WCI Communities, Inc., no dilution is computed.
Stock-Based Compensation
We account for stock-based awards in accordance with ASC 718, Compensation—Stock Compensation (“ASC 718”), which requires that the cost for all stock-based transactions be recognized in an entity’s financial statements. ASC 718 further requires all entities to apply a fair value measurement approach when accounting for stock-based transactions with employees, directors and nonemployees. Further discussion of our stock-based arrangements is included in Note 15.
Employee Benefit Plan
Our employees, who meet certain requirements as to service, are eligible to participate in the Company’s 401(k) benefit plan. During the three-year period ended December 31, 2014, we matched an amount equal to 25% of the first 6% of each participant’s elected deferrals, subject to certain limitations established by the Internal Revenue Service (the “IRS”). Effective January 1, 2015, our matching contribution changed to 50% of the first 5% of each participant’s elected deferrals, subject to certain limitations established by the IRS. The Company’s 401(k) benefit plan match expense was $0.3 million, $0.3 million and $0.2 million during the years ended December 31, 2014, 2013 and 2012, respectively.
Recently Issued Accounting Pronouncements
On April 10, 2014, the Financial Accounting Standards Board issued Accounting Standards Update 2014-08, Reporting Discontinued Operations and Disclosures of Disposals of Components of an Entity (“ASU 2014-08”). Among other things, ASU 2014-08 amends the definition of a discontinued operation and requires entities to provide supplemental disclosures about disposal transactions that do not meet the criteria for recognition as a discontinued operation. ASU 2014-08 is effective prospectively for periods that began or will begin on or after December 15, 2014 for all disposals, except for disposals classified as held for sale before an entity’s adoption date, or components of an entity initially classified as held for sale. Early adoption of ASU 2014-08 was permitted. As such, the Company retroactively adopted ASU 2014-08 on January 1, 2014; however, it did not have a material impact on the Company or the presentation of its consolidated financial statements.
On May 28, 2014, the Financial Accounting Standards Board issued Accounting Standards Update 2014-09, Revenue from Contracts with Customers (“ASU 2014-09”). Among other things, ASU 2014-09 outlines a framework for a single comprehensive model that entities can use when accounting for revenue and supersedes most current revenue recognition guidance, including that which pertains to specific industries such as homebuilding (e.g., sales of real estate, etc.). The core principle of ASU 2014-09 is that an entity should recognize revenue to depict the transfer of promised goods or services in an amount that reflects the consideration to which the entity expects to be entitled in exchange for such goods and services. ASU 2014-09 also requires expanded quantitative and qualitative disclosures that will enable the users of an entity’s financial statements to understand the nature, amount, timing and uncertainty of revenue and cash flows arising from contracts with customers. Public entities are required to adopt ASU 2014-09 during annual reporting periods beginning after December 15, 2016 and interim reporting periods during the year of adoption. An entity may adopt ASU 2014-09 using either a full retrospective approach for each prior reporting period presented or a modified retrospective approach. Under the latter approach an entity will (i) recognize the cumulative effect of initially applying ASU 2014-09 as an adjustment to the opening balance of its retained earnings or accumulated deficit during the annual reporting period that includes the date of initial application of ASU 2014-09 and (ii) provide certain supplemental disclosures during reporting periods that include the date of initial application of ASU 2014-09. Early adoption of ASU 2014-09 is not permitted by public entities. Due to the recent issuance of the new accounting and disclosure guidance under ASU 2014-09 and the complex analyses required thereunder, we have not yet determined the impact thereof on our consolidated financial statements or the method of adoption that the Company will apply.
On August 27, 2014, the Financial Accounting Standards Board issued Accounting Standards Update No. 2014-15, Disclosure of Uncertainties About an Entity’s Ability to Continue as a Going Concern (“ASU 2014-15”). Among other things, ASU 2014-15 requires management of a public entity to perform interim and annual assessments of such public entity’s ability to continue as a going concern within one year of the date that its financial statements are issued. If conditions or events raise substantial doubt about an entity’s ability to continue as a going concern, then such entity must provide certain supplemental disclosures in its financial statements. ASU 2014-15 is effective for annual periods ending after December 15, 2016 and annual and interim periods thereafter. Early adoption of ASU 2014-15 is permitted. The adoption of ASU 2014-15 is not expected to have a material effect on our consolidated financial statements or disclosures.
80
Table of Contents
On February 18, 2015, the Financial Accounting Standards Board issued Accounting Standards Update 2015-02, Amendments to the Consolidation Analysis (“ASU 2015-02”), which makes targeted amendments to GAAP’s existing consolidation guidance under both the variable interest and voting models. Among other things, ASU 2015-02 (i) introduces a separate analysis specific to limited partnerships and similar entities for assessing if the equity holders at risk lack decision-making rights and (ii) eliminates certain guidance under the consolidation voting model that pertains to limited partnerships, including the rebuttable presumption that a general partner unilaterally controls a limited partnership and should therefore consolidate it. Public entities are required to adopt ASU 2015-02 during annual reporting periods beginning after December 15, 2015 and interim reporting periods within those years. An entity may adopt ASU 2015-02 using either a full retrospective approach for each prior reporting period presented or a modified retrospective approach. Early adoption of ASU 2015-02 is permitted. Due to the recent issuance of the new accounting guidance under ASU 2015-02 and the complex analyses required thereunder, we have not yet determined the impact thereof on our consolidated financial statements or the method of adoption that the Company will apply.
| 3. | Real Estate Inventories and Capitalized Interest |
Real estate inventories are summarized in the table below.
| December 31, | ||||||||
| 2014 | 2013 | |||||||
| (in thousands) | ||||||||
| Land and land improvements held for development or sale |
$ | 310,499 | $ | 207,810 | ||||
| Work in progress |
94,078 | 38,486 | ||||||
| Completed inventories |
37,421 | 25,372 | ||||||
| Investments in amenities (Note 5) |
7,251 | 8,625 | ||||||
|
|
|
|
|
|||||
| Total real estate inventories |
$ | 449,249 | $ | 280,293 | ||||
|
|
|
|
|
|||||
Work in progress includes homes and related home site costs in various stages of construction. Completed inventories consist of model homes and related home site costs used to facilitate sales and homes with certificates of occupancy. The carrying value of land and land improvements held for sale was $0.8 million and $1.8 million as of December 31, 2014 and 2013, respectively. During October 2014, the Company closed on one of its held for sale land parcels for $1.5 million, resulting in a gain of $0.4 million, which was recognized in gross margin in the accompanying consolidated statements of operations during the year ended December 31, 2014.
As of December 31, 2014 and 2013, single- and multi-family inventories represented approximately 94% and 89%, respectively, of total real estate inventories. As of December 31, 2014 and 2013, tower inventories, which consisted primarily of land and land improvements, represented approximately 4% and 8%, respectively, of total real estate inventories.
Capitalized interest activity is summarized in the table below.
| Years Ended December 31, | ||||||||||||
| 2014 | 2013 | 2012 | ||||||||||
| (in thousands) | ||||||||||||
| Capitalized interest at the beginning of the year |
$ | 15,443 | $ | 7,959 | $ | 1,014 | ||||||
| Interest incurred |
16,859 | 14,278 | 16,227 | |||||||||
| Interest expensed |
(1,140 | ) | (2,537 | ) | (6,978 | ) | ||||||
| Interest charged to homebuilding segment cost of sales |
(6,306 | ) | (4,257 | ) | (2,304 | ) | ||||||
|
|
|
|
|
|
|
|||||||
| Capitalized interest at the end of the year |
$ | 24,856 | $ | 15,443 | $ | 7,959 | ||||||
|
|
|
|
|
|
|
|||||||
81
Table of Contents
| 4. | Property and Equipment |
Property and equipment is summarized in the table below.
| Estimated Useful Life (In Years) |
||||||||||
| December 31, | ||||||||||
| 2014 | 2013 | |||||||||
| (in thousands) | ||||||||||
| Land and land improvements |
10 to 15 | $ | 14,106 | $ | 13,907 | |||||
| Buildings and improvements |
5 to 40 | 16,062 | 14,323 | |||||||
| Furniture, fixtures and equipment |
3 to 7 | 7,370 | 6,180 | |||||||
|
|
|
|
|
|||||||
| Property and equipment, gross |
37,538 | 34,410 | ||||||||
| Accumulated depreciation |
(12,517 | ) | (9,931 | ) | ||||||
|
|
|
|
|
|||||||
| Property and equipment, net |
$ | 25,021 | $ | 24,479 | ||||||
|
|
|
|
|
|||||||
Amenities assets, net of accumulated depreciation, included in property and equipment, net above were $21.6 million and $21.8 million as of December 31, 2014 and 2013, respectively.
| 5. | Asset Impairment Charge |
In accordance with ASC 360, our real estate inventories and long-lived assets are carried at cost unless events and circumstances indicate that the carrying value of the underlying asset may not be recoverable. We evaluate and assess all such assets for recoverability on a quarterly basis to determine if impairment charges are warranted for individual assets. During the quarter and year ended December 31, 2014, we concluded that the projected undiscounted cash flows for one of the long-lived assets in our amenities operating segment no longer exceeded its carrying value of $3.2 million. Our assessment regarding such asset, a marina in central Florida, primarily resulted from: (i) continued softness in the boat slip rental and sales market; (ii) uncertainty regarding the timing and magnitude of a recovery, if any; and (iii) recent operating results and future projections that were below our previous expectations.
Due to the projected shortfall in undiscounted cash flow at the marina, we estimated the fair value of such asset in order to calculate the requisite impairment charge. The estimated fair value was determined using a discounted cash flow model that considered, among other things, the marina’s future net operating and capital activity. We typically employ a discounted cash flow model in these situations because we believe that it generally provides the best estimate of an asset’s fair value in the current marketplace. The discounted cash flow model used for the marina yielded a $2.0 million estimated fair value as of December 31, 2014, which resulted in a $1.2 million impairment charge to our amenities operating segment during the quarter and year ended December 31, 2014. Such model incorporated several assumptions and unobservable inputs, as contemplated under Level 3 of the GAAP fair value hierarchy (Note 11), the most critical of which were the: (i) discount rate; (ii) projected net cash requirements to maintain and operate the facility; and (iii) length of time and pricing necessary to sell all remaining boat slips in the marina. The projected net cash requirements were forecast based on our current operations, including anticipated capital improvements.
There were no long-lived asset impairment charges during the years ended December 31, 2013 and 2012.
In the event that real estate market conditions or the Company’s operations were to deteriorate in the future, long-lived impairment charges may be necessary and they could be significant. We also continue to monitor the values of certain of our land and amenities assets to determine whether to hold them for future development or sell them at current market prices. If we choose to market any of our assets for sale, this action may potentially lead to the recording of impairment charges on those assets.
| 6. | Other Assets |
Other assets are summarized in the table below.
| December 31, | ||||||||
| 2014 | 2013 | |||||||
| (in thousands) | ||||||||
| Debt issuance costs, net of accumulated amortization of $1,180 and $334 at December 31, 2014 and 2013, respectively |
$ | 5,955 | $ | 5,588 | ||||
| Prepaid expenses |
6,292 | 5,078 | ||||||
| Cash held by community development districts (Note 9) |
2,875 | 3,466 | ||||||
| Land acquisition deposits |
740 | 610 | ||||||
| Income taxes receivable, net |
646 | 77 | ||||||
| Other |
3,671 | 3,359 | ||||||
|
|
|
|
|
|||||
| Total other assets |
$ | 20,179 | $ | 18,178 | ||||
|
|
|
|
|
|||||
82
Table of Contents
Cash paid for debt issuance costs aggregated $1.2 million, $5.7 million and $3.5 million during the years ended December 31, 2014, 2013 and 2012, respectively. During the years ended December 31, 2013 and 2012, we wrote-off $1.8 million and $2.0 million, respectively, of net debt issuance costs as a result of our early repayment of debt (Note 10). The weighted average residual amortization period for our unamortized debt issuance costs as of December 31, 2014 was approximately 6.0 years. Future amortization of our debt issuance costs is expected to approximate $0.9 million during each of the years ending December 31, 2015 through December 31, 2019.
| 7. | Discontinued Operations |
During the year ended December 31, 2012, certain of our retained and operated amenities, which were characterized as assets held for sale, qualified as discontinued operations. Accordingly, the related results of operations and the gains on the sales of the underlying asset groups are required to be reported separately from continuing operations in the accompanying consolidated statements of operations. We had no such amenities or other assets held for sale during the years ended December 31, 2014 and 2013.
During the year ended December 31, 2012, we sold (i) a sports amenity club for $5.5 million (excluding closing costs) and recorded a pretax profit of $2.3 million and (ii) a sports amenity club for $5.9 million and recorded a pretax profit of $2.0 million. The 2012 results for these discontinued operations prior to their respective sales are summarized in the table below (in thousands).
| Revenues |
$ | 2,177 | ||
|
|
|
|||
| Income from discontinued operations before income taxes |
$ | 195 | ||
| Income tax expense |
77 | |||
|
|
|
|||
| Income from discontinued operations, net of tax |
$ | 118 | ||
|
|
|
|||
| Gain on sale of discontinued operations before income taxes |
$ | 4,265 | ||
| Income tax expense |
1,677 | |||
|
|
|
|||
| Gain on sale of discontinued operations, net of tax |
$ | 2,588 | ||
|
|
|
| 8. | Accrued Expenses and Other Liabilities |
Accrued expenses and other liabilities are summarized in the table below.
| December 31, | ||||||||
| 2014 | 2013 | |||||||
| (in thousands) | ||||||||
| Community development district obligations (Note 9) |
$ | 39,965 | $ | 7,271 | ||||
| Deferred revenue and income |
8,192 | 8,310 | ||||||
| Accrued interest |
6,564 | 5,588 | ||||||
| Accrued compensation and employee benefits |
5,692 | 4,368 | ||||||
| Warranty reserves |
1,888 | 1,558 | ||||||
| Other |
6,685 | 5,712 | ||||||
|
|
|
|
|
|||||
| Total accrued expenses and other liabilities |
$ | 68,986 | $ | 32,807 | ||||
|
|
|
|
|
|||||
The table below presents certain recent activity related to warranty reserves.
| Years Ended December 31, | ||||||||||||
| 2014 | 2013 | 2012 | ||||||||||
| (in thousands) | ||||||||||||
| Warranty reserves at the beginning of the year |
$ | 1,558 | $ | 1,077 | $ | 840 | ||||||
| Additions to reserves for new home deliveries |
1,484 | 1,095 | 733 | |||||||||
| Payments for warranty costs |
(411 | ) | (558 | ) | (379 | ) | ||||||
| Adjustments to prior year warranty reserves |
(743 | ) | (56 | ) | (117 | ) | ||||||
|
|
|
|
|
|
|
|||||||
| Warranty reserves at the end of the year |
$ | 1,888 | $ | 1,558 | $ | 1,077 | ||||||
|
|
|
|
|
|
|
|||||||
83
Table of Contents
During the years ended December 31, 2014, 2013 and 2012, net warranty expense of $0.7 million, $1.0 million and $0.6 million, respectively, was included in homebuilding cost of sales in the accompanying consolidated statements of operations. Adjustments to prior year warranty reserves related to changes in our anticipated warranty payments on previously delivered homes. During the year ended December 31, 2014, favorable warranty experience in certain neighborhoods led us to reduce our warranty reserves on homes where the warranty had expired and homes still under warranty in such neighborhoods.
| 9. | Community Development District Obligations |
A community development district or similar development authority (“CDD”) is a unit of local government created under various state and/or local statutes to encourage planned community development and allow for the construction and maintenance of long-term infrastructure through alternative financing sources, including the tax-exempt markets. A CDD is generally created through the approval of the local city or county in which the CDD is located and is controlled by a Board of Supervisors representing the landowners within the CDD. In connection with the development of certain communities, CDDs may use bond financing to fund construction or acquisition of certain on-site or off-site infrastructure improvements near or within those communities. CDDs are also granted the power to levy assessments and user fees on the properties benefiting from the improvements financed by the bond offerings. We pay a portion of the assessments and user fees levied by the CDDs on the properties we own that are benefited by the improvements. We may also agree to repay a specified portion of the bonds at the time of each unit or parcel closing.
The obligation to pay principal and interest on the bonds issued by the CDD is assigned to each parcel within the CDD and the CDD has a lien on each parcel at the time the CDD adopts its fees and assessments for the applicable fiscal year. If the owner of the parcel does not pay this obligation, the CDD can foreclose on the lien. The bonds, including interest and redemption premiums, if any, and the associated lien on the property are typically payable, secured and satisfied by revenues, fees or assessments levied on the property benefited.
In connection with the development of certain of our communities, CDDs have been established and bonds have been issued to finance a portion of the related infrastructure. There are two primary types of bonds issued by a CDD, type “A” and “B,” which are used to reimburse us for construction or acquisition of certain infrastructure improvements. The “A” bond is the portion of a bond offering that is ultimately intended to be assumed by the end-user (homeowner) and the “B” bond is our obligation.
The total amount of CDD bond obligations issued and outstanding with respect to our communities was $68.4 million and $33.0 million as of December 31, 2014 and 2013, respectively, which represented outstanding amounts payable from all landowners/homeowners within our communities. The CDD bond obligations outstanding as of December 31, 2014, mature at various times during the years 2018 through 2039. As of December 31, 2014 and 2013, we recorded CDD bond obligations of $40.0 million and $7.3 million, respectively, net of debt discounts of $2.4 million and $1.4 million, respectively, which represented the estimated amount of bond obligations that we may be required to pay based on our proportionate share of property owned within our communities.
We record a liability related to the “A” bonds for the estimated developer obligations that are probable and estimable and user fees that are required to be paid or transferred at the time the parcel or unit is sold to an end user. We reduce this liability by the corresponding assessment assumed by property purchasers and the amounts paid by us at the time of closing and the transfer of the property. We record a liability related to the “B” bonds, net of cash held by the districts that may be used to reduce our district obligations, for the full amount of the developer obligations that are fixed and determinable and user fees that are required to be paid at the time the parcel or unit is sold to an end user. We reduce this liability by the corresponding assessments paid by us at the time of closing of the property.
Our proportionate share of cash held by CDDs was $3.2 million and $3.6 million as of December 31, 2014 and 2013, respectively. Cash related to our share of the “A” bonds, which do not have a right of setoff on our CDD bond obligations, was $2.9 million and $3.5 million as of December 31, 2014 and 2013, respectively, and was included in other assets on the accompanying consolidated balance sheets (Note 6). As of December 31, 2014 and 2013, cash related to the “B” bonds, which has a right of setoff, was $0.4 million and $0.1 million, respectively, and was recorded as a reduction of our CDD bond obligations.
During April 2013, we acquired property, which was secured by an existing CDD obligation, and the related $24.0 million of CDD bonds issued and outstanding. Through April 15, 2014, we were both an owner of property subject to a CDD obligation as well as the holder of the related CDD bonds. In accordance with ASC Subtopic 405-20, Extinguishments of Liabilities, we accounted for the CDD obligation as a debt extinguishment to the extent of our obligation to repay the related CDD bond obligations. As a result, $23.6 million of the $24.0 million CDD obligation, which related to the property owned by us, was not recorded as a CDD obligation on our consolidated balance sheets prior to April 16, 2014. On such date, we sold $23.6 million of the aforementioned CDD bonds and received proceeds, including accrued and unpaid interest, of $22.7 million. The scheduled debt service payment on May 1, 2014 satisfied all of the other CDD bonds previously held by us. Accordingly, we are no longer the holder of any such CDD bonds. As a result of these transactions, the Company’s CDD obligations increased by $21.7 million during the year ended December 31, 2014, which represented our discounted proportionate share of the outstanding CDD bonds.
84
Table of Contents
During December 2014, the Company acquired property that was secured by existing CDD obligations. In connection therewith, the existing CDD and bondholders restructured the outstanding CDD bonds with Series “A” and Series “B” convertible capital appreciation bonds of $6.0 million and $9.1 million, respectively. Both bonds bear interest at 6.9% per annum. Additionally, the CDD retained $0.6 million and $0.4 million of cash pertaining to the Series “A” bonds and Series “B” bonds, respectively. The convertible capital appreciation bonds will convert to 2014 series “A” and “B” current interest bonds in May 2016 and bear interest at the then current rate. Such new bonds will mature in 2036 and 2025, respectively. As a result of the initial acquisition transaction, the Company’s other assets, real estate inventories and CDD obligations had non-cash additions of $0.6 million, $14.1 million and $14.7 million, respectively, during the quarter and year ended December 31, 2014.
| 10. | Debt Obligations |
Debt obligations are summarized in the table below.
| December 31, | ||||||||
| 2014 | 2013 | |||||||
| (in thousands) | ||||||||
| Senior Notes due 2021 |
$ | 251,179 | $ | 200,000 | ||||
| Unsecured revolving credit facility |
— | — | ||||||
| Secured revolving credit facility |
— | — | ||||||
|
|
|
|
|
|||||
| Total debt obligations |
$ | 251,179 | $ | 200,000 | ||||
|
|
|
|
|
|||||
Senior Notes due 2021. During August 2013, the Company completed the issuance of its 6.875% Senior Notes due 2021 in the aggregate principal amount of $200.0 million (the “Original 2021 Notes”) at an issue price of 100.0%. During June 2014, the Company completed the issuance of additional 6.875% Senior Notes due 2021 in the aggregate principal amount of $50.0 million (the “Supplemental 2021 Notes”) at an issue price of 102.5%, plus accrued and unpaid interest from February 15, 2014 to June 26, 2014. Each of the Original 2021 Notes and the Supplemental 2021 Notes were offered and sold in private transactions either to “qualified institutional buyers” pursuant to Rule 144A under the Securities Act of 1933, as amended (the “Securities Act”), or to persons outside the U.S. under Regulation S of the Securities Act.
The net proceeds from the offering of the Original 2021 Notes (the “Original 2021 Notes Offering”) were $195.5 million after deducting fees and expenses payable by us. One of the Company’s largest shareholders and one of such shareholder’s affiliates collectively purchased $10.0 million of the Original 2021 Notes when they were first issued by us and those entities subsequently sold their notes during March 2014. The Company used $127.0 million of the net proceeds from the Original 2021 Notes Offering to voluntarily prepay the entire outstanding principal amount of its Senior Secured Term Notes due 2017 (the “2017 Notes”), of which $125.0 million in aggregate principal amount was outstanding, at a price equal to 101% of the principal amount, plus accrued and unpaid interest. We have been using and expect to continue to use the remainder of the net proceeds from the Original 2021 Notes Offering for general corporate purposes, including the acquisition and development of land and home construction.
The Supplemental 2021 Notes were issued as additional securities under an indenture, dated as of August 7, 2013, by and among the Company, the guarantors named therein and Wilmington Trust, National Association, as trustee, governing the Original 2021 Notes (as amended, modified or supplemented from time to time in accordance with its terms, the “Indenture”). The Original 2021 Notes and the Supplemental 2021 Notes are treated as a single series of notes and have the exact same terms and conditions, except that the Supplemental 2021 Notes were initially subject to a separate registration rights agreement. The net proceeds from the offering of the Supplemental 2021 Notes (the “Supplemental 2021 Notes Offering”), excluding accrued interest of $1.3 million paid to the Company by the initial holder of the Supplemental 2021 Notes, were $50.4 million after deducting fees and expenses payable by us. We have been using and expect to continue to use the net proceeds from the Supplemental 2021 Notes Offering for general corporate purposes, including the acquisition and development of land and home construction.
Concurrent with the issuance of each of the Original 2021 Notes and the Supplemental 2021 Notes, the Company, the guarantors named in such debt arrangements and the initial purchasers of such notes entered into separate registration rights agreements. In connection therewith, the Company filed registration statements on Form S-4 and related amendments thereto during the year ended December 31, 2014. Such registration statements were ultimately declared effective by the Securities and Exchange Commission. Subsequently, all of the Original 2021 Notes and the Supplemental 2021 Notes were exchanged for publicly registered notes having terms substantially identical to those of the exchanged Senior Notes due 2021 (except for provisions relating to transfer restrictions and payments of additional interest).
85
Table of Contents
The Original 2021 Notes and the Supplemental 2021 Notes (collectively, the “2021 Notes”) are senior unsecured obligations of WCI Communities, Inc. (“WCI”) that are fully and unconditionally guaranteed on a joint and severable and senior unsecured basis by certain of WCI’s subsidiaries (collectively, the “Guarantors”). Each of the Guarantors is directly or indirectly owned 100% by WCI. There are no significant restrictions on the ability of any of the Guarantors to pay dividends, provide loans or otherwise make payments to WCI. Each of the Guarantors will be released and relieved of its guarantee obligations pertaining to the 2021 Notes: (i) in the event of a sale or other disposition of all of the assets of one or more of the Guarantors, by way of merger, consolidation or otherwise; (ii) upon designation of a Guarantor as an unrestricted subsidiary in accordance with the terms of the Indenture; (iii) in connection with the dissolution of a Guarantor under applicable law in accordance with the Indenture; (iv) upon release or discharge of the guarantee that resulted in the creation of such guarantee of the 2021 Notes; or (v) if WCI exercises its legal defeasance option or covenant defeasance option or if its obligations under the Indenture are discharged in accordance with the terms of the Indenture. Separate condensed consolidating financial statements of the Company are not provided herein because: (i) WCI has no independent assets or operations; (ii) the guarantees provided by the Guarantors are full and unconditional and joint and several; and (iii) the total assets, equity and operations of WCI’s non-guarantor subsidiaries are individually and in the aggregate minor.
The Indenture contains covenants, that limit, among other things, the Company’s ability and the ability of its Restricted Subsidiaries (as defined in the Indenture) to: (i) incur additional indebtedness; (ii) declare or pay dividends, redeem stock or make other distributions to holders of capital stock; (iii) make investments; (iv) create liens; (v) place restrictions on the ability of subsidiaries to pay dividends or make other payments to WCI; (vi) merge or consolidate, or sell, transfer, lease or dispose of substantially all of its assets; (vii) sell assets; and (viii) enter into transactions with affiliates. These covenants are subject to a number of important qualifications described in the Indenture.
The 2021 Notes bear interest at the rate of 6.875% per annum, payable semi-annually in arrears on February 15 and August 15 of each year. After considering debt issuance costs and the debt premium on the Supplemental 2021 Notes, the effective interest rate on the 2021 Notes was approximately 7.2% as of December 31, 2014. The 2021 Notes mature on August 15, 2021 at which time the entire $250.0 million of principal is due and payable. At any time on or after August 15, 2016, the 2021 Notes are redeemable at the Company’s option, in whole or in part, at the redemption prices set forth in the Indenture, plus accrued and unpaid interest. Prior to August 15, 2016, the Company may redeem the 2021 Notes, in whole or in part, at a redemption price equal to 100% of the principal amount of the notes being redeemed, plus the Applicable Premium (as defined in the Indenture) and accrued and unpaid interest. Moreover, prior to August 15, 2016, the Company may also redeem up to 35% of the aggregate principal amount of the 2021 Notes with the proceeds from certain equity offerings at a redemption price of 106.875% of the principal amount of the notes being redeemed, plus accrued and unpaid interest.
Upon the occurrence of any Change of Control (as defined in the Indenture), each holder of the 2021 Notes will have the right to require that the Company repurchase such holder’s notes at a purchase price equal to 101% of the principal amount thereof on the date of purchase, plus accrued and unpaid interest. Additionally, if the Company or one of its Restricted Subsidiaries sells certain assets, the Company generally must either: (i) invest any excess net cash proceeds from such sales in its business within a certain period of time; (ii) prepay senior secured debt or certain other debt; or (iii) prepay other senior debt and offer to purchase the 2021 Notes on a pro rata basis. The purchase price of the 2021 Notes in any such offer will be 100% of their principal amount, plus accrued and unpaid interest.
Term Loans. During June 2012, the Company issued the 2017 Notes (with a scheduled maturity in May 2017) in the aggregate principal amount of $125.0 million to its two largest shareholders or certain of their affiliates. All or a portion of the outstanding principal balance, along with a pre-determined prepayment premium, could be prepaid at any time prior to maturity. As noted above, the 2017 Notes were prepaid by the Company in their entirety during August 2013 at 101% of the principal amount, plus accrued and unpaid interest. The interest rate on the 2017 Notes was LIBOR plus 8.0%, subject to a 2.0% LIBOR floor, and was payable monthly. The 2017 Notes were issued at 98.0% of their stated face amount, resulting in $122.5 million in net proceeds. The combined net proceeds from the issuance of the 2017 Notes and an equity offering that we completed during June 2012 were used to prepay the entire outstanding principal of our $150.0 million Senior Subordinated Secured Term Loan (the “Subordinated Term Loan”) with a then outstanding principal balance of $162.4 million, including capitalized interest. The original debt discount on the 2017 Notes of $2.5 million and the related debt issuance costs of $2.5 million were being amortized as a component of interest expense over the term of the 2017 Notes using the effective interest method. In connection with the voluntary prepayment of the 2017 Notes, the Company recognized $5.1 million of expenses related to early repayment of debt during the year ended December 31, 2013, including the abovementioned prepayment premium of $1.2 million and write-offs of unamortized debt discount and deferred financing costs totaling $3.9 million.
86
Table of Contents
The Subordinated Term Loan had an initial principal amount of $150.0 million and was scheduled to mature in September 2016. All or a portion of the outstanding balance could be prepaid prior to maturity. Interest was payable-in-kind (“PIK”) by capitalizing interest payable to the principal amount outstanding on a monthly basis at LIBOR plus 7.0%, with a LIBOR floor of 3.0%, equating to a minimum effective interest rate of 10.0%. Capitalized PIK interest on the Subordinated Term Loan was $6.9 million during the year ended December 31, 2012. In connection with the Reorganization in 2009 (Note 1), as required under ASC 852, Reorganizations, we recorded the Subordinated Term Loan at fair value, which resulted in a debt discount of $22.5 million that was being amortized as a component of interest expense over the term of the Subordinated Term Loan using the effective interest method. In connection with the June 2012 prepayment of the Subordinated Term Loan, $17.0 million of unamortized debt issuance costs and debt discount was written-off during the year ended December 31, 2012. At the time of such prepayment, approximately 58% of the Subordinated Term Loan was held by the Company’s two largest shareholders or certain of their affiliates.
Unsecured Revolving Credit Facility. During August 2013, the Company entered into a four-year senior unsecured revolving credit facility (the “Revolving Credit Facility”), providing for a revolving line of credit of up to $75.0 million. Amounts outstanding under the Revolving Credit Facility will accrue interest, payable quarterly, at the Company’s option, at a rate equal to (i) the Base Rate plus 1.75% or (ii) the Eurodollar rate plus 2.75%. The Base Rate is equal to the highest of: (a) the Federal Funds Rate plus 1/2 of 1%; (b) the one month Eurodollar Rate plus 1.00%; or (c) the rate of interest in effect for such day as publicly announced from time to time by Citibank, N.A. as its “prime rate.” Under the Revolving Credit Facility, we must pay, among other things, (i) a commitment fee calculated at a per annum rate equal to 0.50% of the average daily unused portion of the commitment thereunder and (ii) a letter of credit usage fee.
The commitment under the Revolving Credit Facility is limited by a borrowing base calculation based on certain asset values as set forth in the underlying loan agreement. In addition, a portion of the Revolving Credit Facility (not to exceed $50.0 million) is available for the issuance of letters of credit. The Company has never borrowed under the Revolving Credit Facility. As of February 25, 2015, there were no limitations on the Company’s borrowing capacity under the Revolving Credit Facility, leaving the full amount of the line of credit available to us on such date.
The loan agreement underlying the Revolving Credit Facility contains customary negative covenants, including those limiting the Company’s ability to pay cash dividends on its common stock. Additionally, such loan agreement contains a requirement to maintain compliance with certain financial covenants, including: (i) a minimum consolidated interest coverage ratio or minimum liquidity; (ii) a maximum consolidated leverage ratio; and (iii) a minimum consolidated tangible net worth. The Revolving Credit Facility matures on August 27, 2017 and can be extended based on certain conditions.
Secured Revolving Credit Facility. During February 2013, WCI and WCI Communities, LLC (collectively, the “WCI Parties”) entered into a five-year $10.0 million bank loan secured by a first mortgage on a parcel of land and related amenity facilities comprising the Pelican Preserve Town Center (the “Town Center”) in Fort Myers, Florida. As of December 31, 2014, such collateral had a net book value of $5.5 million. The loan is also secured by the rights to certain fees and charges that the WCI Parties are to receive as the owners of the Town Center. During its initial 36 months, the loan is structured as a revolving credit facility (the “Revolver Phase”), convertible to a term loan for the remaining 24 months (the “Term Phase”). During the Revolver Phase, the WCI Parties may borrow and repay advances up to $10.0 million and have the right to issue standby letters of credit up to an aggregate amount of $5.0 million at any time. Each outstanding letter of credit will reduce the availability under the revolving credit facility. The interest rate during the Revolver Phase is a variable rate per annum equal to the bank’s prime rate, as published in the Wall Street Journal, plus 100 basis points, subject to a minimum interest rate floor of 4.0%. The interest rate during the Term Phase will be a fixed rate equal to the ask yield of the corresponding U.S. Treasury Bond for a term of five years, plus 300 basis points, subject to a minimum interest rate floor of 5.0%. During the Revolver Phase, the WCI Parties are required to pay an annual renewal fee and a non-use fee equal to 25 basis points based on the average unfunded portion of the loan. The WCI Parties have never borrowed under this secured credit facility; however, $2.0 million of letters of credit have been issued thereunder as of February 25, 2015, limiting the borrowing capacity on such date to $8.0 million.
The bank loan agreement governing the secured revolving credit facility contains covenants that, among other things, limit the ability of the WCI Parties to: (i) sell assets related to the Town Center project; (ii) enter into any merger unless WCI Communities, Inc. is the surviving entity; (iii) transfer control or ownership of WCI Communities, LLC; (iv) incur liens on the Town Center property; (v) waive, excuse or postpone the payment of any assessments related to the Town Center property; (vi) amend any agreement materially and adversely affecting the Town Center project; and (vi) amend, terminate, waive any provision of or modify any existing or future lease relating to the Town Center project, in each case, subject to certain exceptions.
Other. During the years ended December 31, 2013 and 2012, the Company recorded $0.2 million and $1.5 million, respectively, of interest expense related to the amortization of discounts on its debt arrangements. During the year ended December 31, 2014, there was a corresponding offset to interest expense in the amount of $0.1 million that was attributable to the amortization of a debt premium on the Supplemental 2021 Notes.
We have no principal debt maturities until the year ending December 31, 2021, at which time the entire $250.0 million outstanding balance under the 2021 Notes will be due and payable.
As of December 31, 2014, we were in compliance with all of the covenants contained in our debt agreements.
87
Table of Contents
| 11. | Fair Value Disclosures |
ASC 820, Fair Value Measurements (“ASC 820”), as amended, provides a framework for measuring the fair value of assets and liabilities and establishes a fair value hierarchy that requires an entity to maximize the use of observable inputs and minimize the use of unobservable inputs when measuring fair value. The fair value hierarchy can be summarized as follows:
| Level 1: | Fair value determined based on quoted prices in active markets for identical assets or liabilities. The fair value hierarchy gives the highest priority to Level 1 inputs. | |
| Level 2: | Fair value determined based on using significant observable inputs, such as quoted prices for similar assets or liabilities or quoted prices for identical assets or liabilities in markets that are not active, inputs other than quoted prices that are observable for the asset or liability, or inputs that are derived principally from or corroborated by observable market data, by correlation or other means. | |
| Level 3: | Fair value determined using significant unobservable inputs, such as pricing models, discounted cash flows or similar techniques. The fair value hierarchy gives the lowest priority to Level 3 inputs. | |
The carrying values and estimated fair values of our financial liabilities are summarized in the table below, except for those liabilities for which the carrying values approximate their fair values.
| December 31, 2014 | December 31, 2013 | |||||||||||||||
| Carrying | Estimated | Carrying | Estimated | |||||||||||||
| Value | Fair Value | Value | Fair Value | |||||||||||||
| (in thousands) | ||||||||||||||||
| Senior Notes due 2021 |
$ | 251,179 | $ | 251,875 | $ | 200,000 | $ | 199,000 | ||||||||
| Community development district obligations |
39,965 | 44,010 | 7,271 | 8,447 | ||||||||||||
The estimated fair values of our debt and community development district obligations were derived from quoted market prices by independent dealers (Level 2).
There were no financial instruments—assets or liabilities—measured at fair value on a recurring or nonrecurring basis in the accompanying consolidated balance sheets.
The majority of our nonfinancial assets, which include real estate inventories, property and equipment and goodwill, are not required to be measured at fair value on a recurring basis. However, if certain events occur, such that a nonfinancial asset is required to be evaluated for impairment, the resulting effect would be to record the nonfinancial asset at the lower of cost or fair value, determined primarily through the use of Level 3 inputs.
The Company did not have any nonfinancial assets that were written down to fair value as the result of an impairment charge during the years ended December 31, 2013 and 2012. However, during the year ended December 31, 2014, the Company recorded a $1.2 million asset impairment charge, primarily using Level 3 inputs under the GAAP fair value hierarchy (Note 5).
The carrying amounts reported for cash and cash equivalents, restricted cash, notes and accounts receivable, other assets, accounts payable, customer deposits and accrued expenses and other liabilities were estimated to approximate their fair values.
| 12. | Income Taxes |
Generally, the discharge of a debt obligation by a debtor for an amount less than the adjusted issue price creates cancellation of indebtedness (“COD”) income, which must be included in the debtor’s income. However, COD income is not recognized by a taxpayer that is a debtor in a reorganization case if the discharge is granted by the court or pursuant to a plan of reorganization approved by the U.S. Bankruptcy Court for the District of Delaware. The Reorganization (Note 1) enabled the Debtors to qualify for this bankruptcy exclusion rule. As a result, the COD income, triggered upon emergence from bankruptcy, has not been included in the taxable income of the Debtors. However, certain income tax attributes, otherwise available and of value to a debtor, are reduced by the amount of COD income. The prescribed order of attribute reduction is defined by Section 108 of the Internal Revenue Code of 1986, as amended (the “IRC”). In brief, the order of reduction is as follows: (i) net operating losses (“NOLs”) for the year of discharge and NOL carryforwards; (ii) most credit carryforwards, including the general business credit and the alternative minimum tax credit; (iii) net capital losses for the year of discharge and capital loss carryforwards; and (iv) the tax basis of the debtor’s assets.
88
Table of Contents
Section 382 of the IRC (“Section 382”) imposes an annual limitation on our use of NOLs and certain tax credit carryforwards existing at the effective date of the Reorganization. Section 382 also limits the recognition of built-in losses in existence as of the date of an ownership change to the extent that a company is in an overall net unrealized built-in loss position as of that date. Generally, the annual limitation is equal to the value of the stock immediately before the ownership change, multiplied by the long-term tax-exempt rate (i.e., the highest of the adjusted Federal long-term rates in effect for any month in the three calendar month period ending with the calendar month in which the change date occurs). Companies subject to multiple limitations are limited by the lower limitation in effect for the period in question. We underwent an ownership change on December 31, 2008 and again on September 3, 2009 when we emerged from bankruptcy. Under Section 382, we were subject to annual limitations of approximately $85,000 for the ownership change on December 31, 2008 and $10.5 million for the ownership change on September 3, 2009. We were also in a net unrealized built-in loss position as of both of those dates. As such, any built-in losses recognized during the five-year period following those ownership change dates have been significantly limited. As of December 31, 2013, the Company was no longer subject to the built-in loss limitation associated with the ownership change on September 3, 2009 because the Company previously reached the maximum limitation with respect thereto.
The significant components of the Company’s income tax expense (benefit) are summarized in the table below.
| Years Ended December 31, | ||||||||||||
| 2014 | 2013 | 2012 | ||||||||||
| (in thousands) | ||||||||||||
| Current: |
||||||||||||
| Federal |
$ | 43 | $ | 13 | $ | (52,056 | ) | |||||
| State |
(374 | ) | (76 | ) | 9 | |||||||
|
|
|
|
|
|
|
|||||||
| Current income taxes from continuing operations |
(331 | ) | (63 | ) | (52,047 | ) | ||||||
|
|
|
|
|
|
|
|||||||
| Deferred: |
||||||||||||
| Federal |
13,342 | (113,916 | ) | (139 | ) | |||||||
| State |
1,641 | (11,730 | ) | (47 | ) | |||||||
|
|
|
|
|
|
|
|||||||
| Deferred income taxes from continuing operations |
14,983 | (125,646 | ) | (186 | ) | |||||||
|
|
|
|
|
|
|
|||||||
| Income tax expense (benefit) from continuing operations |
14,652 | (125,709 | ) | (52,233 | ) | |||||||
| Income tax expense from discontinued operations |
— | — | 77 | |||||||||
| Income tax expense from sales of discontinued operations |
— | — | 1,677 | |||||||||
|
|
|
|
|
|
|
|||||||
| Consolidated income tax expense (benefit), net |
$ | 14,652 | $ | (125,709 | ) | $ | (50,479 | ) | ||||
|
|
|
|
|
|
|
|||||||
After excluding the net loss attributable to noncontrolling interests, which is not tax-effected in the Company’s consolidated financial statements, our effective income tax rate for continuing operations was 40.4% during 2014. Such rate was higher than the customary blended federal and state income tax rate primarily due to certain permanent differences, including non-deductible stock-based compensation expense, partially offset by (i) a reduction in the Company’s deferred tax asset valuation allowances and (ii) the recognition of a state tax refund receivable pertaining to a prior period. Due to the effects of changes in the Company’s deferred tax asset valuation allowances and unrecognized income tax benefits, our effective income tax rates for continuing operations during the years ended December 31, 2013 and 2012 were not meaningful as the income tax benefits for such years did not directly correlate to the Company’s income (loss) from continuing operations before income taxes. The items that caused the Company’s income tax rates to differ from the statutory federal income tax rate of 35.0% are summarized in the table below.
| Years Ended December 31, | ||||||||||||
| 2014 | 2013 | 2012 | ||||||||||
| (in thousands) | ||||||||||||
| Expected taxes computed at the federal statutory rate |
$ | 12,687 | $ | 7,329 | $ | (1,447 | ) | |||||
| State income tax expense (benefit), net of federal effect |
1,373 | 708 | (94 | ) | ||||||||
| Unrecognized tax benefit |
— | — | (50,498 | ) | ||||||||
| Valuation allowances |
(480 | ) | (133,054 | ) | (15,755 | ) | ||||||
| Deferred tax adjustments |
(33 | ) | (21 | ) | 12,629 | |||||||
| Changes in deferred tax rate |
95 | (131 | ) | 668 | ||||||||
| Permanent differences, net |
1,010 | (453 | ) | 354 | ||||||||
| Other |
— | (87 | ) | 1,910 | ||||||||
|
|
|
|
|
|
|
|||||||
| Income tax expense (benefit) from continuing operations |
$ | 14,652 | $ | (125,709 | ) | $ | (52,233 | ) | ||||
|
|
|
|
|
|
|
|||||||
89
Table of Contents
The Company and its subsidiaries file consolidated federal and combined state income tax returns. The Company remains subject to federal income tax examination for the years ended December 31, 2014, 2013 and 2012 and state income tax examination in various jurisdictions, including Florida, for the years 2011 through 2014.
Deferred income taxes reflect the net tax effects of temporary differences between the carrying amounts of assets and liabilities for financial reporting purposes and the amounts used for income tax purposes. The tax effects of significant temporary differences that give rise to the Company’s deferred tax assets and liabilities are summarized in the table below.
| December 31, | ||||||||
| 2014 | 2013 | |||||||
| (in thousands) | ||||||||
| Deferred tax assets: |
||||||||
| Net operating losses |
$ | 116,777 | $ | 116,348 | ||||
| Real estate inventories |
50,522 | 66,823 | ||||||
| Acquisition intangibles |
10,575 | 10,534 | ||||||
| Investments in unconsolidated joint ventures |
3,318 | 3,379 | ||||||
| Property and equipment, net |
3,157 | 2,937 | ||||||
| Warranties and other accrued expenses |
1,966 | 1,634 | ||||||
| Stock-based compensation expense |
1,408 | 2,016 | ||||||
| Other |
185 | 146 | ||||||
|
|
|
|
|
|||||
| Deferred tax assets, before valuation allowances |
187,908 | 203,817 | ||||||
| Valuation allowances |
(70,501 | ) | (70,981 | ) | ||||
|
|
|
|
|
|||||
| Deferred tax assets, after valuation allowances |
117,407 | 132,836 | ||||||
|
|
|
|
|
|||||
| Deferred tax liabilities: |
||||||||
| Deferred revenue and income |
(2,668 | ) | (2,934 | ) | ||||
| Acquisition intangibles |
(2,705 | ) | (2,667 | ) | ||||
| Community development district obligation discounts |
(921 | ) | (536 | ) | ||||
| Investments in unconsolidated joint ventures |
(290 | ) | (1,053 | ) | ||||
|
|
|
|
|
|||||
| Deferred tax liabilities |
(6,584 | ) | (7,190 | ) | ||||
|
|
|
|
|
|||||
| Net deferred tax assets |
$ | 110,823 | $ | 125,646 | ||||
|
|
|
|
|
|||||
Upon our emergence from bankruptcy on September 3, 2009, we adopted fresh-start accounting. However, our predecessor company was subject to multiple limitations under Section 382 that affected us as a successor entity. Additionally, the downturn in the housing market from 2006 to 2010, uncertainty as to its length and magnitude, and the Company’s operating losses provided significant and persuasive negative evidence that some or all of the Company’s net deferred tax assets would not be realized. Because of these factors and the weight of other negative evidence at the time, the Company historically maintained a full valuation allowance for its net deferred tax assets since it emerged from bankruptcy.
As discussed in Note 2, ASC 740 requires a company to assess the adequacy of its valuation allowance for some or all of its deferred tax assets based on consideration of all of the available evidence, using a “more-likely-than-not” standard. In accordance with ASC 740 and our own accounting practices, we evaluate our net deferred tax assets, including the benefit from NOLs and certain tax credit carryforwards, on a quarterly basis to determine the adequacy of our valuation allowance. As of December 31, 2013, we considered the need for a valuation allowance for the Company’s deferred tax assets in light of all of the then-available objectively verifiable positive and negative evidence. Among other things, that evidence included: (i) an indication that the events and conditions that gave rise to significant annual and cumulative operating losses in recent years were unlikely to recur in the foreseeable future; (ii) the Company’s return to profitability during the year ended December 31, 2012; (iii) projections of the Company’s net income and the generation of taxable income during the year ending December 31, 2014 and beyond, supported, in part, by an existing contractual backlog of home sales; (iv) the remaining federal and Florida statutory carryforward periods attributable to the Company’s NOLs; (v) the nature, character, amount, jurisdiction and expected timing of the reversal of certain deferred tax assets in relation to the reversal of recognized deferred tax liabilities; and (vi) improved conditions in the macroeconomic environment and the homebuilding industry, all of which provided positive evidence that it was more-likely-than-not that certain of the Company’s deferred tax assets as of December 31, 2013 would be realized in the future.
90
Table of Contents
As of December 31, 2013, we determined that the deferred tax asset valuation allowance on certain of the Company’s federal and Florida deferred tax assets were no longer needed. Accordingly, the Company reversed $125.6 million of its deferred tax asset valuation allowances during the quarter and year ended December 31, 2013 and such amount has been included as a component of the income tax benefit from continuing operations in the accompanying consolidated statements of operations. Based on similar analyses performed during 2014, the Company reversed an additional $0.5 million of its valuation allowances. The remaining valuation allowance of $70.5 million at December 31, 2014 primarily related to (i) potential Section 382 and similar state limitations for federal and Florida income and franchise tax purposes and (ii) certain states other than Florida where the more-likely-than-not realization threshold criteria has not been met. Prospectively, we will continue to review the Company’s deferred tax assets and the related valuation allowance in accordance with ASC 740 on a quarterly basis.
As of December 31, 2014, we had (i) $303.9 million of NOL carryforwards for federal income tax purposes and (ii) $278.4 million of NOL carryforwards for Florida income and franchise tax purposes. Substantially all of our federal and Florida NOL carryforwards begin to expire in 2029. As of December 31, 2014, $163.2 million and $143.2 million of our federal and Florida NOL carryforwards, respectively, are each subject to an $85,000 annual limitation. The Company’s other federal and Florida NOL carryforwards are not currently subject to limitation under Section 382 or any similar state statute.
A rollforward of the Company’s unrecognized income tax benefits for the year ended December 31, 2012 is presented in the table below (in thousands). No corresponding rollforward tables are necessary for the years ended December 31, 2014 and 2013.
| Balance at January 1, 2012 |
$ | 45,451 | ||
| Changes for tax positions of prior years |
(45,451 | ) | ||
|
|
|
|||
| Balance at December 31, 2012 |
$ | — | ||
|
|
|
During 2008 and 2009, we recorded reserves related to unrecognized income tax benefits and a related income tax receivable for positions taken on the Company’s federal income tax returns. We had substantial authority for the tax positions claimed on the tax returns and the related NOL carrybacks but we did not believe that those positions rose to the “more-likely-than-not” threshold for purposes of financial statement recognition. During the year ended December 31, 2012, we successfully completed an audit by the Internal Revenue Service pertaining to the 2003 to 2008 tax years and, as a result thereof, we recognized a related tax benefit of $50.5 million associated with the underlying tax positions during 2012.
The Company recognizes interest and penalties related to unrecognized income tax benefits in its provision for income taxes; however, there were no such amounts during the years ended December 31, 2014, 2013 and 2012.
During the year ended December 31, 2013, the Company received a federal income tax refund of $16.8 million that was previously recognized as an income tax receivable at December 31, 2012.
| 13. | Commitments and Contingencies |
We lease office facilities, sales offices and equipment under cancelable and non-cancelable lease arrangements. Certain of our lease agreements provide standard renewal options and recurring escalations of lease payments for, among other things, increases in the lessors’ maintenance costs and taxes. Future minimum payments under non-cancelable leases having an initial or remaining term in excess of one year are summarized in the table below (in thousands).
| Years Ending December 31, |
||||
| 2015 |
$ | 5,927 | ||
| 2016 |
3,456 | |||
| 2017 |
2,171 | |||
| 2018 |
1,435 | |||
| 2019 |
854 | |||
| Thereafter |
442 | |||
|
|
|
|||
| Total minimum payments |
$ | 14,285 | ||
|
|
|
|||
Rent expense was $6.2 million, $5.8 million and $5.3 million during the years ended December 31, 2014, 2013 and 2012, respectively.
91
Table of Contents
Standby letters of credit and surety bonds (performance and financial), issued by third-party entities, are used to guarantee our performance under various land development and construction agreements, land purchase obligations, escrow agreements, financial guarantees and other arrangements. As of December 31, 2014, we had $2.3 million of outstanding letters of credit. Performance bonds do not have stated expiration dates; rather, we are released from the bonds as the contractual performance is completed. Our performance and financial bonds, which totaled $37.7 million as of December 31, 2014, are typically outstanding over a period of approximately one to five years or longer, depending on, among other things, the pace of development. Our estimated exposure on the outstanding performance and financial bonds as of December 31, 2014 was $21.7 million, primarily based on development remaining to be completed.
In accordance with various amenity and equity club documents, we operate certain facilities until control of the amenities is transferred to the membership. Additionally, we are required to fund (i) the cost of constructing club facilities and acquiring related equipment and (ii) operating deficits prior to turnover. We do not currently believe that these obligations will have a material adverse effect on our consolidated financial condition, results of operations or cash flows.
We may be responsible for funding certain condominium and homeowner association deficits in the ordinary course of business.
We maintain a 51.0% ownership interest in Pelican Landing Timeshare Ventures Limited Partnership (“Pelican Landing”), which operates multi-family timeshare units in Bonita Springs, Florida. As the noncontrolling interest has substantive participating rights relating to operating decisions at the joint venture, we account for our investment in Pelican Landing under the equity method. Because Pelican Landing has incurred cumulative net losses since 2010 and a return to profitability is not assured, we have discontinued applying the equity method for our share of its net losses and reduced our carrying value for such investment to zero. As of December 31, 2014 and 2013, the carrying value of our investment in such joint venture was less than our ownership share of the capital on the partnership’s books by $3.6 million and $4.4 million, respectively. In the future, we may be required to make additional cash contributions to the joint venture to avoid the loss of some or all of our ownership interest. Moreover, although Pelican Landing does not have outstanding debt, the partners may agree to incur debt to fund partnership operations in the future. We do not currently believe that our incremental cash requirements for Pelican Landing, if any, will have a material adverse effect on our consolidated financial condition, results of operations or cash flows.
Legal Proceedings
The Company and certain of its subsidiaries have been named as defendants in various claims, complaints and other legal actions arising in the normal course of business. In the opinion of management, the outcome of these matters will not have a material adverse effect on the Company’s consolidated financial condition, results of operations or cash flows. However, it is possible that future results of operations for any particular quarterly or annual period could be materially affected by changes in our estimates and assumptions pertaining to these proceedings or the ultimate resolution of related litigation.
One pending proceeding was brought by the Lesina at Hammock Bay Condominium Association, Inc. (the “Lesina Association”), alleging construction defects and other matters. This pending proceeding was originally filed as a proof of claim in our bankruptcy proceedings (Note 1) during February 2009 in an unliquidated amount. The Company asserted that all prepetition claims for construction defects were barred by the plan of reorganization and bankruptcy discharge. During May 2013, the Lesina Association received permission from the U.S. Bankruptcy Court for the District of Delaware in Wilmington to file a state court action for statutory warranty claims and assessment claims without violating the plan of reorganization and bankruptcy discharge. During May 2013, the Company filed a Notice of Appeal of the decision with the U.S. District Court for the District of Delaware and, in July 2013, the Lesina Association filed its state court action in the Circuit Court of the Twentieth Judicial Circuit in and for Collier County, Florida. Such lawsuit includes the general contractor, architect and several subcontractors as parties who may be liable to the Lesina Association. We dispute the allegations made in this action and are vigorously defending this action. A tentative trial court date is scheduled for December 1, 2015. We are unable to estimate the amount of any potential loss because of the nature of the claims and the number of parties who are, or may be, liable to the Lesina Association; however, we believe that any potential losses related to this matter will not be material to our consolidated financial condition, results of operations and cash flows.
| 14. | Shareholders’ Equity |
Common Stock. In connection with the Reorganization (Note 1), Series A, B, C and D common stock were established with each series representing individual equity ownership interests of our largest secured creditors at that time. All other existing shareholders at that time received nonseries common stock. During May 2012, we offered the holders of our Series A, B, C and D and nonseries common stock the right to purchase their respective pro rata share of 7,923,069 shares of our newly issued Series E common stock (the “Equity Offering”). The Equity Offering was consummated on June 8, 2012 and we ultimately received net proceeds of $48.3 million. The combined net proceeds from the Equity Offering and the issuance of the 2017 Notes were used to prepay the entire outstanding principal of the Subordinated Term Loan (Note 10).
92
Table of Contents
On July 22, 2013, the Company filed with the Secretary of State of the state of Delaware an amendment to its then existing amended and restated certificate of incorporation to, among other things, effectuate (i) a 10.3 for 1 stock split of its common stock and (ii) an increase of its authorized capital stock to 150,000,000 shares of common stock. Additionally, on July 24, 2013, the Company filed with the Secretary of State of the state of Delaware a new amended and restated certificate of incorporation, which, among other things, converted all of its Series A, B, C, D and E common stock into a single class of common stock. All share and per share amounts of the Company’s common stock have been retroactively adjusted in the accompanying consolidated financial statements and notes to reflect the common stock split, the new authorized share amounts and the conversion of our Series A, B, C, D and E common stock into a single class of common stock.
The holders of series and nonseries common stock had equal rights with respect to dividends and liquidation. Each of the Series A through E common stock had the right to nominate and elect one member to our Board of Directors; the holders of nonseries common stock did not have such rights.
During July 2013, the Company completed its Initial Public Offering and issued 6,819,091 shares of common stock (Note 1).
Preferred Stock. In connection with the Reorganization (Note 1), shares of Series A and Series B preferred stock were issued to certain creditors. With respect to such preferred stock, we (i) exchanged 903,825 shares of our common stock (valued at $19.0 million) for 10,000 outstanding shares of our Series A preferred stock during July 2013 and (ii) paid $0.7 million in cash to purchase the one outstanding share of our Series B preferred stock during April 2013. All such shares of preferred stock, which were carried at a nominal value on our consolidated balance sheets, have been cancelled and retired. In accordance with ASC 260, Earnings Per Share, paragraph 10-S99-2, any difference between the consideration transferred to our preferred stock shareholders and the corresponding book value has been (i) characterized as a preferred stock dividend in the accompanying consolidated statements of operations during the year that the related transaction was completed and (ii) deducted from net income attributable to WCI Communities, Inc. to arrive at net income attributable to common shareholders of WCI Communities, Inc. for purposes of calculating earnings per share. The preferred stock dividend related to the retirement of our Series A preferred stock did not have an impact on our total equity because the liquidating dividend reduced additional paid-in capital by the same amount as the common stock issued in exchange for the Series A preferred stock.
The preferred stock had no liquidation preferences and was neither redeemable by the holder or the Company nor convertible into shares of our series or nonseries common stock. The rights of the Series A preferred shareholders included, among other things, the right to receive shares of our common stock in the form of a stock dividend each time we achieved a predetermined level of prepetition lender recovery. Additionally, the Series A preferred shareholders had the right to nominate and elect one additional member to our Board of Directors if certain conditions were met.
| 15. | Stock-Based and Other Non-Cash Long-Term Incentive Compensation |
2010 Equity Plan. During March 2010, we adopted the WCI Communities, Inc. Long Term Equity Incentive Plan (the “2010 Equity Plan”). The 2010 Equity Plan was approved by our shareholders and is administered by the Compensation Committee of our Board of Directors. The 2010 Equity Plan authorizes awards to key employees, officers, non-employee directors and consultants. We believe that such awards provide a means of performance-based compensation to attract and retain qualified employees and better align the interests of our employees with those of our shareholders. The 2010 Equity Plan allows us the flexibility to grant or award shares of the Company’s common stock, stock options, stock appreciation rights, restricted stock awards and other stock-based awards to eligible individuals. During 2010, the Company granted several officers and directors shares of restricted stock under the 2010 Equity Plan, subject to a service requirement with vesting over a period of approximately two and one-half years from the date of grant. As of December 31, 2012, all such shares were fully vested.
During November 2012, an officer of the Company was granted 77,250 shares of restricted stock under the 2010 Equity Plan. The market price of the shares was determined based on the most recent private transactions involving the Company’s common stock in the secondary market. The shares are subject to a service requirement, with: (i) 25,750 shares that vested immediately on the date of grant; (ii) 25,750 shares that vested on November 29, 2014 (the second anniversary of the date of grant); and (iii) 25,750 shares that will vest on December 1, 2015 (the third anniversary of the date of grant), assuming continuous employment by the sole remaining 2010 Equity Plan participant.
During November 2012, an officer of the Company was also granted 77,250 at-the-money nonqualified stock options under the 2010 Equity Plan with an exercise price of $6.31 per share and a contractual term of ten days. All such options vested on the grant date. The grant date fair value of the nonqualified stock option award, calculated using the Black-Scholes option-pricing model, was not significant. As a result, no compensation expense was recorded for the stock option award during the year ended December 31, 2012. The nonqualified stock option award was exercised in full within its contractual term and, as a result, the Company received $0.5 million of proceeds during the year ended December 31, 2012.
93
Table of Contents
2013 Long Term Incentive Plans for Key Management and Directors. During January 2013, we adopted the WCI Communities, Inc. 2013 Long Term Incentive Plan for key management personnel and the WCI Communities, Inc. 2013 Director Long Term Incentive Plan for non-employee directors of the Company’s Board of Directors (collectively, the “Original Plans”) and granted 770 and 80 awards, respectively, under those plans to eligible participants. Those plans were approved by our shareholders. A total of 1,000 awards were available to be issued to key management personnel and 80 awards to non-employee directors. The purpose of the Original Plans was to attract and retain key management personnel and non-employee directors and provide such persons with increased interest in the Company’s success through the granting of awards. The awards granted during January 2013 were scheduled to vest over a five-year period ending December 31, 2017 and each vested award entitled the holder to receive a cash payment based on the future appreciation of the Company’s common stock, contingent upon the earlier occurrence of either of the following events (each a “Payment Event”): (i) a change in control, as defined in the Original Plans, or (ii) the five-year anniversary of the Original Plans. The Original Plans terminate immediately following a Payment Event, unless terminated earlier.
In accordance with the definition of fair value under ASC 718, Compensation—Stock Compensation (“ASC 718”), the aggregate grant date fair value of the awards under the Original Plans was estimated using a Monte Carlo simulations-based option price model with the following inputs: expected volatility, risk-free interest rate, expected life, dividend yield and the weighted average per share price of the Company’s common stock. The fair value of such awards was classified as a liability pursuant to ASC 718 due to the awards’ cash-settlement feature. The Company was required to remeasure the liability at each reporting date and recognize compensation expense for the period so that the total inception-to-date recognized compensation expense equaled the equivalent portion of the liability based on the requisite service period rendered as of the reporting date.
During June 2013, the Company amended the Original Plans (as amended, collectively, the “2013 Amended LTIP Plans”), effective immediately following the Initial Public Offering (Note 1). Under the terms of the 2013 Amended LTIP Plans, in lieu of a cash payment based on the future appreciation of the Company’s common stock, as provided under the Original Plans, eligible participants and non-employee directors received deferred stock awards pursuant to which they are eligible to receive approximately 1,090.6 shares of our common stock for each award granted under the Original Plans. The 2013 Amended LTIP Plans also reduced the number of awards available to be issued to key management personnel from 1,000 to 770.
The table below presents the vesting schedule of the deferred stock awards, subject to certain accelerated vesting conditions, under the 2013 Amended LTIP Plans.
| Vesting Date |
Key Management Personnel |
Non-Employee Directors |
||||||
| Day following the Initial Public Offering |
25.00 | % | 25.00 | % | ||||
| December 31, 2013 (1) |
15.00 | % | — | |||||
| December 31, 2014 |
15.00 | % | 18.75 | % | ||||
| December 31, 2015 |
15.00 | % | 18.75 | % | ||||
| December 31, 2016 |
15.00 | % | 18.75 | % | ||||
| December 31, 2017 |
15.00 | % | 18.75 | % | ||||
| (1) | Subject to the terms and conditions of the 2013 Amended LTIP Plans, the awards that vested on December 31, 2013 will be forfeited by a participant upon termination without good reason. As a result, we have assumed a vesting date of December 31, 2017 in our accounting for the related stock-based compensation expense. No other scheduled vesting dates have this limitation and, therefore, the underlying shares are deemed to be earned on each such date. |
In accordance with ASC 718, the abovementioned award modification has been accounted for as the grant of an equity award in settlement of a liability. The related liability was reclassified to additional paid-in capital at the modification date and the modified awards are now being accounted for as equity awards. Under ASC 718, non-vested shares are valued at the fair value of the shares on the modification date if vesting is based on a service or performance condition. Accordingly, the fair value of the 927,000 non-vested shares subject to deferred stock awards under the 2013 Amended LTIP Plans was the market price of such shares on the modification date, which aggregated $14.5 million.
2013 Equity Plan. During June 2013, the Company adopted the WCI Communities, Inc. 2013 Incentive Award Plan (the “2013 Equity Plan”), effective as of June 28, 2013. The 2013 Equity Plan was approved by our shareholders and is administered by the Compensation Committee of our Board of Directors. The principal purpose of the 2013 Equity Plan is to attract, retain and motivate selected employees, consultants and directors through the granting of stock-based compensation awards and cash-based performance bonus awards. The 2013 Equity Plan is also designed to permit us to make equity-based awards and cash-based awards intended to qualify as “performance-based compensation” under Section 162(m) of the Internal Revenue Code of 1986, as amended. The 2013 Equity Plan allows us the flexibility to grant a variety of stock-based compensation awards, including stock options, stock appreciation rights, restricted stock, restricted stock units, deferred stock, deferred stock units, dividend equivalents, stock payments, performance awards and other stock-based and cash-based awards. The 2013 Equity Plan will expire on, and no option or other award will be granted thereunder, after the tenth anniversary of its effective date.
94
Table of Contents
During July 2013, the Company granted restricted stock awards for 49,600 shares of our common stock under the 2013 Equity Plan to certain key employees. Those awards either (i) vested on the six month anniversary of the date of grant of the award or (ii) will vest, assuming continuous employment with us, on the second anniversary of the date of grant of the award. During February 2014, the Company granted restricted stock awards to senior executive officers, key managers and independent directors. Underlying those awards were 117,007 shares of the Company’s common stock that will vest in their entirety on either the third anniversary of the date of grant of the award (106,375 shares) or the first business day immediately prior to the Company’s 2015 Annual Meeting of Stockholders (10,632 shares) if the individual remains an employee or independent director of the Company.
General. Certain information regarding our stock-based compensation plans as of December 31, 2014 is summarized in the table below.
| Stock-Based Compensation Plan |
Number of Shares Authorized |
Number of Shares Available For Award |
||||||
| 2010 Equity Plan (1) |
1,174,014 | 758,399 | ||||||
| 2013 Amended LTIP Plans (1) |
927,000 | — | ||||||
| 2013 Equity Plan |
2,060,000 | 1,898,116 | ||||||
|
|
|
|
|
|||||
| Totals |
4,161,014 | 2,656,515 | ||||||
|
|
|
|
|
|||||
| (1) | We expect that no further grants will be made under the 2010 Equity Plan and the 2013 Amended LTIP Plans. |
The Company’s policy is to issue new shares of common stock to satisfy stock option exercises and other stock-based compensation arrangements. If an award granted under a stock-based plan is forfeited, expires, terminates or is otherwise satisfied without the delivery of shares of common stock to the plan participant, then the underlying shares will generally become available again for award under the affected plan.
Deferred stock is a right to receive shares of common stock upon fulfillment of specified conditions. Restricted stock represents shares of common stock that preserve the rights of ownership for the holder but are subject to restrictions on transfer and risk of forfeiture until fulfillment of specified conditions. The Company’s specified condition for vesting is typically continuous employment, subject to certain accelerated vesting conditions. With respect to deferred stock, at the completion of the vesting period or at a later date specified in the grant agreement, common stock is issued to the grantee.
Deferred stock and restricted stock activity for the Company’s stock-based compensation plans is summarized in the table below.
| Shares | Weighted Average Grant Date Fair Values |
|||||||||||||||
| Deferred | Restricted | Deferred | Restricted | |||||||||||||
| Stock | Stock | Stock | Stock | |||||||||||||
| Balances at January 1, 2012 (non-vested) |
— | 95,636 | $ | — | $ | 9.17 | ||||||||||
| Granted |
— | 77,250 | — | 6.31 | ||||||||||||
| Vested |
— | (114,001 | ) | — | 8.52 | |||||||||||
| Forfeited |
— | (7,385 | ) | — | 9.17 | |||||||||||
|
|
|
|
|
|||||||||||||
| Balances at December 31, 2012 (non-vested) |
— | 51,500 | — | 6.31 | ||||||||||||
| Granted |
927,000 | 49,600 | 15.59 | 15.00 | ||||||||||||
| Vested |
(231,750 | ) | — | 15.59 | — | |||||||||||
| Forfeited |
— | (453 | ) | — | 15.00 | |||||||||||
|
|
|
|
|
|||||||||||||
| Balances at December 31, 2013 (non-vested) |
695,250 | 100,647 | 15.59 | 10.55 | ||||||||||||
| Granted |
— | 117,007 | — | 18.65 | ||||||||||||
| Vested |
(142,322 | ) | (55,412 | ) | 15.59 | 10.96 | ||||||||||
| Forfeited |
— | (4,270 | ) | — | 16.94 | |||||||||||
|
|
|
|
|
|||||||||||||
| Balances at December 31, 2014 (non-vested) |
552,928 | 157,972 | 15.59 | 16.23 | ||||||||||||
|
|
|
|
|
|||||||||||||
95
Table of Contents
During February 2015, the Company granted new restricted stock awards to senior executive officers, key managers and independent directors. Underlying those awards were 144,824 shares of the Company’s common stock that will vest in their entirety on either the third anniversary of the date of grant of the award (134,800 shares) or the first business day immediately prior to the Company’s 2016 Annual Meeting of Stockholders (10,024 shares) if the individual remains an employee or independent director of the Company.
The aggregate intrinsic value of restricted stock issued during the years ended December 31, 2014 and 2012 was $1.0 million and $0.7 million, respectively. The aggregate grant date fair value of restricted stock awards that vested during such years was $0.6 million and $1.0 million, respectively. In connection with the adoption of the 2013 Amended LTIP Plans, deferred stock awards with an aggregate grant date fair value of $3.6 million vested during the year ended December 31, 2013; however, the underlying shares (with an intrinsic value of $3.6 million on the date of vesting) will not be issued to the plan participants until January 2018 and February 2018. The aggregate grant date fair value for similarly situated deferred stock awards under the 2013 Amended LTIP Plans that vested during the year ended December 31, 2014 was $2.2 million (with an intrinsic value of $2.8 million on the date of vesting).
ASC 718 requires that the fair value of all share-based payments to employees and directors be measured on their grant date and either recognized as expense in the statement of operations over the requisite service period or, if appropriate, capitalized and amortized. During the years ended December 31, 2014, 2013 and 2012, the Company recorded $3.4 million, $5.2 million and $0.7 million, respectively, of expense for all of its stock-based and other non-cash long-term incentive compensation programs in selling, general and administrative expenses in the accompanying consolidated statements of operations. The Company has not capitalized any such compensation amounts. For awards with service-only vesting conditions and a graded vesting schedule, stock-based compensation expense is generally recognized on a straight-line basis over the requisite service period of the entire award, which is typically aligned with the underlying stock-based award’s vesting period. Compensation expense for deferred stock and restricted stock awards is based on the fair value (i.e., generally, the market price) of the underlying stock on the date of grant. As of December 31, 2014, there was $9.0 million of unrecognized compensation cost attributable to non-vested deferred stock and restricted stock awards. Such cost is expected to be recognized on a straight-line basis over the remaining requisite service period for each award, the weighted average of which is approximately 2.8 years.
As a result of the Company’s tax position, which is discussed in Note 12, no income tax benefits for stock-based and other non-cash long-term incentive compensation expense were recognized in the accompanying consolidated statements of operations during the year ended December 31, 2012. However, $2.0 million of the reversal of the Company’s deferred tax asset valuation allowances during the year ended December 31, 2013 was attributable to such 2013 compensation expense. During the year ended December 31, 2014, the Company recognized $0.4 million of income tax expense in connection with its stock-based compensation arrangements. Other than increases in its net operating loss carryforwards and/or reductions in current period taxable income, the Company realized no income tax benefits from the exercise of stock options or the issuance of restricted stock during the three-year period ended December 31, 2014.
| 16. | Earnings (Loss) Per Share |
Basic earnings (loss) per share is computed based on the weighted average number of outstanding common shares. Diluted earnings (loss) per share is computed based on the weighted average number of outstanding common shares plus the dilutive effect of common stock equivalents, computed using the treasury stock method.
96
Table of Contents
The table below sets forth the computations of basic and diluted earnings per share attributable to the common shareholders of WCI Communities, Inc.
| Years Ended December 31, | ||||||||||||
| 2014 | 2013 | 2012 | ||||||||||
| (in thousands, except per share amounts) | ||||||||||||
| Income from continuing operations |
$ | 21,384 | $ | 146,485 | $ | 47,928 | ||||||
| Net loss from continuing operations attributable to noncontrolling interests |
213 | 163 | 189 | |||||||||
| Preferred stock dividends |
— | (19,680 | ) | — | ||||||||
|
|
|
|
|
|
|
|||||||
| Income attributable to common shareholders of WCI Communities, Inc. before discontinued operations |
21,597 | 126,968 | 48,117 | |||||||||
| Consolidated income from discontinued operations |
— | — | 2,706 | |||||||||
|
|
|
|
|
|
|
|||||||
| Net income attributable to common shareholders of WCI Communities, Inc. |
$ | 21,597 | $ | 126,968 | $ | 50,823 | ||||||
|
|
|
|
|
|
|
|||||||
| Basic weighted average shares outstanding |
26,021 | 21,586 | 14,445 | |||||||||
| Effect of dilutive securities: |
||||||||||||
| Stock-based compensation arrangements |
271 | 94 | 70 | |||||||||
|
|
|
|
|
|
|
|||||||
| Diluted weighted average shares outstanding |
26,292 | 21,680 | 14,515 | |||||||||
|
|
|
|
|
|
|
|||||||
| Earnings per share of WCI Communities, Inc.: |
||||||||||||
| Basic |
||||||||||||
| Continuing operations |
$ | 0.83 | $ | 5.88 | $ | 3.33 | ||||||
| Discontinued operations |
— | — | 0.19 | |||||||||
|
|
|
|
|
|
|
|||||||
| Earnings per share |
$ | 0.83 | $ | 5.88 | $ | 3.52 | ||||||
|
|
|
|
|
|
|
|||||||
| Diluted |
||||||||||||
| Continuing operations |
$ | 0.82 | $ | 5.86 | $ | 3.31 | ||||||
| Discontinued operations |
— | — | 0.19 | |||||||||
|
|
|
|
|
|
|
|||||||
| Earnings per share |
$ | 0.82 | $ | 5.86 | $ | 3.50 | ||||||
|
|
|
|
|
|
|
|||||||
| 17. | Segment Reporting |
As defined in ASC 280, Segment Reporting (“ASC 280”), our reportable segments are based on operating segments with similar economic characteristics and lines of business. Our reportable segments consist of: (i) Homebuilding; (ii) Real Estate Services; and (iii) Amenities.
During each of the years ended December 31, 2014, 2013 and 2012, substantially all of the revenues of our reportable segments were generated by our Florida operations. As of December 31, 2014 and 2013, all of the Company’s assets were located in the U.S. Evaluation of segment performance is primarily based on operating earnings.
Operations of our Homebuilding segment primarily include the construction and sale of single- and multi-family homes. The results of operations for the Homebuilding segment consist of revenues generated from the delivery of homes and land and home site sales, less the cost of home construction, land and land development costs, asset impairments (if any) and selling, general and administrative expenses incurred by the segment.
Operations of our Real Estate Services segment include providing residential real estate brokerage and title services. The results of operations for the Real Estate Services segment consist of revenues generated primarily from those activities, less the cost of such services, including royalties associated with franchise agreements with third-parties, and selling, general and administrative expenses incurred by the segment.
Operations of our Amenities segment primarily include the construction, ownership and management of recreational amenities in residential communities that we develop. Amenities consist of golf courses and country clubs, marinas and resort-style facilities. The results of operations for the Amenities segment consist of revenues from the sale of equity and nonequity memberships, the sale and lease of marina slips, membership dues, and golf and restaurant operations, less the cost of such services, asset impairments (if any) and selling, general and administrative expenses incurred by the segment. The Amenities segment also includes discontinued operations associated with our retained and operated amenities that have been classified as assets held for sale. However, in accordance with the provisions of ASC 280, the segment information below does not include the results from our discontinued operations (Note 7).
97
Table of Contents
Each reportable segment follows the same accounting policies as those described in Note 2. The financial position and operating results of our segments, which are included in the tables below, are not necessarily indicative of the results and financial position that would have occurred had the segments been independent stand-alone entities during the years presented.
| Years Ended December 31, | ||||||||||||
| 2014 | 2013 | 2012 | ||||||||||
| (in thousands) | ||||||||||||
| Revenues |
||||||||||||
| Homebuilding |
$ | 292,785 | $ | 214,016 | $ | 146,926 | ||||||
| Real Estate Services |
90,582 | 80,096 | 73,070 | |||||||||
| Amenities |
23,636 | 23,237 | 21,012 | |||||||||
|
|
|
|
|
|
|
|||||||
| Total revenues |
$ | 407,003 | $ | 317,349 | $ | 241,008 | ||||||
|
|
|
|
|
|
|
|||||||
| Operating earnings (loss) |
||||||||||||
| Homebuilding |
$ | 36,025 | $ | 24,700 | $ | 14,011 | ||||||
| Real Estate Services |
2,488 | 3,124 | 1,395 | |||||||||
| Amenities (1) |
(2,941 | ) | (2,048 | ) | (3,242 | ) | ||||||
| Interest expense |
(1,140 | ) | (2,537 | ) | (6,978 | ) | ||||||
| Other income, net |
1,604 | 2,642 | 7,493 | |||||||||
| Expenses related to early repayment of debt |
— | (5,105 | ) | (16,984 | ) | |||||||
|
|
|
|
|
|
|
|||||||
| Income (loss) from continuing operations before income taxes |
$ | 36,036 | $ | 20,776 | $ | (4,305 | ) | |||||
|
|
|
|
|
|
|
|||||||
| (1) | The Amenities operating loss for the year ended December 31, 2014 included an asset impairment charge of $1.2 million (Note 5). |
| December 31, | ||||||||
| 2014 | 2013 | |||||||
| (in thousands) | ||||||||
| Assets |
||||||||
| Homebuilding |
$ | 457,093 | $ | 283,386 | ||||
| Real Estate Services |
16,971 | 17,723 | ||||||
| Amenities |
41,302 | 40,973 | ||||||
| Corporate and unallocated (1) |
289,944 | 343,404 | ||||||
|
|
|
|
|
|||||
| Total assets |
$ | 805,310 | $ | 685,486 | ||||
|
|
|
|
|
|||||
| (1) | Corporate and unallocated primarily consists of cash and cash equivalents, deferred tax assets and other corporate items that are not otherwise allocated to an individual reporting segment. |
Certain supplemental information regarding our reportable segments is presented in the tables below.
| Years Ended December 31, | ||||||||||||
| 2014 | 2013 | 2012 | ||||||||||
| (in thousands) | ||||||||||||
| Revenues by major service |
||||||||||||
| Real estate brokerage |
$ | 86,564 | $ | 76,406 | $ | 69,772 | ||||||
| Title services |
4,018 | 3,690 | 3,298 | |||||||||
|
|
|
|
|
|
|
|||||||
| Total Real Estate Services revenues |
$ | 90,582 | $ | 80,096 | $ | 73,070 | ||||||
|
|
|
|
|
|
|
|||||||
98
Table of Contents
| Years Ended December 31, | ||||||||||||
| 2014 | 2013 | 2012 | ||||||||||
| (in thousands) | ||||||||||||
| Depreciation |
||||||||||||
| Homebuilding |
$ | 329 | $ | 308 | $ | 261 | ||||||
| Real Estate Services |
925 | 537 | 590 | |||||||||
| Amenities |
1,373 | 1,236 | 1,149 | |||||||||
|
|
|
|
|
|
|
|||||||
| Total depreciation (1) |
$ | 2,627 | $ | 2,081 | $ | 2,000 | ||||||
|
|
|
|
|
|
|
|||||||
| (1) | Homebuilding includes depreciation in selling, general and administrative expenses. Real Estate Services and Amenities include depreciation in cost of sales. |
| Years Ended December 31, | ||||||||||||
| 2014 | 2013 | 2012 | ||||||||||
| (in thousands) | ||||||||||||
| Additions to property and equipment |
||||||||||||
| Homebuilding |
$ | 136 | $ | 32 | $ | 12 | ||||||
| Real Estate Services |
1,386 | 1,183 | 553 | |||||||||
| Amenities |
979 | 1,152 | 372 | |||||||||
| Corporate and unallocated |
476 | 187 | 140 | |||||||||
|
|
|
|
|
|
|
|||||||
| Total additions to property and equipment |
$ | 2,977 | $ | 2,554 | $ | 1,077 | ||||||
|
|
|
|
|
|
|
|||||||
| 18. | Quarterly Data (unaudited) |
The tables below summarize certain unaudited financial information for each of the quarters in the two-year period ended December 31, 2014.
| Quarters During the Year Ended December 31, 2014 (1) | ||||||||||||||||
| First (2) | Second | Third (3) | Fourth (4) | |||||||||||||
| (in thousands, except per share amounts) | ||||||||||||||||
| Total revenues |
$ | 73,780 | $ | 92,959 | $ | 89,660 | $ | 150,604 | ||||||||
| Gross margin |
13,834 | 18,007 | 15,698 | 35,002 | ||||||||||||
| Income (loss) from continuing operations before income taxes |
$ | 3,379 | $ | 7,213 | $ | 4,580 | $ | 20,864 | ||||||||
| Income tax expense (benefit) from continuing operations |
1,660 | 2,974 | 1,703 | 8,315 | ||||||||||||
|
|
|
|
|
|
|
|
|
|||||||||
| Net income |
$ | 1,719 | $ | 4,239 | $ | 2,877 | $ | 12,549 | ||||||||
|
|
|
|
|
|
|
|
|
|||||||||
| Net income (loss) attributable to common shareholders of WCI Communities, Inc. |
$ | 1,480 | $ | 4,338 | $ | 3,140 | $ | 12,639 | ||||||||
| Supplemental information: |
||||||||||||||||
| Stock-based and other non-cash long-term incentive compensation expense included in income from continuing operations |
$ | 812 | $ | 873 | $ | 856 | $ | 881 | ||||||||
| Earnings (loss) per share attributable to common shareholders (5): |
||||||||||||||||
| Basic |
$ | 0.06 | $ | 0.17 | $ | 0.12 | $ | 0.49 | ||||||||
| Diluted |
0.06 | 0.17 | 0.12 | 0.48 | ||||||||||||
| Weighted average number of common shares outstanding: |
||||||||||||||||
| Basic |
26,015 | 26,020 | 26,020 | 26,028 | ||||||||||||
| Diluted |
26,231 | 26,278 | 26,307 | 26,351 | ||||||||||||
99
Table of Contents
| Quarters During the Year Ended December 31, 2013 (1) | ||||||||||||||||
| First | Second (6) | Third (6) (7) | Fourth (2) | |||||||||||||
| (in thousands, except per share amounts) | ||||||||||||||||
| Total revenues |
$ | 53,734 | $ | 83,337 | $ | 85,518 | $ | 94,760 | ||||||||
| Gross margin |
10,612 | 18,094 | 17,157 | 19,461 | ||||||||||||
| Income (loss) from continuing operations before income taxes |
$ | 772 | $ | 8,812 | $ | 1,618 | $ | 9,574 | ||||||||
| Income tax expense (benefit) from continuing operations |
(85 | ) | — | — | (125,624 | ) | ||||||||||
|
|
|
|
|
|
|
|
|
|||||||||
| Net income |
$ | 857 | $ | 8,812 | $ | 1,618 | $ | 135,198 | ||||||||
|
|
|
|
|
|
|
|
|
|||||||||
| Net income (loss) attributable to common shareholders of WCI Communities, Inc. |
$ | 586 | $ | 8,206 | $ | (17,022 | ) | $ | 135,198 | |||||||
| Supplemental information: |
||||||||||||||||
| Stock-based and other non-cash long-term incentive compensation expense included in income from continuing operations |
$ | 1,584 | $ | 448 | $ | 2,280 | $ | 905 | ||||||||
| Earnings (loss) per share attributable to common shareholders (8) (9): |
||||||||||||||||
| Basic |
$ | 0.03 | $ | 0.45 | $ | (0.71 | ) | $ | 5.20 | |||||||
| Diluted |
0.03 | 0.45 | (0.71 | ) | 5.16 | |||||||||||
| Weighted average number of common shares outstanding: |
||||||||||||||||
| Basic |
18,045 | 18,045 | 24,138 | 26,000 | ||||||||||||
| Diluted |
18,063 | 18,084 | 24,138 | 26,206 | ||||||||||||
| (1) | There were no discontinued operations during the years ended December 31, 2014 and 2013. |
| (2) | We reversed $0.7 million and $125.6 million of our deferred tax asset valuation allowances during the quarters ended March 31, 2014 and December 31, 2013, respectively (Note 12). |
| (3) | The provision for income taxes during the quarter ended September 30, 2014 was favorably impacted by the recognition of a $0.4 million state tax refund receivable pertaining to a prior period. |
| (4) | During the quarter ended December 31, 2014, we recorded a $1.2 million asset impairment charge for one of our Amenities assets (Note 5). |
| (5) | Due to rounding, the sum of basic and diluted earnings (loss) per share for the four quarters does not agree to the corresponding totals for the full calendar year. |
| (6) | Net income (loss) attributable to common shareholders of WCI Communities, Inc. was affected by preferred stock dividends of $0.7 million and $19.0 million during the quarters ended June 30, 2013 and September 30, 2013, respectively (Note 14). |
| (7) | We recorded expenses related to early repayment of debt of $5.1 million during the quarter ended September 30, 2013 (Note 10). |
| (8) | Primarily due to the effects of issuing shares of our common stock during the year ended December 31, 2013, the sum of basic and diluted earnings (loss) per share for the four quarters does not agree to the corresponding totals for the full calendar year. |
| (9) | For any period with a net loss attributable to common shareholders of WCI Communities, Inc., all common stock equivalents were excluded from the computations of diluted loss per common share because the effect of their inclusion would be antidilutive, thereby reducing the reported loss per share. |
We have historically experienced, and in the future expect to continue to experience, variability in our operating results on a quarterly basis in each of our three operating segments. Because many of our Florida homebuyers prefer to close on their new home purchases before the winter, the fourth quarter of each calendar year often produces a disproportionately large portion of our annual Homebuilding revenues, income and cash flows. Activity in our realty brokerage operations is greater during the spring and summer months as (i) buyers with families generally move when their children are out of school and (ii) Florida’s seasonal residents tend to make resale home purchases prior to leaving for the summer. These factors typically result in a larger portion of Real Estate Services revenues, income and cash flows during the second and third quarters of each calendar year. In addition, many of our club members spend the winter months in Florida, thereby producing a disproportionately large portion of our annual Amenities revenues and cash flows during that time period. Accordingly, revenues and operating results for our three operating segments may fluctuate significantly on a quarterly basis and we must maintain sufficient liquidity to meet short-term operating requirements.
100
Table of Contents
| Item 9. | Changes in and Disagreements With Accountants on Accounting and Financial Disclosure. |
The information required by this Item 9 was previously reported in Item 9 of our Annual Report on Form 10-K for the year ended December 31, 2013 that was filed with the Securities and Exchange Commission on February 27, 2014. There were no new items to report for the year ended December 31, 2014.
| Item 9A. | Controls and Procedures. |
Evaluation of Disclosure Controls and Procedures
Our management, with the participation of our chief executive officer and chief financial officer, evaluated the effectiveness of our disclosure controls and procedures, as defined in Securities Exchange Act Rules 13a-15(e) and 15d-15(e), as of the end of the period covered by this Annual Report on Form 10-K (the “Evaluation Date”). Based on such evaluation, our chief executive officer and chief financial officer concluded that our disclosure controls and procedures were effective at the reasonable assurance level as of the Evaluation Date. In designing and evaluating the disclosure controls and procedures, management recognized that any controls and procedures, no matter how well designed and operated, can provide only reasonable assurance of achieving the desired control objectives, and management necessarily was required to apply its judgment in evaluating the cost-benefit relationship of possible controls and procedures. Our disclosure controls and procedures are designed to provide a reasonable level of assurance of reaching our desired disclosure control objectives.
Management’s Annual Report on Internal Control Over Financial Reporting
Our management is responsible for establishing and maintaining adequate internal control over financial reporting, as such term is defined in Exchange Act Rule 13a-15(f). Our internal control system was designed under the supervision of our chief executive officer and chief financial officer and with the participation of management to provide reasonable assurance regarding the reliability of our financial reporting and our preparation of consolidated financial statements for external purposes in accordance with U.S. generally accepted accounting principles.
All internal control systems, no matter how well designed and tested, have inherent limitations, including, among other things, the possibility of human error, circumvention or disregard. Therefore, even those systems of internal control that have been determined to be effective can provide only reasonable assurance that the objectives of the control system are met and may not prevent or detect misstatements. Also, projections of any evaluation of effectiveness to future periods are subject to the risk that controls may become inadequate because of changes in conditions or that the degree of compliance with the policies or procedures may deteriorate.
Under the supervision of our chief executive officer and chief financial officer, management conducted an assessment of the effectiveness of our internal control over financial reporting based on the criteria set forth in “Internal Control-Integrated Framework (2013)” issued by the Committee of Sponsoring Organizations of the Treadway Commission. Based on this assessment, management concluded that our internal control over financial reporting was effective as of December 31, 2014.
This Annual Report on Form 10-K does not include an attestation report of our independent registered public accounting firm regarding our internal control over financial reporting due to an exemption for emerging growth companies under the Jumpstart our Business Startups Act of 2012.
Changes in Internal Control Over Financial Reporting
During the quarter ended December 31, 2014, there were no changes in our internal control over financial reporting that have materially affected, or that are reasonably likely to materially affect, our internal control over financial reporting.
| Item 9B. | Other Information. |
None.
101
Table of Contents
Unless the context otherwise requires, the terms the “Company,” “we,” “us” and “our” in Part III of this Annual Report on Form 10-K refer to WCI Communities, Inc. and its subsidiaries and the term “WCI” refers only to WCI Communities, Inc.
| Item 10. | Directors, Executive Officers and Corporate Governance |
Except as set forth below, the information required by this item is incorporated into this Annual Report on Form 10-K by reference from our definitive proxy statement to be issued in connection with our 2015 Annual Meeting of Stockholders under the headings “Item 1—Election of Directors,” “Corporate Governance” and “Other Matters—Section 16(a) Beneficial Ownership Reporting Compliance,” which proxy statement is expected to be filed on or before April 30, 2015.
Executive Officers
Below is information regarding our executive officers. Vivien N. Hastings and Reinaldo L. Mesa were executive officers of WCI’s predecessor company at and from the time it filed voluntary petitions for reorganization relief under the provisions of Chapter 11 of Title 11 of the U.S. Bankruptcy Code on August 4, 2008 through its emergence from bankruptcy.
Keith E. Bass, age 50, has served as our President and Chief Executive Officer since December 2012 and as a member of our board of directors since March 2012. Mr. Bass has over 25 years of real estate and homebuilding experience and, prior to joining the Company, held a number of senior executive leadership positions at national homebuilding and development companies. Before becoming our Chief Executive Officer, Mr. Bass was President of Pinnacle Land Advisers from 2011 to November 2012. From 2003 to 2011, he was an executive with The Ryland Group (“Ryland”), with his most recent position (from 2008 to 2011) as Senior Vice President of Ryland and President of Ryland’s South U.S. Region (covering Florida, Georgia, North Carolina, South Carolina and Texas). From 2003 to 2008, he held the various titles of SE U.S. Region President, Orlando Division President and Vice President, Land Resources—SE U.S. Region. Prior to Ryland, Mr. Bass was President of the Florida Region of Taylor Woodrow from 1997 to 2003. Since February 2015, Mr. Bass has also served as a director and member of the compensation committee of Xenia Hotels & Resorts, Inc., a publicly traded hotel real estate investment trust. Mr. Bass holds a bachelor’s degree in business administration from North Carolina Wesleyan College and is a licensed general contractor and a licensed real estate broker in Florida. We believe that his experience in the real estate industry and leadership in management make Mr. Bass well-qualified to serve on our board of directors.
Russell Devendorf, age 41, has served as our Senior Vice President and Chief Financial Officer since November 2008 and is responsible for the Company’s accounting, finance, tax, risk management and information technology systems. Prior to joining the Company, Mr. Devendorf held positions as Vice President—Finance of Meritage Homes Corporation from May 2008 to November 2008 and from March 2002 to May 2008 served in several senior level finance roles with TOUSA, Inc., a national homebuilding company, including most recently as Vice President, Treasurer and Secretary. He also served as an auditor at Ernst & Young LLP in their real estate practice and is a Certified Public Accountant and Certified Treasury Professional. Mr. Devendorf received both a B.S. and Master of Accounting with a tax concentration from The Florida State University.
Vivien N. Hastings, age 63, has served as our Senior Vice President, Secretary and General Counsel since 1998. Ms. Hastings joined the Company in 1990 and held various positions in its legal department prior to becoming General Counsel. From 1982 to 1989, Ms. Hastings served as Vice President and Co-General Counsel of Merrill Lynch Hubbard, Inc., a real estate division of Merrill Lynch & Co. Prior to her tenure with Merrill Lynch, she was an associate with the law firm of Winston & Strawn LLP. Ms. Hastings holds a B.A. from the University of Connecticut and a J.D. from Washington University School of Law.
Paul J. Erhardt, age 46, has served as our Senior Vice President of Homebuilding and Development and President of our South Region since November 2013. He is responsible for overseeing homebuilding operations, community planning, entitlements and land development for our South Region. From March 2013 until November 2013, Mr. Erhardt served as our Senior Vice President of Homebuilding and Development where he was responsible for overseeing our company-wide homebuilding operations, as well as community planning, entitlements and land development. Mr. Erhardt joined the Company as a Project Manager in 2004 and was named Senior Project Manager in 2005, Vice President in 2009 and Senior Vice President of Community Development and Operations in 2011, the last of which positions he held until his current role. Prior to joining the Company, Mr. Erhardt led supply chain improvement programs as Director of Operations Programs for World Kitchen, Inc. from 2001 to 2003. Prior to joining World Kitchen, Inc., Mr. Erhardt was a management consultant with Booz Allen & Hamilton from 1996 to 2001 and a practicing Certified Public Accountant with Arthur Andersen & Company from 1990 to 1995. Mr. Erhardt holds both a B.B.A. and M.B.A. from the University of Michigan with a concentration in Corporate Strategy and Operations.
102
Table of Contents
David T. Ivin, age 56, has served as our Senior Vice President of Homebuilding and Development and President of our North Region since he joined the Company in November 2013. He is responsible for overseeing homebuilding operations, community planning, entitlements and land development for our North Region. Mr. Ivin has over 30 years of professional homebuilding experience, holding various senior executive leadership positions at national homebuilding and development companies. Prior to joining the Company, Mr. Ivin served as Asset Manager with Starwood Land Ventures, managing all of its communities in West Florida from 2010 to 2013. Prior to joining Starwood Land Ventures, Mr. Ivin was a Division President at Centex Homes from 2004 to 2008, covering all of its Tampa, Florida operations, and from 1994 to 2004 he was the Regional Director in West Florida for Taylor Woodrow Communities. From 1991 to 1994, Mr. Ivin served as Division President of Ryland Homes (Charleston, South Carolina) and prior to that he held various construction and sales positions at Ryan Homes in Virginia. Mr. Ivin holds an M.B.A. from the University of North Carolina and a B.S. in Civil Engineering from Cornell University.
Reinaldo L. Mesa, age 53, has served as our Senior Vice President of Real Estate Services since September 2009 and as President and Chief Executive Officer of Watermark Realty, Inc. since January 2010. Previously, Mr. Mesa served as President of Prudential Florida Realty, a predecessor to Berkshire Hathaway HomeServices Florida Realty, beginning in March 2005, and has held various other positions at Prudential Florida Realty since he joined the Company in 1999. Prior to joining the Company, Mr. Mesa served as Miami-Dade District Manager with Coldwell Banker Residential Real Estate. He previously owned his own real estate brokerage that he ultimately sold in 1997 to NRT LLC, which operates Coldwell Banker Residential Real Estate. Mr. Mesa is a certified real estate broker and a certified residential specialist. Mr. Mesa also serves as a National Association of Realtors® (“NAR”) Director and serves on the NAR Executive Committee, Large Residential Firms Advisory & Involvement Board and 2014 NAR Liaison Committee to Second Century Ventures. Mr. Mesa also previously served as a Director of the National Association of Hispanic Real Estate Professionals. Mr. Mesa has been in the real estate industry since 1981.
John B. McGoldrick, age 48, has served as our Senior Vice President of Human Resources since August 2013. Mr. McGoldrick oversees all aspects of the Company’s human resources and corporate services functions, including recruiting, human resources administration, compensation and benefits, payroll, organization development, training and corporate services/facilities activities. Mr. McGoldrick joined the Company in 2002 and held various positions in its Human Resources department prior to becoming Senior Vice President in August 2013. Prior to joining the Company, Mr. McGoldrick was Director of Human Resources, Compensation & Benefits from 2001 to 2002 for Orius Telecom Services, Inc., a private company in the telecommunications industry. He was Senior Manager of Human Resources Administration for Ocwen Financial Corporation, a publicly traded global financial services provider, from 1994 to 2001. Mr. McGoldrick holds a bachelor’s degree from Villanova University.
Code of Business Conduct and Ethics
We have adopted a written code of business conduct and ethics that applies to all of our employees, officers and directors, including those officers responsible for financial reporting. Our code of business conduct and ethics is available on our website at www.wcicommunities.com under Investor Relations. We intend to satisfy any disclosure requirements pursuant to Item 5.05 of Form 8-K and New York Stock Exchange rules regarding any amendment to, or a waiver from, certain provisions of our code of business conduct and ethics by posting such information on our website under Investor Relations.
| Item 11. | Executive Compensation |
The information required by this item is incorporated into this Annual Report on Form 10-K by reference from our definitive proxy statement to be issued in connection with our 2015 Annual Meeting of Stockholders under the headings “Executive Compensation” and “Corporate Governance—Compensation Committee Interlocks and Insider Participation,” which proxy statement is expected to be filed on or before April 30, 2015.
| Item 12. | Security Ownership of Certain Beneficial Owners and Management and Related Stockholder Matters |
Except as set forth in the table on the following page, the information required by this item is incorporated into this Annual Report on Form 10-K by reference from our definitive proxy statement to be issued in connection with our 2015 Annual Meeting of Stockholders under the heading “Security Ownership of Certain Beneficial Owners and Management,” which proxy statement is expected to be filed on or before April 30, 2015.
103
Table of Contents
Securities Authorized for Issuance under Equity Compensation Plans as of December 31, 2014
Equity Compensation Plan Information
| Plan category |
Number of securities to be issued upon exercise of outstanding options, warrants and rights |
Weighted-average exercise price of outstanding options, warrants and rights |
Number of securities remaining available for future issuance under equity compensation plans (excluding securities reflected in column (a)) |
|||||||||
| (a) | (b) | (c) | ||||||||||
| Equity compensation plans approved by security holders |
927,000 | not applicable | 2,656,515 | |||||||||
| Equity compensation plans not approved by security holders |
— | not applicable | — | |||||||||
|
|
|
|
|
|||||||||
| Totals |
927,000 | 2,656,515 | (1) | |||||||||
|
|
|
|
|
|||||||||
| (1) | This amount represents the total number of shares available for issuance as of December 31, 2014 under shareholder-approved equity plans and is comprised of (i) 758,399 shares under the WCI Communities, Inc. Long Term Equity Incentive Plan and (ii) 1,898,116 shares under the WCI Communities, Inc. 2013 Incentive Award Plan. |
See Note 15 to our audited consolidated financial statements in Item 8 of Part II of this Annual Report on Form 10-K for detailed information about our stock-based compensation plans.
| Item 13. | Certain Relationships and Related Transactions, and Director Independence |
The information required by this item is incorporated into this Annual Report on Form 10-K by reference from our definitive proxy statement to be issued in connection with our 2015 Annual Meeting of Stockholders under the headings “Certain Relationships” and “Corporate Governance,” which proxy statement is expected to be filed on or before April 30, 2015.
| Item 14. | Principal Accountant Fees and Services |
The information required by this item is incorporated into this Annual Report on Form 10-K by reference from our definitive proxy statement to be issued in connection with our 2015 Annual Meeting of Stockholders under the heading “Item 2—Ratification of Appointment of Independent Registered Public Accounting Firm,” which proxy statement is expected to be filed on or before April 30, 2015.
| Item 15. | Exhibits, Financial Statement Schedules |
The following documents are filed as part of this Annual Report on Form 10-K.
| (a)(1) | Financial Statements: all consolidated financial statements are included in Item 8 of Part II of this Annual Report on Form 10-K on page 68. | |
| (a)(2) | Financial Statement Schedules: schedules have been omitted because of the absence of conditions under which they are required or because the required information has been included in the consolidated financial statements or notes thereto in Item 8 of Part II of this Annual Report on Form 10-K on page 68. | |
| (a)(3) | Exhibits: the exhibits listed below in the Index to Exhibits are filed with or furnished with this Annual Report on Form 10-K, as designated in such index, or are incorporated herein by reference. | |
104
Table of Contents
INDEX TO EXHIBITS
| Incorporated by Reference | ||||||||||||
| Exhibit |
Exhibit Description |
Form | File No. | Exhibit | Filing Date |
Filed/ Furnished Herewith | ||||||
| 2.1 | Debtors’ Second Amended Joint Plan of Reorganization filed pursuant to Chapter 11 of Title 11 of the U.S. Bankruptcy Code filed on July 17, 2009 with the U.S. Bankruptcy Court for the District of Delaware in Case No. 08-11643 (Jointly Administered) | S-1 | 333-188866 | 2.1 | 5/24/13 | |||||||
| 3.1 | Fourth Amended and Restated Certificate of Incorporation, as amended on July 24, 2013 | 10-Q | 001-36023 | 3.1 | 8/20/13 | |||||||
| 3.2 | Amended and Restated Bylaws of WCI Communities, Inc., as amended on July 24, 2013 | 10-Q | 001-36023 | 3.2 | 8/20/13 | |||||||
| 4.1 | Registration Rights Agreement, dated July 2, 2013, by and between WCI Communities, Inc. and WCI Communities, Inc. Creditor Trust | S-1/A | 333-188866 | 4.5 | 7/9/13 | |||||||
| 4.2 | Registration Rights Agreement, dated July 24, 2013, by and among WCI Communities, Inc., affiliates of Monarch Alternative Capital LP and Stonehill Institutional Partners, L.P. | 10-Q | 001-36023 | 4.2 | 8/20/13 | |||||||
| 4.3 | Stockholders Agreement, dated July 24, 2013, by and among WCI Communities, Inc. and affiliates of Monarch Alternative Capital LP | 10-Q | 001-36023 | 4.3 | 8/20/13 | |||||||
| 4.4 | Stockholders Agreement, dated July 24, 2013, by and among WCI Communities, Inc. and Stonehill Institutional Partners, L.P. | 10-Q | 001-36023 | 4.4 | 8/20/13 | |||||||
| 4.5 | Indenture, dated as of August 7, 2013, by and among WCI Communities, Inc., the guarantors named therein and Wilmington Trust, National Association, as trustee | 8-K | 001-36023 | 4.1 | 8/8/13 | |||||||
| 4.5(a) | First Supplemental Indenture, dated as of April 28, 2014, by and among WCI Communities, Inc., the guarantors named therein and Wilmington Trust, National Association, as trustee | 10-Q | 001-36023 | 4.1 | 5/6/14 | |||||||
| 4.5(b) | Second Supplemental Indenture, dated as of June 26, 2014, by and among WCI Communities, Inc., the guarantors named therein and Wilmington Trust, National Association, as trustee | 8-K | 001-36023 | 4.3 | 6/26/14 | |||||||
| 4.6 | Registration Rights Agreement, dated as of August 7, 2013, by and among WCI Communities, Inc., the guarantors named therein and Citigroup Global Markets Inc., as representative for the initial purchasers | 8-K | 001-36023 | 10.1 | 8/8/13 | |||||||
105
Table of Contents
| Incorporated by Reference | ||||||||||||||
| Exhibit |
Exhibit Description |
Form | File No. | Exhibit | Filing Date |
Filed/ Furnished Herewith | ||||||||
| 4.7 | Registration Rights Agreement, dated as of June 26, 2014, by and among WCI Communities, Inc., the guarantors named therein and Citigroup Global Markets Inc. | 8-K | 001-36023 | 10.1 | 6/26/14 | |||||||||
| 4.8 | Specimen Certificate for shares of common stock | S-1/A | 333-188866 | 4.1 | 7/9/13 | |||||||||
| 4.9 | Form of 6.875% Senior Note | 8-K | 001-36023 | Exhibit A to 4.1 |
8/8/13 | |||||||||
| 4.10 | Form of Notation of Guarantee | 8-K | 001-36023 | Exhibit F to 4.1 |
8/8/13 | |||||||||
| 4.11 | Form of Indenture between WCI Communities, Inc. and Wilmington Trust, National Association, as trustee | S-3 | 333-200330 | 4.2 | 11/18/14 | |||||||||
| 10.1 | Form of Indemnification Agreement for Directors and Officers | S-1/A | 333-188866 | 10.1 | 7/9/13 | |||||||||
| 10.2 # | WCI Communities, Inc. 2013 Incentive Award Plan | 10-Q | 001-36023 | 10.5 | 8/20/13 | |||||||||
| 10.3 # | WCI Communities, Inc. Senior Executive Incentive Bonus Plan | 10-Q | 001-36023 | 10.6 | 8/20/13 | |||||||||
| 10.4 | Franchise Agreement, dated May 28, 2013, between BHH Affiliates, LLC and Watermark Realty, Inc. d/b/a Berkshire Hathaway HomeServices Florida Realty | S-1/A | 333-188866 | 10.25 | 5/30/13 | |||||||||
| 10.4(a) ## | First Amendment to Franchise Agreement, dated May 28, 2013, between BHH Affiliates, LLC and Watermark Realty, Inc. d/b/a Berkshire Hathaway HomeServices Florida Realty | S-1/A | 333-188866 | 10.25(a) | 5/30/13 | |||||||||
| 10.4(b) ## | Second Amendment to Franchise Agreement, dated May 28, 2013, between BHH Affiliates, LLC and Watermark Realty, Inc. d/b/a Berkshire Hathaway HomeServices Florida Realty | S-1/A | 333-188866 | 10.25(b) | 5/30/13 | |||||||||
| 10.5 # | Form of Restricted Stock Award Grant Notice and Restricted Stock Award Agreement under the WCI Communities, Inc. 2013 Incentive Award Plan | S-1/A | 333-188866 | 10.27 | 7/15/13 | |||||||||
| 10.6 # | WCI Communities, Inc. Amended and Restated 2013 Long Term Incentive Plan (Employees) | S-1/A | 333-188866 | 10.10(a) | 7/15/13 | |||||||||
| 10.7 # | Form of Amended and Restated LTIP Award Agreement under the WCI Communities, Inc. Amended and Restated 2013 Long Term Incentive Plan | S-1/A | 333-188866 | 10.11(a) | 7/15/13 | |||||||||
| 10.8 # | WCI Communities, Inc. Amended and Restated 2013 Director Long Term Incentive Plan | S-1/A | 333-188866 | 10.12 (a) | 7/15/13 | |||||||||
106
Table of Contents
| Incorporated by Reference | ||||||||||||
| Exhibit |
Exhibit Description |
Form | File No. | Exhibit | Filing Date |
Filed/ Furnished Herewith | ||||||
| 10.9 # | Form of Amended and Restated LTIP Award Agreement under the WCI Communities, Inc. Amended and Restated 2013 Director Long Term Incentive Plan | S-1/A | 333-188866 | 10.13(a) | 7/15/13 | |||||||
| 10.10 | Exchange Agreement, dated July 2, 2013, by and between WCI Communities, Inc. and WCI Communities, Inc. Creditor Trust | S-1/A | 333-188866 | 10.26 | 7/9/13 | |||||||
| 10.11 | Credit Agreement, dated August 27, 2013, among WCI Communities, Inc., Citibank, N.A., as administrative agent, and the lenders party thereto | 8-K | 001-36023 | 10.1 | 8/29/13 | |||||||
| 10.12 | Note Purchase Agreement, dated June 8, 2012, by and among WCI Communities, Inc., the guarantors party thereto, the noteholders party thereto and Wilmington Trust, National Association, as amended | S-1 | 333-188866 | 10.2 | 5/24/13 | |||||||
| 10.12(a) | Amendment and Waiver Letter to Note Purchase Agreement, dated November 20, 2012, among WCI Communities, Inc., the guarantors party thereto, Wilmington Trust, National Association and the noteholders named therein | S-1 | 333-188866 | 10.2(a) | 5/24/13 | |||||||
| 10.12(b) | Amendment and Waiver Letter to Note Purchase Agreement, dated April 25, 2013, among WCI Communities, Inc., the guarantors party thereto, Wilmington Trust, National Association and the noteholders named therein | S-1 | 333-188866 | 10.2(b) | 5/24/13 | |||||||
| 10.13 | Loan Agreement, dated February 28, 2013, by and between Stonegate Bank, WCI Communities, Inc. and WCI Communities, LLC | S-1 | 333-188866 | 10.3 | 5/24/13 | |||||||
| 10.14 | Lease Agreement, dated November 19, 2010, by and between Walden Center LP and WCI Communities, LLC, as amended | S-1 | 333-188866 | 10.5 | 5/24/13 | |||||||
| 10.14(a) | Amendment to Lease Agreement, dated June 11, 2012, by and between Walden Center LP and WCI Communities, LLC | S-1 | 333-188866 | 10.5(a) | 5/24/13 | |||||||
| 10.14(b) | Second Amendment to Lease Agreement, dated April 11, 2013, by and between Walden Center LP and WCI Communities, LLC | S-1 | 333-188866 | 10.5(b) | 5/24/13 | |||||||
| 10.14(c) | Third Amendment to Lease Agreement, dated April 11, 2013, by and between Walden Center LP and WCI Communities, LLC | S-1 | 333-188866 | 10.5(c) | 5/24/13 | |||||||
| 10.14(d) | Fourth Amendment to Lease Agreement, dated September 19, 2013, by and between Walden Center LP and WCI Communities, LLC | 10-K | 001-36023 | 10.17(d) | 2/27/14 | |||||||
107
Table of Contents
| Incorporated by Reference | ||||||||||||
| Exhibit |
Exhibit Description |
Form | File No. | Exhibit | Filing Date |
Filed/ Furnished Herewith | ||||||
| 10.14(e) | Fifth Amendment to Lease Agreement, dated January 10, 2014, by and between Walden Center LP and WCI Communities, LLC | 10-Q | 001-36023 | 10.1 | 8/5/14 | |||||||
| 10.14(f) | Notice of Renewal Letter, dated August 28, 2014, from WCI Communities, LLC to Walden Center LP | 10-Q | 001-36023 | 10.1 | 11/4/14 | |||||||
| 10.15 # | WCI Communities, Inc. Long Term Equity Incentive Plan, as amended | S-1 | 333-188866 | 10.6 | 5/24/13 | |||||||
| 10.15(a) # | Amendment to WCI Communities, Inc. Long Term Equity Incentive Plan, dated May 14, 2012 | S-1 | 333-188866 | 10.6(a) | 5/24/13 | |||||||
| 10.15(b) # | Second Amendment to WCI Communities, Inc. Long Term Equity Incentive Plan, dated July 26, 2012 | S-1 | 333-188866 | 10.6(b) | 5/24/13 | |||||||
| 10.16 # | Form of Employee Restricted Stock Agreement under the WCI Communities, Inc. Long Term Equity Incentive Plan | S-1 | 333-188866 | 10.7 | 5/24/13 | |||||||
| 10.17 # | Employment Agreement, dated November 29, 2012, by and between WCI Communities Management, LLC, WCI Communities, Inc., WCI Communities, LLC and Keith E. Bass | S-1 | 333-188866 | 10.16 | 5/24/13 | |||||||
| 10.18 # | Amended and Restated Employment Agreement, dated August 29, 2012, by and between WCI Communities Management, LLC, WCI Communities, Inc., WCI Communities, LLC and Russell Devendorf | S-1 | 333-188866 | 10.17 | 5/24/13 | |||||||
| 10.19 # | Amended and Restated Employment Agreement, dated April 15, 2013, by and between Watermark Realty, Inc., WCI Communities, Inc., WCI Communities, LLC and Reinaldo L. Mesa | S-1 | 333-188866 | 10.18 | 5/24/13 | |||||||
| 10.20 # | Employment Agreement, dated August 22, 2012, by and between WCI Communities Management, LLC, WCI Communities, Inc., WCI Communities, LLC and Paul J. Erhardt | S-1 | 333-188866 | 10.19 | 5/24/13 | |||||||
| 10.21 # | Second Amended and Restated Employment Agreement, dated August 16, 2012, by and between WCI Communities Management, LLC, WCI Communities, Inc., WCI Communities, LLC and Vivien N. Hastings | S-1 | 333-188866 | 10.20 | 5/24/13 | |||||||
| 10.22 # | Employment Agreement, dated January 10, 2014, by and between WCI Communities Management, LLC, WCI Communities, Inc., WCI Communities, LLC and David T. Ivin | 10-K | 001-36023 | 10.25 | 2/27/14 | |||||||
| 10.23 # | WCI Communities, Inc. 2014 Management Incentive Compensation Plan | 10-K | 001-36023 | 10.27 | 2/27/14 | |||||||
108
Table of Contents
| Incorporated by Reference | ||||||||||||
| Exhibit |
Exhibit Description |
Form | File No. | Exhibit | Filing Date |
Filed/ Furnished Herewith | ||||||
| 10.24 # | WCI Communities, Inc. 2015 Management Incentive Compensation Plan | * | ||||||||||
| 10.25 # | WCI Communities, Inc. 2015 Real Estate Services Incentive Compensation Plan | * | ||||||||||
| 10.26 # | Form of Restricted Stock Award Grant Notice and Restricted Stock Award Agreement under the WCI Communities, Inc. 2013 Incentive Award Plan (Employees and Directors) | 10-K | 001-36023 | 10.28 | 2/27/14 | |||||||
| 10.27 # | Form of Restricted Stock Unit Award Grant Notice and Restricted Stock Unit Award Agreement for certain Directors | 10-K | 001-36023 | 10.29 | 2/27/14 | |||||||
| 12.1 | WCI Communities, Inc. Statement of the Computations of the Ratio of Earnings to Fixed Charges and Preferred Stock Dividends | * | ||||||||||
| 21.1 | List of Subsidiaries of WCI Communities, Inc. | * | ||||||||||
| 23.1 | Consent of Ernst & Young LLP, independent registered public accounting firm | * | ||||||||||
| 31.1 | Rule 13a-14(a) / 15d-14(a) Certification of Chief Executive Officer | * | ||||||||||
| 31.2 | Rule 13a-14(a) / 15d-14(a) Certification of Chief Financial Officer | * | ||||||||||
| 32.1 | Section 1350 Certification of Chief Executive Officer | ** | ||||||||||
| 32.2 | Section 1350 Certification of Chief Financial Officer | ** | ||||||||||
| 101.INS | XBRL Instance Document | * | ||||||||||
| 101.SCH | XBRL Taxonomy Extension Schema Document | * | ||||||||||
| 101.CAL | XBRL Taxonomy Extension Calculation Linkbase Document | * | ||||||||||
| 101.DEF | XBRL Taxonomy Extension Definition Linkbase Document | * | ||||||||||
| 101.LAB | XBRL Taxonomy Extension Label Linkbase Document | * | ||||||||||
| 101.PRE | XBRL Taxonomy Extension Presentation Linkbase Document | * | ||||||||||
| * | Filed herewith. |
| ** | Furnished herewith. |
| # | Management contract or compensatory plan or arrangement. |
| ## | WCI Communities, Inc. requested confidential treatment for certain information contained in this exhibit. Such information was filed separately with the Securities and Exchange Commission on May 30, 2013 pursuant to a Confidential Treatment Request. On July 25, 2013, the Securities and Exchange Commission approved the request pursuant to an Order Granting Confidential Treatment. |
109
Table of Contents
Pursuant to the requirements of Section 13 or 15(d) of the Securities Exchange Act of 1934, the registrant has duly caused this report to be signed on its behalf by the undersigned, thereunto duly authorized.
| WCI COMMUNITIES, INC. | ||||||
| By: | /s/ Keith E. Bass |
President and Chief Executive Officer | February 25, 2015 | |||
| Keith E. Bass | ||||||
Pursuant to the requirements of the Securities Exchange Act of 1934, this report has been signed below by the following persons on behalf of the registrant and in the capacities and on the dates indicated.
| /s/ Keith E. Bass |
President, Chief Executive Officer and Director (Principal Executive Officer) |
February 25, 2015 | ||
| Keith E. Bass | ||||
| /s/ Russell Devendorf |
Senior Vice President and Chief Financial Officer (Principal Financial Officer) | February 25, 2015 | ||
| Russell Devendorf | ||||
| /s/ John J. Ferry III John J. Ferry III |
Vice President and Chief Accounting Officer (Principal Accounting Officer) | February 25, 2015 | ||
| /s/ Stephen D. Plavin |
Director and Chairman of the Board of Directors | February 25, 2015 | ||
| Stephen D. Plavin | ||||
| /s/ Patrick J. Bartels, Jr. |
Director | February 25, 2015 | ||
| Patrick J. Bartels, Jr. | ||||
| /s/ Michelle MacKay |
Director | February 25, 2015 | ||
| Michelle MacKay | ||||
| /s/ Darius G. Nevin |
Director | February 25, 2015 | ||
| Darius G. Nevin | ||||
| /s/ Charles C. Reardon |
Director | February 25, 2015 | ||
| Charles C. Reardon | ||||
| /s/ Christopher E. Wilson |
Director | February 25, 2015 | ||
| Christopher E. Wilson |
||||
110