Attached files
| file | filename |
|---|---|
| 8-K - 8-K - MAINSOURCE FINANCIAL GROUP | a16-18813_18k.htm |
Exhibit 99.1
MainSource FINANCIAL GROUP Meeting the financial needs of our costomers... for life September 2016

Disclosure Regarding Forward Looking Statements 2 This presentation may include comments or information that constitute forward-looking statements (within the meaning of the Private Securities Litigation Reform Act of 1995) based on current expectations that involve a number of risks and uncertainties. These forward looking statements are subject to a number of factors and uncertainties which could cause MainSource’s actual results and experience to differ from the anticipated results and expectations expressed in such forward looking statements. Forward looking statements speak only as of the date they are made and MainSource does not assume any duty to update forward looking statements. These forward-looking statements include, but are not limited to, statements about MainSource’s business strategy, financial position and prospects, dividend policy, business results, strategic initiatives, credit quality including reserve levels, capital expenditures, and various other matters. These statements can be identified by the use of forward-looking terminology such as “believes,” “estimates,” “expects,” “intends,” “may,” “will,” “should,” “could” or “anticipates”, or the negative or other variation of these similar words, or by discussions of strategy or risks and uncertainties. Factors that could cause actual results to differ materially from such forward-looking statements include, without limitation, general economic conditions, legislative and regulatory initiatives, changes in the quality of MainSource’s loan portfolios, and other risks set forth in MainSource’s Annual Report on Form 10-K for the fiscal year ending December 31, 2015, on file with the SEC.
Company Overview
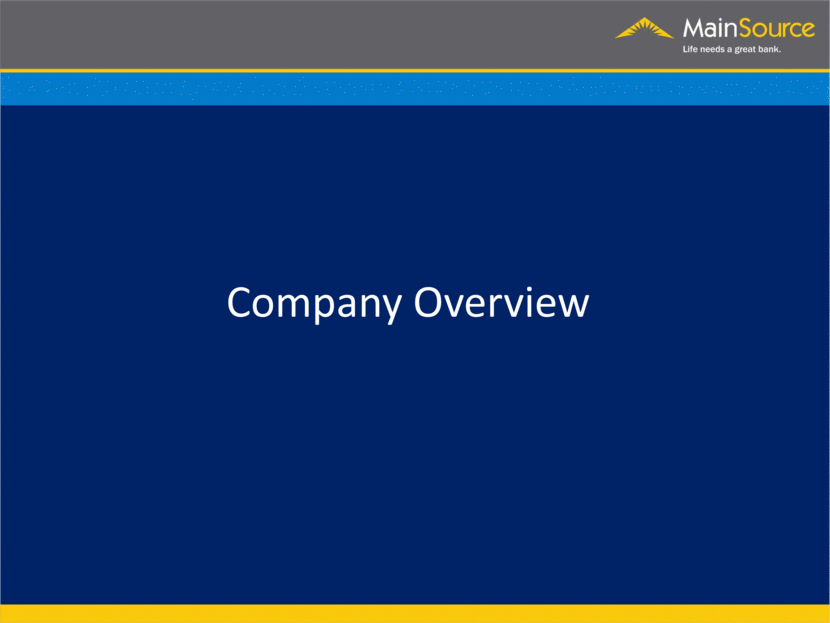
Indiana-based, community-focused financial services company (NASDAQ: MSFG): $585 million market cap 169% price / tangible book 12.1x 2017 consensus EPS 2.5% dividend yield $4.0 billion in assets Operates 91 branch locations Strong and stable core markets with a broader focus on Indianapolis, Cincinnati and Louisville Four primary business lines: Commercial Banking Consumer Banking Mortgage Banking Wealth Management Franchise Overview Note: Pricing statistics as of 9/12/16. 4 Newly Entered Markets Established Market Presence
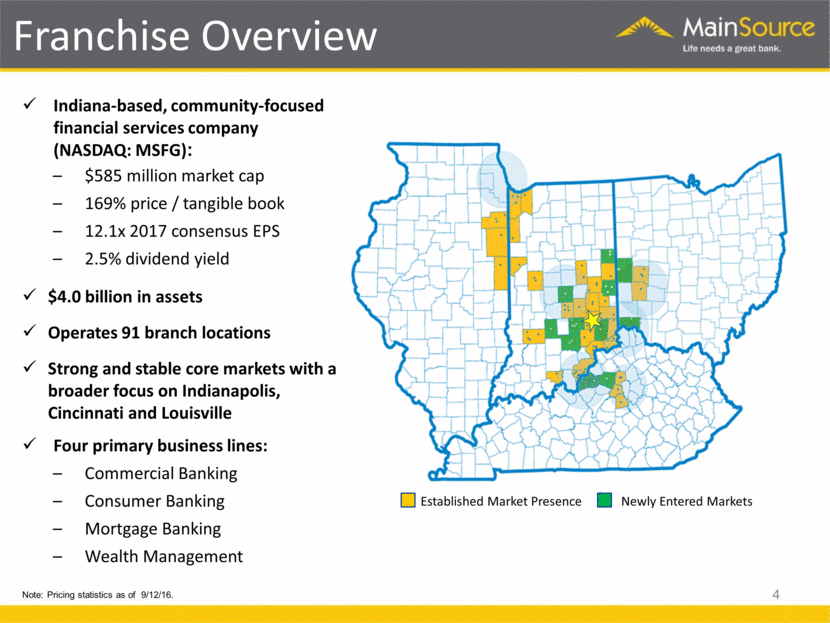
Name Title Banking Experience Years with MSFG Archie Brown Chairman & CEO 32 8 Jamie Anderson EVP - Chief Financial Officer 16 16 Daryl Tressler EVP - Chief Banking Officer 42 42 Bill Goodwin EVP - Chief Credit Officer 32 7 Chris Harrison EVP - Chief Consumer Banking Officer 26 10 Karen Woods EVP – Corp. Counsel & Chief Risk Officer 19 1 David Dippold SVP - Commercial Banking 30 9 Dan Anderson SVP - Wealth Management 26 22 Andy Applewhite SVP - Mortgage Banking 31 3 Experienced Management Team 5
Strategic Execution Highlights 6 Established Columbus, Indiana presence 2010 2011 Announced efficiency and cost cutting initiative 2012 Repurchased $42 million of outstanding TARP with no capital raise Established presence in Seymour, Indiana, and downtown Indianapolis Acquired branches in Shelbyville, Kentucky from American Founders ($37M in deposits) Acquired Krumme & Brock Investment Services Increased common stock dividend from $0.01 to $0.06 quarterly 2013 Repurchased remaining legacy TARP (complete exit) with no capital raise Established presence in Bloomington, Indiana, Cincinnati, Ohio and Louisville, Kentucky Acquired branch in Hope, Indiana from Old National ($22M in deposits) Raised common stock dividend to $0.08 quarterly 2014 Acquired MBT Bancorp ($225M in assets), expanding Cincinnati presence Announced a 5% share repurchase plan Raised common stock dividend to $0.11 quarterly 2015 Announced acquisition of 5 branches from Old National ($120 deposits and $45 million in loans) Raised common stock dividend to $0.13 quarterly Focus on franchise development and growth, prudent capital deployment and driving shareholder value Acquired Cheviot Financial Corp. ($ 563M in assets), further expanding Cincinnati presence . Raised common stock dividend to $0.15 quarterly 2016
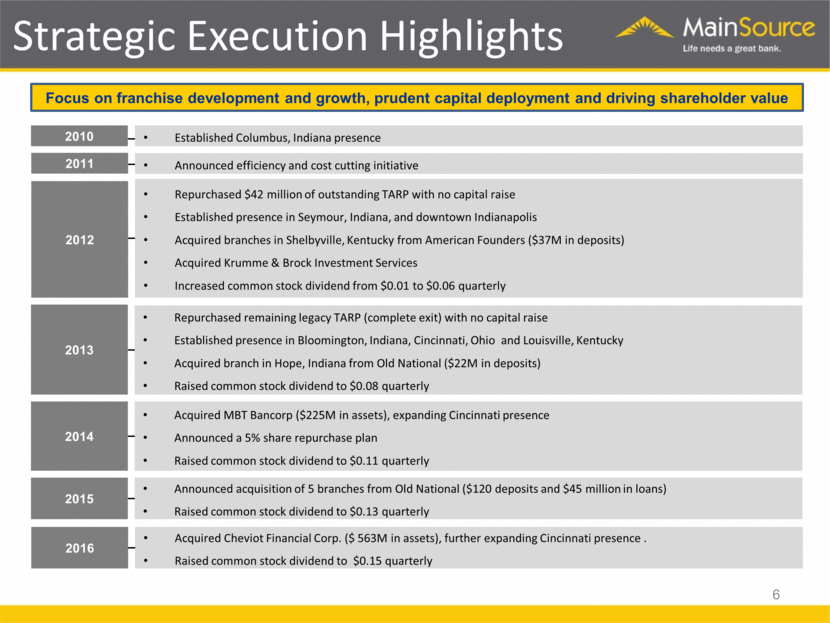
7 Our Markets Strategic Expansion Hiring Proven Teams Expanding in Existing or Adjacent Markets Expansion in Columbus, Seymour, Bloomington, Indianapolis, Louisville, and Cincinnati Recent Branch Acquisitions (Batesville, Brownstown, Portland, Richmond, and Hope, Indiana, Union City, Ohio, and Shelbyville, Kentucky) Acquired MBT Bancorp (Cincinnati expansion) Acquired Cheviot Financial Corp. (Cincinnati expansion) Best In-Market Locations Creating Better Opportunities for Loan Growth Growth Opportunities Driven by Focus on Nearby Large Metropolitan Markets Indianapolis 56 miles from HQ Cincinnati 61 miles from HQ Louisville 91 miles from HQ MSFG Acquired ONB Branches Acquired CFC Branches
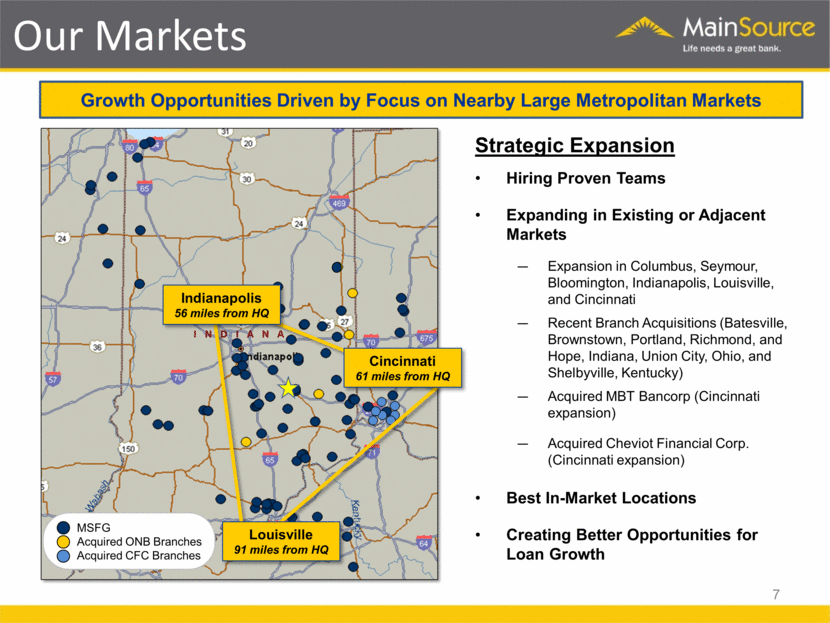
Attractive Market Dynamics 8 Indiana Fundamentals Easy Access to U.S. Markets Unemployment Rate (9) CNBC, June 2015 Area Development, September 2015 Tax Foundation, October 2014 Chief Executive, May 2016 Area Development, September 2015 Forbes, October 2015 Pollina Corporation Real Estate, November 2015 CNBC, June 2015 U.S. Bureau of Labor Statistics Indiana Indianapolis Cincinnati Louisville U.S. 1st Nationally - Cost of Doing Business (1) 1st Nationally - Highway Accessibility (2) 1st in Midwest - Low Taxes (3) 1st in Midwest - Business Climate (4) 2nd Nationally - Skilled Labor Availability (5) 2nd Nationally - Regulatory Climate (6) 3rd Nationally - Top 10 Pro-Business (7) 4th Nationally - Cost of Living (8) 4.8% 4.2% 4.4% 4.6% 4.9% 2.00% 4.00% 6.00%
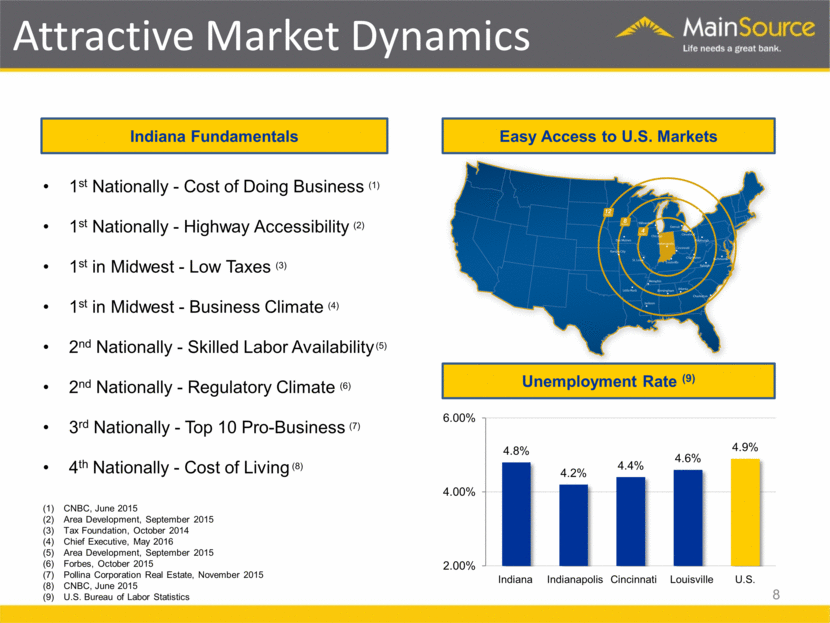
9 Attractive Market Dynamics * Source: Indiana Economic Development Corporation 2016 2015: RECORD BREAKING YEAR 323 COMPANIES CHOSE INDIANA FOR GROWTH 26,555 NEW HOOSIER JOBS COMMITTED $4.79B COMMITTED INVESTMENT IN INDIANA 9
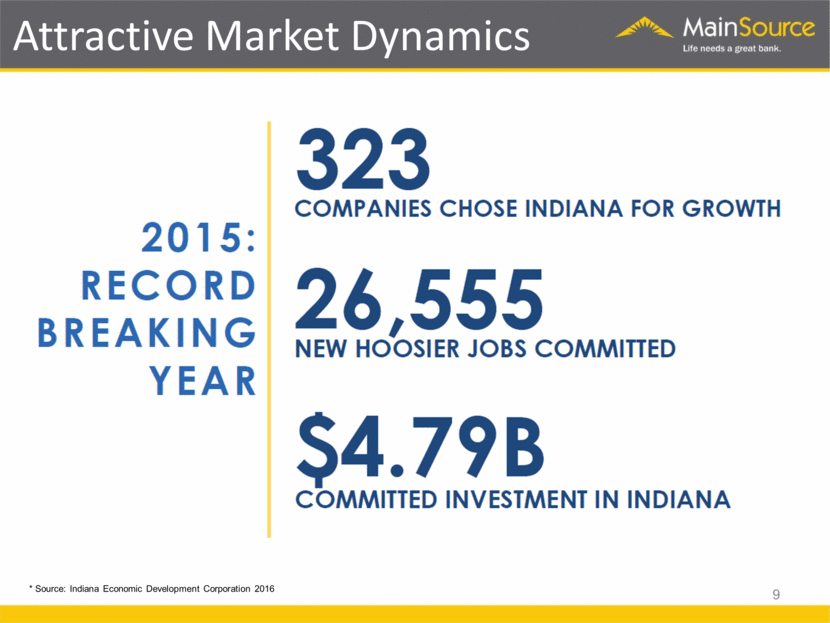
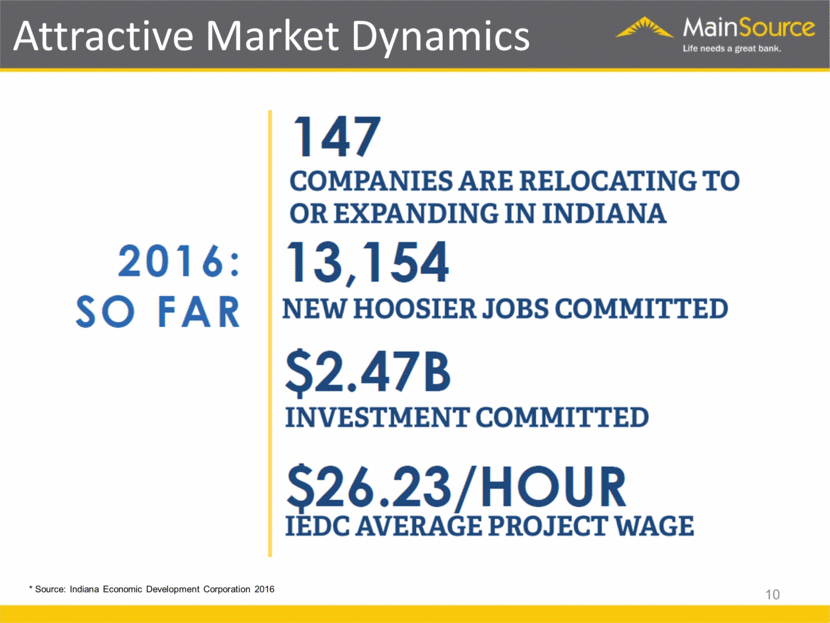
10 Attractive Market Dynamics * Source: Indiana Economic Development Corporation 2016 2016: SO FAR 147 COMPANIES ARE RELOCATING TO OR EXPANDING IN INDIANA 13,154 NEW HOOSIER JOBS COMMITTED $2.47B INVESTMENT COMMITTED $26.23/HOUR IEDC AVERAGE PROJECT WAGE 10
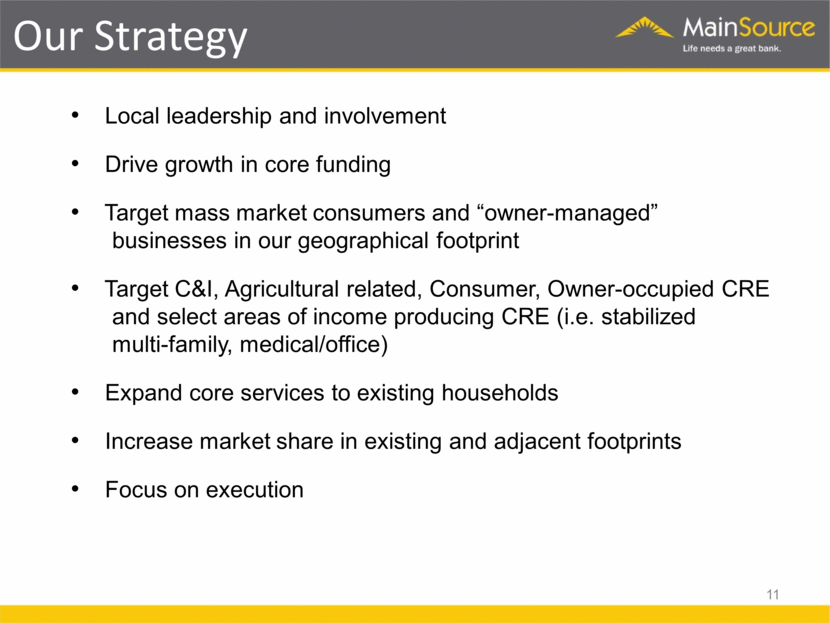
Local leadership and involvement Drive growth in core funding Target mass market consumers and “owner-managed” businesses in our geographical footprint Target C&I, Agricultural related, Consumer, Owner-occupied CRE and select areas of income producing CRE (i.e. stabilized multi-family, medical/office) Expand core services to existing households Increase market share in existing and adjacent footprints Focus on execution Our Strategy 11
Financial Trends
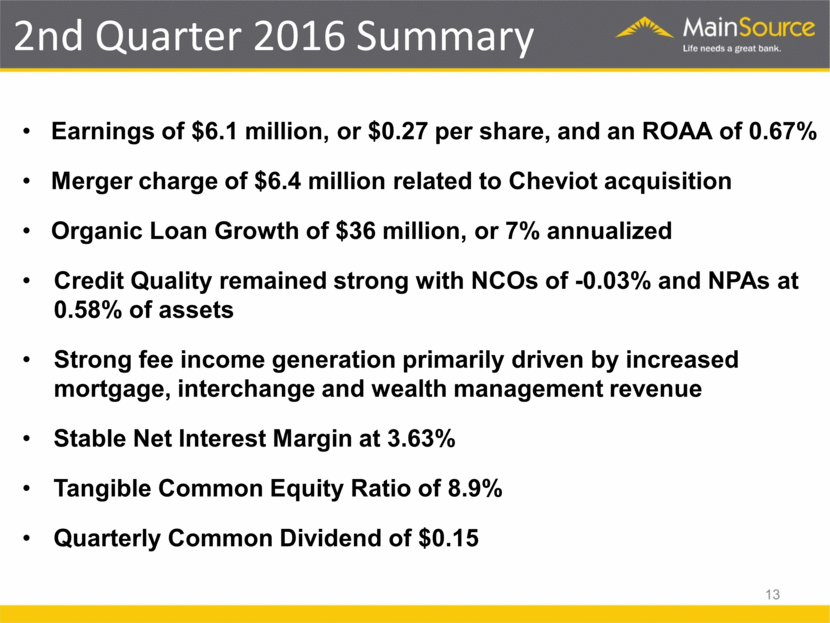
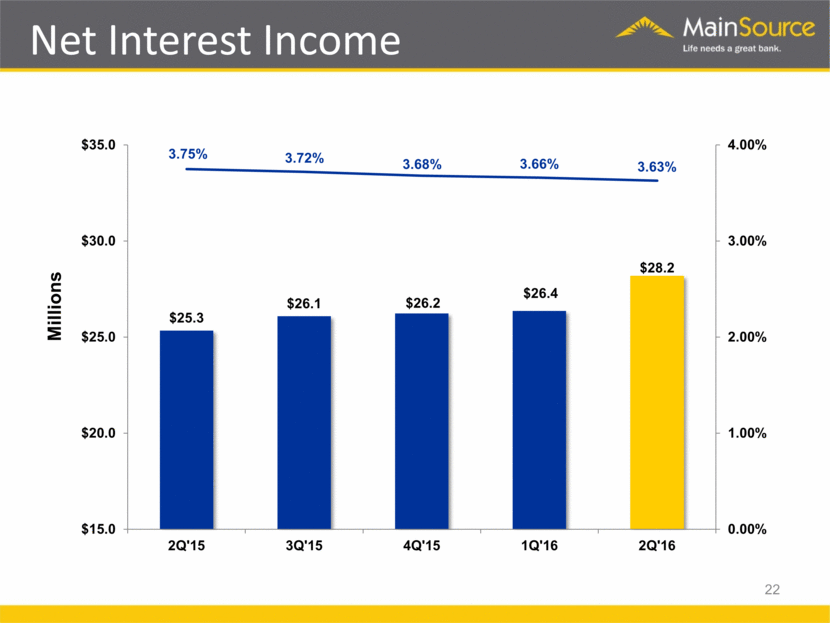
2nd Quarter 2016 Summary 13 Earnings of $6.1 million, or $0.27 per share, and an ROAA of 0.67% Merger charge of $6.4 million related to Cheviot acquisition Organic Loan Growth of $36 million, or 7% annualized Credit Quality remained strong with NCOs of -0.03% and NPAs at 0.58% of assets Strong fee income generation primarily driven by increased mortgage, interchange and wealth management revenue Stable Net Interest Margin at 3.63% Tangible Common Equity Ratio of 8.9% Quarterly Common Dividend of $0.15
14 Historical Financial Highlights ($000s, except per share) 2013 2014 2015 YTD (6/30/16) Income Statement: Net Interest Income $91,300 $94,208 $102,725 $54,570 Net Income $25,693 $28,996 $35,542 $14,883 Earnings Per Share $1.26 $1.39 $1.62 $0.66 Return of Average Assets 0.95% 0.99% 1.10% 0.85% Return of Average Equity 8.35% 8.81% 9.56% 7.45% Net Interest Margin 3.91% 3.81% 3.74% 3.64% Efficiency Ratio (actual) 69.5% 68.8% 65.9% 72.10% Balance Sheet: Assets $2,847,209 $3,122,516 $3,385,408 $3,995,541 Gross Loans $1,677,925 $1,966,047 $2,162,925 $2,561,765 Deposits $2,200,628 $2,468,321 $2,650,775 $3,099,359 NPAs & 90+PD / Assets 1.07% 1.01% 0.53% 0.58% TCE Ratio 8.44% 9.27% 9.10% 8.88% Common Dividend Per Share $0.28 $0.42 $0.54 $0.30 Note: Amounts and ratios above are reported on an actual basis and include certain items that are non-operating in nature.
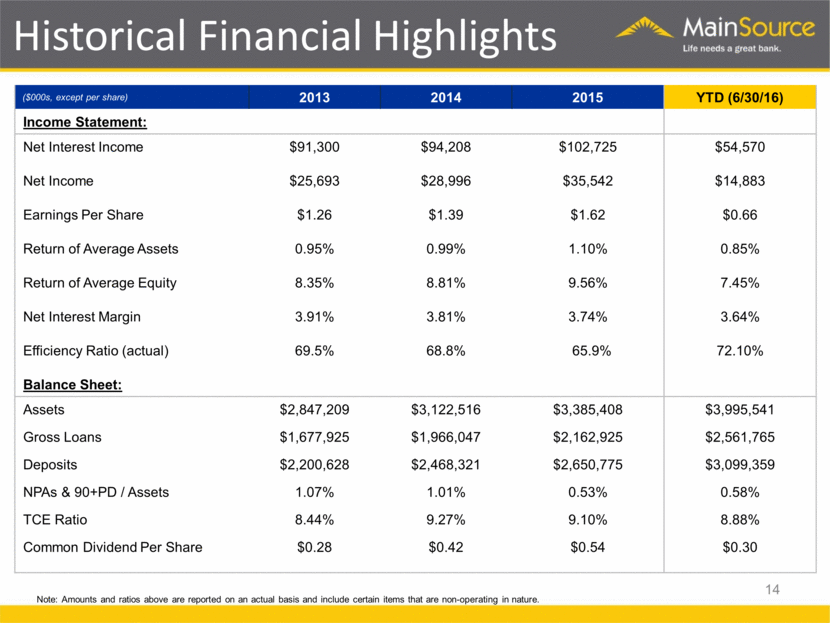
Total Assets and Loans 15 Organic Loan Growth of 7% Annualized in 2Q 2016
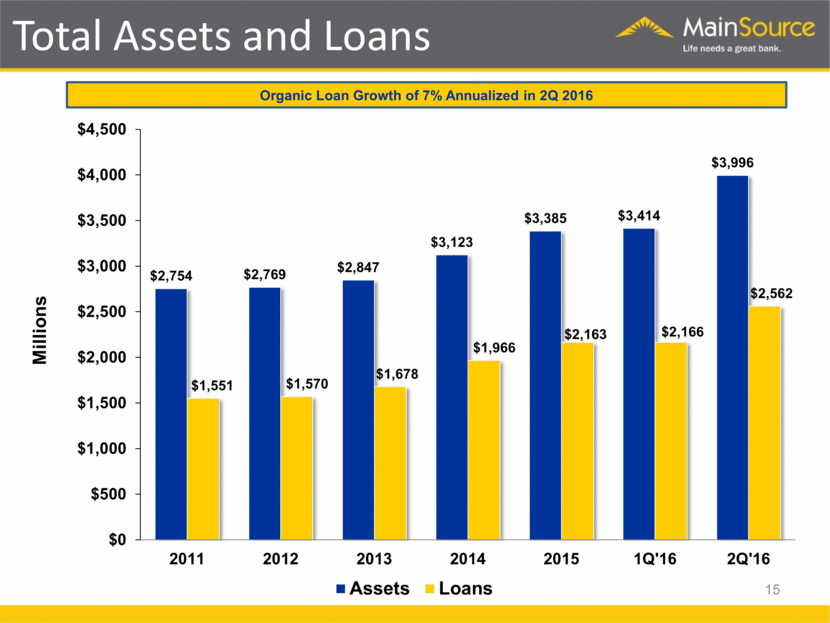
Diversified Loan Portfolio $2.6 billion Yield: 4.30% CRE: Retail = $147 1-4 Family = $73 Office/Medical = $96 Industrial/Warehouse = $163 Multi-Family = $72 Construction & Development = $83 Other = $110 16 Commercial Real Estate Portfolio ($M) Total Loans ($M) As of June 30, 2016 $982 million C&I: $408, 16% Res RE: $633, 25% Consumer: $348, 14% Ag: $178, 7% CRE: $982, 39% Retail, $187, 19% 1 - 4 Family, $77, 8% Office/ Medical, $143, 15% Multi - Family $127, 13% Industrial / Warehouse, $163, 17% Hotel, $77, 8% C&D $83, 8% Other, 125, 13%
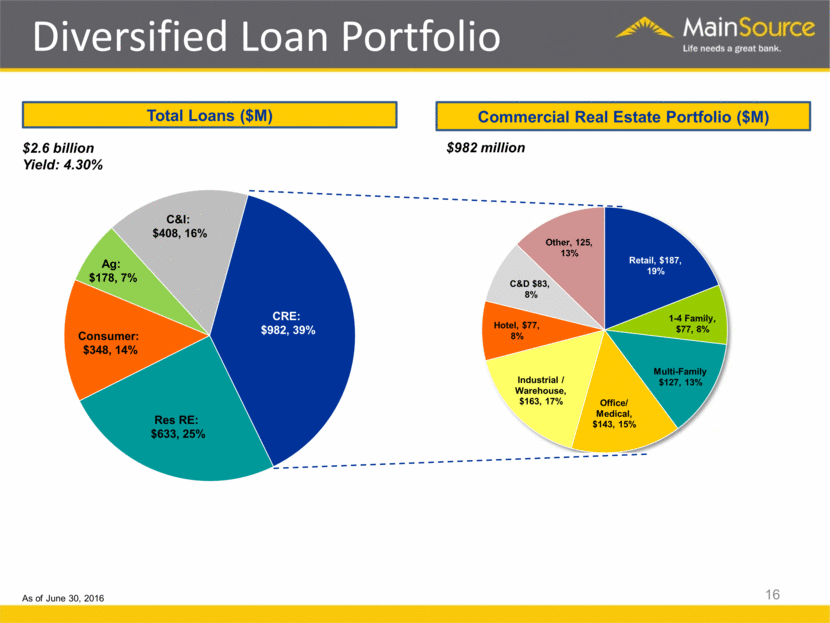
Strong Credit Quality 17 (End of Period) Millions 137% Note: 2Q 2016 includes Cheviot Financial Corp. acquired loans that were recorded at fair value.
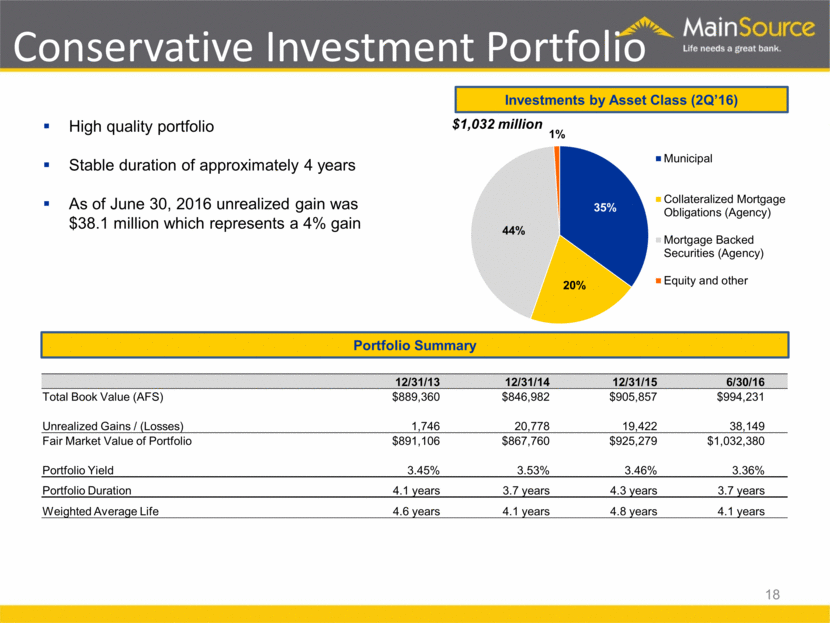
Conservative Investment Portfolio 18 Investments by Asset Class (2Q’16) Portfolio Summary High quality portfolio Stable duration of approximately 4 years As of June 30, 2016 unrealized gain was $38.1 million which represents a 4% gain 12/31/13 12/31/14 12/31/15 6/30/16 Total Book Value (AFS) $889,360 $846,982 $905,857 $994,231 Unrealized Gains / (Losses) 1,746 20,778 19,422 38,149 Fair Market Value of Portfolio $891,106 $867,760 $925,279 $1,032,380 Portfolio Yield 3.45% 3.53% 3.46% 3.36% Portfolio Duration 4.1 years 3.7 years 4.3 years 3.7 years Weighted Average Life 4.6 years 4.1 years 4.8 years 4.1 years $1,032 million 35% 20% 44% 1% Municipal Collateralized Mortgage Obligations (Agency) Mortgage Backed Securities (Agency) Equity and other
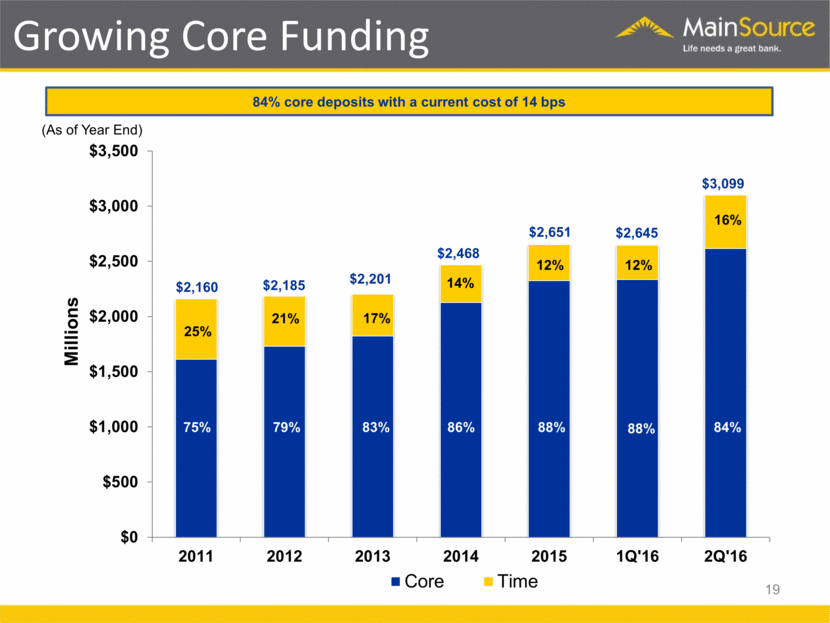
Growing Core Funding (As of Year End) 12% 12% 25% 21% 17% 83% 19 14% 86% 84% core deposits with a current cost of 14 bps 16% 88% $3,099 $2,651 $2,160 $2,185 $2,201 $0 $500 $1,000 $1,500 $2,000 $2,500 $3,000 $3,500 2011 2012 2013 2014 2015 1Q'16 2Q'16 Millions Core Time 88% 68% 75% 79% $2,468 84% $2,645
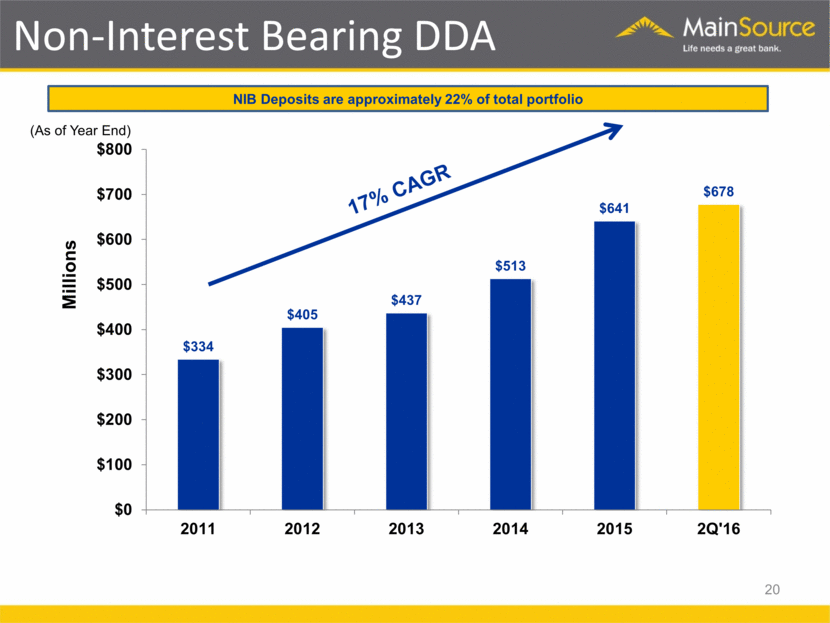
Non-Interest Bearing DDA Millions 20 NIB Deposits are approximately 22% of total portfolio (As of Year End) 17% CAGR $334 $405 $437 $513 $641 $678 $0 $100 $200 $300 $400 $500 $600 $700 $800 2011 2012 2013 2014 2015 2Q'16
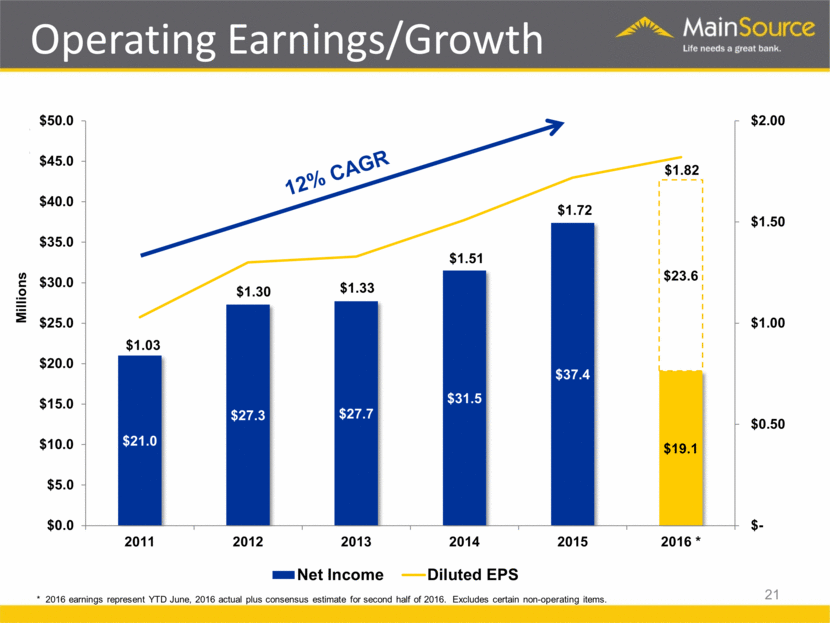
Operating Earnings/Growth Millions 21 * 2016 earnings represent YTD June, 2016 actual plus consensus estimate for second half of 2016. Excludes certain non-operating items. 12% CAGR
Net Interest Income Millions 22
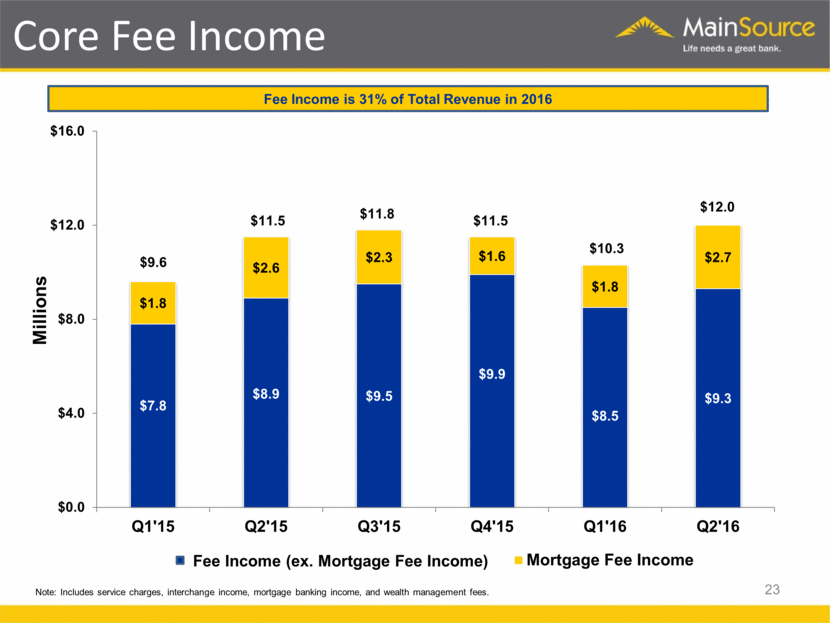
Core Fee Income Note: Includes service charges, interchange income, mortgage banking income, and wealth management fees. 23 Fee Income is 31% of Total Revenue in 2016
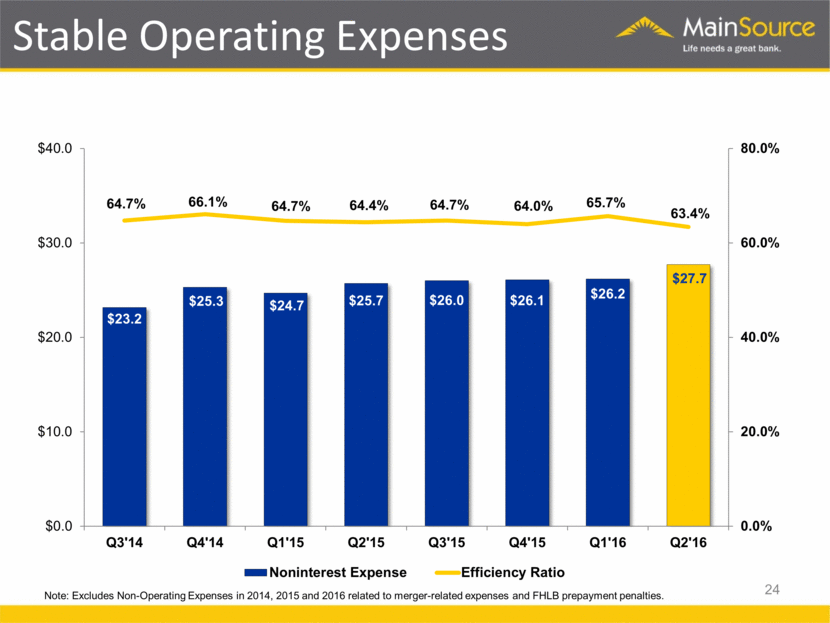
$25.4 $27.6 $30.0 $30.0 $32.2 $27.6 $25.4 $23.5 $19.7 24 $32.1 Stable Operating Expenses Note: Excludes Non-Operating Expenses in 2014, 2015 and 2016 related to merger-related expenses and FHLB prepayment penalties.
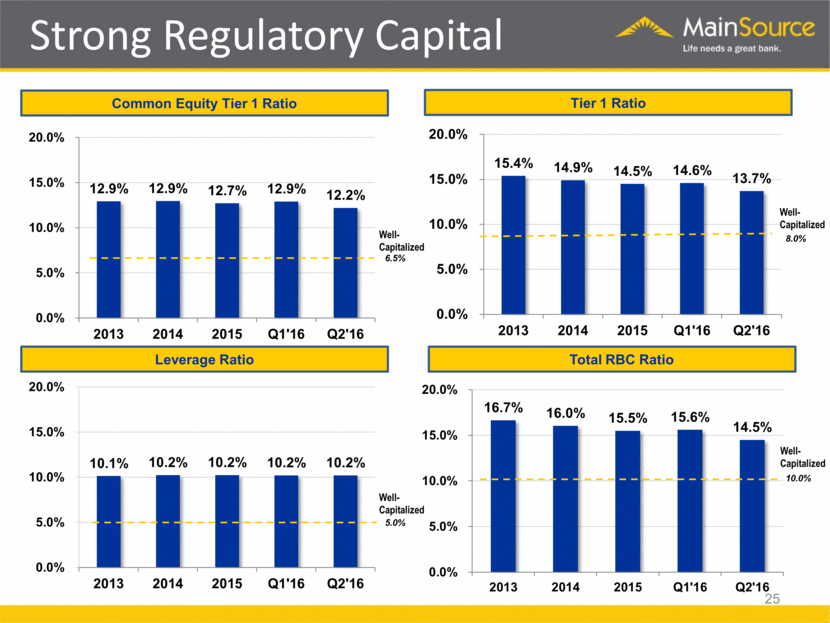
Well-Capitalized 25 Strong Regulatory Capital Leverage Ratio Tier 1 Ratio Total RBC Ratio Common Equity Tier 1 Ratio Well-Capitalized Well-Capitalized Well-Capitalized 10.0% 8.0% 5.0% 6.5% 10.1% 10.2% 10.2% 10.2% 10.2% 0.0% 5.0% 10.0% 15.0% 20.0% 2013 2014 2015 Q1'16 Q2'16 15.4% 14.9% 14.5% 14.6% 13.7% 0.0% 5.0% 10.0% 15.0% 20.0% 2013 2014 2015 Q1'16 Q2'16 12.9% 12.9% 12.7% 12.9% 12.2% 0.0% 5.0% 10.0% 15.0% 20.0% 2013 2014 2015 Q1'16 Q2'16 16.7% 16.0% 15.5% 15.6% 14.5% 0.0% 5.0% 10.0% 15.0% 20.0% 2013 2014 2015 Q1'16 Q2'16
Capital Management 26 Long-Term Dividend Payout Target 30% - 35% Common Dividend History Common Dividends During economic downturn continued dividend at $0.01 for 11 quarters Raised dividend payment in 3Q 2012 Current dividend yield of 2.5% Dividend increased to $0.15 in 1Q 2016 Strategic Capital TCE of 8.9% as of 6/30/16 Excess capital (over 8.0%) of approximately $35 million. Strategic acquisitions (branch & whole bank) Increase in common dividend Share repurchase $.01 $.03 $.03 $.06 $.06 $.08 $.08 $.10 $.10 $.11 $.11 $.13 $.13 $.14 $.14 $.15 $.15 $0.00 $0.04 $0.08 $0.12 $0.16 Q2'12 Q4'12 Q2'13 Q4'13 Q2'14 Q4'14 Q2'15 Q4'15 Q2'16
Strategic Growth
Strategic Priorities 28 Focus on quality loan growth Maintain asset quality Expense control and operating efficiency Successfully execute expansion strategies Strategic M&A Grow earnings and drive shareholder value
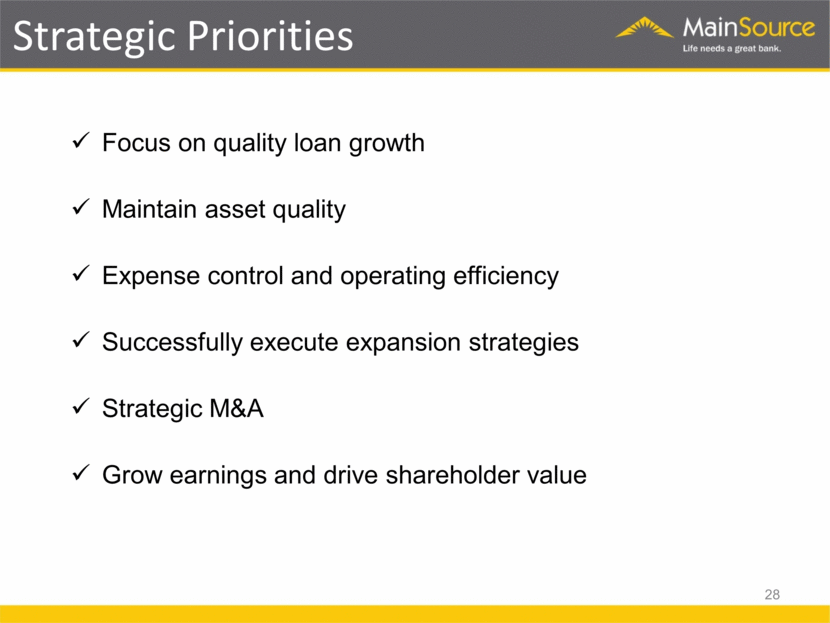
Opportunistic Hiring Proven Teams Best in Market Locations Existing or Adjacent Markets Creating Better Opportunities for Loan Growth Expansion Strategy 29 Overview History of Successful Expansion Columbus, Indiana Established presence in 2009, 3 branches, $106 million in deposits and $276 million in loans Seymour, Indiana Established presence in 2012, $31 million in deposits and $43 million in loans Bloomington, Indiana Established presence in 2013, second location in 2015, $63 million in deposits and $74 million in loans Indianapolis, Indiana Established presence in 2012, second location in 2014, $14 million in deposits and $188 million in loans, third location planned for 2016 Cincinnati, Ohio Established presence in 2013, with a loan production office Louisville, Kentucky Established presence in 2014, plan to add second location in 2017, $44 million in deposits and $78 million in loans
30 Geographic fit Financially attractive Accretive to earnings Efficient use of capital Reasonable size Similar culture Leverages MainSource brand and capabilities Merger & Acquisition Strategy Acquisition of MBT Bancorp ($225 million in assets) in 2014, enhanced Cincinnati presence Acquired 5 ONB branches in August 2015, representing $100 million in deposits and $40 million in loans Further expansion of Cincinnati presence with acquisition of Cheviot Financial Corp. Overview Recent History
Valuation
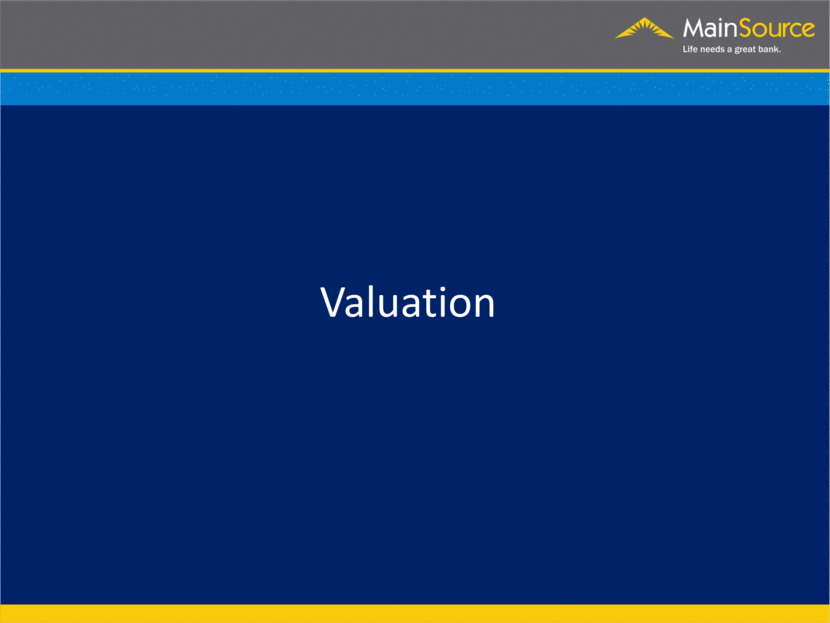
32 Attractive Valuation Price / TBV Multiple Price / EPS Multiple Pricing data as of 9/4/16, earnings estimates are based on FactSet mean estimates. Peer group consists of a group of 10 publicly traded depositories with assets between $1B and $12.5B that operate in the Midwest and throughout our market areas. Includes: ONB, PRK, FFBC, WSBC, FRME, SRCE, LKFN, SYBT, PEBO and HBNC. 169% 187% 0% 50% 100% 150% 200% 250% MSFG Selected MW Peers 13.1x 12.1x 15.2x 14.4x 0.0x 4.0x 8.0x 12.0x 16.0x 20.0x Price / 2016 EPS Price / 2017 EPS MSFG Selected MW Peers
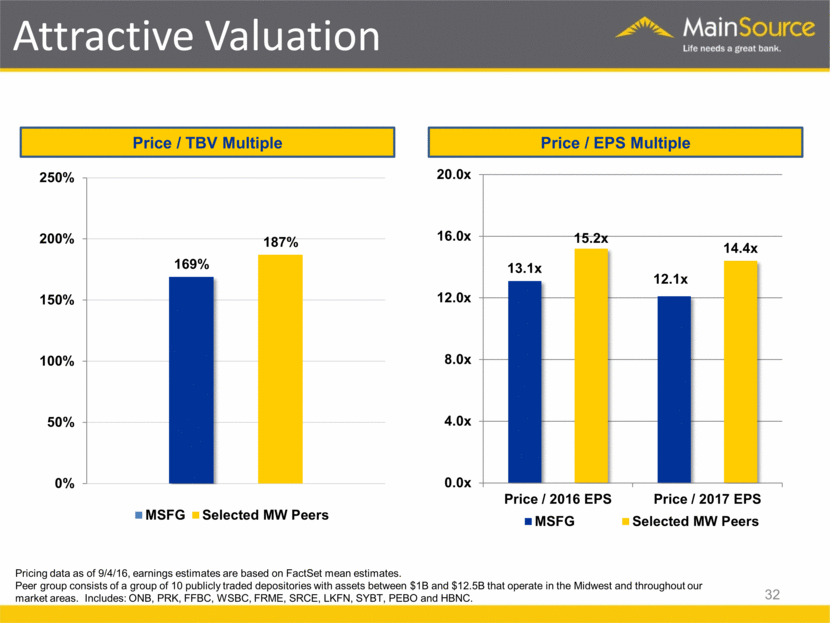
Proven and experienced management team High quality deposit franchise Expanding presence in large, higher growth markets Focus on shareholder value Attractive valuation Capital strength provides flexibility Positioned for sustainable, profitable growth Investment Highlights 33
MainSource FINANCIAL GROUP Meeting the financial needs of our costomers... for life
