Attached files
| file | filename |
|---|---|
| 8-K - FORM 8-K - CHARTER FINANCIAL CORP | chfn092020168-k.htm |

This presentation may contain certain forward-looking statements
regarding our prospective performance and strategies within the
meaning of Section 27A of the Securities Act of 1933, as amended and
Section 21E of the Securities Exchange Act of 1934, as amended. We
intend such forward-looking statements to be covered by the Safe
Harbor Provision for forward-looking statements contained in the
Private Securities Litigation Reform Act of 1995, and are including
this statement for purposes of said safe harbor provision. Forward-
looking statements can be identified by the use of words such as
“estimate,” “project,” “believe,” “intend,” “anticipate,” “plan,”
“seek,” “expect” and words of similar meaning. These forward-
looking statements include, but are not limited to:
• statements of our goals, intentions and expectations;
• statements regarding our business plans, prospects, growth and
operating strategies;
• statements regarding the asset quality of our loan and investment
portfolios; and
• estimates of our risks and future costs and benefits.
These forward-looking statements are based on current beliefs and
expectations of our management and are inherently subject to significant
business, economic and competitive uncertainties and contingencies,
many of which are beyond our control. In addition, these forward-looking
statements are subject to assumptions with respect to future business
strategies and decisions that are subject to change.
The following factors, among others, could cause actual results to differ
materially from the anticipated results or other expectations expressed in
the forward-looking statements:
• general economic conditions, either nationally or in our market
areas, that are worse than expected;
• competition among depository and other financial institutions
FORWARD-LOOKING STATEMENT
• changes in the interest rate environment that reduce our margins
or reduce the fair value of financial instruments;
• adverse changes in the securities markets;
• changes in laws or government regulations or policies affecting
financial institutions, including changes in regulatory fees and
capital requirements;
• our ability to enter new markets successfully and capitalize on
growth opportunities;
• our ability to successfully identify, acquire, and integrate future
acquisitions;
• our incurring higher than expected loan charge-offs with respect
to assets acquired in FDIC-assisted acquisitions;
• changes in consumer spending, borrowing and savings habits;
• changes in accounting policies and practices, as may be adopted
by the bank regulatory agencies and the Financial Accounting
Standards Board; and
• changes in our organization, compensation and benefit plans.
Because of these and other uncertainties, our actual future results may
be materially different from the results indicated by these forward-looking
statements. Readers are cautioned not to place undue reliance on the
forward-looking statements contained herein, which speak only as of
the date of this presentation. Except as required by applicable law or
regulation, we do not undertake, and specifically disclaim any obligation to
update any forward-looking statements that may be made from time to time
by or on behalf of the Company. Please see “Risk Factors” beginning on
page 19 of the Company’s Prospectus dated February 11, 2013.
2
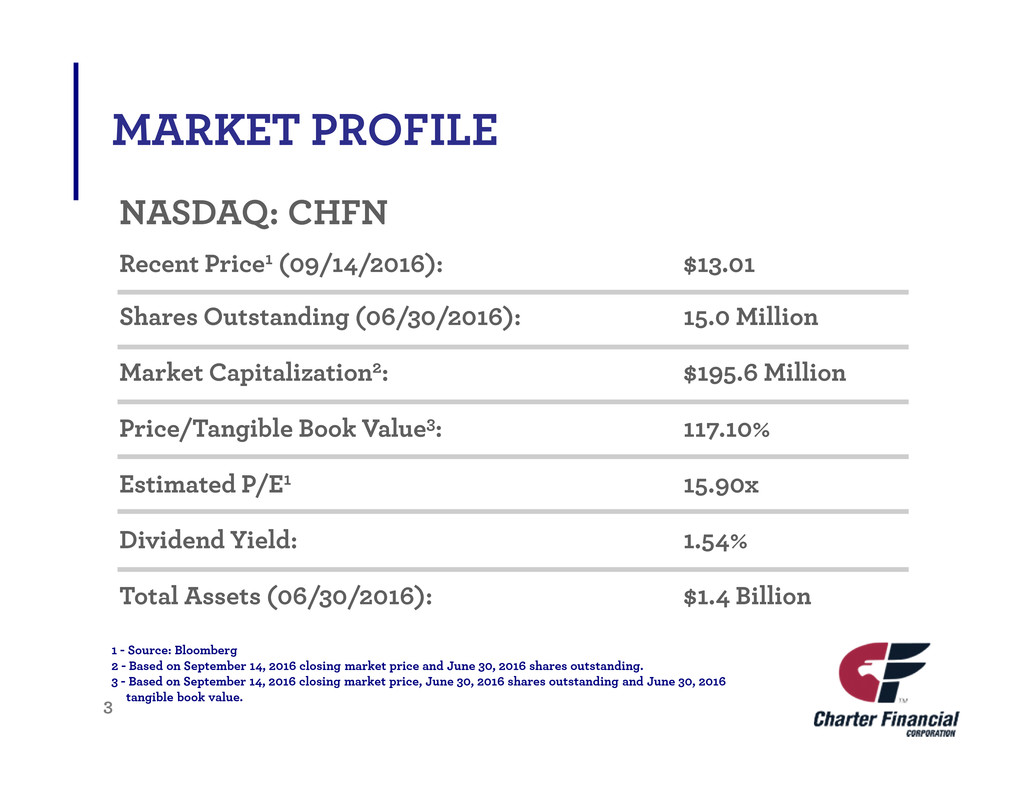
NASDAQ: CHFN
Recent Price1 (09/14/2016): $13.01
Shares Outstanding (06/30/2016): 15.0 Million
Market Capitalization2: $195.6 Million
Price/Tangible Book Value3: 117.10%
Estimated P/E1 15.90x
Dividend Yield: 1.54%
Total Assets (06/30/2016): $1.4 Billion
1 - Source: Bloomberg
2 - Based on September 14, 2016 closing market price and June 30, 2016 shares outstanding.
3 - Based on September 14, 2016 closing market price, June 30, 2016 shares outstanding and June 30, 2016
tangible book value.
MARKET PROFILE
3
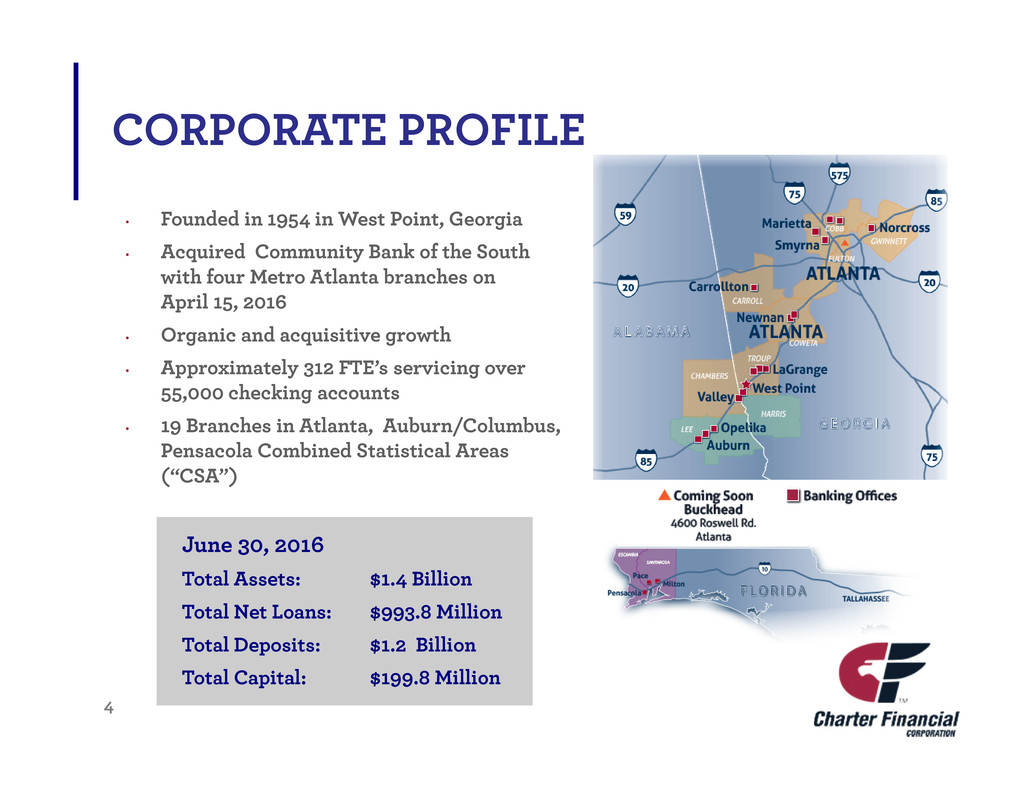
• Founded in 1954 in West Point, Georgia
• Acquired Community Bank of the South
with four Metro Atlanta branches on
April 15, 2016
• Organic and acquisitive growth
• Approximately 312 FTE’s servicing over
55,000 checking accounts
• 19 Branches in Atlanta, Auburn/Columbus,
Pensacola Combined Statistical Areas
(“CSA”)
CORPORATE PROFILE
June 30, 2016
Total Assets: $1.4 Billion
Total Net Loans: $993.8 Million
Total Deposits: $1.2 Billion
Total Capital: $199.8 Million
4
z
• Focus on growing Atlanta presence
• Conservative credit
• M&A experience … 6 transactions both assisted & unassisted
• Transformed balance sheet from traditional Thrift to Commercial Bank
OVERVIEW OF MANAGEMENT TEAM
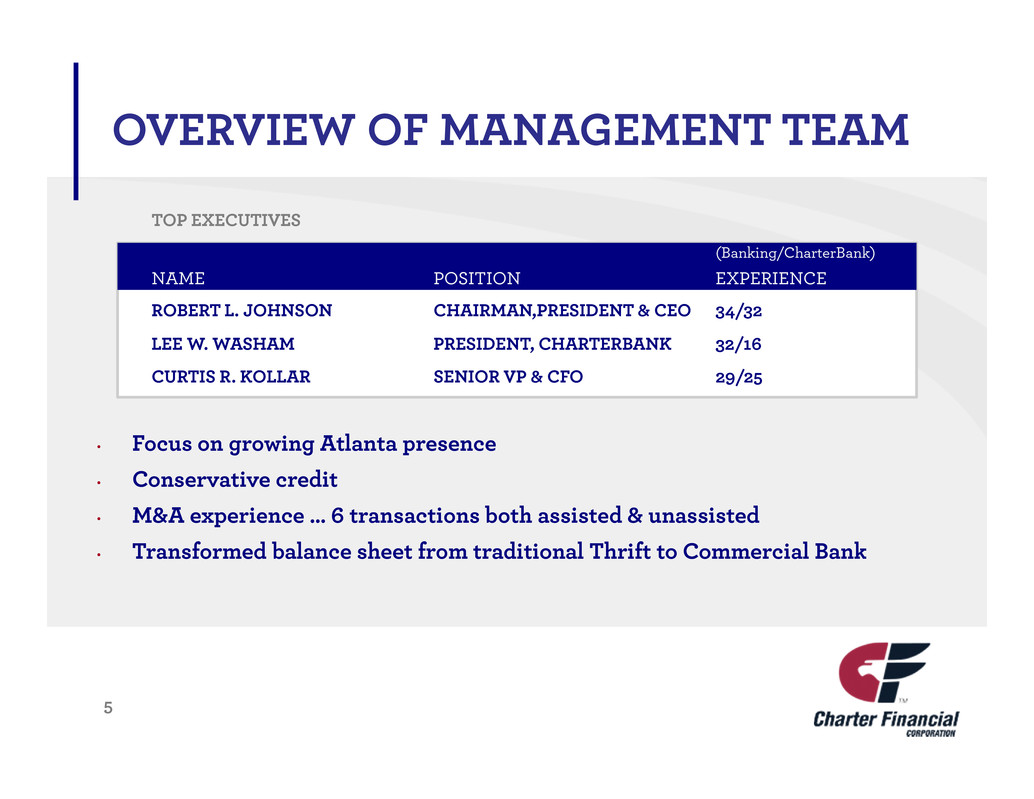
TOP EXECUTIVES
(Banking/CharterBank)
NAME POSITION EXPERIENCE
ROBERT L. JOHNSON CHAIRMAN,PRESIDENT & CEO 34/32
LEE W. WASHAM PRESIDENT, CHARTERBANK 32/16
CURTIS R. KOLLAR SENIOR VP & CFO 29/25
5
Recent acquisition expands growth and lending
opportunities on north side of Atlanta
Legacy markets energized with new job growth
Continued growth of auto industry on I-85 corridor
Most of our markets have significant
manufacturing, university or military influences
Active regional M&A market
MARKET CONDITIONS
6
RECENT ACCOMPLISHMENTS
• Atlanta Expansion
• Acquisition of Community Bank of the South (“CBS”)
• Lift-out of seasoned Buckhead team
• Developing EPS
• Excellent credit quality - nonperforming assets
0.46% of assets
• Accretive share repurchases
7
Source: SNL Financial
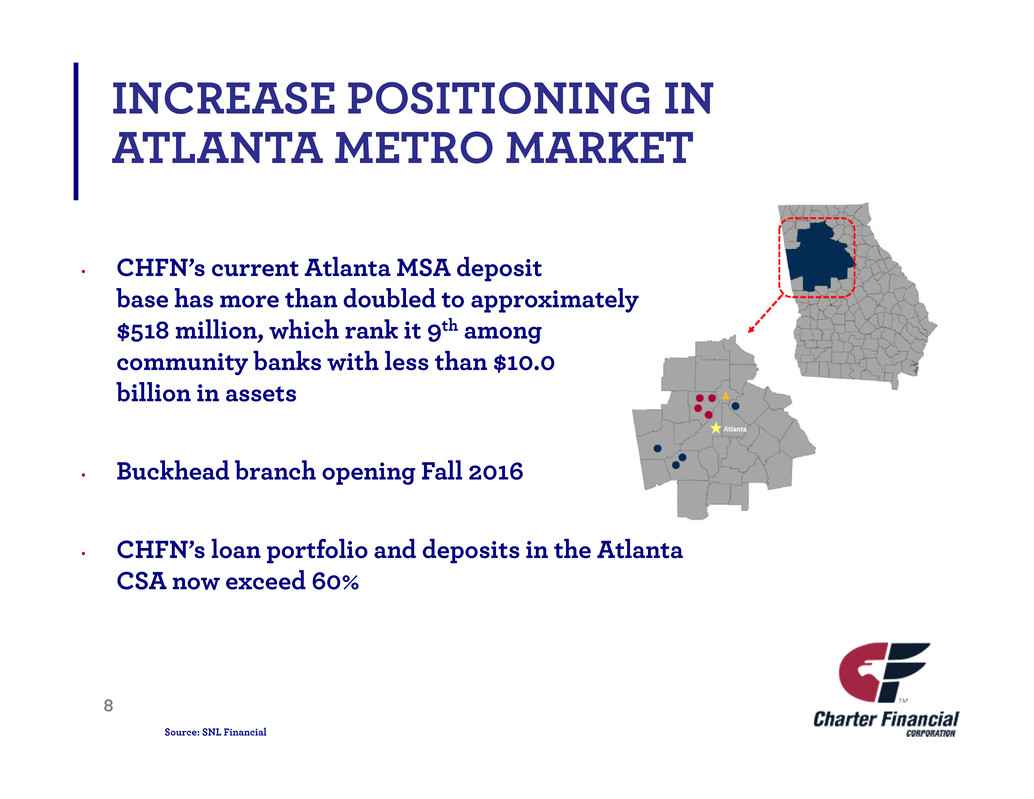
• CHFN’s current Atlanta MSA deposit
base has more than doubled to approximately
$518 million, which rank it 9th among
community banks with less than $10.0
billion in assets
• Buckhead branch opening Fall 2016
• CHFN’s loan portfolio and deposits in the Atlanta
CSA now exceed 60%
8
INCREASE POSITIONING IN
ATLANTA METRO MARKET
CBS TRANSACTION HIGHLIGHTS
9
• Strongly accretive to forward EPS
• $300 million in both deposits and loans in the
desirable north side Atlanta/Cobb County market
• Proven lending team
• Opportunities for earnings accretion:
• Market growth
• Retail synergy
• Community bank market consolidation
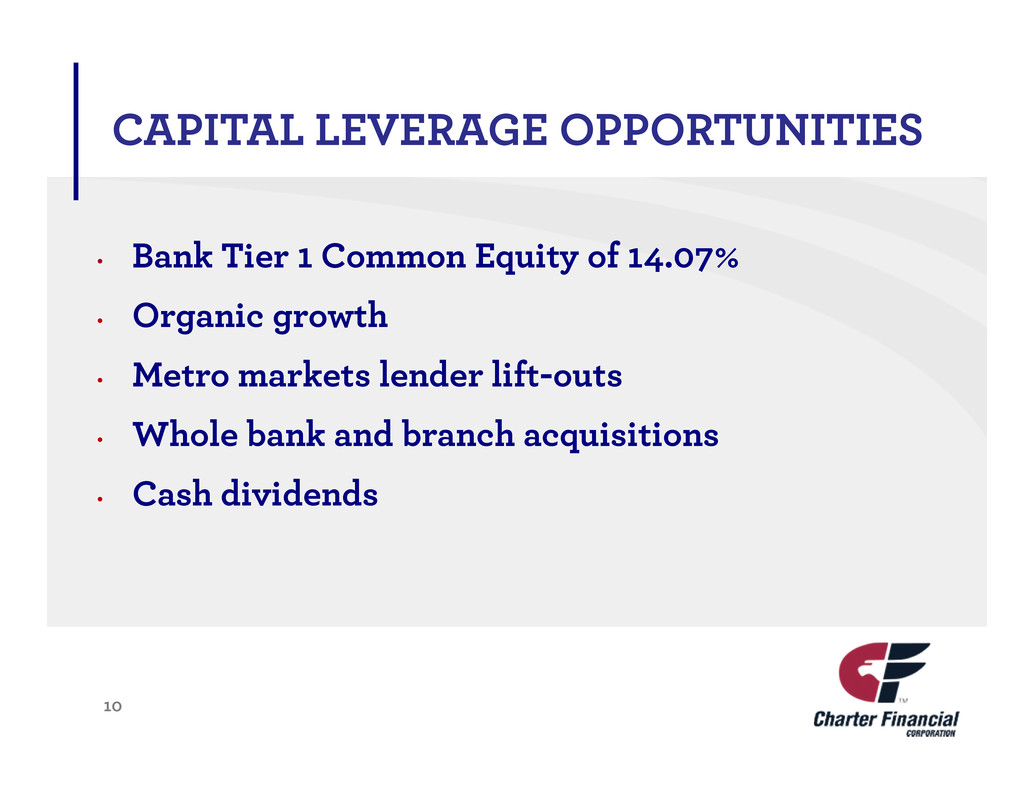
CAPITAL LEVERAGE OPPORTUNITIES
• Bank Tier 1 Common Equity of 14.07%
• Organic growth
• Metro markets lender lift-outs
• Whole bank and branch acquisitions
• Cash dividends
10
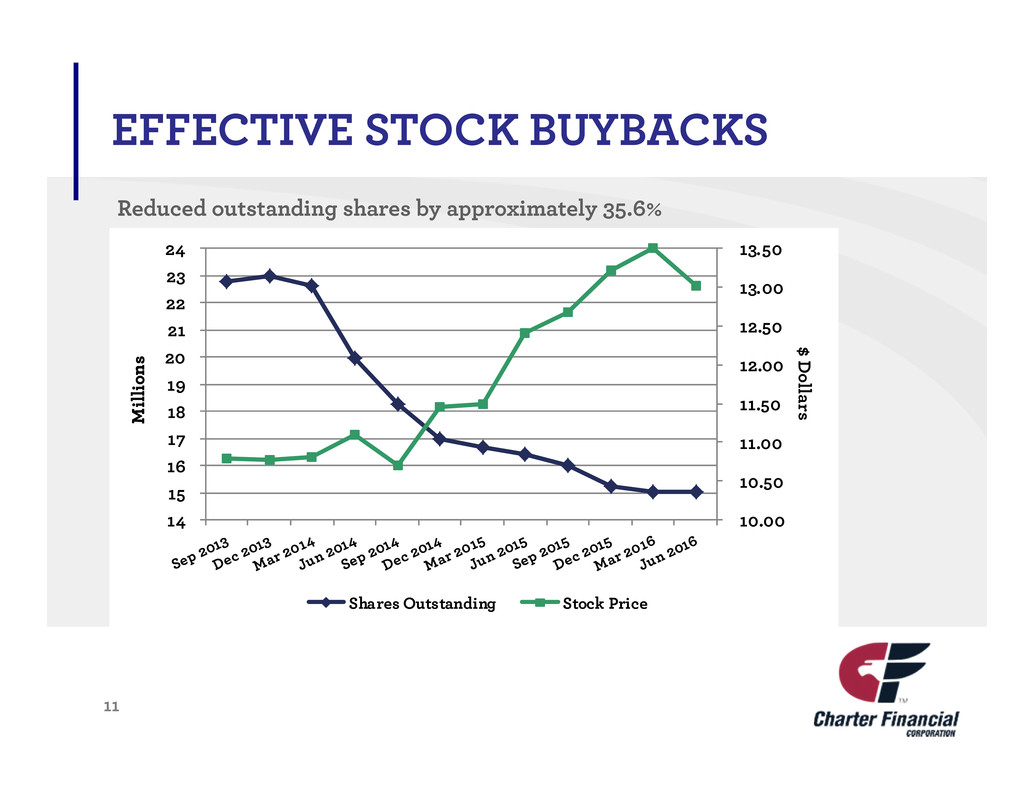
Reduced outstanding shares by approximately 35.6%
EFFECTIVE STOCK BUYBACKS
11
10.00
10.50
11.00
11.50
12.00
12.50
13.00
13.50
14
15
16
17
18
19
20
21
22
23
24
$ Dollars
M
i
l
l
i
o
n
s
M
i
l
l
i
o
n
s
M
i
l
l
i
o
n
s
M
i
l
l
i
o
n
s
Shares Outstanding Stock Price
FINANCIAL INFORMATION
12
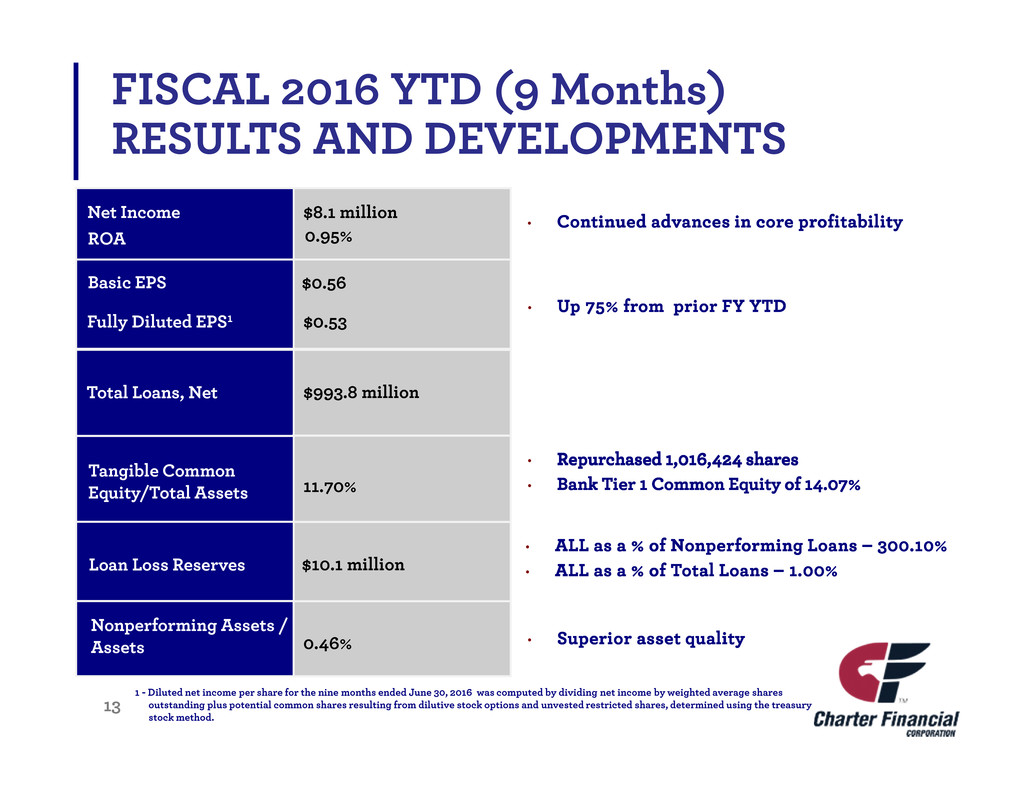
Total Loans, Net
Tangible Common
Equity/Total Assets
Net Income $8.1 million
Fully Diluted EPS1 $0.53
Loan Loss Reserves $10.1 million
• ALL as a % of Nonperforming Loans – 300.10%
• ALL as a % of Total Loans – 1.00%
• Continued advances in core profitability
Nonperforming Assets /
Assets 0.46% • Superior asset quality
11.70%
$993.8 million
1 - Diluted net income per share for the nine months ended June 30, 2016 was computed by dividing net income by weighted average shares
outstanding plus potential common shares resulting from dilutive stock options and unvested restricted shares, determined using the treasury
stock method.
• Up 75% from prior FY YTD
• Repurchased 1,016,424 shares
• Bank Tier 1 Common Equity of 14.07%
Basic EPS $0.56
FISCAL 2016 YTD (9 Months)
RESULTS AND DEVELOPMENTS
13
ROA 0.95%
Note: Unless otherwise noted, the above chart displays information based on Charter’s fiscal year end, which is September 30.
1 - Core deposits consist of transaction accounts, money market accounts, and savings accounts.
BALANCE SHEET HIGHLIGHTS
14
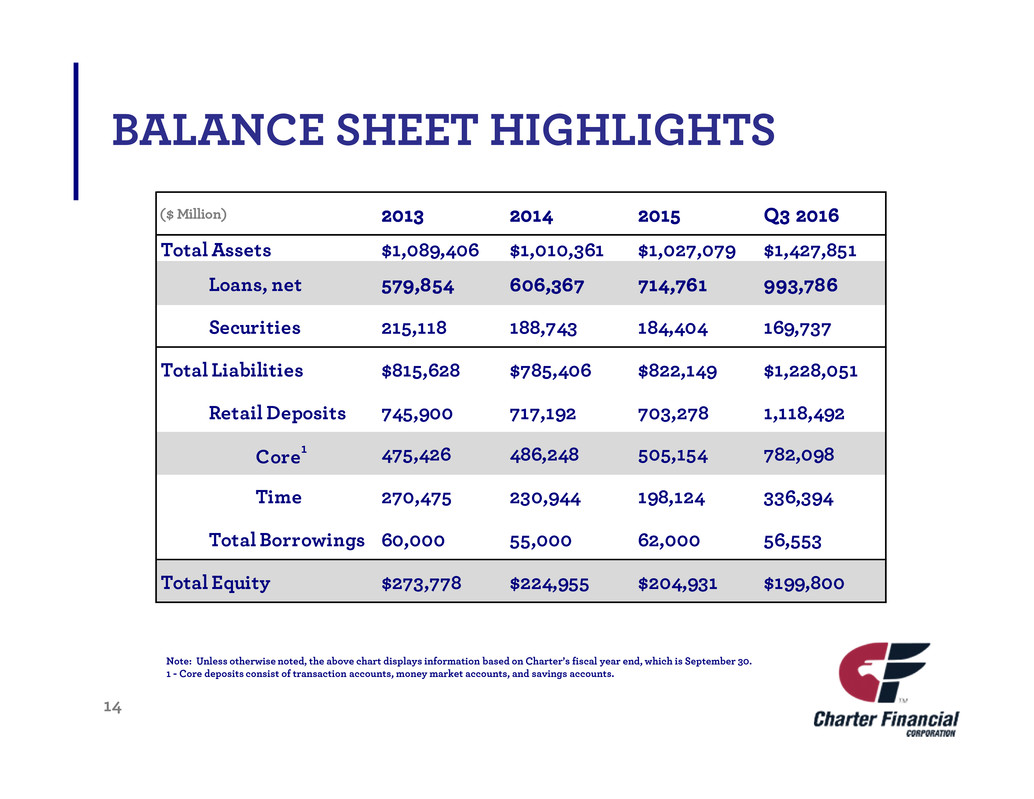
($ Million) 2013 2014 2015 Q3 2016
Total Assets $1,089,406 $1,010,361 $1,027,079 $1,427,851
Loans, net 579,854 606,367 714,761 993,786
Securities 215,118 188,743 184,404 169,737
Total Liabilities $815,628 $785,406 $822,149 $1,228,051
Retail Deposits 745,900 717,192 703,278 1,118,492
Core1 475,426 486,248 505,154 782,098
Time 270,475 230,944 198,124 336,394
Total Borrowings 60,000 55,000 62,000 56,553
Total Equity $273,778 $224,955 $204,931 $199,800
32.1%
Note: Core Deposits = Transaction, Savings & Money Market Accounts
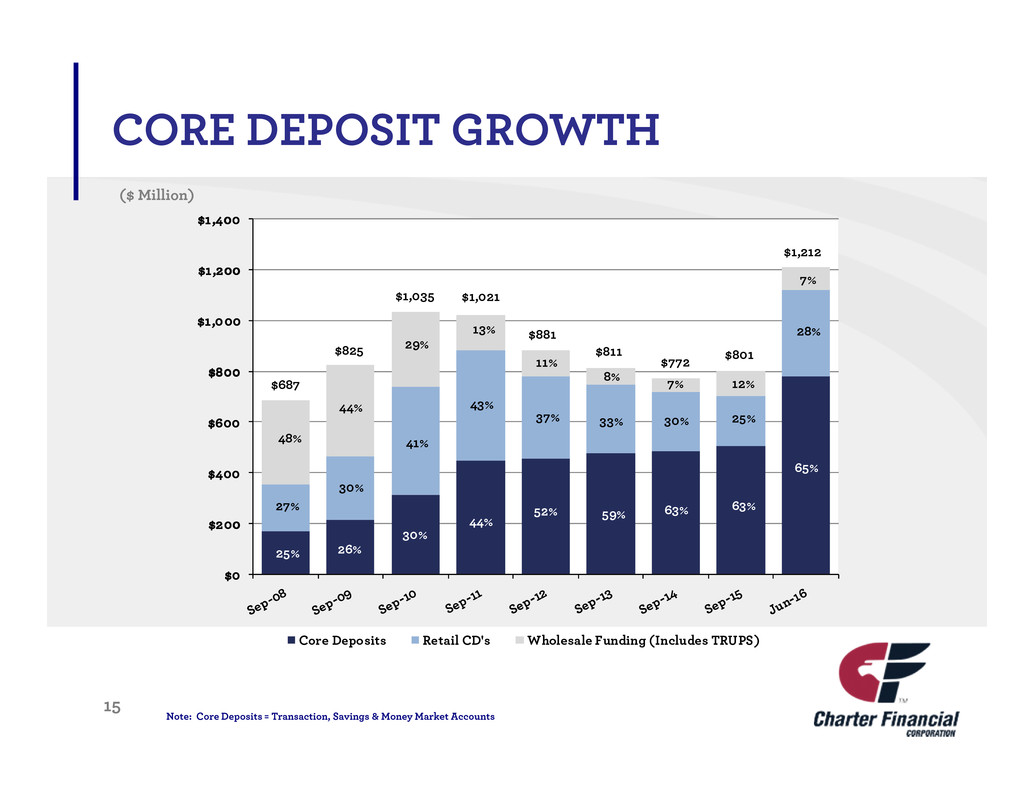
($ Million)
CORE DEPOSIT GROWTH
15
$0
$200
$400
$600
$800
$1,000
$1,200
$1,400
Core Deposits Retail CD's Wholesale Funding (Includes TRUPS)
48%
27%
25% 26%
30%
44%
30%
41%
29%
43%
13%
44%
$1,021
$825
$1,035
$881
11%
37%
52%
$811
8%
59%
33%
$687
$801
12%
25%
63%
$772
7%
30%
63%
65%
$1,212
7%
28%
At June 30, 2016
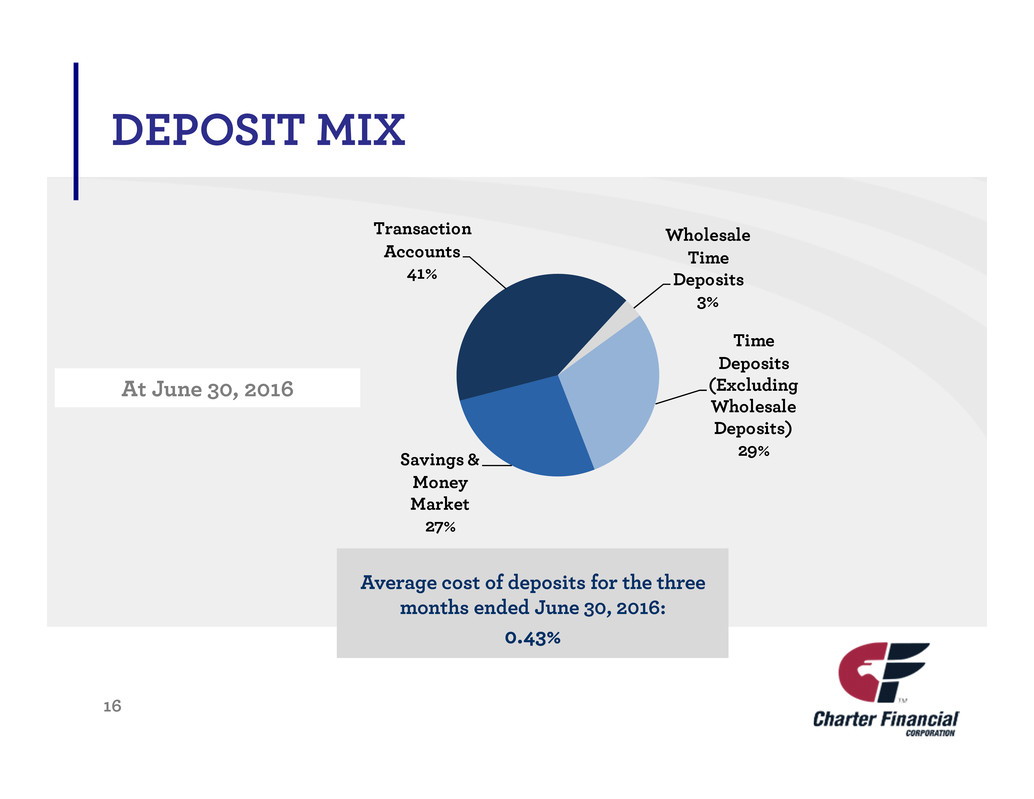
Average cost of deposits for the three
months ended June 30, 2016:
0.43%
DEPOSIT MIX
16
Time
Deposits
(Excluding
Wholesale
Deposits)
29%Savings &
Money
Market
27%
Transaction
Accounts
41%
Wholesale
Time
Deposits
3%
Note: Unless otherwise noted, the above chart displays information based on Charter’s fiscal year end, which is September 30.
[1] Due to the early termination of the FDIC loss share agreements in the fourth quarter of fiscal 2015, ratios for the nine months ended June 30,
2016, include all previously covered assets with the exception of FAS ASC 310-30 loans that are excluded from nonperforming loans due to the
ongoing recognition of accretion income established at the time of acquisition. Ratios for periods prior to September 30, 2015, represent non-
covered data only.
LOAN MIX - June 30, 2016
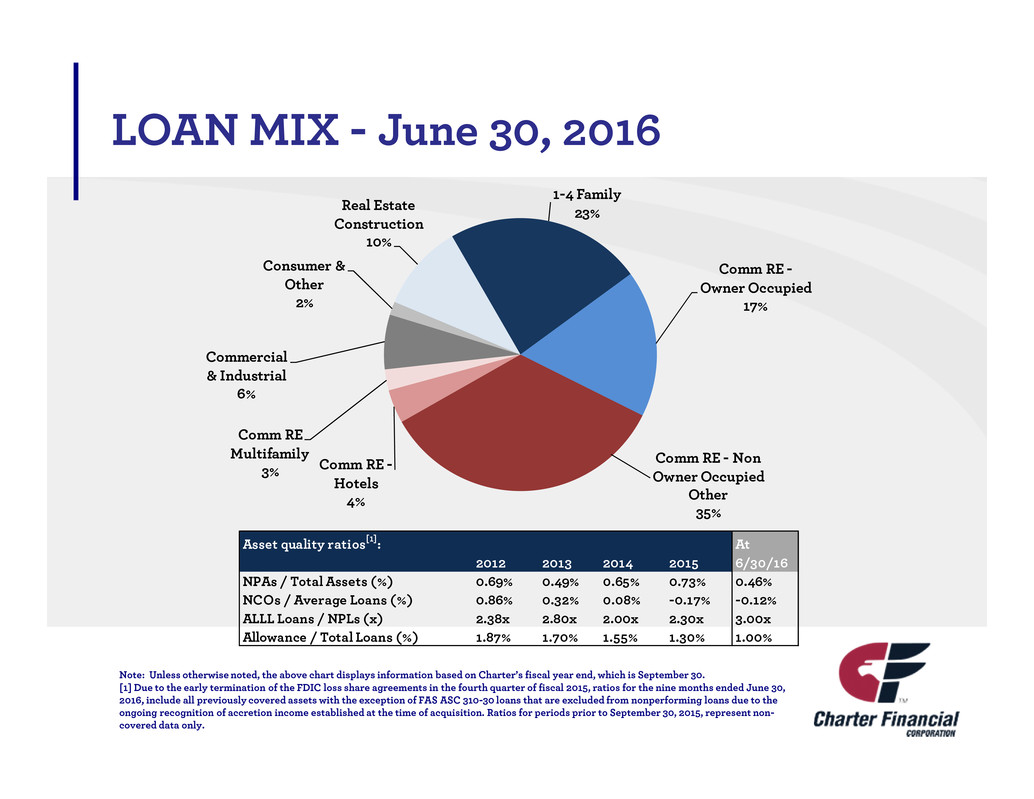
1-4 Family
23%
Comm RE -
Owner Occupied
17%
Comm RE - Non
Owner Occupied
Other
35%
Comm RE -
Hotels
4%
Comm RE
Multifamily
3%
Commercial
& Industrial
6%
Consumer &
Other
2%
Real Estate
Construction
10%
Asset quality ratios[1]: At
2012 2013 2014 2015 6/30/16
NPAs / Total Assets (%) 0.69% 0.49% 0.65% 0.73% 0.46%
NCOs / Average Loans (%) 0.86% 0.32% 0.08% -0.17% -0.12%
ALLL Loans / NPLs (x) 2.38x 2.80x 2.00x 2.30x 3.00x
Allowance / Total Loans (%) 1.87% 1.70% 1.55% 1.30% 1.00%
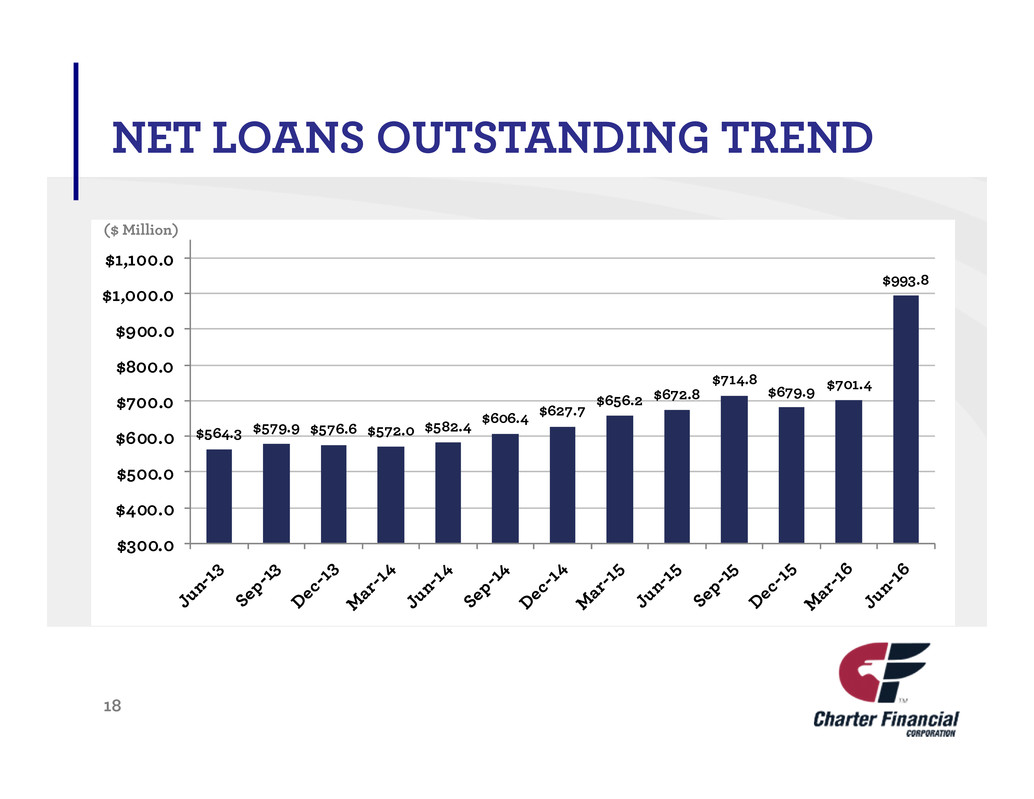
$564.3 $579.9 $576.6 $572.0 $582.4
$606.4 $627.7
$656.2 $672.8
$714.8
$679.9 $701.4
$993.8
$300.0
$400.0
$500.0
$600.0
$700.0
$800.0
$900.0
$1,000.0
$1,100.0
($ Million)
NET LOANS OUTSTANDING TREND
18
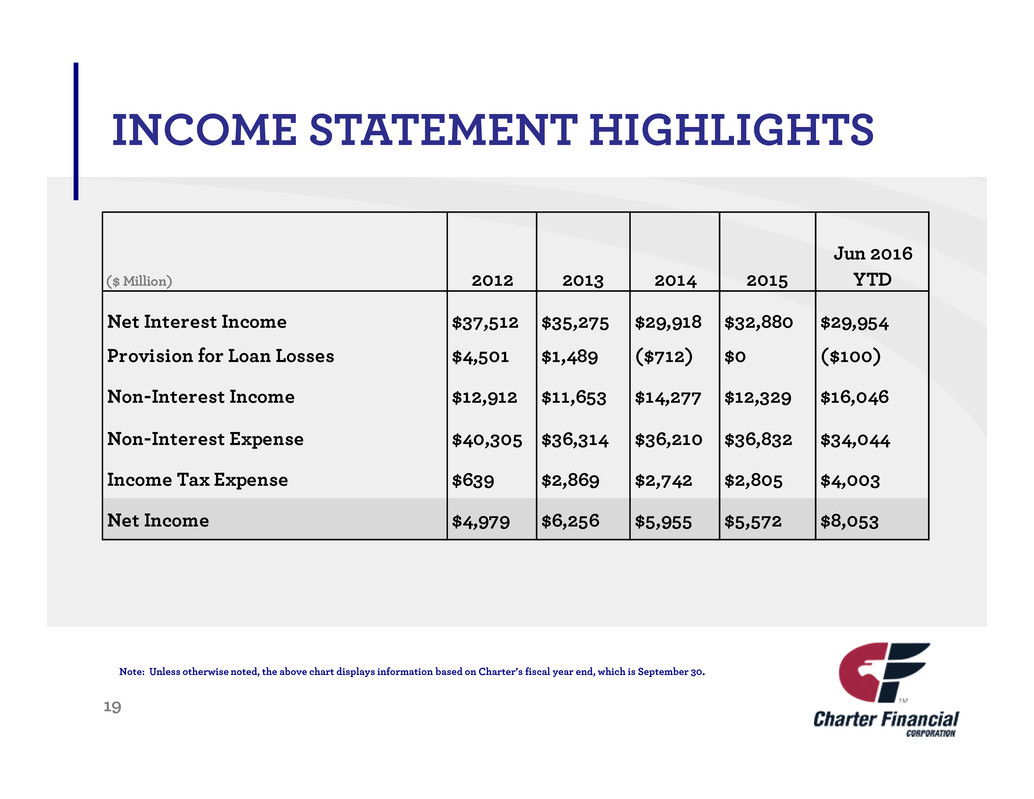
Note: Unless otherwise noted, the above chart displays information based on Charter’s fiscal year end, which is September 30.
INCOME STATEMENT HIGHLIGHTS
19
Jun 2016
($ Million) 2012 2013 2014 2015 YTD
Net Interest Income $37,512 $35,275 $29,918 $32,880 $29,954
Provision for Loan Losses $4,501 $1,489 ($712) $0 ($100)
Non-Interest Income $12,912 $11,653 $14,277 $12,329 $16,046
Non-Interest Expense $40,305 $36,314 $36,210 $36,832 $34,044
Income Tax Expense $639 $2,869 $2,742 $2,805 $4,003
Net Income $4,979 $6,256 $5,955 $5,572 $8,053
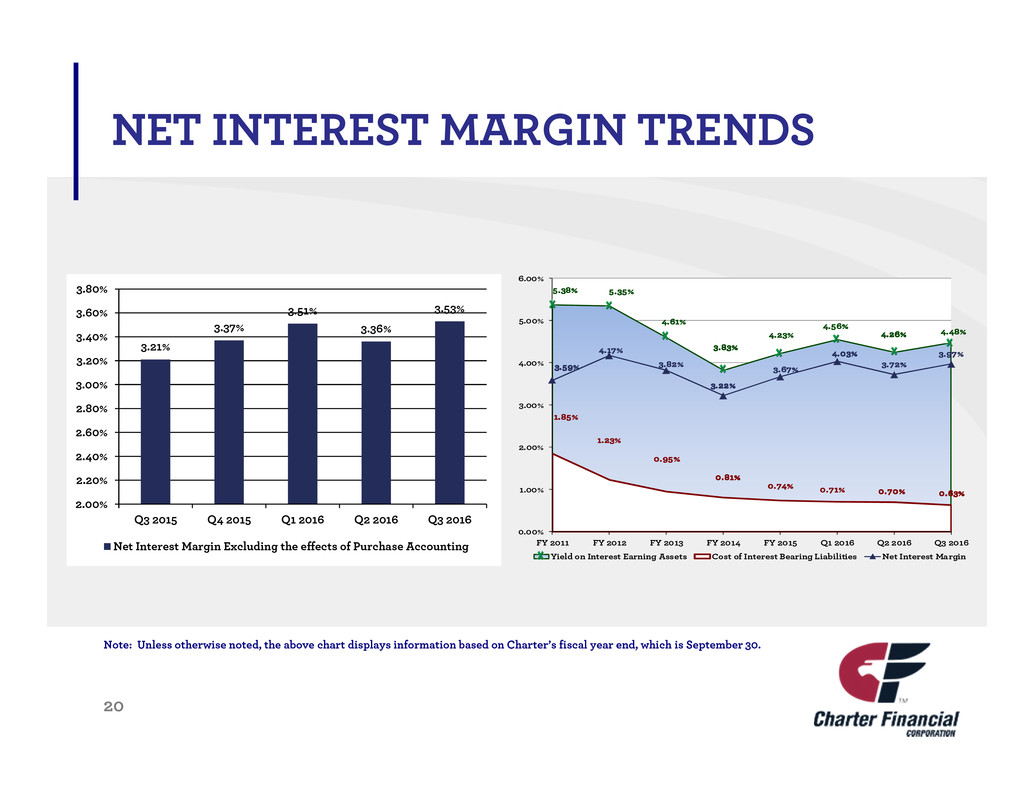
5.38% 5.35%
4.61%
3.83%
4.23%
4.56%
4.26% 4.48%
1.85%
1.23%
0.95%
0.81%
0.74% 0.71% 0.70% 0.63%
3.59%
4.17%
3.82%
3.22%
3.67%
4.03%
3.72%
3.97%
0.00%
1.00%
2.00%
3.00%
4.00%
5.00%
6.00%
FY 2011 FY 2012 FY 2013 FY 2014 FY 2015 Q1 2016 Q2 2016 Q3 2016
Yield on Interest Earning Assets Cost of Interest Bearing Liabilities Net Interest Margin
Note: Unless otherwise noted, the above chart displays information based on Charter’s fiscal year end, which is September 30.
20
NET INTEREST MARGIN TRENDS
3.21%
3.37%
3.51%
3.36%
3.53%
2.00%
2.20%
2.40%
2.60%
2.80%
3.00%
3.20%
3.40%
3.60%
3.80%
Q3 2015 Q4 2015 Q1 2016 Q2 2016 Q3 2016
Net Interest Margin Excluding the effects of Purchase Accounting
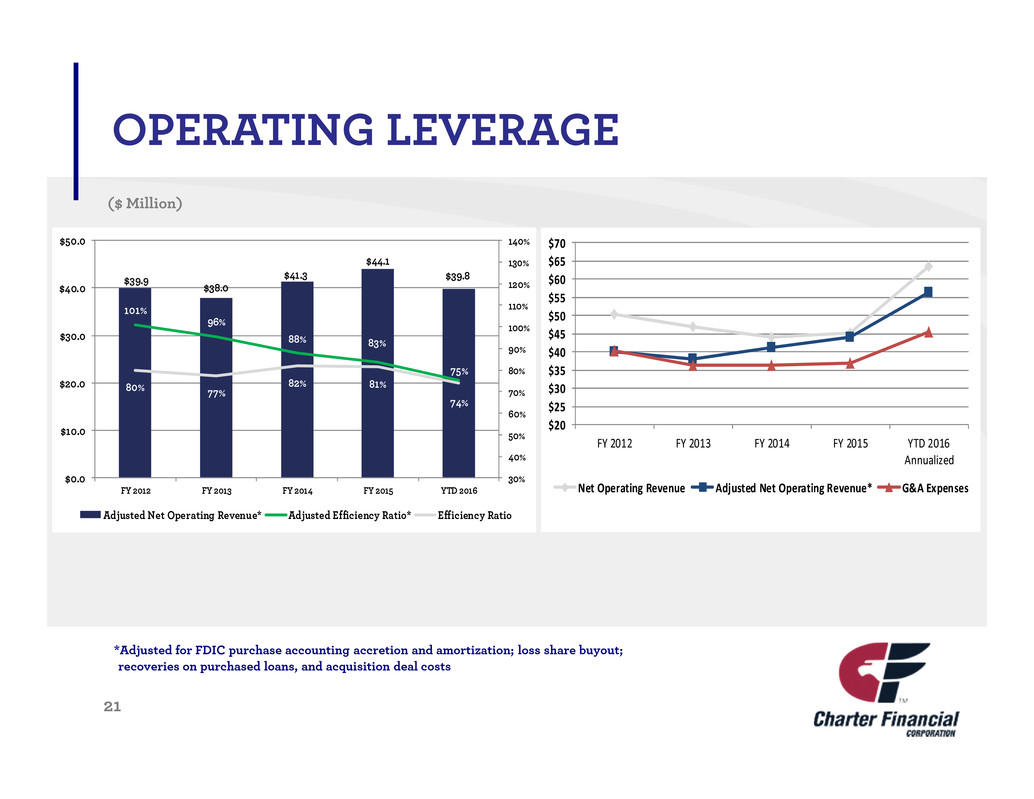
($ Million)
*Adjusted for FDIC purchase accounting accretion and amortization; loss share buyout;
recoveries on purchased loans, and acquisition deal costs
21
OPERATING LEVERAGE
$39.9 $38.0
$41.3
$44.1
$39.8
101%
96%
88% 83%
75%
80% 77%
82% 81%
74%
30%
40%
50%
60%
70%
80%
90%
100%
110%
120%
130%
140%
$0.0
$10.0
$20.0
$30.0
$40.0
$50.0
FY 2012 FY 2013 FY 2014 FY 2015 YTD 2016
Adjusted Net Operating Revenue* Adjusted Efficiency Ratio* Efficiency Ratio
$20
$25
$30
$35
$40
$45
$50
$55
$60
$65
$70
FY 2012 FY 2013 FY 2014 FY 2015 YTD 2016
Annualized
Net Operating Revenue Adjusted Net Operating Revenue* G&A Expenses
Note: Unless otherwise noted, the above chart displays information based on Charter’s fiscal year end, which is September 30.
($ Million)
22
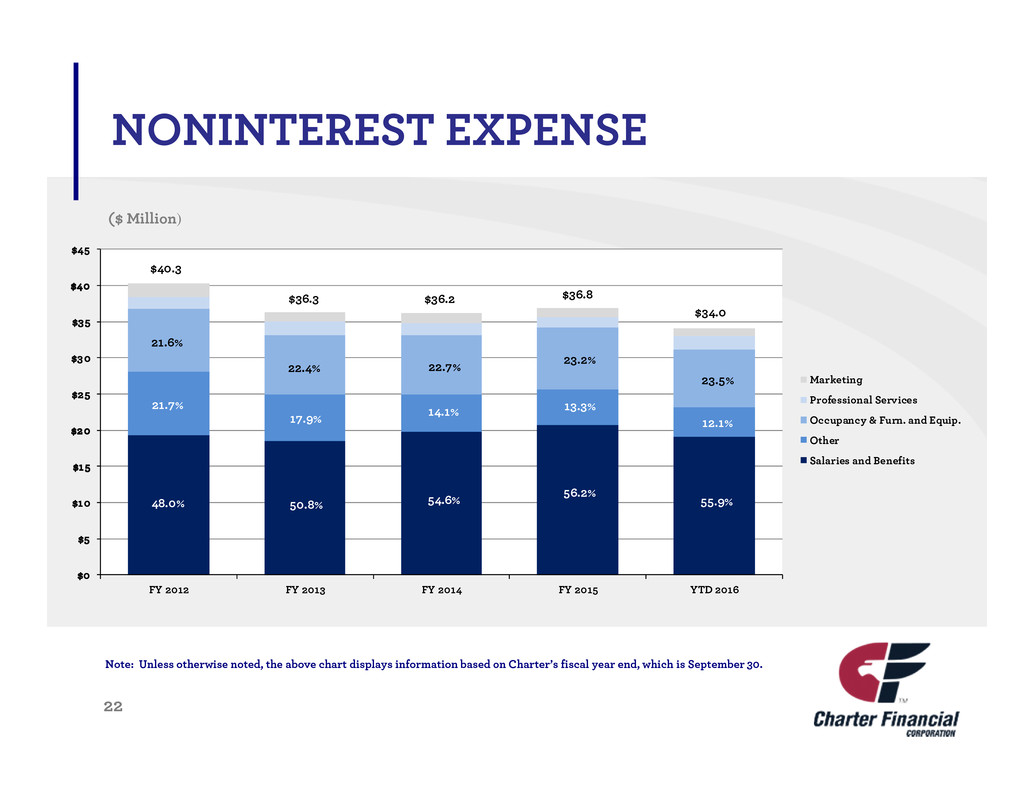
NONINTEREST EXPENSE
$0
$5
$10
$15
$20
$25
$30
$35
$40
$45
FY 2012 FY 2013 FY 2014 FY 2015 YTD 2016
Marketing
Professional Services
Occupancy & Furn. and Equip.
Other
Salaries and Benefits
$34.0
$40.3
$36.3
22.4%
17.9%
50.8%48.0%
21.7%
21.6%
54.6%
14.1%
22.7%
$36.2
55.9%
12.1%
23.5%
$36.8
23.2%
56.2%
13.3%
CBS acquisition accelerates EPS growth and transition to trading
on P/E multiple
Growth in the Atlanta market
Favorable credit quality and robust capital
Capital and infrastructure to support balance sheet expansion
Track record of returns to shareholders with annualized total
return since:
2013 stock conversion of 10%
2010 stock offering of 14%
23
INVESTMENT MERITS
INVESTOR CONTACTS
1233 O. G. Skinner Drive
West Point, Georgia 31833
1-800-763-4444
www.charterbk.com
24
Robert L. Johnson
Chairman and Chief Executive Officer
bjohnson@charterbank.net
(706) 645-3249
Lee W. Washam
President
lwasham@charterbank.net
(706) 645-3630
Curtis R. Kollar
Senior Vice President and
Chief Financial Officer
ckollar@charterbank.net
(706) 645-3237
25
APPENDIX
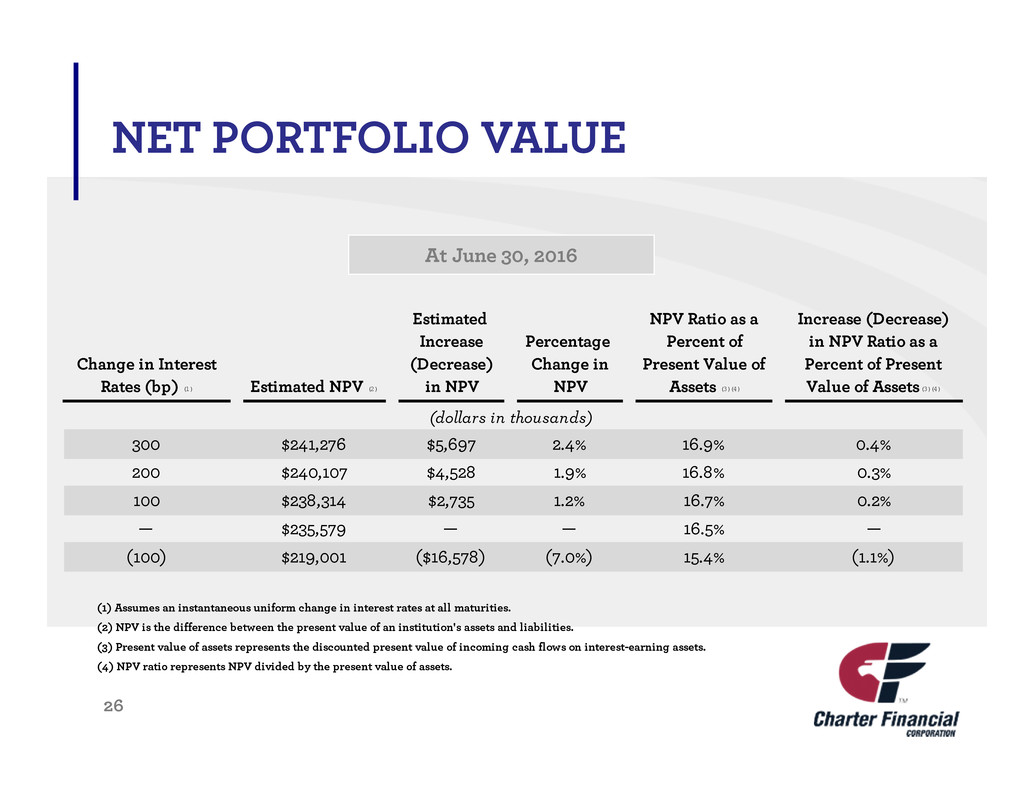
NET PORTFOLIO VALUE
At June 30, 2016
26
(1) Assumes an instantaneous uniform change in interest rates at all maturities.
(2) NPV is the difference between the present value of an institution's assets and liabilities.
(3) Present value of assets represents the discounted present value of incoming cash flows on interest-earning assets.
(4) NPV ratio represents NPV divided by the present value of assets.
__________________________________
Change in Interest
Rates (bp) (1) Estimated NPV (2)
Estimated
Increase
(Decrease)
in NPV
Percentage
Change in
NPV
NPV Ratio as a
Percent of
Present Value of
Assets (3)(4)
Increase (Decrease)
in NPV Ratio as a
Percent of Present
Value of Assets (3)(4)
(dollars in thousands)
300 $241,276 $5,697 2.4% 16.9% 0.4%
200 $240,107 $4,528 1.9% 16.8% 0.3%
100 $238,314 $2,735 1.2% 16.7% 0.2%
— $235,579 — — 16.5% —
(100) $219,001 ($16,578) (7.0%) 15.4% (1.1%)

