Attached files
| file | filename |
|---|---|
| 8-K - FORM 8-K - SHORE BANCSHARES INC | v448658_8k.htm |
Exhibit 99.1

Sandler O’Neill + Partners, L.P. 2016 DC Field Trip September 14, 2016

Safe Harbor Regarding Forward - Looking Statements This presentation may contain “forward - looking statements” within the meaning of the Private Securities Litigation Reform Act of 1995 regarding Shore Bancshares, Inc. (the “Company”). Forward - looking statements often include the words “believes,” “expects,” “anticipates,” “estimates,” “forecasts,” “intends,” “plans,” “targets,” “potentially,” “probably,” “projects,” “outlook” or s imi lar expressions or future or conditional verbs such as “may,” “will,” “should,” “would” and “could.” These forward - looking statements are subjec t to known and unknown risks, uncertainties and other factors that could cause the actual results to differ materially from the fo rwa rd - looking statements, including, without limitation, the following: the strength of the United States economy in general and the streng th of the local economies in which the Company conducts operations; fluctuations in interest rates and in real estate values; monetary and fiscal policies of the Board of Governors of the Federal Reserve System and the U.S. Government and other governmental initiatives a ffe cting the financial services industry; the risks of lending and investing activities, including changes in the level and direction of loan delinquencies and write - offs and changes in estimates of the adequacy of the allowance for loan losses; the Company’s ability to access cost - effective funding; the timely development of and acceptance of the Bank’s new products and services and the perceived overa ll value of these products and services by users, including the features, pricing and quality compared to competitors’ products and services; expected cost savings, synergies and other benefits from the Company’s merger and acquisition activities might not be realize d w ithin the anticipated time frames or at all, and costs or difficulties relating to integration matters, including but not limited to cu sto mer and employee retention, might be greater than expected; fluctuations in real estate values and both residential and commercial re al estate market conditions; demand for loans and deposits in the Company’s market areas; legislative or regulatory changes that advers ely affect the Company’s business; results of examinations of the Company and its subsidiaries by their regulators, including the possib ili ty that such regulators may, among other things, take regulatory enforcement action or require the Company’s bank subsidiary to incre ase their reserves for loan losses or to write - down assets; the impact of technological changes; and the Company’s success at managing the risks involved in the foregoing. Any forward - looking statements are based upon management’s beliefs and assumptions at the time they a re made. The Company undertakes no obligation to publicly update or revise any forward - looking statements or to update the reasons why ac tual results could differ from those contained in such statements, whether as a result of new information, future events or otherw ise . In light of these risks, uncertainties and assumptions, the forward - looking statements discussed might not occur, and you should not put undue reliance on any forward - looking statements. Important Statements 2

Management Team Name Title/Function Entity Years in Banking Years with Company L . Lloyd “Scott” Beatty, Jr. President and Chief Executive Officer SHBI 24 11 Edward C. Allen SVP and Chief Financial Officer SHBI, Bank 39 5 Donna J. Stevens SVP and Chief Operating Officer SHBI, Bank 35 18 Patrick M. Bilbrough President and Chief Executive Officer Bank 20 5 Charles E. Ruch, Jr. SVP and Chief Credit Officer Bank 27 9 Michael T. Cavey SVP and Chief Lending Officer Bank 33 2 W. David Morse SVP and Legal Counsel SHBI, Bank 25 25 TOTAL 203 75 Significant depth of executive management talent as well as across our employee base. SHBI: Shore Bancshares, Inc. Bank: Shore United Bank 3

Financial Summary As of June 30, 2016 Total Assets: $ 1,125.7 million Gross Loans: $ 821.1 million Total Deposits: $ 961.1 million Total Shareholder’s Equity: $ 152.3 million Tangible Common Equity: $ 139.2 million Tangible Book value per Share: $ 11.00 Branches: Depository 18 Insurance and Wealth Management 6 Loan Production Office 1 Shares Outstanding (June 30, 2016): 12,654,849 Closing Stock Price (June 30, 2016) $ 11.75 Market capitalization (June 30, 2016) $ 148.7 million Price/Tangible Book value per Share: 1.07 Headquarters: Easton, Maryland 4
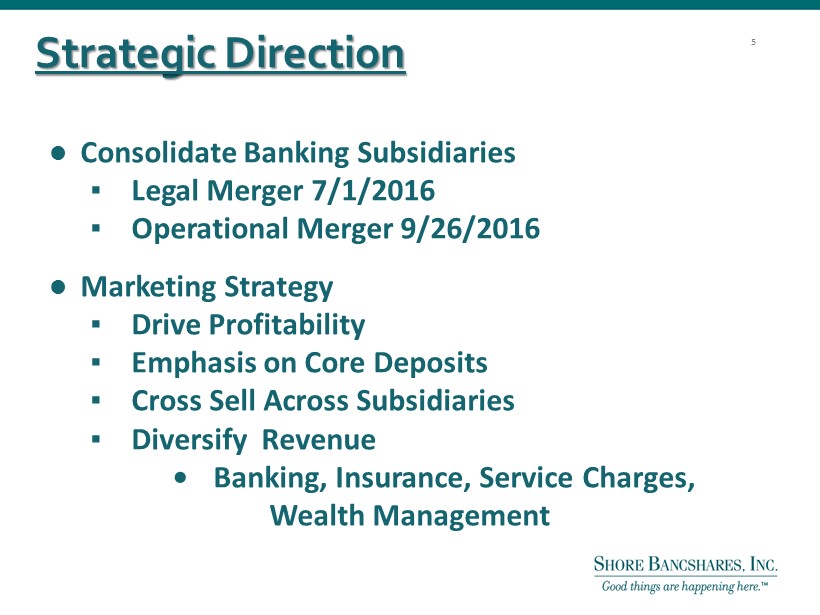
Strategic Direction • Consolidate Banking S ubsidiaries ▪ Legal M erger 7/1/2016 ▪ Operational Merger 9/26/2016 • Marketing Strategy ▪ Drive Profitability ▪ Emphasis on Core Deposits ▪ Cross Sell Across Subsidiaries ▪ Diversify Revenue • Banking , Insurance, Service Charges, Wealth Management 5

Strategic Direction • Market Expansion ▪ LPO’s and Strategic Branching ▪ Acquire Banks Contiguous to our Existing Markets ▪ Leverage Existing Platform ● Striving to be the Bank and Employer of Choice on the Delmarva ▪ Dominant Independent Locally Headquartered Company in our Footprint ▪ Opportunity to Dominate the Delmarva 6

Shore Bancshares’ Community of Companies SHBI Shore United Bank ($1.1 billion of Assets) Wye Financial Trust Avon - Dixon Agency LLC (Retail) 2 (Gross Revenue 2015 $8,506,627) Mubell Finance LLC 1. Wye Financial & Trust is a division of Shore United Bank 2. Freestate & Son, Elliott Wilson and Jack Martin & Associates are divisions of Avon Dixon Agency LLC 7

Shore Bancshares’ Community of Companies 8

25 locations 18 branches 1 loan production office 6 non - bank offices Branch Map 9

General Impact of Consolidation • One single Board of Directors • Unified P olicies and P rocedures • Improved Operational E fficiencies • Capitalized on Employee Strengths • Total c ost of c onsolidation as of June 30, 2016 was $267 thousand. Additional a nticipated costs of $400,000 over the next two quarters. 10

Selected SHBI Market Highlights ▪ Household income for entire franchise is $ 74,104 in MD and $ 61,777 in DE vs. $55,551 for the US. ▪ Projected HH income change ( 2016 - 2021) is 4.45% for MD, and 6.46% for DE ▪ Projected 5 - year population growth rate ( 2016 - 2021) in overall market = 3.90% for MD and 4.98% for DE ▪ SHBI deposit market rank/share by county (2015): * Source:SNL Maryland Rank Share # Branches Talbot #1 32.41% 5 Queen Anne’s #2 26.15% 5 Caroline #3 17.07% 2 Kent #5 7.96% 1 Dorchester #6 6.62% 1 Delaware Rank Share #Branches Kent #6 4.46% 4 11

Deposit Market Share: SHBI Market Market Rank Ticker Company Name City (HQ) HQ State Branches Total Deposits as of June 30, 2015 ($000) ’15 Market Share(%) 1 SHBI Shore Bancshares Inc. Easton MD 18 936,286 16.55 2 PNC PNC Financial Services Group Inc. Pittsburgh PA 14 858,587 15.18 3 MTB M&T Bank Corp. Buffalo NY 11 678,490 11.99 4 - Queenstown Bancorp of Maryland Inc. Queenstown MD 8 388,157 6.86 5 COF Capital One Financial Corp. McLean VA 2 352,808 6.24 6 WSFS WSFS Financial Corp. Wilmington DE 8 304,209 5.38 7 BAC Bank of America Corp. Charlotte NC 4 283,531 5.01 8 BBT BB&T Corp. Winston - Salem NC 6 252,051 4.46 9 PSBP PSB Holding Corp. Preston MD 7 247,380 4.37 10 CFG Citizens Financial Group, Inc. Providence RI 4 191,451 3.38 11 PEBC Peoples Bancorp Inc. Chestertown MD 6 189,660 3.35 12 WFC Wells Fargo & Co. San Francisco CA 2 170,980 3.02 13 DLMV Delmarva Bancshares, Inc. Cambridge MD 3 166,257 2.94 14 - HSB Bancorp Inc. Hebron MD 3 115,251 2.04 15 - Easton Bancorp, Inc. Easton MD 3 109,304 1.93 16 STI SunTrust Banks Inc. Atlanta GA 4 98,312 1.74 17 - Toronto - Dominion Bank Toronto 2 71,293 1.26 18 CPKB Chesapeake Bancorp Chestertown MD 2 67,149 1.19 19 - Artisans’ Bank Wilmington DE 2 61,462 1.09 20 FNB FNB Corp. Pittsburgh PA 1 45,020 0.80 21 - CB Financial Corp. Rehoboth Beach DE 1 39,991 0.71 22 - MidCoast Community Bancorp, Inc. Wilmington DE 1 20,513 0.36 23 - JRMB II, Inc. Lawton OK 3 8,496 0.15 Total 115 5,656,638 100.00 NOTE : SHBI Market defined as Maryland Counties of Kent, Queen Anne's, Talbot, Caroline, Dorchester, and Kent County, Delaware . SOURCE : SNL Analysis 12
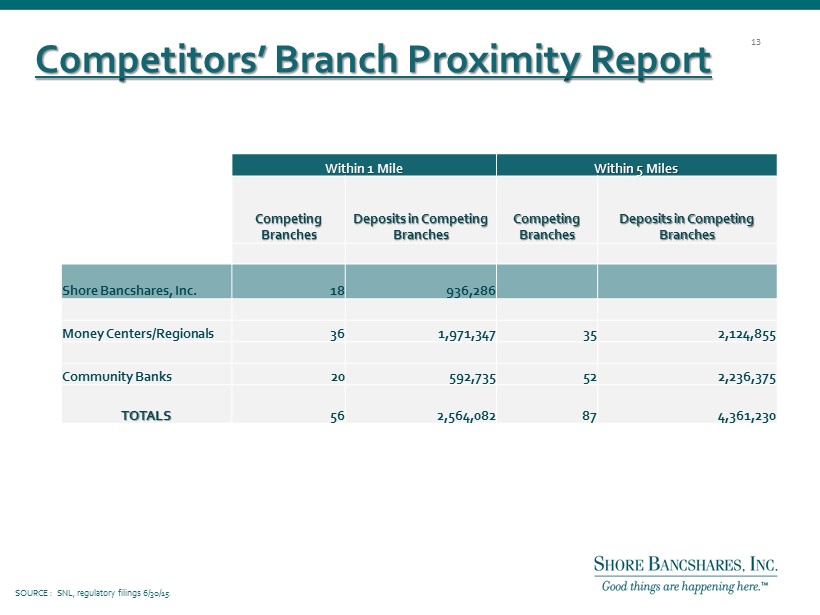
Competitors ’ Branch Proximity Report Within 1 Mile Within 5 Miles Competing Branches Deposits in Competing Branches Competing Branches Deposits in Competing Branches Shore Bancshares, Inc . 18 936,286 Money Centers/Regionals 36 1,971,347 35 2,124,855 Community Banks 20 592,735 52 2,236,375 TOTALS 56 2,564,082 87 4,361,230 SOURCE : SNL, regulatory filings 6/30/15. 13
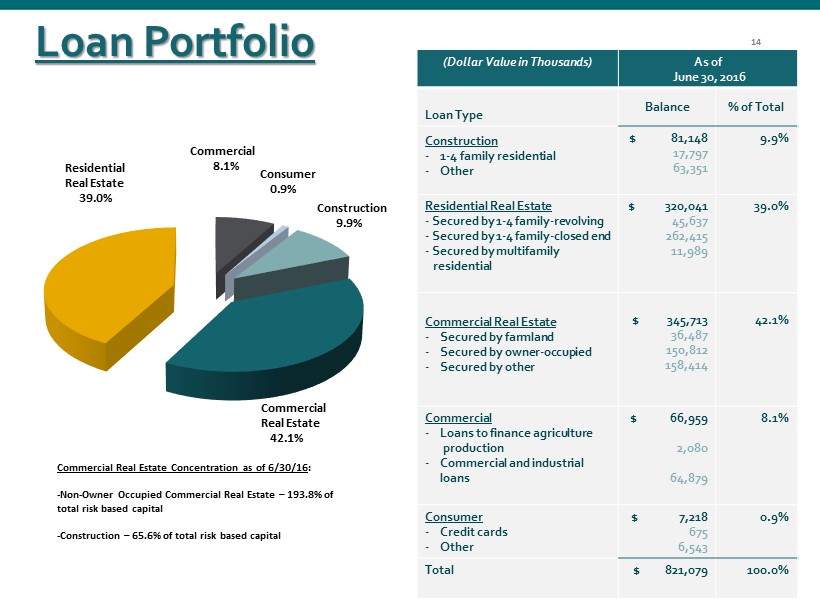
Loan Portfolio (Dollar Value in Thousands) As of June 30, 2016 Loan Type Balance % of Total Construction - 1 - 4 family residential - Other $ 81,148 17,797 63,351 9.9% Residential Real Estate - Secured by 1 - 4 family - revolving - Secured by 1 - 4 family - closed end - Secured by multifamily residential $ 320,041 45,637 262,415 11,989 39.0% Commercial Real Estate - Secured by farmland - Secured by owner - occupied - Secured by other $ 345,713 36,487 150,812 158,414 42.1% Commercial - Loans to finance agriculture production - Commercial and industrial loans $ 66,959 2,080 64,879 8.1% Consumer - Credit cards - Other $ 7,218 675 6,543 0.9% Total $ 821,079 100.0% 14 Residential Real Estate 39.0% Commercial 8.1% Consumer 0.9% Construction 9.9% Commercial Real Estate 42.1% 14 Commercial Real Estate Concentration as of 6/30/16 : - Non - Owner Occupied Commercial Real Estate – 193.8% of total risk based capital - Construction – 65.6% of total risk based capital
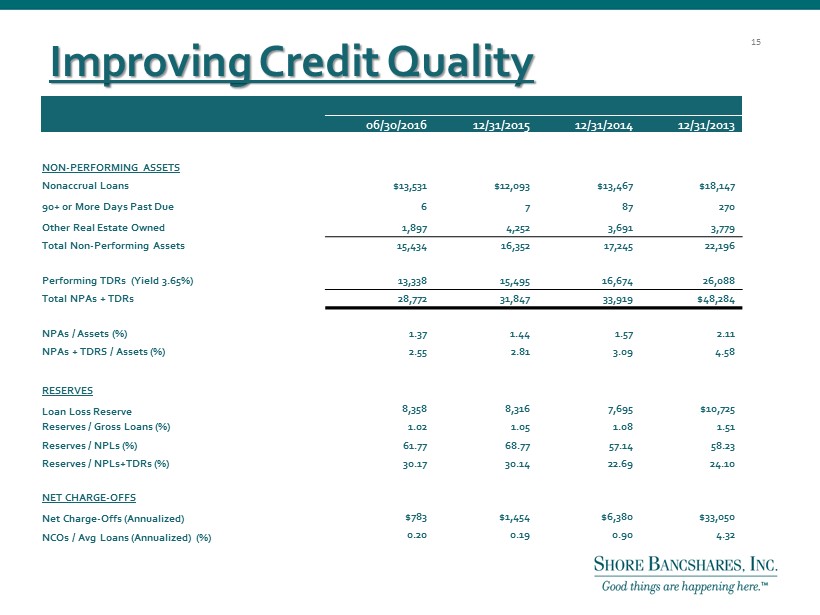
Improving Credit Quality 06/30/2016 12/31/2015 12/31/2014 12/31/2013 NON - PERFORMING ASSETS Nonaccrual Loans $13,531 $12,093 $13,467 $18,147 90+ or More Days Past Due 6 7 87 270 Other Real Estate Owned 1,897 4,252 3,691 3,779 Total Non - Performing Assets 15,434 16,352 17,245 22,196 Performing TDRs (Yield 3.65%) 13,338 15,495 16,674 26,088 Total NPAs + TDRs 28,772 31,847 33,919 $48,284 NPAs / Assets (%) 1.37 1.44 1.57 2.11 NPAs + TDRS / Assets (%) 2.55 2.81 3.09 4.58 RESERVES Loan Loss Reserve 8,358 8,316 7,695 $10,725 Reserves / Gross Loans (%) 1.02 1.05 1.08 1.51 Reserves / NPLs (%) 61.77 68.77 57.14 58.23 Reserves / NPLs+TDRs (%) 30.17 30.14 22.69 24.10 NET CHARGE - OFFS Net Charge - Offs (Annualized) $783 $1,454 $6,380 $33,050 NCOs / Avg Loans (Annualized ) (%) 0.20 0.19 0.90 4.32 15

Credit Trends: NPAs & TDRs 06/30/2016 12/31/15 12/31/2014 12/31/2013 Construction $9,670 $11,598 $10,069 $5,569 Residential Real Estate 9,720 7,945 10,484 19,768 Commercial Real Estate 7,188 7,762 9,358 14,462 Commercial 192 161 190 1,137 Consumer 105 129 127 48 Total 26,875 27,595 30,228 40,984 OREO 1,897 4,252 3,691 3,779 Nonaccrual Loans Held for Sale --- --- --- 3,521 Total NPAs & TDRs $28,772 $31,847 $33,919 $48,284 16

S ecurities Portfolio (Dollars in thousands) Amortized Cost G Gross Unrealized Gains G Gross Unrealized Losses E Estimated Fair Value Available - for - sale securities: June 30, 2016 U.S. Treasury $ 5,011 $4 $ --- $5,015 U.S. Government Agencies 40,834 151 121 40,864 Mortgage - backed 147,299 2,001 158 149,142 Other 644 16 --- 660 Total $193,788 $2,172 $279 $195,681 Held - to - maturity securities: June 30, 2016 U.S Government Agencies $2,380 $3 $ --- $2,383 States and Political Subdivisions 1,615 123 --- 1,738 Total $3,995 $126 $ --- $4,121 Total Securities $197,783 $199,802 Average Yield 1.62% Average Duration 2.69 17

Attractive Deposit Base (Dollar Value in Thousands) June 30, 2016 Deposit Type Quarterly Average Balance % of Total Cost Noninterest Bearing Demand $ 231,614 24.1% 0.00% Interest Bearing Demand 179,508 18.7 0.12 Money Market & Savings 270,482 28.1 0.13 CDs $100,000 or more 129,399 13.5 0.69 Other Time 150,091 15.6 0.68 Total Deposits $ 961,094 100.0% 0.34% Total Cost of Funds 0.27% Noninterest Bearing Demand 24.1% Interest Bearing Demand 18.7% Money Market & Savings 28.1% CDs $100k or more 13.5% Other Time 15.6% Deposit Type 18

Transaction Deposit Growth 71% 70% 65% 60% 59% 29% 30% 35% 40% 41% 6/30/2016 12/31/2015 12/31/2014 12/31/2013 12/31/2012 Transaction Deposits Time Deposits 19

Income Statement (Quarterly) (Dollars in thousands, except per share amounts) 2Q16 1Q16 4Q15 3Q15 2Q15 Interest income 10,003 9,908 $10,047 $9,837 $9,542 Interest expense 620 665 754 827 859 Net interest income 9,383 9,243 9,293 9,010 8,683 Provision for credit losses 375 450 475 410 540 Noninterest income 4,041 4,541 3,638 3,905 3,788 Noninterest expense 9,365 9,339 8,950 9,396 9,300 Income (loss) before income taxes 3,684 3,995 3,506 3,109 2,631 Net (loss) income 2,272 2,460 2,163 1,909 1,627 EPS diluted $0.18 $0.19 $0.17 $0.15 $0.13 20

Pre Tax Pre Provision ROA 1.50% 1.58% 1.39% 1.26% 1.17% 0.00% 0.20% 0.40% 0.60% 0.80% 1.00% 1.20% 1.40% 1.60% 1.80% 2Q16 1Q16 4Q15 3Q15 2Q15 21

SHBI Net Interest Margin 3.57% 3.50% 3.45% 3.43% 3.43% 3.00% 3.10% 3.20% 3.30% 3.40% 3.50% 3.60% 2Q16 1Q16 4Q15 3Q15 2Q15 22
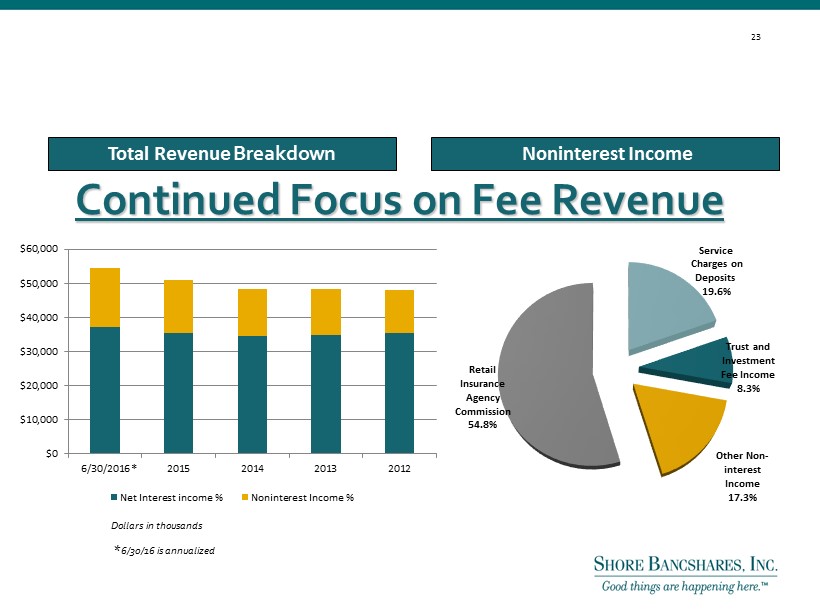
Continued Focus on Fee Revenue Total Revenue Breakdown Noninterest Income * 6/30/16 is annualized Dollars in thousands 24% 25% 26% 34% 32% 31% Trust and Investment Fee Income 8.3% Other Non - interest Income 17.3% Retail Insurance Agency Commission 54.8% Service Charges on Deposits 19.6% 23 $0 $10,000 $20,000 $30,000 $40,000 $50,000 $60,000 6/30/2016 2015 2014 2013 2012 Net Interest income % Noninterest Income % *

6/30/16 2015 Return on Average Assets 0.84% 0.75% Return on Average Equity 6.34% 5.85% Net Interest Margin 3.53% 3.45% Non - interest Income/Operating Revenue 34.54% 28.40% Non - interest Income/Average Assets (1) 1.48% 1.36% Non - interest Expense/Average Assets (1) 3.32% 3.28% Efficiency Ratio Bank Only (Non - GAAP) (2) 66.96% 68.84% Nonperforming Assets/Assets (Excluding TDRs) (3) 1.37% 1.44% Nonperforming Assets/Assets (Including TDRs) (3) 2.55% 2.81% Key Ratios As of June 30, 2016 (1) Non - interest income and expense are annualized for comparative purposes. (2) Noninterest expense (excluding amortization of intangible assets) as a percentage of fully taxable net interest income and noninterest income . Excludes non - bank entities. (3) Nonperforming assets (NPAs) include nonaccrual and 90 days past due and still accruing loans, accruing troubled debt restructurings and net other real estate and other assets owned 24

Capital Ratios 12.52% 11.93% 11.70% 8.41% 15.89% 15.55% 15.27% 10.09% 16.93% 16.61% 16.36% 11.34% 15.89% 15.55% 0.00% 2.00% 4.00% 6.00% 8.00% 10.00% 12.00% 14.00% 16.00% 18.00% 6/30/2016 YE 2015 YE 2014 YE 2013 Tangible Common equity / Tangible Assets Tier 1 Risk-Based Capital Ratio Total Risk-Based Capital Ratio Common Equity Tier 1 25

Institutional Ownership as of 03/31/16 Major Holders % of Ownership Wellington Management Company 9.20% Basswood Capital Management LLC 5.05% FJ Capital Management LLC 4.89% Banc Funds Company LLC 4.80% Maltese Capital Management, LLC 4.06% Manulife Asset Management LLC 3.71% Mendon Capital Advisors Corporation/RMB Capital Management 3.04% Vanguard Group, Inc. 2.99% Elizabeth Park Capital Advisors Ltd. 2.34% Corbyn Investment Management Inc. 1.76% BlackRock Fund Advisors 1.70% Brown Advisory LLC 1.68% 26

What Makes SHBI Unique? ● Dominant Independent Financial Services Company in all Markets within Footprint ● Diversity of Revenue Sources - - without Mortgage ● Strong Capital Position ● Improving Net Interest Margin ● Strong Control of Operating Expenses 27

● We are a very different Company now x Improved credit culture x Entirely new Management Team at Bank and Holding Company x Revamped strategic plan positioned for organic growth and acquisitions x Focused on creating sustainable competitive advantages x Strengthened noninterest revenue sources x Forging a sales culture with both a commercial and retail focus ● Current valuation is attractive 6/30/16 (trade at 1.07 of TBV) Compelling Investment Considerations 28

SHBI – LTM Price Change (%) 29

ADDENDUM 30

Peer Group Definition Publically traded banking c ompanies in MD, DC, VA, DE w ith total a ssets between $750M - $2B. 31
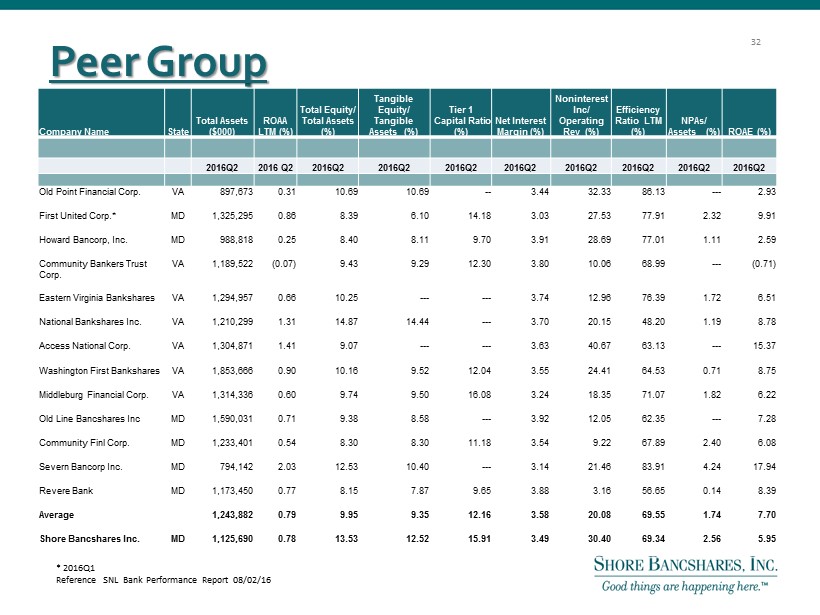
Peer Group Company Name State Total Assets ($000) ROAA LTM (%) Total Equity/ Total Assets (%) Tangible Equity/ Tangible Assets (%) Tier 1 Capital Ratio (%) Net Interest Margin (%) Noninterest Inc/ Operating Rev (%) Efficiency Ratio LTM (%) NPAs/ Assets (%) ROAE (%) 2016Q2 2016 Q2 2016Q2 2016Q2 2016Q2 2016Q2 2016Q2 2016Q2 2016Q2 2016Q2 Old Point Financial Corp. VA 897,673 0.31 10.69 10.69 -- 3.44 32.33 86.13 --- 2.93 First United Corp .* MD 1,325,295 0.86 8.39 6.10 14.18 3.03 27.53 77.91 2.32 9.91 Howard Bancorp, Inc. MD 988,818 0.25 8.40 8.11 9.70 3.91 28.69 77.01 1.11 2.59 Community Bankers Trust Corp. VA 1,189,522 (0.07) 9.43 9.29 12.30 3.80 10.06 68.99 --- (0.71) Eastern Virginia Bankshares VA 1,294,957 0.66 10.25 --- --- 3.74 12.96 76.39 1.72 6.51 National Bankshares Inc . VA 1,210,299 1.31 14.87 14.44 --- 3.70 20.15 48.20 1.19 8.78 Access National Corp. VA 1,304,871 1.41 9.07 --- --- 3.63 40.67 63.13 --- 15.37 Washington First Bankshares VA 1,853,666 0.90 10.16 9.52 12.04 3.55 24.41 64.53 0.71 8.75 Middleburg Financial Corp . VA 1,314,336 0.60 9.74 9.50 16.08 3.24 18.35 71.07 1.82 6.22 Old Line Bancshares Inc MD 1,590,031 0.71 9.38 8.58 --- 3.92 12.05 62.35 --- 7.28 Community Finl Corp. MD 1,233,401 0.54 8.30 8.30 11.18 3.54 9.22 67.89 2.40 6.08 Severn Bancorp Inc. MD 794,142 2.03 12.53 10.40 --- 3.14 21.46 83.91 4.24 17.94 Revere Bank MD 1,173,450 0.77 8.15 7.87 9.65 3.88 3.16 56.65 0.14 8.39 Average 1,243,882 0.79 9.95 9.35 12.16 3.58 20.08 69.55 1.74 7.70 Shore Bancshares Inc. MD 1,125,690 0.78 13.53 12.52 15.91 3.49 30.40 69.34 2.56 5.95 * 2016Q1 Reference SNL Bank Performance Report 08/02/16 32

Talent , depth, unique skills • Lloyd L. “Scott” Beatty, Jr ., 63, CPA, President & CEO of SHBI since June 2013, Director of SHBI since December 2000, Director of Shore United Bank (formerly the Talbot Bank and CNB) since 1992. COO from 2006 until 2012 and named President and COO in 2012. Formerly COO, private equity firm Darby Overseas Investments. Formerly Managing Partner of public accounting firm. • Edward C. Allen , 68, Chief Financial Officer for Shore United Bank and Shore Bancshares Inc. He served as President & CEO of CNB since September 2014. Prior to that he served as CNB’s Chief Financial Officer since October 2011. Mr. Allen is a career banker with 40 years experienc e i n community banks. He has extensive experience in budgeting and investment portfolio management. • Donna J. Stevens , 53, was appointed Senior Vice President and Chief Operating Officer of the Company in July 2015 and for Shore United Bank since July 2016. She served as the Company’s Chief Operations Officer from July 2013 to July 2015. She has been employed by the Company in various offic er capacities since 1997, including Senior Vice President, Senior Operations and Compliance Officer and Corporate Secretary for CNB, the Company’ s w holly - owned commercial bank subsidiary from February 2010 to June 2013. • Patrick M. Bilbrough , 51, President and CEO of the Talbot Bank since December 2012. He joined Shore United Bank (formerly Talbot Bank) in May of 2011 as an Executive Vice President. Prior to his employment with Talbot Bank and since 2007, Mr. Bilbrough served as the Market Execu tiv e of PNC Bank, N.A . From 1995 to 2004, Mr. Bilbrough was with the Peoples Bank of Maryland, of Denton, where he had most recently been President and CEO after be ginning as its Chief F inancial O fficer and comptroller. He was a small business owner from 1985 to 1995 . • Charles E. Ruch Jr. , 57, Senior Vice President and Chief Credit Officer of Shore United Bank (formerly CNB) since 2010 and joined CNB in 2006. Ent ered banking in 1977, holding various retail positions from teller to core m anager through the 1980s with Equitable Bank. Joined AB&T as a commercial lender in 1987 and was AB&T’s Senior Commercial Lender for 10 years. Graduated from the University of Maryland in 1983. • Michael T. Cavey , 59 , Senior Vice President and Chief Lending Officer of Shore United Bank (formerly the Talbot Bank) joined the bank in 20 14 as a Senior Vice President and Commercial Sales Manager . Prior to his employment in 2014 with The Talbot Bank, Mr. Cavey worked for Howard Bank as a Senior Vice President and Regional Executive for Howard and Anne Arundel Counties for five years. Prior to his position at Howard Bank, Mr. Cavey hel d a Senior Vice President and Commercial Team Leader positions at Sandy Spring Bank and M& T Bank. • W. David Morse , 55, Senior Vice President and Legal Counsel of Shore Bancshares, Inc. and Shore United Bank (formerly the Talbot Bank) has served as Secretary and General Counsel for the Company since 2008. He began employment with Talbot Bank in 1991 . He received his Juris Doctorate from the University of Baltimore and his Bachelor of Arts degree from High Point College, NC. SHBI Management Team 33

Non - GAAP Financial Measures 6/30/2016 December 31, 2015 2014 2013 2012 2011 Total Assets $1,125,690 $1,135,143 $1,100,402 $1,054,124 $1,185,807 $1,158,193 Less: Intangible Assets 13,076 13,142 13,262 15,974 16,270 16,662 Tangible Assets $1,112,614 $1,122,001 $1,087,140 $1,038,150 $1,169,537 $1,141,531 Total Stockholders’ Equity $152,321 $146,967 $140,469 $103,299 $114,026 $121,249 Less: Preferred Stock 0 0 0 0 0 0 Common Stockholders’ Equity $152,321 $146,967 $140,469 $103,299 $114,026 $121,249 Less: Intangible Assets 13,076 13,142 13,262 15,974 16,270 16,662 Tangible Common Equity $139,245 $133,825 $127,207 $87,325 $97,756 $104,587 Tangible Common Equity/Tangible Assets 12.52% 11.93% 11.70% 8.41% 8.36% 9.16% Book Value per Share $12.04 $11.64 $11.13 $12.19 $13.48 $14.34 Less: Intangible Assets per Share 1.04 1.05 1.05 1.88 1.92 1.97 Tangible Book Value per Share $11.00 $10.59 $10.08 $10.31 $11.56 $12.37 Share Information: Common Shares Outstanding (actual) 12,654,849 12,631,160 12,618,513 8,471,289 8,457,359 8,457,359 We calculate tangible common equity by excluding the balance of intangible assets from common stockholders’ equity. We calculate tangible book value per share by dividing tangible common equity by adjusted common shares outstanding, as compared to book value per common share, which we calculate by dividing common stockholder’s equity by adjusted common shares outstanding. We calculate tangible common equity to tangible assets by dividing tangible common equity by tangible assets. We believe that this is consistent with the treatment by bank regulatory agencies, which exclude intangible assets f rom the calculation of risk - based capital ratios. Accordingly, we believe that these non - GAAP financial measures provide information that is important to investors and that is useful in understanding our capital position and ratios. A reconciliation of the n on - GAAP measures of tangible assets, tangible common equity and tangible book value per share to the GAAP measures of common stockholder’s equity and book value per share is set forth below. 34