Attached files
| file | filename |
|---|---|
| EX-31.2 - EXHIBIT 31.2 - ShoreTel Inc | h10038339x1_ex31-2.htm |
| EX-32.2 - EXHIBIT 32.2 - ShoreTel Inc | h10038339x1_ex32-2.htm |
| EX-32.1 - EXHIBIT 32.1 - ShoreTel Inc | h10038339x1_ex32-1.htm |
| EX-31.1 - EXHIBIT 31.1 - ShoreTel Inc | h10038339x1_ex31-1.htm |
| EX-23.1 - EXHIBIT 23.1 - ShoreTel Inc | h10038339x1_ex23-1.htm |
| EX-21 - EXHIBIT 21 - ShoreTel Inc | h10038339x1_ex21.htm |
| EX-10.7 - EXHIBIT 10.7 - ShoreTel Inc | h10038339x1_ex10-7.htm |
UNITED STATES SECURITIES AND EXCHANGE COMMISSION
Washington, D.C. 20549
Form 10-K
☒ ANNUAL REPORT PURSUANT TO SECTION 13 OR 15(d) OF THE SECURITIES EXCHANGE ACT OF 1934
For the year ended June 30, 2016
or
o TRANSITION REPORT PURSUANT TO SECTION 13 OR 15(d) OF THE SECURITIES EXCHANGE ACT OF 1934
Commission file number: 001-33506
SHORETEL, INC.
(Exact name of Registrant as specified in its charter)
|
Delaware
|
3661
|
77-0443568
|
|
(State or other jurisdiction of
incorporation or organization) |
(Primary standard industrial
code number) |
(I.R.S. employer identification no.)
|
960 Stewart Drive
Sunnyvale, CA 94085-3913
(408) 331-3300
(Address, including zip code, and telephone number, including area code, of Registrant’s principal executive offices)
Securities registered pursuant to Section 12(b) of the Act:
|
Title of each class
|
Name of each exchange on which registered
|
|
Common Stock, $0.001 par value
|
The NASDAQ Global Select Market
|
Securities registered pursuant to Section 12(g) of the Act:
None
Indicate by check mark if the registrant is a well-known seasoned issuer, as defined in Rule 405 of the Securities Act. Yes o No ☑
Indicate by check mark if the registrant is not required to file reports pursuant to Section 13 or Section 15(d) of the Act. Yes o No ☑
Indicate by check mark whether the registrant: (1) has filed all reports required to be filed by Section 13 or 15(d) of the Securities Exchange Act of 1934 during the preceding 12 months (or for such shorter period that the registrant was required to file such reports), and (2) has been subject to such filing requirements for the past 90 days. Yes ☑ No o
Indicate by check mark whether the registrant has submitted electronically and posted on its corporate website, if any, every Interactive Data File required to be submitted and posted pursuant to Rule 405 of Regulation S-T during the preceding 12 months (or for such shorter period that the registrant was required to submit and post such files). Yes ☑ No o
Indicate by check mark if disclosure of delinquent filers pursuant to Item 405 of Regulation S-K is not contained herein, and will not be contained, to the best of registrant’s knowledge, in definitive proxy or information statements incorporated by reference in Part III of this Form 10-K or any amendment to this Form 10-K. o
Indicate by check mark whether the registrant is a large accelerated filer, an accelerated filer, a non-accelerated filer, or a smaller reporting company. See the definitions of “large accelerated filer,” “accelerated filer,” and “smaller reporting company” in Rule 12b-2 of the Exchange Act (Check one):
|
Large accelerated filer o
|
Accelerated Filer ☑
|
|
Non-accelerated filer o
|
Smaller reporting company o
|
|
(do not check if a smaller reporting company)
|
|
Indicate by check mark whether the registrant is a shell company (as defined in Rule 12b-2 of the Act). Yes o No ☑
The aggregate market value of the voting stock held by non-affiliates of the registrant as of December 31, 2015 was approximately $583.8 million (based on the last reported sale price of $8.85 on December 31, 2015 on The NASDAQ Global Select Market). This calculation does not reflect a determination that persons are affiliates for any other purposes. Shares of stock held by ten percent stockholders have been excluded from this calculation as they may be deemed affiliates.
The number of shares outstanding of the registrant’s common stock as of August 26, 2016 was 67,625,724.
DOCUMENTS INCORPORATED BY REFERENCE
Part III incorporates by reference certain information from the Registrant’s definitive proxy statement (the “2016 Proxy Statement”) for the 2016 Annual Meeting of Stockholders.
TRADEMARKS
The ShoreTel logo, ShoreTel and Brilliantly Simple are trademarks or registered trademarks of ShoreTel, Inc. in the United States and/or other countries. All other trademarks, trade names and service marks herein are the property of their respective owners.
AVAILABLE INFORMATION
Our Internet address is www.shoretel.com. On our Internet website, we make publicly available free of charge our annual report on Form 10-K, quarterly reports on Form 10-Q, current reports on Form 8-K, and amendments to those reports filed or furnished pursuant to Section 13(a) or 15(d) of the Securities Exchange Act of 1934 as soon as reasonably practicable after we electronically file such material with, or furnish it to, the Securities and Exchange Commission (“SEC”). The information that is contained on or that can be accessed through our Internet website is not part of this Annual Report on Form 10-K.
In addition, the public may read and copy any materials we file with the SEC at the SEC’s Public Reference Room at 100 F Street, N.E., Washington, D.C. 20549. You may obtain information on the operation of the Public Reference Room by calling the SEC at 1-800-SEC-0330. The SEC maintains a website that contains reports, proxy and information statements, and other information regarding issuers that file electronically with the SEC at http://www.sec.gov.
The charters of our Audit Committee, our Compensation Committee and our Corporate Governance and Nominating Committee, as well as our Code of Business Conduct and Ethics, are available on the Investor Relations section of our website under “Investor Relations – Corporate Governance/Leadership.” This information is also available by writing to us at the address on the cover of this Annual Report on Form 10-K.
3
This report contains “forward-looking statements” within the meaning of Section 27A of the Securities Act of 1933 and Section 21E of the Securities Exchange Act of 1934. Forward-looking statements relate to expectations concerning matters that are not historical facts. Words such as “projects,” “believes,” “anticipates,” “plans,” “expects,” “intends” and similar words and expressions are intended to identify forward-looking statements. While we believe that the expectations reflected in the forward-looking statements are reasonable, we cannot assure you that those expectations will prove to be correct. Important factors that could cause our actual results to differ materially from those expectations are disclosed in this report, including, without limitation, in the “Risk Factors” described in Part I, Item 1A. All forward-looking statements are expressly qualified in their entirety by these factors and all related cautionary statements. We do not undertake any obligation to update any forward-looking statements.
PART I
| ITEM 1. | BUSINESS |
Overview
ShoreTel is a leading provider of brilliantly simple business communication solutions. We focus on the small and medium sized businesses seeking a Unified Communications (“UC”) solution allowing them to communicate anytime, anyplace and through any device that they chose.
We provide this to the market via two solutions: ShoreTel Connect, our UC solution, and Contact Center offering and ShoreTel Summit, our platform for developers and integrators. ShoreTel Connect delivers a fully featured UC solution and applications such as mobility, collaboration, and workgroups. ShoreTel Connect is unique in that it offers three different delivery models including cloud, onsite and hybrid. Connect Cloud provides a hosted voice solution to our customers. Connect OnSite provides our customers the ability to independently own and operate their equipment. Connect Hybrid enables our customers to use both our cloud and onsite offerings while still delivering the same user experience and providing our customers increased choice and flexibility. Summit, our Communications Platform as a Service (“CPaaS”) offering, delivers the option to either deeply integrate communications into any application or workflow or to create a standalone business communications application.
We believe our solutions address changes in the UC market being driven by both technological advances and new workplace trends. We believe some of the current factors affecting the UC market include: the shift to consuming communications from the cloud, addressing an increasingly mobile workforce, the ongoing need for collaboration, a desire for multiple forms of communication and a need to integrate communications into workflows and applications. Our solutions are sold through our extensive network of over 1,200 authorized resellers and value-added distributors throughout the world served either by national distributors or by ShoreTel directly.
We were originally incorporated in California in September 1996 and reincorporated in Delaware in 2007. ShoreTel is based in Sunnyvale, California, and has regional offices in North America, Europe, Asia and Australia.
Evolution of Business Communications
We believe ShoreTel is at the forefront of the UC industry that is in transition. We believe customers seek flexibility and choice when making a purchase decision relating to Business Communications. We provide simple to deploy options, via the cloud and the option to purchase the product or a combination of both. We also deliver the ability to deeply integrate into an existing workflow or application, providing a customer the capability to consume or develop, affords us a unique differentiator in the UC market.
We will continue to make investments in order to capture a greater percentage of the market share in the cloud-based solutions market which we believe is continuing to grow as well as to maintain our competitive position in the premise market.
We will continue to make investments to grow our CPaaS capabilities and capture a greater percentage of the developer market seeking to create or integrate communications into workflows or applications.
Our customers enjoy a broad approach to their UC requirements. Whether they are looking to acquire a cloud, premise, hybrid UC solution or to further integrate that into their workflows and applications or whether
4
they want to develop a specific communications application, we provide a solution to fit. Coupled with ready-made applications and supporting services such as ShoreTel Contact Center, ShoreTel Mobility, and professional services including ShoreTel Global Services and application and development professional services.
Hosted Architecture and Services for Hosted Customers
Our hosted services offer a secure and reliable business communications solution to organizations with minimal capital investment. The heart of the hosted service is our Call Conductor core technology, a ShoreTel designed and developed modular software architecture operating on an industry standard platform, which makes it easy to add capabilities in response to customers’ evolving needs and integrate readily with leading business applications. This technology was specifically designed to meet the unique requirements of the hosted communications market, offering a full portfolio of services to customers, including soft-switch services for ShoreTel IP Telephony, as well as integrated software modules for ShoreTel Unified Communications, ShoreTel Contact Center, ShoreTel Mobility, Business Intelligence Analytics and Reporting. By incorporating a multi-tenant software foundation, multiple customers can be served simultaneously by servers located in data center co-location facilities. Hosted technologies are complemented by a series of service modules that enable billing, diagnostics, system monitoring, Communications Assistance for Law Enforcement Act (“CALEA”) regulatory compliance, emergency call routing and other related operational services. A variety of customer selectable network services are also available, including local and long distance network services, toll-free numbers, number porting, circuits from carriers and other value-added network services.
Hosted Operations
We have a centrally managed platform consisting of data management, monitoring and security, control and billing systems that support our hosted services. This platform consists of a customer quotation portal, customer provisioning, customer access, fraud control, network security, call routing, call monitoring, media processing and normalization, call reliability, call record storage and billing. Our platform monitors our process of digitizing and compressing voice and video into packets and transmitting these packets over data networks around the world. We maintain a call switching platform that manages call control and routes calls.
Customer and Technical Support
We maintain a contact center that provides customer service and technical support to our customers. Customers can access our services directly through our website or receive customer service and technical support through telephone communication, e-mail support and online chat services. Our website also maintains a knowledge base repository that our customers and partners use for education and issue resolution.
Hosted Data Centers
ShoreTel utilizes data centers located in the United States, Europe and Asia which are co-located in service facilities operated by third parties. These data centers include sufficient physical building security, network operations and resiliency services and backup power generation. These operation centers house the application servers and proprietary technologies used to provide services to customers.
The key elements of our hosted applications and services include:
| • | complete end-to-end solution offer for customers, including ShoreTel designed and developed phones, client and server applications, together with our own service and support centers, which results in the best possible service experience. |
| • | development and introduction of new services; |
| • | experience in customer implementations; |
| • | complete portfolio of operational services for billing, system management, and other requirements; and |
| • | support for industry standard interfaces, enabling support for third party devices from other vendors. |
5
ShoreTel Business Communications for Premise Deployment
We provide a unique modern hardware and software architecture for premise customers, which offers the high availability and reliability needed for mission critical communications. Our premise business communication solutions are comprised of hardware and software components including ShoreTel Voice Switches, ShoreTel Service Appliances, ShoreTel Client and Server Software Applications, such as ShoreTel Director, Small Business Edition 100, and ShoreTel IP Phones. All ShoreTel software applications may also be virtualized, operating on customer-provided general purpose servers.
| • | ShoreTel Voice Switches: We offer a range of ShoreTel designed switches of varying capabilities to meet the needs of enterprises of all sizes. The modular nature of our switches allows our enterprise customers to easily expand their system capacity by deploying additional switches across their networks. The software on our voice switches may also be virtualized and operate on customer-provided, general purpose servers. |
| • | ShoreTel Service Appliances: We offer a range of ShoreTel designed appliances for specific applications such as instant messaging, conferencing and collaboration. The administration of these service appliances is functionally integrated with the IP Telephony Web Administration. Appliances are automatically recognized by the ShoreTel Director software and user functions are seamlessly integrated with the user management application, eliminating the complexity found with other systems. |
| • | ShoreTel Director: ShoreTel Director provides enterprises with a single point of system management, enabling IT administrators to view and manage the entire system from any location using a single application. A new end user’s extension, mailbox and automated attendant profile can be added on a single management screen, avoiding the additional work required with most Private Branch Exchanges (“PBXs”), voice mail systems and automated attendants. |
| • | Small Business Edition 100: Our Small Business Edition (“SBE 100”) solution is targeted for smaller businesses with up to 100 users. It is a bundled solution consisting of system software, user licenses and voice switches that allows our business customers to economically scale our products and solutions as their organizations begin to grow and expand. Businesses that grow beyond the capacity of the SBE 100 solution may expand their investment by adding additional switches and licenses, while preserving their original investment and avoiding costly upgrades. |
| • | ShoreTel IP Phones: ShoreTel designs and provides IP phones which incorporate the most recent applications, including visual voice mail, speaker phones supporting seven octaves of sound for superior clarity and performance, and integrated diagnostics for simplifying installation and management. |
ShoreTel Business Communications for Hybrid Premise Environments with Integrated Cloud Services Deployment
ShoreTel customers can extend their investments in their business communications solution by incorporating both cloud and premise based approaches via ShoreTel Connect. ShoreTel Connect enables customers to add new sites and add new applications, such as Contact Center, Mobility, Instant Messaging, Presence, Fax and Scribe and will also enable customers to easily add new services that we introduce in the future.
Business Communication Products and Services
ShoreTel provides a diverse set of applications and services for both premise and hosted customers, consisting of ShoreTel IP Telephony, ShoreTel Mobility, ShoreTel Unified Communications, ShoreTel Contact Center, and professional services, including ShoreTel Global Services and application development services.
Enterprise Mobility
ShoreTel Mobility extends the capabilities of a desk phone and Unified Communications capabilities to leading smartphones and tablets, allowing the user to communicate from any location, including office, home or through Wi-Fi hotspots. ShoreTel Mobility enables access to any cellular or Wi-Fi network, simply and cost effectively. ShoreTel Mobility solutions for smartphone users consist of a ShoreTel appliance coupled with system management and end-user software. ShoreTel Mobility is available as part of our premise solution and also offered as a hosted service.
6
Unified Communications
ShoreTel Unified Communications enable the integration of IP telephony solutions with instant messaging, mobility, presence, desktop collaboration and video.
| • | Clients: ShoreTel Communicator is designed for users across an organization, whether an administrator, knowledge worker, contact center agent or mobile worker. Available on multiple operating systems, ShoreTel Communicator makes it easy for people to communicate any way they choose, such as: by video, voice (wired or wireless) and instant messaging. One single application interface makes training simple and reduces the Information Technology (“IT”) workload because there is just a single application to support and no additional servers to deploy and maintain. |
| • | Conferencing and Collaboration: ShoreTel enables enterprises to conduct audio conferences and provides collaboration tools for application sharing, desktop sharing, instant messaging and end-user presence status. |
| • | Microsoft Integration: For customers seeking to leverage their investment in Microsoft solutions, ShoreTel offers a range of integration options. ShoreTel integrates with applications such as Microsoft Lync, Microsoft Exchange, Microsoft Office and Microsoft Internet Explorer. |
Contact Center
Contact Center enables organizations to route incoming contacts to the most appropriate agent in a multisite contact center, regardless of location. ShoreTel Connect Contact Center includes a range of options including agent phones, switching infrastructure, end-user interfaces, and platform software for both premise-based and cloud-based customers. The solution features capabilities including call handling, self-service, multi-media, and reporting. Contact Center applications provide a range of features to satisfy the needs of all-sized organizations, from basic call center capabilities to sophisticated, distributed multimedia contact centers.
ShoreTel Global Services
We complement our cloud, onsite and hybrid solution with a broad range of support services to help us maintain and expand our relationships with our enterprise customers and channel partners. Our product support contracts provide us with recurring revenue. Typically, our resellers provide many of these services, with ShoreTel providing manufacturer and escalation support as needed or, if requested by the enterprise customer or reseller, we can provide these services directly.
ShoreTel Global Services provides professional services, system design and installation, training and technical support including:
| • | Professional services include standard and custom software development to: extend system capabilities; enable UC integration with other enterprise applications; streamline business processes; and, address enterprise customer-specific business opportunities. We also offer collaboration with third party developers via Application Program Interface (“API”) and Software Development Kit (“SDK”) through the ShoreTel TechConnect program. |
| • | System design and installation services include the best practices of deploying UC with regard to network requirements and capabilities as well as how to implement contact center and mobility for a particular enterprise. |
| • | Training services include certification programs for resellers, training programs at enterprise customer or reseller locations and self-paced, computer-based desktop training programs. |
| • | Our technical support services include web-based access support services and tools, access to technical support engineers, hardware replacement, as well as software updates and monitoring capabilities. |
Application Development Services
ShoreTel offers custom application development and integration services for businesses with unique communication requirements. We offer businesses the option to enhance their communications solution by enabling the integration of business applications including customer relationship management (“CRM”) solutions such as Salesforce.com, Zendesk, Desk.com, NetSuite and Microsoft Dynamics, as well routing, interactive voice response and reporting solutions that automate business workflows and enhance operational oversight.
7
Customers and partners can create integrated applications using the open application interface of the system available for developers through the ShoreTel TechConnect.
Customers
As of June 30, 2016, our solutions have been installed by approximately 40,000 organizations in over 50 countries. We serve a wide range of vertical markets, including professional services, financial services, government, education, health care, sports and entertainment, manufacturing, non-profit organizations and technology industries.
Focus on Customer Satisfaction
We believe that maintaining the highest possible levels of customer satisfaction is critical to our ability to retain existing and gain new customers. We believe that satisfied customers will purchase more of our products and serve as advocates for our solutions, and we work closely with them and our channel partners as customers deploy and use our solutions. We conduct formal customer reviews that involve our internal staff and third-party technical personnel to ensure smooth implementations and to resolve any issues that may arise. We follow up with ongoing check-ins to ensure customers are satisfied with their solution, surveying them regarding various aspects of the experience with ShoreTel. We use industry-recognized Net Promoter ScoreSM customer loyalty metrics to help ensure that we are meeting our customers’ expectations. Through this process, we gain valuable insights into the existing and future requirements of our customers’ activities and this helps us develop product enhancements that address the evolving requirements of customers.
Additionally, to promote high-quality support throughout our services organization, we measure performance indicators of our services organization, including call answer times, call abandon rates, customer satisfaction with technical support, time to issue resolution, first contact resolution, call interaction quality, as well as customer satisfaction with system implementation, training services and technical support, and use the results to direct the management of our services organization.
We also monitor our customers’ satisfaction with our channel partners by surveying our customers after the system is installed. We actively encourage our channel partners to maintain and improve our customers’ levels of satisfaction. We also monitor our channel partners’ satisfaction with ShoreTel, as their satisfaction with and advocacy of ShoreTel is also very important to our success.
ShoreTel delivers the lowest cost of operations for IP Telephony and Unified Communications and Collaboration for premises and cloud according to Nemertes’ 2016 research. ShoreTel has the greatest costs savings and lowest overall cost over a five-year period, when compared to the industry average and various providers for both premises and cloud. Providers included 8x8, Avaya, Cisco, Microsoft, Mitel, NEC and Vonage1.
Sales and Marketing
We sell our premise products, support and services primarily through an extensive network of channel partners that include value-added resellers, service providers, direct market resellers and value-added distributors. Our hosted services are sold through channel partners and our direct sales force. As of June 30, 2016, we had over 1,200 channel partners in our network. These channel partners range in size from single-site, regional firms with specialized products and services to multi-national firms that provide a full range of IT products and services. They also include top U.S. telecommunication carriers: AT&T and CenturyLink. Our channel partners market and sell our products into both the small-to-medium and mid-enterprise markets. Our channel partners in the U.S., Canada, the United Kingdom and Australia may offer both premise and cloud solutions to their customers.
We maintain a sales organization that manages the business relationship between ShoreTel and our partner network, recruiting, training and enabling the partners to market, sell and support ShoreTel solutions. In addition, we also have a ‘Client Sales’ team of sales personnel to assist our channel partners in selling to and providing support for customer accounts.
| 1 | Nemertes Research Q3 2016 How to Keep UCC Costs Down as Complexity Grows: Now is the time to compare vendors and assess your Total Cost of Operation |
8
We believe our channel partner network allows us to effectively sell our solutions without having to dedicate the resources required to build large in-house sales and service capabilities. We continue to work with existing channel partners to broaden their sales of our solutions as well as to recruit new channel partners with a focus on increasing market coverage.
Our internal marketing team focuses on increasing our “Brilliantly Simple” brand awareness, communicating product advantages and generating qualified leads for our sales force and channel partners. In addition to providing marketing materials, we communicate product and service offerings through e-mail and online and direct mail campaigns, print and web-based advertising, a customer reference program, press releases, social media, video and web-based demonstrations.
Research and Development
We believe that our ability to enhance our current products and services, develop and introduce new products and services on a timely basis, maintain technological competitiveness and meet customer requirements is essential to our success. To this end, we have assembled a team of engineers with expertise in collaboration and UC technology, such as voice, messaging, conferencing, video, mobility, file sharing, contact center and workspaces. We have invested significant time and financial resources into the development of our architecture, including ShoreTel Connect, ShoreTel Summit, ShoreTel Connect Contact Center and ShoreTel Connect appliances which are available for both hosted and onsite customers. We intend to continue to expand our service and product offerings, improve the features available on our services and products and integrate our solutions with third-party enterprise applications. Research and development expenses were $60.5 million, $53.4 million and $49.8 million in fiscal years 2016, 2015 and 2014, respectively.
Manufacturing and Suppliers
We outsource the manufacturing of our hardware products. This outsourcing allows us to:
| • | avoid costly capital expenditures for the establishment of manufacturing operations; |
| • | focus on the design, development, sales and support of our hardware products; and |
| • | leverage the scale, expertise and purchasing power of specialized contract manufacturers. |
Currently, we have arrangements for the production of our switches and mobility routers with contract manufacturers in the United States and for the production of our phones with a contract manufacturer with multiple locations including the United States and China. We also rely on a sole or limited number of suppliers for several key components utilized in the assembly of our products.
We regularly provide forecasts for orders, and we order products from our contract manufacturers based on our projected sales levels, which is in advance of receiving customer orders. However, customers may generally cancel or reschedule orders without penalty, and delivery schedules requested by customers for these orders frequently vary based upon each customer’s particular needs.
For more information on risks related to products and components, see “Risks Related to Our Business and Industry - Our business may be harmed if our contract manufacturers are not able to provide us with adequate supplies” and “Risks Related to Our Business and Industry - Our products incorporate some sole sourced components and the inability of these sole source suppliers to provide adequate supplies of these components may prevent us from selling our products for a significant period of time or limit our ability to deliver sufficient amounts of our products.”
We typically fulfill product orders out of our California, New York, United Kingdom, Australia or Singapore warehouses.
Financial Information about Geographic Areas
For financial information about geographic areas, refer to Note 14 to the Consolidated Financial Statements in Item 8 of this report.
Competition
The market for business communication solutions is quickly evolving, highly competitive and subject to rapid technological change. As a result of the convergence of voice, video, messaging, mobility and data
9
networking technologies that characterize IP enterprise Unified Communications solutions, we compete against vendors of hosted solutions and premise-based solutions, some of which have solutions in both markets and CPaaS providers.
| • | Providers of cloud services include Tier 1 service providers such as AT&T, Telstra, British Telecom, Verizon, incumbent local exchange carriers, competitive local exchange carriers, and independent providers such as 8x8, RingCentral, Mitel, West IP Communications and Vonage. |
| • | Providers of hosted communication services based on technologies from Avaya, Broadsoft, Cisco, Microsoft, Mitel, Unify and other technology platform vendors. |
| • | Providers of premise-based business communication equipment include Avaya, Cisco, Huawei, Interactive Intelligence, Mitel, NEC, Nokia and Unify. |
| • | Providers of Unified Communications software applications, include Avaya, Cisco, Interactive Intelligence, Microsoft, Mitel, NEC, Nokia, Digium, Toshiba and Unify. |
| • | Providers of CPaaS include Twilio, Plivo, Vonage with Nexmo, and other application program interface based technology platform vendors. |
In addition, because the market for our products is subject to rapid technological change as the market evolves, we may face competition in the future from companies that do not currently compete in the enterprise unified communications market, including companies that currently compete in other sectors of the information technology, communications and software industries or communications companies that serve consumer rather than enterprise customers.
We may also face increased competition from Internet portal-focused providers who extend their portfolio to include business communications solutions, such as Amazon, Skype/Microsoft, Google and Yahoo.
In particular, as more enterprises converge their voice and data networks, the business information technology and communication applications deployed on converged networks become more integrated. We may face increased competition from current leaders in information technology infrastructure, information technology, personal and business applications and the software that connects the network infrastructure to those applications.
We could also face competition from new market entrants, whether from new ventures or from established companies moving into the market. Competition from these other potential market entrants may take many forms, including offering products and applications similar to those we offer as part of a larger, bundled offering or as a cloud-based or hosted services offering. In addition, technological developments and consolidation within the communications industry result in frequent changes to our group of competitors.
Many of our current and potential competitors are substantially larger than we are and have higher brand familiarity with buyers, and significantly greater financial, sales, marketing, distribution, technical, manufacturing and other resources. We believe that we currently compete favorably with regard to the principal competitive factors applicable to our products and services, which include price, portfolio, feature set, reliability, scalability, usability, simplicity, total cost of ownership, customer satisfaction and service.
For more information concerning competition, please see “Risk Factors - Risks Related To Our Business and Industry – “The market in which we operate is intensely competitive, and many of our competitors are larger, more established and better capitalized than we are” and – “As voice, video, messaging and data networks converge, we are likely to face increased competition from companies in the information technology, personal and business applications and software industries.”
Regulatory
Voice over IP (“VoIP”) communication services, like ours, have been subject to less regulation at the state and federal levels than traditional telecommunications services. Providers of traditional telecommunications services are subject to the highest degree of regulation, while providers of information services are largely exempt from most federal and state regulations governing traditional common carriers. The Federal Communications Commission (“FCC”) has subjected VoIP service providers to a smaller subset of regulations that apply to traditional telecommunications service providers and have not yet classified VoIP services as either telecommunications or information. However, the FCC reviews the status of VoIP service providers and the services they provide and may increase regulations that apply to hosted services.
10
The effect of any future laws, regulations and orders on the hosted offering is unknown at this time. But as a general matter, increased regulation and the imposition of additional funding obligations increases service costs that may or may not be recoverable from our customers. This increased regulation could result in making our services less competitive with traditional telecommunications services if we increase our retail prices or decreasing our profit margins if we attempt to absorb such costs.
Intellectual Property
A factor of our success as a company is our ability to protect our core technology and intellectual property. To accomplish this, we rely on a combination of intellectual property rights, including patents, trade secrets, copyrights and trademarks, as well as customary contractual protections.
As of June 30, 2016, we had 136 patents issued in the United States, and had 41 patent applications in the United States. Our patents have been both internally developed and externally acquired. Our patents have a range of expiration dates. The earliest patent to expire will do so in 2016, and the last to expire will do so in 2035.
The steps we have taken to protect our intellectual property rights may not be adequate. Third parties may infringe or misappropriate our intellectual property rights and may challenge our issued patents. In addition, other parties may independently develop similar or competing technologies designed around any patents that are or may be issued to us. We intend to enforce our intellectual property rights vigorously, and from time to time, we may initiate claims against third parties that we believe are infringing on our intellectual property rights if we are unable to resolve matters satisfactorily through negotiation. If we fail to protect our proprietary rights adequately, our competitors could offer similar products, potentially significantly harming our competitive position and decreasing our revenue.
Employees
As of June 30, 2016, we had 1,194 employees in North America, Europe, Asia and Australia, of which 395 were in sales and marketing, 391 were in research and development, 264 were in global support and services, and 144 were in general and administrative functions. None of our employees are represented by labor unions and we consider current employee relations to be good.
Executive Officers
The following table sets forth information about our executive officers as of September 1, 2016:
|
Name
|
Age
|
Position as of September 1, 2016
|
|
Don Joos
|
46
|
President and Chief Executive Officer
|
|
Michael E. Healy
|
55
|
Senior Vice President and Chief Financial Officer
|
|
Eugenia Corrales
|
51
|
Senior Vice President of Product
|
|
Bharath Oruganti
|
42
|
Senior Vice President of Worldwide Business Operations
|
|
David Petts
|
53
|
Senior Vice President of Worldwide Sales and Customer Success
|
|
Allen Seto
|
40
|
Vice President and General Counsel
|
Don Joos has served as our President and Chief Executive Officer and a Director since August 2013. Mr. Joos served as our Senior Vice President of Business Operations from July 2012 to August 2013. Mr. Joos joined ShoreTel in April 2011 as our Vice President of Global Services. Prior to joining ShoreTel, from December 2001 to April 2011, Mr. Joos served in various senior management roles, including Vice President Channel Transformation, at Avaya, Inc., a provider of business communications and collaboration systems. Prior to this, Mr. Joos also held service and operational roles at SiteStuff, Inc., Williams Communication Solutions, LLC, Nortel Communication Solutions and Marshalls Inc. Mr. Joos holds a B.S. in Sports Management from Springfield College in Massachusetts.
Michael E. Healy has served as our Senior Vice President and Chief Financial Officer since May 2007. From February 2004 to May 2007, he served as Chief Financial Officer and Senior Vice President of Finance of Genesis Microchip Inc., a supplier of display image processors. From November 2002 to February 2004, Mr. Healy served as Chief Financial Officer of Jamcracker, Inc., a software and application service provider. From September 1997 to June 2002, Mr. Healy held various senior level finance positions at Exodus Communications, Inc., an Internet infrastructure outsourcing services provider, including as Senior Vice President
11
of Finance prior to February 2002, and as its Chief Financial Officer and Corporate Treasurer from February 2002 to June 2002. From 1987 to 1997, Mr. Healy held various financial management positions at Apple Computer, Inc., and was an auditor at Deloitte & Touche LLP from 1983 to 1987. Mr. Healy holds a B.S. in Accounting from Santa Clara University and is a Certified Public Accountant (Inactive). Mr. Healy is a member of the American Institute of Certified Public Accountants and the California Society of Certified Public Accountant.
Eugenia Corrales has served as our Senior Vice President of Product since July 2015. From July 2013 to July 2015, Ms. Corrales served as Vice President and General Manager of the Computing Systems Group at Cisco Systems, Inc., a provider of Internet protocol based networking and other products related to the communications and information technology. From September 2012 to July 2013, Ms. Corrales was an independent consultant working with multiple networking and renewable energy startup companies. From June 2010 to September 2012, Ms. Corrales served as Chief Executive Officer and Executive Vice President of Engineering and Operations at Nanosolar, a developer of solar power technology. From June 2006 to June 2010, Ms. Corrales served as Chief Executive Officer at Sunmodular, a startup focusing on providing efficiencies to solar panel technology. Ms. Corrales holds a B.A. in Physics from Grinnell College and a M.S. in Mechanical Engineering from Stanford University.
David Petts has served as our Senior Vice President of Worldwide Sales and Customer Success since July 2012. From June 2005 to July 2012, Mr. Petts served in several sales leadership roles at Nokia Corporation, a mobile communications company. Prior to then, Mr. Petts held a number of executive management roles, both in the United States and the United Kingdom, with Hewlett Packard Company and Compaq Computer Corporation, providers of products, technologies, software, services and solutions. Mr. Petts holds a B.S. in Economics and Quantitative Studies from Queen Mary College, London University.
Bharath Oruganti has served as our Senior Vice President of Worldwide Business Operations since February 2014. Mr. Oruganti also served as our Vice President of Global Services from September 2012 to January 2014. Mr. Oruganti joined ShoreTel in October 2011 serving in the position of Senior Director of Technical Services. From February 2011 to October 2011, Mr. Oruganti served as President and Chief Operating Officer at Encore Media Metrics, LLC, a digital media startup focused on advanced insights and analytics. From September 2006 to February 2011, Mr. Oruganti served as Senior Manager in the Strategy and Operations practice at Deloitte Consulting LLP. Prior to then, Mr. Oruganti served in various positions, including Senior Manager of Global Customer Support, at Cadence Design Systems, Inc., a provider of semiconductor design software. Mr. Oruganti holds a B. Tech in Electronics and Communication Engineering from Andhra University, a M.S. in Electrical Engineering from University of Kentucky and an M.B.A. from the University of Texas at Austin.
Allen Seto has served as our Vice President and General Counsel since March 2013. Mr. Seto joined ShoreTel in June 2012 serving as Associate General Counsel. From January 2011 to May 2012, Mr. Seto served as Associate General Counsel at Taleo Corporation., a global provider of on-demand talent management software solutions. From February 2008 to January 2011, Mr. Seto served as Senior Corporate Counsel in the Corporate, Securities & Acquisitions group at Oracle Corporation. From July 2005 to January 2008, Mr. Seto served as Corporate Counsel at SYNNEX Corporation, a business process services company servicing resellers, retailers and original equipment manufacturers. Prior to then, Mr. Seto was in private practice at Skadden, Arps, Slate, Meagher & Flom LLP. Mr. Seto holds a J.D. from University of California, Los Angeles School of Law and a B.A. in Economics and a B.A. in Rhetoric from the University of California, Berkeley.
12
| ITEM 1A. | RISK FACTORS |
Risks Related to Our Business and Industry
We may not be able to achieve our strategic initiatives and grow our business as anticipated.
We cannot assure you that we will be successful over the long term in transitioning internal and external views of our Company to a service delivery model and growing our business as anticipated. Our strategic initiatives have required us to devote significant financial and operational assets to these activities. However, at the same time, a growing focus on hosted revenues involves different types of revenue recognition and has different cost structures than our traditional product revenues. Our success depends on our ability to appropriately manage our expenses as we invest in these initiatives, enter into beneficial channel relationships, develop new products and service offerings and successfully execute our marketing and sales strategies. If we are not able to execute on this strategy successfully or if our investments in these activities do not yield significant returns, our business may not grow as we anticipated, we could devote significant financial and other resources to developing products and services that never reach commercial success, which could adversely affect our operating results. In addition, if the UC industry transitions in a way we did not anticipate, we may not be able to shift our strategies and products rapidly enough to respond to such changes and we may not receive any return from such investments. Our competitors may also be developing new products to address transitions in the UC industry. If we are unable to successfully establish our new products and services, if our competitors’ products and services are better received, or if we fail to execute our strategies, our financial condition or results of operations could be negatively impacted and our ability to grow our business may be impacted.
There can be no assurance that our exploration of strategic alternatives will result in any transaction being consummated, and speculation and uncertainty regarding the outcome of our exploration of strategic alternatives may adversely impact our business.
We are exploring strategic alternatives, including a sale and other strategic proposals and our Board of Directors has formed a special Strategic Advisory Committee of independent directors to lead this process. There can be no assurance that any transaction will be consummated, and the process of exploring strategic alternatives will involve the dedication of significant resources and the incurrence of significant costs and expenses. In addition, speculation and uncertainty regarding our exploration of strategic alternatives may cause or result in:
| • | disruption of our business; |
| • | distraction of our management and employees; |
| • | difficulty in recruiting, hiring, motivating, and retaining talented and skilled personnel; |
| • | difficulty in maintaining or negotiating and consummating new, business or strategic relationships or transactions; |
| • | increased stock price volatility; and |
| • | increased costs and advisory fees. |
If we are unable to mitigate these or other potential risks related to the uncertainty caused by our exploration of strategic alternatives, it may disrupt our business or adversely impact our revenue, operating results, and financial condition.
The market in which we operate is intensely competitive, and many of our competitors are larger, more established and better capitalized than we are.
The industry for Unified Communications is extremely competitive. Our competitors include 8x8, Avaya, Broadsoft, Cisco, Microsoft, Mitel, RingCentral and Vonage. In addition, many of our hosted customers are not subject to long-term contractual commitments to purchase our services and can terminate our service and switch to competitors' offerings on relatively short notice.
Many of our competitors are substantially larger and have greater financial, technical, research and development, sales and marketing, manufacturing, distribution and other resources. We could also face competition from new entrants, whether from new ventures or from established companies moving in to the industry. Some competitors have advantages over us, including:
| • | greater market presence, name recognition and brand reputation; |
13
| • | larger distribution channels; |
| • | a larger installed base of telecommunications and networking systems with customers; |
| • | larger and more geographically distributed services and support organizations and capabilities; |
| • | a broader offering of telecommunications and networking products, applications and services; |
| • | a more established international presence to address the needs of global enterprises; |
| • | larger patent and intellectual property portfolios; |
| • | longer operating histories; |
| • | a longer history of implementing large-scale telecommunications or networking systems; |
| • | more established relationships with industry participants, customers, suppliers, distributors and other technology companies; |
| • | the ability to acquire technologies or consolidate with other companies in the industry to compete more effectively; and |
| • | the ability to bundle a broader offering of telecom and networking equipment and services into an IP PBX offering, and offer these products as part of a hosted services offering. |
Given their capital resources, many of these competitors are in a better position to withstand any significant reduction in capital spending by enterprise customers on telecommunications equipment and are not as susceptible to downturns in a particular industry. This risk is enhanced because we focus our business primarily on the enterprise IP telecommunications industry.
Because some of our competitors have greater financial strength than we do and are able to offer a more diversified bundle of products and services, they have offered and in the future may offer telecommunications products at lower prices than we do. In order to remain competitive from a cost perspective, we have in the past reduced the prices of our products, and we may be required to do so in the future, in order to gain enterprise customers. Price reductions could have a negative effect on our gross margins.
Our competitors may also be able to devote more resources to developing new or enhanced products, including products that may be based on new technologies or standards. If our competitors’ products become more accepted than our products, our competitive position will be impaired and we may not be able to increase our revenue or may experience decreased gross margins. If any of our competitors’ products or technologies become the industry standard, if they are successful in bringing their products to market earlier, or if their products are more technologically capable than ours, then our sales could be materially adversely affected. We may not be able to maintain or improve our competitive position against our current or future competitors, and our failure to do so could materially and adversely affect our business.
As voice, video, messaging and data networks converge, we are likely to face increased competition from companies in the information technology, personal and business applications and software industries.
The convergence of voice, video, messaging and data networks and their wider deployment by enterprises has led information technology and communication applications deployed on converged networks to become more integrated. This integration has created an opportunity for the leaders in information technology, personal and business applications and the software that connects the network infrastructure to those applications, to enter the telecommunications industry and offer products that compete with our systems, commonly referred to as Unified Communications. Competition from these potential entrants may take many forms, and they may offer products and services similar to those we offer.
If the solutions offered by new competitors achieve substantial market penetration, or if we cannot integrate our products with such solutions, we may not be able to maintain or improve our market position, and our failure to do so could materially and adversely affect our business and results of operations.
If we fail to manage our growth effectively, our business could be harmed.
We plan to further expand our operations to support the growth of our business. We will need to increase our spending in order to fund this development. This growth may place a significant strain on our management, administrative, operational and financial infrastructure. Our success will depend upon our ability to manage this
14
growth effectively. If we do not increase our revenues commensurate to our increased spending, we may not be profitable. To manage the expected growth of our operations and personnel, we will need to continue to improve our operational, financial and management controls and our reporting systems and procedures. Failure to effectively manage growth could result in difficulty in filling enterprise customer orders, declines in product quality or customer satisfaction, increases in costs, production and distribution difficulties, and any of these difficulties could adversely impact our business performance and results of operations.
The gross margins on our products and offerings may decrease due to competitive pressures or otherwise, which could negatively impact our profitability.
It is possible that the gross margins on our products and/or services will decrease in the future in response to competitive pricing pressures, including the bundling of more offerings included in a base price, new product introductions by us or our competitors, changes in the costs of components or telecommunications costs, manufacturing issues, the shift in our channel distribution model towards more value-added distributors, royalties we need to pay to use certain intellectual property, growth of our international business, or other factors. The margins on our hosted telephony service are also impacted by the fact that we also sell the broadband connection, which is typically a lower-margin business. In addition, until we achieve a sufficient base of cloud-based customers, the gross margins on our cloud services will tend to be lower. If we experience decreased gross margins and we are unable to respond in a timely manner by introducing and selling new, higher-margin products and services successfully and continually reducing our product and hosting costs, our gross margins may decline, which will harm our business and results of operations.
If we fail to respond to technological changes and evolving industry standards, our products and services could become obsolete or less competitive in the future.
Our industry is highly competitive and characterized by rapidly changing technologies and standards. Accordingly, our operating results depend upon, among other things, our ability to develop and introduce new products and services and our ability to reduce production costs of existing products and costs of providing our hosted services. Our long-term success will depend on our ability to stay ahead of these changes and avoid obsolescence of our products and services.
In addition, as industry standards evolve, it is possible that one standard becomes predominant in the market. This could facilitate the entry into the market for competing products and services, which could result in significant pricing pressure. Additionally, if one standard becomes predominant and we adopt that standard, enterprises may be able to create a unified, integrated system by using phones, switches, servers, applications, or other telecommunications products produced by different companies. Therefore, we may be unable to sell complete systems to enterprise customers because the enterprise customers elect to purchase portions of their telecommunications systems from our competitors.
We have made acquisitions in the past and expect to acquire other companies or technologies, which could divert our management's attention, result in additional dilution to our stockholders, increase expenses, and otherwise disrupt our operations and harm our operating results.
We have in the past and may in the future acquire or invest in other businesses, products or technologies. Acquisitions may divert the attention of management and cause us to incur various expenses in identifying, investigating and pursuing suitable acquisitions, whether or not they are consummated. We cannot assure you that we will realize the anticipated benefits of these acquisitions.
There are inherent risks in integrating and managing acquisitions. We may not be able to integrate the acquired personnel, operations, product lines and technologies successfully, or effectively manage the combined business following an acquisition. We may also incur indebtedness in connection with any future acquisitions. We also may not achieve the anticipated benefits from the acquired business due to a number of factors, including:
| • | unanticipated costs or liabilities associated with the acquisition; |
| • | incurrence of acquisition-related direct and indirect costs; |
| • | diversion of management's attention from other business concerns; |
| • | risks related to entering into new markets; |
15
| • | harm to our existing business relationships with business partners and customers as a result of the acquisition; |
| • | the potential loss of key employees; |
| • | use of resources that are needed in other parts of our business; |
| • | risks associated with unknown liabilities, including liabilities for sales, use, telecom, utility and other taxes; |
| • | use of substantial portions of our available cash to consummate the acquisition; and |
| • | risks and costs associated with financing the acquisition. |
In addition, a significant portion of the purchase price of the other companies that we acquire may be allocated to goodwill and other indefinite lived intangible assets, which must be assessed for impairment. In the future, if our acquisitions do not yield expected returns, we may be required to take charges to our operating results based on this impairment assessment process which could harm our results of operations. Also, any contingent consideration related to the acquisitions may be remeasured to fair value at each reporting period, with any changes in the value recorded as income or expense, which could adversely affect our operating results in a particular period.
Acquisitions could also result in dilutive issuances of equity securities or the incurrence of debt, which could adversely affect our operating results. In addition, if an acquired business fails to meet our expectations, our operating results, business and financial condition may suffer.
We rely on third-party resellers and distributors to sell our products and services, and disruptions to, or our failure to develop and manage our distribution channels could adversely affect our business.
A significant portion of our hosted and product, support and services revenue is generated through indirect channel sales. These indirect sales channels include third-party resellers and distributors that market and sell other products and services to customers. We expect indirect channel sales will continue to generate a significant portion of our revenue in the future. Therefore, our success is highly dependent upon establishing and maintaining successful relationships with third-party resellers and distributors, and the financial health of these resellers and distributors.
Recruiting, launching and retaining qualified channel partners and training them in our products and services requires significant time and resources. In order to develop and expand our distribution channel, we must continue to recruit larger and more productive channel partners. We must also scale and improve our processes and procedures that support our channel, including investment in personnel, systems and training, and those processes and procedures may become increasingly complex and difficult to manage.
We have no long-term contracts with any of our channel partners, and our contracts with these channel partners do not prohibit them from offering products or services that compete with ours. Our competitors may be effective in providing incentives to existing and potential channel partners to favor their products or to prevent or reduce sales of our products. Our channel partners may choose not to offer our products or services exclusively or at all. Our failure to establish and maintain successful relationships with channel partners would likely materially adversely affect our business, operating results and financial condition.
In addition, we rely on these entities to provide many of the installation, implementation and support services for our products. Accordingly, our success depends in large part on the effective performance of these channel partners. If a partner’s performance is ineffective, it may reflect poorly upon ShoreTel or negatively impact our business. By relying on channel partners, we may in some cases have little or no contact with the ultimate users of our products, thereby making it more difficult for us to establish brand awareness, ensure proper delivery and installation of our products, service ongoing enterprise customer requirements and respond to evolving enterprise customer needs. Additionally, some of our channel partners are smaller companies that may not have the same financial resources as other of our larger channel partners, which exposes us to collections risks.
16
Our future success depends on our ability to attract, integrate and retain sales, technical and key personnel, and our failure to do so could harm our ability to grow our business.
Our company strategy and future success will depend, to a significant extent, on our ability to attract, integrate and retain our sales, technical and key personnel, namely our management and executive team and experienced sales and engineering personnel. We may experience difficulty assimilating our newly hired personnel, which may adversely affect our business. Competition for skilled personnel is intense, particularly in many of the cities in which we operate. In addition, we must retain and motivate high quality personnel, and we must also attract and assimilate other highly qualified employees. Competition for qualified management, sales, technical and other personnel can be intense, and we may not be successful in attracting and retaining such personnel. In addition, even if we succeed in hiring additional sales personnel, it may take some period of time before they become productive compounding any harm in the growth of our business from our inability to retain such sales personnel. Competitors have in the past and may in the future attempt to recruit our employees, and our management and key employees are not bound by agreements that could prevent them from terminating their employment at any time. If we fail to attract, integrate and retain key employees, our ability to manage and grow our business could be harmed, particularly if the departure of any executive or key employee results in a business interruption, or if we are not successful in preserving material knowledge of our departing employees.
The impact of the current economic climate and possible adverse credit markets may impact customer demand for our products and services.
Our business depends on the overall demand for information technology. Many of our existing and target customers are in the small and medium business sector. Our target customers may be more likely to be significantly affected by economic downturns than larger, more established businesses. Additionally, these customers often have limited discretionary funds which they may choose to spend on items other than our products and services. The purchase of our premise solution involves significant upfront expenditures. If credit is not available to them, it may be difficult or impossible for our resellers and/or end customers to purchase our premise products. If small and medium businesses experience economic hardship, this could negatively affect the overall demand for our products and services, delay and lengthen sales cycles and lead to slower growth or even a decline in our revenue.
A higher rate of customer terminations associated with our hosted services would negatively affect our business by reducing our revenue or requiring us to spend more money to grow our customer base.
Our churn rate, as defined in Item 7, for our hosted services could increase in the future if customers are not satisfied with our service. Other factors, including increased competition from other VoIP providers, alternative technologies, and adverse business conditions also influence our churn rate.
Because of churn, we have to acquire new customers on an ongoing basis or sell additional services to existing customers to maintain our existing level of customers and revenues. As a result, marketing expenditures are an ongoing requirement of our business. If our churn rate increases, we will have to acquire even more new customers in order to maintain our existing revenues. We incur significant costs to acquire new customers, and those costs are an important factor in determining our net profitability. Therefore, if we are unsuccessful in retaining customers or are required to spend significant amounts to acquire new customers beyond those budgeted, our revenue could decrease and our net income could decrease.
Success of our hosted services is dependent on the general growth and public acceptance of hosted communications.
Our future success depends on our ability to significantly increase revenues generated from our hosted services. Because the use of a hosted solution requires that the user be a subscriber of a broadband Internet service, slow or limited adoption of broadband Internet service could adversely affect the growth of our subscriber base and revenues.
In addition, VoIP networks must improve quality of service for real-time communications, managing effects such as packet jitter, packet loss, and unreliable bandwidth, so that toll-quality service can be consistently provided. VoIP telephony equipment and services must achieve a similar level of reliability that users of the PSTN have come to expect from their telephone service, and the cost and feature benefits of VoIP must be sufficient to cause customers to switch away from traditional telephony service providers. Substantial, ongoing
17
interaction with our customers in order to train and assist them with the deployment and use of our solutions over these networks is sometimes required. If any or all of these factors fail to occur, our business may be affected adversely.
Our business may be harmed if our contract manufacturers are not able to provide us with adequate supplies.
We outsource the manufacturing of our telephones and switches. Our reliance on contract manufacturers involves a number of potential risks, including the absence of adequate capacity, financial viability, ownership of certain elements of electronic designs, the ongoing viability of those contract manufacturers, and reduced control over delivery schedules.
We depend on our contract manufacturers to finance the production of goods ordered and to maintain adequate manufacturing capacity. Global economic conditions could adversely impact the financial condition of our contract manufacturers and their suppliers that could impact our contract manufacturer’s ability to procure components or otherwise manufacture our products. We may be unable to procure timely delivery of acceptable products to our enterprise customers or incur substantially higher product costs if we move production to other contract manufacturers.
Our contract manufacturers may not have sufficient capacity to enable them to meet the demand for our products. Our contract manufacturers could have manufacturing engagements with companies that are much larger than we are and whose production needs are much greater than ours. As a result, our contract manufacturers may choose to reallocate resources to the production of products other than ours if capacity is limited.
In addition, our contract manufacturers do not have any written contractual obligation to accept any purchase order that we submit for the manufacture of any of our products nor do we have any assurance that our contract manufacturers will agree to manufacture and supply any or all of our requirements for our products. Furthermore, our contract manufacturers may unilaterally terminate their relationship with us or seek to increase the prices they charge us upon written notice subject to the terms of our agreement. As a result, we are not assured that our current manufacturers will continue to provide us with an uninterrupted supply of products at an acceptable price in the future.
Even if our contract manufacturers accept and fulfill our orders, it is possible that the products may not meet our specifications. Because we do not control the final assembly and quality assurance of our products, there is a possibility that these products may contain defects or otherwise not meet our quality standards, which could result in warranty claims against us that could adversely affect our operating results and future sales.
If our contract manufacturers are unable or unwilling to continue manufacturing our products in required volumes and to meet our quality specifications, or if they significantly increase their prices, whether caused by uncertain global economic conditions, tightening of the credit markets, their weak financial condition or otherwise, we will have to procure components on their behalf in the short term and identify one or more acceptable alternative contract manufacturers. The process of identifying and qualifying a new contract manufacturer can be time consuming, and we may not be able to substitute suitable alternative contract manufacturers in a timely manner or at acceptable prices. Additionally, transitioning to new contract manufacturers may cause delays in supply if the new contract manufacturers have difficulty manufacturing products to our specifications or quality standards and may result in unexpected costs to our business.
Any disruption in the supply of products from our contract manufacturers may harm our business and could result in a loss of sales, an increase in lead times on inventory orders and an increase in production costs resulting in lower gross product margins, which could adversely affect our business and results of operations.
If the emerging market for enterprise IP and hosted telecommunications systems does not continue to grow and if we do not increase our market share, our future business could be harmed.
The market for Unified Communications is evolving rapidly and is characterized by an increasing number of market entrants. As is typical of a rapidly evolving industry, the demand for and market acceptance of, enterprise IP and hosted telecommunications systems products and services are uncertain. Some analysts have estimated that revenue in the Worldwide Enterprise IP Telephony industry has declined and will continue to decline. We cannot assure you that enterprise telecommunications systems that operate on IP networks will become
18
widespread. In particular, enterprises that have already invested substantial resources in other means of communicating information may be reluctant or slow to implement an IP telecommunications system that can require significant initial capital expenditures. If the demand for enterprise IP and hosted telecommunications systems fails to develop or develops more slowly than we anticipate, our products and services could fail to achieve market acceptance, which in turn could significantly harm our business.
Moreover, as IP-based data communications and telecommunications usage grow, the infrastructure used to support these services, whether public or private, may not be able to support the demands placed on them and their performance or reliability may decline.
Our sales cycle can be lengthy and unpredictable, which makes it difficult to forecast the amount of our sales and operating expenses in any particular period.
The sales cycle for our products and services typically ranges from six to twelve months, or longer. As a result, we may have limited ability to forecast whether or in which period a sale will occur. The success of our sales process is subject to many factors, some of which we have little or no control over, including:
| • | the timing of customers’ budget cycles and approval processes; |
| • | a technical evaluation or trial by potential enterprise customers; |
| • | our ability to introduce new products, features or functionality in a manner that suits the needs of a particular enterprise customer; |
| • | the announcement or introduction of competing products; and |
| • | the strength of existing relationships between our competitors and potential enterprise customers. |
We may expend substantial time, effort and money educating our current and prospective enterprise customers as to the value of, and benefits delivered by, our products and services and ultimately fail to produce a sale. If we are unsuccessful in closing sales after expending significant resources, our operating results will be adversely affected. Furthermore, if sales forecasted for a particular period do not occur in such period, our operating results for that period could be substantially lower than anticipated and the market price of our common stock could decline.
Our products incorporate some sole sourced components and the inability of these sole source suppliers to provide adequate supplies of these components may prevent us from selling our products for a significant period of time or limit our ability to deliver sufficient amounts of our products.
We rely on sole or limited numbers of suppliers for several key components utilized in the assembly of our products. We do not have supply agreements with our sole source suppliers, and the components for our products are typically procured by our contract manufacturers. If we lose access to these components we may not be able to sell our products for a significant period of time, and we could incur significant costs to redesign our products or to qualify alternative suppliers.
In addition, any increase in the price of these components could reduce our gross margin and adversely impact our profitability. We may not be able to obtain a sufficient quantity of these components to meet the demands of enterprise customers in a timely manner or prices of these components may increase. In addition, problems with respect to yield and quality of these components and timeliness of deliveries could occur. These delays could also materially and adversely affect our operating results.
If we fail to offer high quality customer support and services, our business could suffer.
Our customers depend on our support organization and/or our channel partners to resolve any issues relating to our products and services. A high level of customer support and services is important for the successful marketing and sale of our products and services. If we or our channel partners do not help our customers quickly resolve post-deployment issues and provide effective ongoing support, our ability to sell our products and services to existing customers could suffer and our reputation with potential customers could be harmed. Many of our channel partners offer primary support for the products they sell to customers. If the channel partners fail to provide timely and effective services, our business could be harmed. As we expand our sales, we will be required to hire and train additional support personnel. In addition, as we expand our operations internationally,
19
our support organization will face additional challenges including those associated with delivering support, training and documentation in languages other than English. If we fail to maintain high quality customer support or to grow our support organization to match any future sales growth, our business may suffer.
If we fail to accurately forecast demand for our hardware products, we may have excess or insufficient inventory, which may increase our operating costs, decrease our revenues and harm our business.
We generate forecasts of future demand for our hardware products several months prior to the scheduled delivery to our prospective customers and typically prior to receiving a purchase order from our customers. We therefore make significant investments before our resellers or customers place orders to purchase our products and before we know if corresponding shipment forecasts will be changed. Our resellers and customers are not contractually bound by the forecasts they provide us until they sign a purchase order, and the orders we ultimately receive often differ from original forecasts. If we underestimate demand for our hardware products, we will have inadequate inventory, which could result in delays in shipments, loss of orders and reduced revenues. This is exacerbated by the fact that lead times for materials and components that we need can vary significantly and depend on factors such as the specific supplier, contract terms and demand for each component at a given time. On the other hand, if we overestimate demand for our products and increase our inventory in anticipation of customer orders that do not materialize, we will have excess inventory and we will face a risk of significant inventory write-downs. Our failure to forecast demand accurately on a timely basis could result in a decrease in our revenues and gross margins.
If we fail to develop and introduce new products, services and features in a timely manner, or if we fail to manage product transitions, we could experience decreased revenue or decreased selling prices in the future.
Due to the complexity of the type of products we produce, there are significant technical risks that may affect our ability to introduce new products and features successfully. In addition, we must commit significant resources to developing new products, services and features before knowing whether our investments will result in products and services that are accepted by the market. The success of new products and services depends on many factors, including the ability of our products and services to compete with the offerings from our competitors, cost, and reliability.
If we are unable to develop and introduce new products and services in a timely manner or in response to changing market conditions or enterprise customer requirements, or if these products and services do not achieve market acceptance, our operating results could be materially and adversely affected.
Introductions by us in future periods may also reduce demand for, or cause price declines with respect to, our existing products and services. As new or enhanced products and services are introduced, we must successfully manage the transition from older products, avoid excessive levels of older product inventories and ensure that sufficient supplies of new products can be delivered to meet enterprise customer demand. Our failure to do so could adversely affect our revenue, gross margins and other operating results.
Our products and services are highly complex and may contain undetected software or hardware errors, which could harm our reputation and future sales.
Because our customers rely on our products and services for critical aspects of their business, any failure to provide high quality and reliable products and services, whether caused by our own failure, failures by our contract manufacturer or suppliers or outages in our data centers, could damage our reputation and reduce demand for our products and services. Software products may contain defects, and as such our products have in the past contained, and may in the future contain, undetected errors or defects. Some errors may only be discovered after a product has been installed or a service has been introduced and used by customers. Any errors or defects discovered after commercial release could result in loss of revenue, loss of customers and increased service and warranty costs, any of which could adversely affect our business. In addition, we could face claims for product liability, tort or breach of warranty. Our purchase orders contain provisions relating to warranty disclaimers and liability limitations, which may not be upheld. Defending a lawsuit, regardless of its merit, is costly and may divert management’s attention and adversely affect the market’s perception of us and our products. In addition, if our business liability insurance coverage proves inadequate or future coverage is unavailable on acceptable terms or at all, our business, operating results and financial condition could be adversely affected.
20
As we expand our international operations, we could be exposed to significant risks.
The future success of our business will depend, in part, on our ability to expand our operations and customer base successfully worldwide. Operating in international markets requires significant resources and management attention and will subject us to regulatory, economic and political risks that are different from those in the United States. Our international expansion efforts may not be successful. In addition, we will face risks in doing business internationally that could adversely affect our business, including:
| • | our ability to comply with differing technical and environmental standards and certification requirements outside the United States; |
| • | difficulties and costs associated with staffing and managing foreign operations; |
| • | lower gross margins due to higher discounting; |
| • | greater difficulty collecting accounts receivable and longer payment cycles; |
| • | the need to adapt our products for specific countries; |
| • | availability of reliable broadband connectivity and wide area networks in targeted areas for expansion; |
| • | changes in regulatory requirements; |
| • | tariffs, export controls and other non-tariff barriers such as quotas and local content rules; |
| • | more limited protection for intellectual property rights in some countries; |
| • | adverse tax consequences; |
| • | fluctuations in currency exchange rates, which could increase the price of our products and services outside of the United States, increase the expenses of our international operations and expose us to foreign currency exchange rate risk; |
| • | restrictions on the transfer of funds; |
| • | new and different sources of competition; |
| • | less access to the end customer where we use our two-tier distribution internationally; and |
| • | political and economic unrest and instability. For example, the United Kingdom’s recent referendum approving its exit from the European Union, commonly referred to as “Brexit”. As a result of the referendum, it is possible that there will be increased regulatory complexities that may adversely affect our operations and financial results. In addition, the announcement of Brexit caused significant volatility in global stock markets and currency exchange fluctuations that resulted in the strengthening of the U.S. dollar against foreign currencies in which we conduct business, which may adversely affect our results of operations and the value of our international assets and investments. In addition, the United Kingdom's withdrawal from the European Union could result in a global economic downturn, which could depress the demand for our products and services. |
Our failure to manage any of these risks successfully could harm our future international operations and our overall business.
The agreement governing our loan imposes restrictions on our business that may limit our business opportunities and hinder our ability to execute our business strategy.
Our Amended and Restated Credit Agreement (the “New Credit Facility”) contains, and other agreements we may enter into in the future may contain, covenants imposing restrictions on our business, and requires us to maintain certain financial covenants. These restrictions and covenants may affect our ability to operate our business and may limit our ability to take advantage of potential business opportunities as they arise. These covenants place restrictions on our ability to, among other things, incur additional debt, create liens, consolidate or merge, dispose of any property, redeem common stock or make other distributions to stockholders, make investments or enter into transactions with affiliates.
Although we believe we are in compliance with all of our non-financial and financial covenants under the New Credit Facility, our future ability to comply with these covenants may be affected by events beyond our control, including prevailing economic, financial, and industry conditions. In the event of our default under the
21
New Credit Facility, our lender could declare all amounts borrowed to be due and payable, together with accrued and unpaid interest. If we were unable to repay any debt owed, the lender could proceed against the collateral securing that debt.
We might require additional capital or debt to support our business in the future, and this financing might not be available on acceptable terms, or at all.
If our cash and cash equivalents balances are not sufficient to meet our future cash requirements, we will need to seek additional capital, potentially through additional debt or equity financings, to fund our operations. We may also need to raise additional capital to take advantage of new business or acquisition opportunities. We may seek to raise capital by, among other things:
| • | issuing additional common stock or other equity securities; |
| • | issuing debt securities; or |
| • | increasing or replacing our credit facility. |
We may not be able to raise needed cash on terms acceptable to us or at all. Financings, if available, may be on terms that are dilutive or potentially dilutive to our stockholders. The holders of new securities may also receive rights, preferences or privileges that are senior to those of existing holders of common stock. In addition, if we were to raise cash through a debt financing, such debt may impose conditions or restrictions on our operations, which could adversely affect our business. If new sources of financing are required but are insufficient or unavailable, we would be required to modify our operating plans to the extent of available funding, which would harm our ability to maintain or grow our business.
Any denial or disruption of our hosted services whether from cyber attacks or failure in our physical infrastructure could lead to significant costs, reduce our revenue, and inhibit our ability to obtain future orders.
Our hosted services may be interrupted for a variety of reasons, including without limitation, cyber attacks or failures in the physical infrastructure network. We may be the subject of unauthorized entry, computer viruses, malicious software programs, or other forms of cyber attacks aimed to disrupt our services. While we implement backup systems, mitigation efforts and procedures and other security protocols to mitigate such attacks, we cannot assure you that such protocols will be sufficient now or in the future to prevent such cyber attacks.
The physical infrastructure network for our hosted services is operated by external companies in data centers. The network and data centers are subject to various points of failure. Problems with cooling equipment, generators, power supply, routers, switches, or other equipment, whether or not within our control, could result in service interruptions for our customers as well as equipment damage. Because our services do not require geographic proximity of our data centers to our customers, our infrastructure is consolidated into a few large facilities. Any failure or downtime in one of our leased data center facilities could affect a significant percentage of our customers. The destruction or severe impairment of any of our leased data center facilities could result in significant downtime of our services and the loss of customer data. Additionally, in connection with the expansion or consolidation of our existing leased data center facilities from time to time, there is an increased risk that service interruptions may occur as a result of server relocation or other unforeseen construction-related issues.
Because our ability to attract and retain customers depends on our ability to provide customers with highly reliable service, even minor interruptions in our service could harm our reputation. We have taken and continue to take steps to improve our infrastructure to prevent service interruptions. However, service interruptions continue to be a significant risk for us and could materially impact our business.
Any future service interruptions could:
| • | cause our customers to seek damages for losses incurred; |
| • | require us to replace existing equipment or add redundant facilities; |
| • | affect our reputation as a reliable provider of hosting services; |
22
| • | cause existing customers to cancel or elect to not renew their contracts; or |
| • | make it more difficult for us to attract new customers. |
Any of these events could materially increase our expenses or reduce our revenue, which would have a material adverse effect on our operating results.
We could be the subject of malicious cyber acts or experience other breaches of network security.
In providing our services, we store, process and transmit confidential and sensitive information including financial, credit card, account and personal information which may be protected by regulations. We may be subject to cyber threats and network security breaches by employees or third parties. Our ability to securely handle such sensitive information is critical to our business. In addition, laws requiring notification of individuals regarding security breaches related to their personal information continue to be adopted and evolve. Security breaches regarding personal information and compliance with such notification requirements could lead to significant costs for compliance, regulatory fines and other liability. Such security breaches could also harm our reputation and negatively impact our ability to attract new customers or retain existing customers.
Further, to the extent that we represent to our customers that we are compliant with particular laws regulating the handling of confidential or sensitive information, such as HIPAA or PCI, any network security breach relating to such information may expose us to claims of unfair trade practices for misrepresenting our level of compliance, truth in advertising claims, investigations by federal and state law enforcement agencies, fines, penalties and other legal liability.
We continuously monitor the security of our networks and implement protective measures to prevent cyber threats. However, as cyber threats continue to evolve and become more sophisticated, we may not be able to address all such cyber threats, and the costs to continually protect against or remediate such cyber threats may adversely impact our profitability or increase the price of our offerings making them less competitive.
We could experience breaches in physical security or problems with our information systems.
Our business and operations depend on information systems, including those of third parties, to process customer orders, bill customers, provide technical support, and support accounting functions and financial planning. We have in the past and may in the future experience problems with our information systems that cause interruption in our business operations and our ability to respond to customer needs. Information systems are vulnerable to interruption for a variety of reasons, including without limitation, computer viruses, breaches of physical security, breaches of information security, and problems with third-party providers. The implementation of new information systems and the maintenance or upgrading of existing information systems may cause disruption to our operations and business and damage our reputation with customers. Such implementations can also be more expensive than estimated and divert management attention.
Fraudulent schemes could harm our business reputation and have a material adverse effect on our financial results.
Our products and services may be subject to fraudulent schemes. Third parties have in the past and may continue to attempt in the future to defraud our customers and us by fraudulently inducing employees or consultants into disclosing account information, user names, passwords, personal identification numbers, or customer proprietary network information. Other fraudulent schemes can result in unauthorized use of services or access to customer account information or data. Breaches of network security, or the failure to mitigate such fraud or breaches may adversely affect our operating results. For example, we may be unable to prevent our customers from incurring charges from fraudulent international toll calls made with their phone numbers. We may be required to pay such fraudulent charges without reimbursement from our customers, and our reputation may be harmed. If our customer credit cards are compromised or people use stolen credit cards to pay for services, we may incur costs which may not be reimbursed or we may not be able to recover payment for our services.
If third-party technology and intellectual property included, or that we intend to include, in our products becomes unavailable to us, our product releases could be delayed while we license or develop equivalent technology or intellectual property, which could harm our business.
We incorporate certain third-party technologies and intend to utilize additional third-party technologies in the future. However, licenses to relevant third-party technology or updates to those technologies may not continue to
23
be available to us on commercially reasonable terms, or at all. Therefore, we could face delays in product releases until equivalent technology can be identified, licensed or developed, and integrated into our current products and services. These delays, if they occur, could materially adversely affect our business.
If a third party asserts that we are infringing on its intellectual property, whether successful or not, it could subject us to costly and time-consuming litigation or expensive licenses, which could harm our business.
There is considerable patent and other intellectual property development activity in our industry. Our success depends, in part, upon our not infringing upon the intellectual property rights of others. Our competitors, as well as a number of other “non-practicing entities” and individuals, own or claim to own intellectual property relating to our industry and may have substantially larger and broader patent portfolios than we do. From time to time, third parties have in the past and may in the future claim that we are infringing upon their intellectual property rights, and we may be found to be infringing upon such rights. Third parties have in the past sent us correspondence regarding their intellectual property and have filed litigation against us, and in the future we may receive claims that our products infringe or violate their intellectual property rights. Furthermore, we may be unaware of the intellectual property rights of others that may cover some or all of our technology or products. Any claims or litigation could cause us to incur significant expenses and, if successfully asserted against us, could require that we pay substantial damages or ongoing royalty payments, prevent us from selling our products, damage our reputation, or require that we comply with other unfavorable terms, any of which could materially harm our business. In addition, we may decide to pay substantial settlement costs in connection with any claim or litigation, whether or not successfully asserted against us. Even if we were to prevail, any litigation regarding our intellectual property could be costly and time-consuming and divert the attention of our management and key personnel from our business operations.
Litigation with respect to intellectual property rights in our industry is not uncommon and can often involve patent holding companies who have little or no product revenue and against whom our own patents may provide little or no deterrence. We may also be obligated to indemnify our customers or business partners in connection with any such litigation, which could further exhaust our resources. Furthermore, as a result of an intellectual property challenge, we may be required to enter into royalty, license or other agreements. We may not be able to obtain these agreements on terms acceptable to us or at all. We may have to incur substantial cost in re-designing our products to avoid infringement claims. In addition, disputes regarding our intellectual property rights may deter distributors from selling our products and dissuade potential customers from purchasing such products. As such, third-party claims with respect to intellectual property may increase our cost of goods sold or reduce the sales of our products and services, and may have a material and adverse effect on our business.
Failure to protect our intellectual property could substantially harm our business.
Our success and ability to compete are substantially dependent upon our intellectual property. We rely on patent, trademark and copyright law, trade secret protection and confidentiality or license agreements with our employees, enterprise customers, strategic partners and others to protect our intellectual property rights. However, the steps we take to protect our intellectual property rights may be inadequate. We cannot assure you that any additional patents will be issued. Even if patents are issued, they may not adequately protect our intellectual property rights or our products against competitors, and third-parties may challenge the scope, validity and/or enforceability of our issued patents. In addition, other parties may independently develop similar or competing technologies designed around any patents that may be issued to us.
In order to protect our intellectual property rights, we may be required to spend significant resources to monitor and protect such rights. We may not be able to detect infringement, and may lose our competitive advantage before we are able to do so. In the event that we detect any infringement of our intellectual property rights, we intend to enforce such rights vigorously, and from time to time we may initiate claims against third parties that we believe are infringing on our intellectual property rights if we are unable to resolve matters satisfactorily through negotiation. Litigation brought to protect and enforce our intellectual property rights could be costly, time-consuming and distracting to management and could result in the impairment or loss of portions of our intellectual property. Furthermore, our efforts to enforce our intellectual property rights may be met with defenses, counterclaims and countersuits attacking the validity and enforceability of our intellectual property rights. Our failure to secure, protect and enforce our intellectual property rights could harm our brand and adversely impact our business, financial condition and results of operations.
24
If we fail to establish and maintain proper and effective internal control over financial reporting, our operating results and our ability to operate our business could be harmed.
The Sarbanes-Oxley Act of 2002 requires, among other things, that we establish and maintain internal control over financial reporting and disclosure controls and procedures. In particular, under the current rules of the Securities and Exchange Commission (“SEC”), we must perform system and process evaluation and testing of our internal control over financial reporting to allow management to report on the effectiveness of our internal control over financial reporting, as required by Section 404 of the Sarbanes-Oxley Act. Our independent registered public accounting firm is also required to report on our internal control over financial reporting. Our and our auditor’s testing may reveal deficiencies in our internal control over financial reporting that are deemed to be material weaknesses and render our internal control over financial reporting ineffective. We have incurred and we expect to continue to incur substantial accounting and auditing expense and expend significant management time in complying with the requirements of Section 404. If we are not able to comply with the requirements of Section 404, or if we or our independent registered public accounting firm identify deficiencies in our internal control over financial reporting that are deemed to be material weaknesses, the market price of our stock could decline and we could be subject to investigations or sanctions by the SEC, The NASDAQ Stock Market, or NASDAQ, or other regulatory authorities or subject to litigation. To the extent any material weaknesses in our internal control over financial reporting are identified in the future, we could be required to expend significant management time and financial resources to correct such material weaknesses or to respond to any resulting regulatory investigations or proceedings.
Catastrophic disasters or other events beyond our control such as earthquakes and hurricanes could damage our facilities or the facilities of our contract manufacturers, which could cause us to curtail our operations.
Our principal offices and some of our disaster recovery sites are located in California near known earthquake fault zones and, therefore, are vulnerable to damage from earthquakes. We are also vulnerable to damage from other types of disasters, such as power loss, fire, floods and other similar events beyond our control such as acts of war or terrorism. If any disaster were to occur, our ability to operate our business could be seriously impaired. For example, power loss from natural disasters could cause outages to our data centers and interruption of service to our customers. Such outages could have an adverse effect on our brand, cause us to issue credits to our customers, increase our expenses from replacing equipment, and have other adverse effects on our results of operations. Natural disasters could also cause interruption of our information systems preventing us from responding to customer needs. In addition, we may not have adequate insurance to cover our losses resulting from disasters or other similar significant business interruptions.
Our success also depends on our ability to handle a large number of simultaneous calls, which our network may not be able to accommodate.
We expect the volume of simultaneous calls to increase significantly as our subscriber base grows. Our network hardware and software may be strained by heavy volume. If we fail to maintain an appropriate level of operating performance, or if our service is disrupted, our reputation could be hurt and we could lose customers or have to issues credits or refunds, all of which could have a material adverse effect on our business, financial condition or operating results.
Our hosted services must comply with industry standards, federal, state and local regulations, and compliance may be costly and/or require us to modify existing services.
Our hosted services rely on communication standards such as SIP and network standards such as TCP/IP and UDP to interoperate with other vendors' equipment. There is currently a lack of agreement among industry leaders about which standard should be used for a particular application, and about the definition of the standards themselves. As standards evolve, we may be required to modify our existing products or develop and support new versions of our services.
We must also comply with certain federal, state and local requirements regarding how we interact with our customers, including marketing practices, consumer protection, privacy, law enforcement and billing issues, the provision of emergency calling services and the quality of service we provide to our customers. The failure of our services to comply, or delays in compliance, with various existing and evolving regulations could delay or
25
interrupt the sales of our services, subject us to fines or other imposed penalties, or harm the perception and adoption rates of our service, any of which would have a material adverse effect on our business, financial condition or operating results.
Our emergency calling services are different from those offered by traditional wireline telephone companies and may expose us to significant liability. There may be risks associated with limitations associated with emergency dialing with our services.
Our emergency calling service differs from the emergency calling services offered by traditional wireline telephone companies. In each case, the differences may cause significant delays, or even failures, in callers' receipt of the emergency assistance they need.
We route emergency calls to a service aggregation vendor, who in turn routes the calls to the local Public Safety Answering Point, or PSAP. The PSAP should have automatic access to the customer's telephone number and registered location information. If the number is not associated with an address in an emergency call, then the call is routed by the vendor to an emergency response center where a live answer takes place and the address is determined for routing to the correct PSAP. If a customer moves their service to a new location, the customer's registered location information must be updated and verified by the customer. Until that takes place, the customer will have to verbally advise the emergency dispatcher of his or her actual location at the time of an emergency call. This can lead to delays in the delivery of emergency services.
In addition, in the event that a customer experiences a broadband or power outage, or if a network failure were to occur, the customer will not be able to reach an emergency services provider using our services. Delays our customers may encounter when making emergency services calls and any inability of the answering point to automatically recognize the caller's location or telephone number can result in life threatening consequences. Customers may, in the future, attempt to hold us responsible for any loss, damage, personal injury or death suffered as a result of any failure of our emergency calling services.
There may be risks associated with our ability to comply with the requirements of federal law enforcement agencies.
The FCC requires all interconnected VoIP providers to comply with the Communications Assistance for Law Enforcement Act (“CALEA”). The FCC allows VoIP providers to comply with CALEA through the use of a solution provided by a trusted third party with the ability to extract call content and call-identifying information from a VoIP provider's network. While the FCC permits companies like us to use the services provided by these third parties to comply with CALEA, we are ultimately responsible for ensuring the timely delivery of call content and call-identifying information to law enforcement, and for protecting subscriber privacy. While we believe we are currently CALEA compliant, we could be subject to an enforcement action by the FCC or law enforcement agencies for any delays related to meeting, or if we fail to comply with, any current or future CALEA obligations.
Reform of federal and state Universal Service Fund programs could increase the cost of our service to our customers diminishing or eliminating our pricing advantage.
The FCC and a number of states may consider reform or modifications to Universal Service Fund programs. Should the FCC or certain states adopt new contribution mechanisms or otherwise modify contribution obligations that increase our contribution burden, we will either need to raise the amount we currently collect from our customers to cover this obligation or absorb the costs, which would reduce our profit margins. Furthermore, the FCC has ruled that states can require us to contribute to state Universal Service Fund programs. A number of states already require us to contribute, while others are actively considering extending their programs to include the services we provide. We currently pass-through Universal Service Fund contributions to our customers which may result in our services becoming less competitive as compared to those provided by others.
Changes in regulatory compliance obligations of critical suppliers may adversely impact our operations.
The Dodd-Frank Wall Street Reform and Consumer Protection Act, (“Dodd-Frank Act”), includes Section 1502, related to additional disclosure requirements for certain minerals sourced from the Democratic Republic of Congo and surrounding countries, or conflict minerals, for which such conflict minerals are necessary to the
26
functionality of a product manufactured, or contracted to be manufactured, by an SEC reporting company. The metals covered by the rules include tin, tantalum, tungsten and gold. Our suppliers may use these materials in the production processes. We will have to perform supply chain due diligence, third-party verification and possibly private sector audits on the sources of these metals. Global supply chains are complicated, with multiple layers and suppliers between the mine and the final product. Accordingly, we could incur significant cost related to the compliance process. While the impact of Section 1502 on our business is uncertain at this time, we could potentially have difficulty in procuring needed materials from conflict-free sources.
Increased taxes or regulatory fees on our services will increase our customers' cost of using our services and/or reduce our profit margins (to the extent the costs are not passed through to our customers) and we may be subject to liabilities for past sales and additional taxes, surcharges and fees.
Where we have filed federal, state and municipal tax returns such as sales, excise and ad valorem taxes, fees or surcharges for the services we provide, the interpretation and application of the tax laws and regulations applicable in such jurisdictions may be in conflict with the interpretation held by the states and municipalities where we do business. Any increase or changes in our collection of these taxes, fees or surcharges may have the effect of decreasing any price advantage we may have over other providers. Our compliance with these tax initiatives may make us less competitive with those competitors who choose not to comply with these tax initiatives. We have accrued for taxes that we believe are required to be remitted. If our ultimate liability exceeds the accrued amount, it could result in a material adverse effect on our earnings.
Changes in telecommunications regulation and tariffs could harm our business.
Changes in telecommunications requirements, or regulatory requirements in other industries in which we operate, in the United States or other countries could affect the sales of our products and services. Future changes in tariffs by regulatory agencies or application of tariff requirements to currently untariffed services could affect the sales of our products and services for certain classes of customers. Additionally, in the United States, our products and services must comply with various requirements and regulations of the Federal Communications Commission and other regulatory authorities. In countries outside of the United States, our products must meet various requirements of local telecommunications and other industry authorities. These changes could have a material adverse effect on our business, operating results, and financial condition.
We are subject to environmental and other health and safety regulations that may increase our costs of operations or limit our activities.
We are subject to environmental and other health and safety regulations relating to matters such as reductions in the use of harmful substances, the use of lead-free soldering and the recycling of products and packaging materials. These regulations generally require electronics producers to bear the cost of collection, treatment, recovery and safe disposal of past and future products from end users and to ensure that new electrical and electronic equipment does not contain specified hazardous substances. The cost of these regulations to us may be substantial and may divert resources, which could detract from our ability to develop new products or operate our business, particularly if we increase international operations. We may not be able to comply in all cases with applicable environmental and other regulations, and if we do not, we may incur remediation costs or we may not be able to offer our products for sale in certain countries, which could adversely affect our results.
Our business depends on continued and unimpeded access to the Internet and the development and maintenance of Internet infrastructure.
The adoption of any laws or regulations that adversely affect the growth, popularity or use of the Internet, including laws impacting Internet neutrality, could decrease the demand for our solution and increase our operating costs. For example, in 2015, the FCC adopted rules intended, in part, to maintain net neutrality and to prevent network operators from discriminating against legal traffic that transverse their networks. To the extent network operators attempt to use other laws or regulations to extract fees from us to deliver our services or otherwise engage in discriminatory practices, our business could be adversely impacted. Internationally, government regulation concerning the Internet, and in particular, network neutrality, may be developing or non-existent. Within such a regulatory environment, we could experience discriminatory or anti-competitive practices that could impede our domestic and international growth, cause us to incur additional expense or otherwise negatively affect our business.
27
We rely on third party network service providers to originate and terminate a significant portion of our public switched telephone network, or PTSN, calls, which could lead to business disruption if service providers ceased operations or terminated their services.
We leverage the infrastructure of third party network service providers to provide telephone numbers, PSTN call termination and origination services, private network access and local number portability for our customers rather than deploying our own networks. This decision has resulted in lower capital and operating costs for our business in the short term but has reduced our operating flexibility and ability to make timely service changes. If any of these network service providers cease operations or otherwise terminate the services that we depend on, the delay in switching our technology to another network service provider, if available, and qualifying this new service could have a material adverse effect on our business, financial condition or operating results.
While we believe that relations with our current service providers are good, and we have contracts in place, there can be no assurance that these service providers will be able or willing to supply cost-effective services to us in the future or that we will be successful in signing up alternative or additional providers. Although we could replace our current providers, if necessary, our ability to provide service to our subscribers could be impacted during this timeframe and this could have an adverse effect on our business, financial condition or results of operations. The loss of access to, or requirement to change, the telephone numbers we provide to our customers also could have a material adverse effect on our business, financial condition or operating results.
Due to our reliance on these service providers, when problems occur in a network, it may be difficult to identify the source of the problem. The occurrence of hardware and software errors, whether caused by our service or another vendor's products, may result in the delay or loss of market acceptance of our products and any necessary revisions may force us to incur significant expenses. The occurrence of some of these types of problems may seriously harm our business, financial condition or operating results.
Our products contain third-party open source software components, and failure to comply with the terms of the underlying open source software licenses could restrict our ability to sell our products.
Our products contain software modules licensed to us under “open source” licenses. From time to time, there have been claims against companies that distribute or use open source software in their products and services, asserting that open source software infringes the claimants’ intellectual property rights. We could be subject to suits by parties claiming infringement of intellectual property rights in what we believe to be licensed open source software. Use and distribution of open source software may entail greater risks than use of third-party commercial software, as open source licensors generally do not provide warranties or other contractual protections regarding infringement claims or the quality of the code. Some open source licenses contain requirements that we make available source code for modifications or derivative works we create based upon the type of open source software we use. If we combine our proprietary software with open source software in a certain manner, we could, under certain open source licenses, be required to release the source code of our proprietary software to the public. This would allow our competitors to create similar products with lower development effort and time and ultimately could result in a loss of product sales for us.
Although we monitor our use of open source software to avoid subjecting our products to conditions we do not intend, the terms of many open source licenses have not been interpreted by United States courts, and there is a risk that these licenses could be construed in a way that could impose unanticipated conditions or restrictions on our ability to commercialize our products. In this event, we could be required to seek licenses from third parties to continue offering our products, to make our proprietary code generally available in source code form, to re-engineer our products or to discontinue the sale of our products if re-engineering could not be accomplished on a timely basis, any of which requirements could adversely affect our business, operating results and financial condition.
28
Risks Related to Ownership of Our Common Stock
Our stock price in the past has been volatile, and may continue to be volatile or may decline regardless of our operating performance, and investors may not be able to resell shares at or above the price at which they purchased the shares.
Since our stock began trading in July 2007, our stock price has fluctuated significantly. At times the stock price has changed very quickly. If investors purchase shares of our common stock, they may not be able to resell those shares at or above the price at which they purchased them. The market price of our common stock may fluctuate significantly in response to numerous factors, many of which are beyond our control, including:
| • | fluctuations in the overall stock market; |
| • | the financial projections we may provide to the public, any changes in these projections or our failure to meet these projections; |
| • | actual or anticipated fluctuations in our operating results; |
| • | changes in operating performance and stock market valuations of other technology companies generally, or those that sell communication products in particular; |
| • | changes in financial estimates by any securities analysts who follow our company, our failure to meet these estimates or failure of those analysts to initiate or maintain coverage of our stock; |
| • | ratings downgrades by any securities analysts who follow our company; |
| • | the public’s response to our press releases or other public announcements, including our filings with the SEC; |
| • | announcements by us or our competitors of significant technical innovations, customer wins or losses, acquisitions, strategic partnerships, joint ventures or capital commitments; |
| • | introduction of technologies or product enhancements that reduce the need for our products; |
| • | market conditions or trends in our industry or the economy as a whole; |
| • | lawsuits threatened or filed against us and the outcome of such lawsuits; |
| • | shareholder activism; |
| • | future sales of our common stock by our officers, directors and significant stockholders; and |
| • | other events or factors, including those resulting from war, incidents of terrorism or responses to these events. |
In addition, the stock markets, and in particular the NASDAQ Global Select Market, have experienced extreme price and volume fluctuations that have affected and continue to affect the market prices of equity securities of many technology companies. Stock prices of many technology companies have fluctuated in a manner unrelated or disproportionate to the operating performance of those companies. In the past, stockholders have initiated securities class action litigation following declines in stock prices of technology companies. Any litigation may subject us to substantial costs, divert resources and the attention of management from our business, which could harm our business and operating results.
Our operating results may fluctuate in the future, which could cause our stock price to decline.
Our historical revenues and operating results have varied from quarter to quarter. Moreover, our actual or projected operating results for some quarters may not meet our own expectations, or the expectations of stock market analysts and investors, which may cause our stock price to decline. In addition to the factors discussed elsewhere in this “Risk Factors” section, a number of factors may cause our revenue to fall short of our expectations or cause fluctuations in our operating results, including:
| • | adverse conditions specific to the Unified Communications industry, including decreased demand due to overall economic conditions or reduced discretionary spending by enterprises, rates of adoption of Unified Communications systems and services and introduction of new standards; |
| • | our ability to attract and retain larger and more productive channel partners; |
29
| • | the purchasing and budgeting cycles of customers, in particular, the tendency of some customers to wait until the end of a quarter in the hopes of obtaining a better price; |
| • | the timing and volume of shipments of our products during a quarter, particularly as we experience an increased level of sales occurring towards the end of a quarter; |
| • | delays in purchasing decisions by our customers from one quarter to the next, or later; |
| • | seasonality in our target markets; |
| • | our ability to attract new channel partners, retain existing channel partners, and their ability to generate revenues; |
| • | changes in accounting rules; |
| • | timing of product introductions; |
| • | the timing of recognition of revenue from sales to our customers; |
| • | changes in the mix of our products and services sold during a particular period; |
| • | our ability to control costs, including third-party manufacturing costs and costs of components; |
| • | our ability to maintain sufficient production volumes for our products from our contract manufacturers; |
| • | volatility in our stock price, which may lead to higher stock-based compensation expenses; |
| • | volatility and fluctuation in foreign currency exchange rates; |
| • | the timing of costs related to the development or acquisition of technologies or businesses; |
| • | our ability to successfully expand our international operations; |
| • | general economic conditions or economic recession; |
| • | a significant growth of hosted and related services sales causing a negative impact to our short term earnings due to how revenue is recognized for hosted and related services as compared to the timing of the recognition of certain related expenses; |
| • | decline in interest rates on our investments; and |
| • | publicly-announced litigation, and the impact of such litigation on our operating results. |
Because our operating expenses are largely fixed in the short-term, any shortfalls in revenue in a given period would have a direct and adverse effect on our operating results in that period. We believe that our quarterly and annual revenue and results of operations may vary significantly in the future and that period-to-period comparisons of our operating results may not be meaningful. You should not rely on the results of one period as an indication of future performance. If our revenues and operating results do not meet the expectations of our investors or securities analysts or fall below guidance we may provide to the market, the price of our common stock may decline.
A substantial portion of our product orders are usually received in the last month of each fiscal quarter, with a concentration of such orders in the final two weeks of the quarter. While we typically ship products shortly after the receipt of an order, we may have orders that have not shipped at the end of any given quarter. Because the amount of such product orders may vary, the amount, if any, of such orders at the end of a particular quarter is not a reliable predictor of our future performance.
Our charter documents and Delaware law may inhibit a takeover that stockholders consider favorable and could also limit the market price of our stock.
Our restated certificate of incorporation and bylaws and applicable provisions of Delaware law may make it more difficult for or prevent a third party from acquiring control of us without the approval of our board of directors. These provisions:
| • | prohibit stockholder action by written consent, thereby requiring all stockholder actions to be taken at a meeting of our stockholders; |
| • | limit who may call a special meeting of stockholders; |
30
| • | established a classified board of directors, so that not all members of our board of directors may be elected at one time; |
| • | provide our board of directors with the ability to designate the terms of and issue a new series of preferred stock without stockholder approval; |
| • | require the approval of two-thirds of the shares entitled to vote at an election of directors to adopt, amend or repeal our bylaws or repeal certain provisions of our certificate of incorporation; |
| • | allow a majority of the authorized number of directors to adopt, amend or repeal our bylaws without stockholder approval; |
| • | do not permit cumulative voting in the election of our directors, which would otherwise permit less than a majority of stockholders to elect directors; |
| • | set limitations on the removal of directors; and |
| • | restrict certain litigation against us to be brought only in the State of Delaware. |
In addition, Section 203 of the Delaware General Corporation Law generally limits our ability to engage in any business combination with certain persons who own 15% or more of our outstanding voting stock or any of our associates or affiliates who at any time in the past three years have owned 15% or more of our outstanding voting stock. These provisions may have the effect of entrenching our management team and may deprive you of the opportunity to sell your shares to potential acquirers at a premium over prevailing prices. This potential inability to obtain a control premium could reduce the price of our common stock.
| ITEM 1B. | UNRESOLVED STAFF COMMENTS |
None.
| ITEM 2. | PROPERTIES |
Our headquarters, which is located in Sunnyvale, California, is a 63,781 square foot leased facility. This lease expires in September 2019. We also occupy leased facilities elsewhere in the United States, Europe, Canada, India, Singapore and Australia.
We maintain a shipping and warehouse facility in Newark, California for our inventory and we rent space as needed at various third-party warehouses throughout the world.
We believe that our current facilities are suitable and adequate to meet our current needs, and we may add new facilities or expand existing facilities as we add employees. We believe that suitable additional or substitute space will be available on commercially reasonable terms as needed to accommodate our operations.
| ITEM 3. | LEGAL PROCEEDINGS |
Information with respect to this item may be found in Note 13 to the Consolidated Financial Statements in Item 8, which is incorporated herein by reference.
| ITEM 4. | MINE SAFETY DISCLOSURES |
Not applicable.
31
PART II.
| ITEM 5. | MARKET FOR OUR COMMON STOCK, RELATED STOCKHOLDER MATTERS AND PURCHASES OF EQUITY SECURITIES |
Market Information
Our common stock has been traded on The NASDAQ Global Select Market under the symbol “SHOR” since July 3, 2007. The following table sets forth for the periods indicated the high and low sale prices of our common stock, as reported by The NASDAQ Global Select Market.
Year Ended June 30, 2016 |
High |
Low |
||||
First Quarter |
$ | 7.63 | 6.75 | |||
Second Quarter |
10.42 | 7.41 | ||||
Third Quarter |
8.61 | 7.00 | ||||
Fourth Quarter |
7.57 | 5.96 | ||||
Year Ended June 30, 2015 |
High |
Low |
||||
First Quarter |
$ | 7.00 | 5.96 | |||
Second Quarter |
8.34 | 5.90 | ||||
Third Quarter |
7.64 | 6.59 | ||||
Fourth Quarter |
7.36 | 6.72 | ||||
On August 26, 2016, the last reported sales price of our common stock on the NASDAQ Global Select Market was $7.98 per share.
Holders of Record
As of August 26, 2016, there were 63 stockholders of record of our common stock, although we believe there are approximately 6,000 beneficial owners since many brokers and other institutions hold our common stock on behalf of stockholders.
Dividend Policy
We have never declared or paid dividends on our common stock. We intend to retain any future earnings for use in our business and therefore we do not anticipate declaring or paying any cash dividends in the foreseeable future.
Issuer Purchases of Equity Securities
In May 2016, the Board of Directors authorized us to repurchase up to $20.0 million of the Company's common stock from time to time at the discretion of our management. This stock repurchase authorization has no expiration date.
During fiscal 2016, we repurchased approximately 126,000 shares of our common stock for $0.8 million. As of June 30, 2016, we had a remaining authorization of $19.2 million for future share repurchases. The number of shares to be repurchased and the timing of such repurchases will be based on several factors, including the price of the Company's common stock and liquidity and general market and business conditions.
The following table summarizes the activity related to stock repurchases for the three months ended June 30, 2016:
Period |
Total Number of Shares Purchased |
Average Price Paid per Share |
Total Number of Shares Purchased as Part of Publicly Announced Plans or Programs |
Approximate Dollar Value That May Yet be Purchased Under the Plans or Programs |
||||||||
(In thousands, except per share amounts) |
||||||||||||
April 1, 2016 - April 30, 2016 |
— | $ | — | — | $ | 20,000 | ||||||
May 1, 2016 - May 31, 2016 |
126 | $ | 6.49 | 126 | $ | 19,181 | ||||||
June 1, 2016 - June 30, 2016 |
— | $ | — | — | $ | 19,181 | ||||||
Total |
126 | $ | 6.49 | 126 | $ | 19,181 | ||||||
32
Stock Performance Graphs and Cumulative Total Return2
The following graph shows the cumulative total stockholder return of an investment of $100 in cash on June 30, 2011 through June 30, 2016, for (i) our common stock, (ii) the S&P Small Cap 500 Index and (iii) the NASDAQ Telecommunications Index. Pursuant to applicable SEC rules, all values assume reinvestment of the full amount of all dividends, however no dividends have been declared on our common stock to date. The stockholder return shown on the graph below is not necessarily indicative of future performance, and we do not make or endorse any predictions as to future stockholder returns.
This performance graph shall not be deemed “filed” for purposes of Section 18 of the Securities Exchange Act of 1934, as amended, or the “Exchange Act,” or incorporated by reference into any filing of ours under the Securities Act of 1933, as amended, or the Exchange Act, except as shall be expressly set forth by specific reference in such filing.
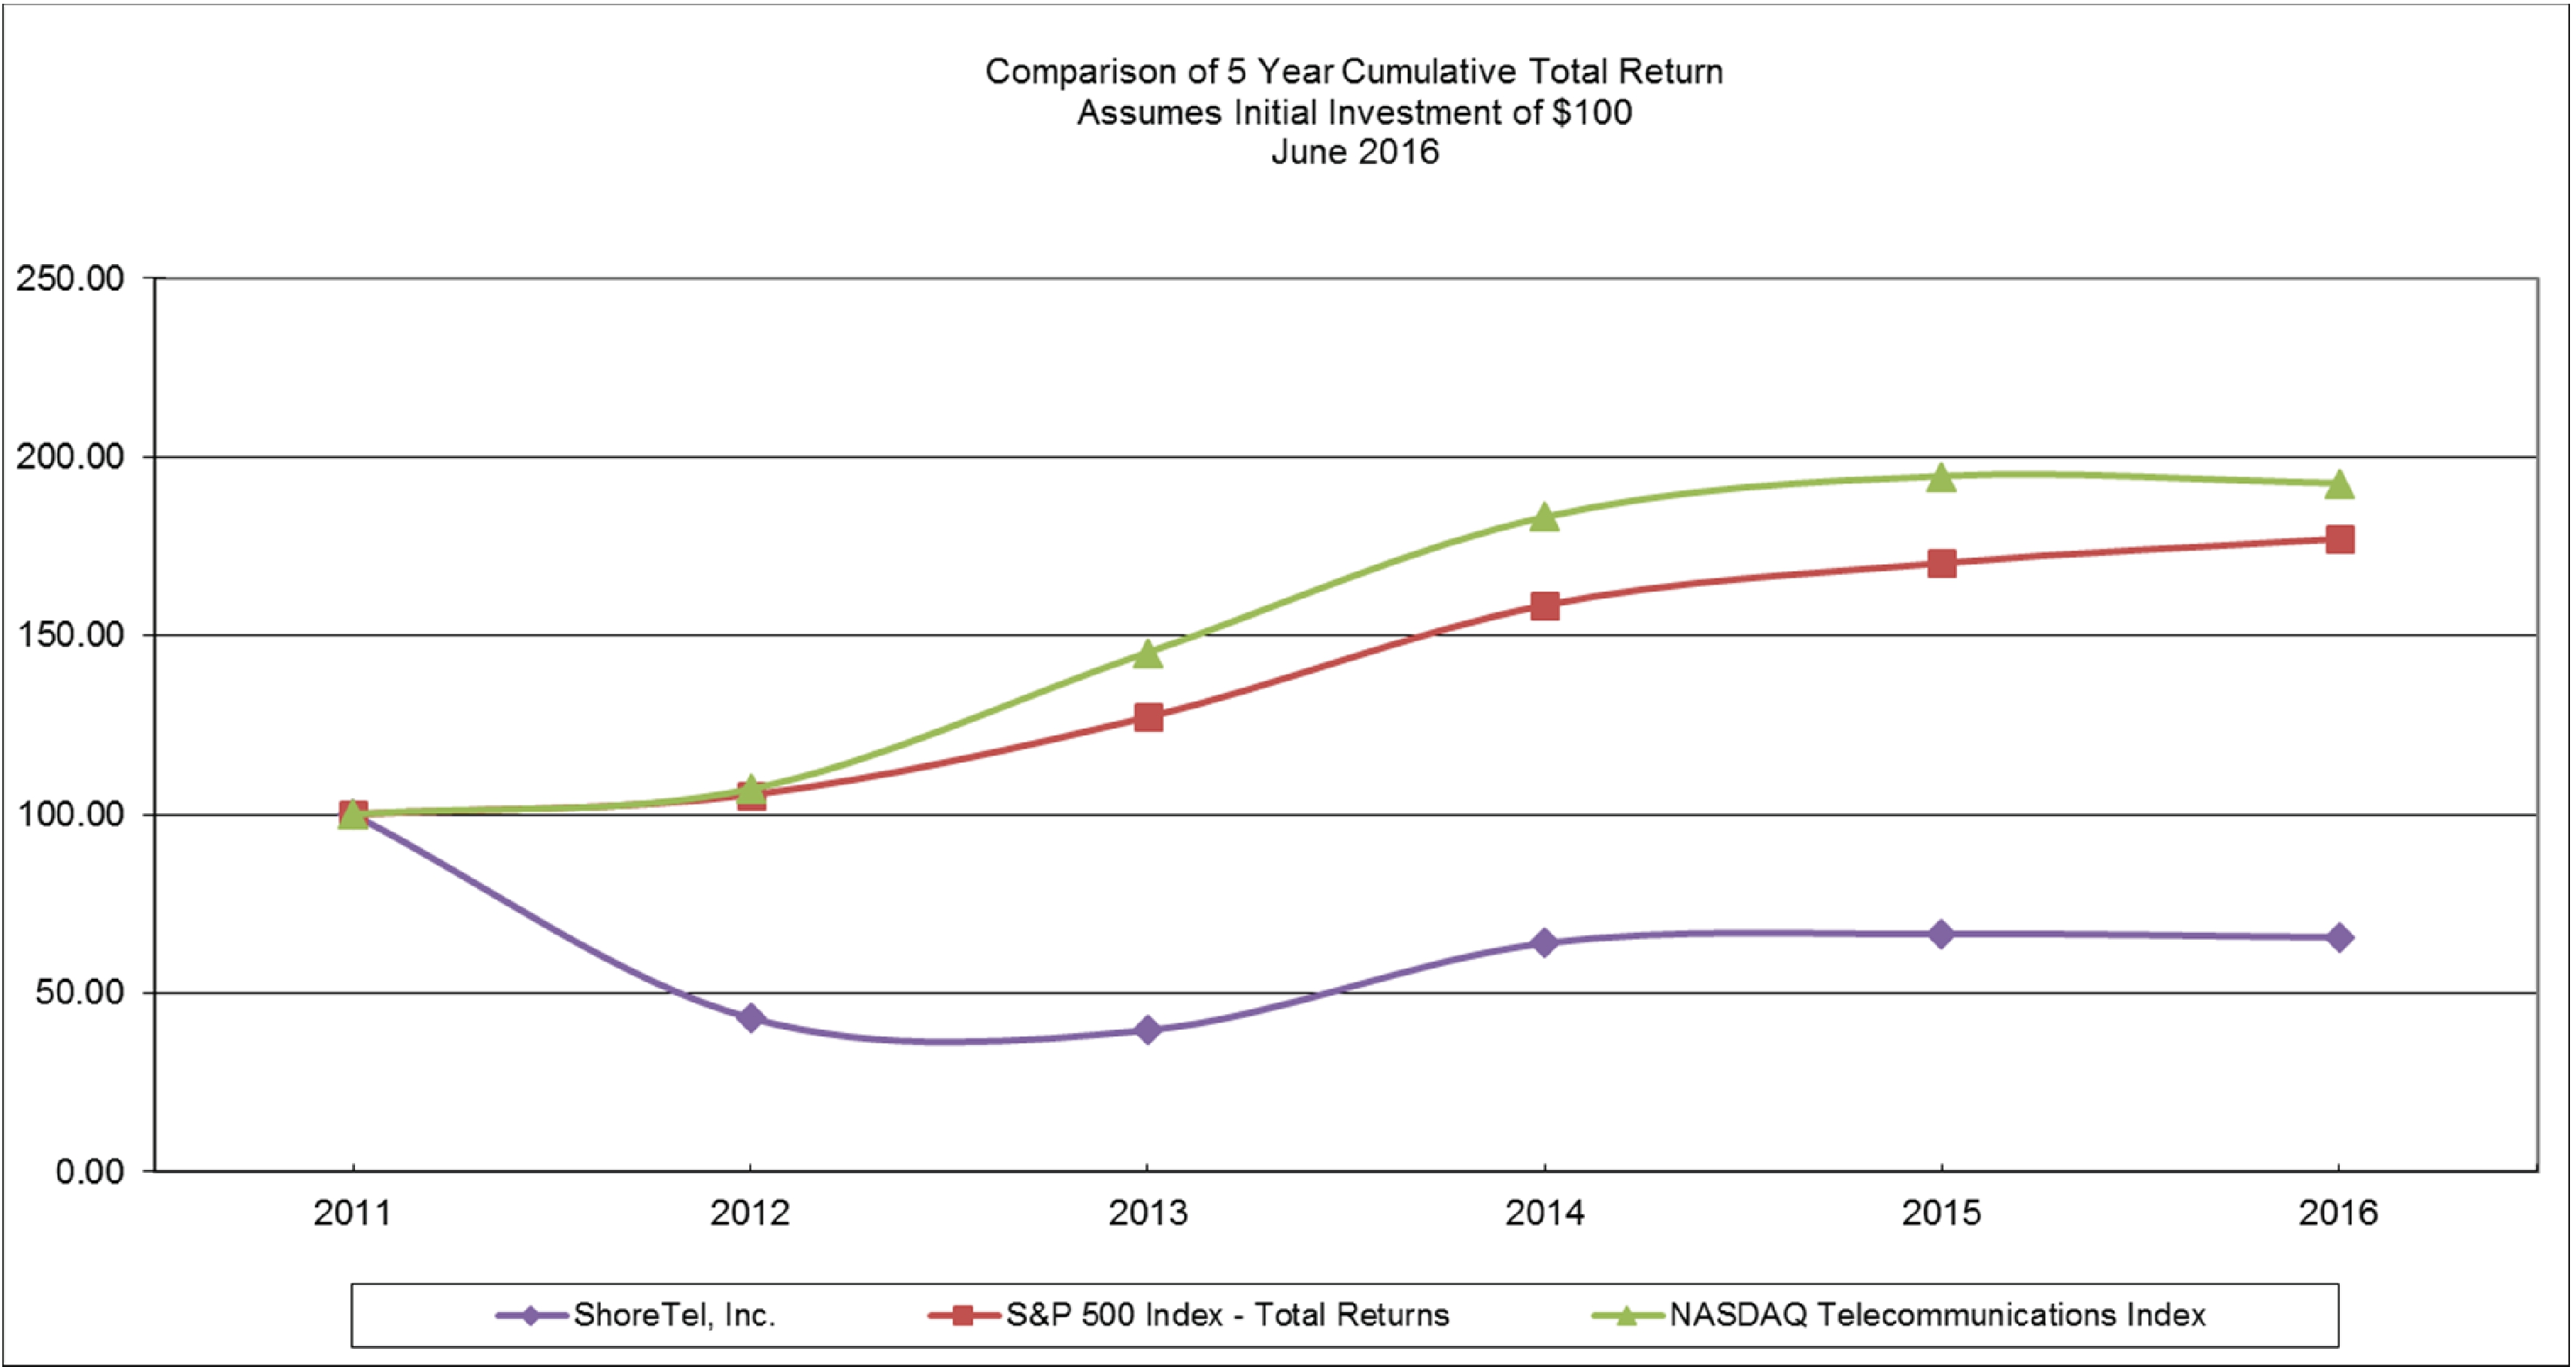
$100 invested on June 30, 2011 in stock or index. Fiscal year ending June 30,
2011 |
2012 |
2013 |
2014 |
2015 |
2016 |
|||||||||||||
ShoreTel, Inc. |
$ | 100.00 | $ | 42.94 | 39.51 | 63.92 | 66.47 | 65.59 | ||||||||||
S&P Small Cap 500 Index |
100.00 | 105.45 | 127.17 | 158.46 | 170.22 | 177.02 | ||||||||||||
NASDAQ Telecommunications Index |
100.00 | 106.98 | 145.25 | 183.16 | 194.61 | 192.56 | ||||||||||||
| 2 | This Section is not “soliciting material,” is not deemed “filed” with the SEC and is not to be incorporated by reference in any filing of ShoreTel, Inc. under the 1933 Act or the 1934 Act whether made before or after the date hereof and irrespective of any general incorporation language in any such filing. |
33
Equity Compensation Plan Information
The following table summarizes information about our equity compensation plans as of June 30, 2016. All outstanding awards relate to our common stock.
Plan Category |
Number of Securities to be Issued upon Exercise of Outstanding Options, Warrants and Rights (a) |
Weighted Average Exercise Price of Outstanding Options, Warrants and Rights (b) |
Number of Securities Remaining Available for Future Issuances under Equity Compensation Plans (excluding securities in column (a)) (c) |
||||||
(In thousands, except per share amounts) |
|||||||||
Equity compensation plans approved by security holders(1) |
8,195 | $ | 6.32 | 6,779 | |||||
Equity compensation plans not approved by security holders |
— | — | — | ||||||
Total |
8,195 | $ | 6.32 | 6,779 | |||||
| (1) | The number of securities remaining available for future issuance in column (c) includes 6,401,000 shares of common stock authorized and available for issuance under our 2015 Equity Incentive Plan (“2015 Plan”) and 378,000 shares of common stock authorized and available for issuance under our 2007 Employee Stock Purchase Plan (“ESPP”). We have ceased grants under our 2007 Equity Incentive Plan (“2007 Plan”). The number of shares authorized for issuance under the ESPP is subject to an annual increase. The number of securities to be issued to participants in column (a) does not include shares of common stock to be issued to participants in consideration of aggregate participant contributions under the ESPP as of June 30, 2016. Restricted Stock Units and Awards have been excluded for purposes of computing weighted average exercise prices in column (b). |
| ITEM 6. | SELECTED CONSOLIDATED FINANCIAL DATA |
The following selected consolidated financial data should be read in connection with our consolidated financial statements and notes thereto and “Management’s Discussion and Analysis of Financial Condition and Results of Operations” included elsewhere in this Annual Report on Form 10-K. Our historical results are not necessarily indicative of the results to be expected in any future period.
Year Ended June 30, |
|||||||||||||||
2016 |
2015 |
2014 |
2013 |
2012(a) |
|||||||||||
(In thousands, except per share amounts) |
|||||||||||||||
Revenue: |
|||||||||||||||
Product |
$ | 158,232 | $ | 181,272 | $ | 184,952 | $ | 186,190 | $ | 182,009 | |||||
Hosted and related services |
126,670 | 105,381 | 87,635 | 68,844 | 15,466 | ||||||||||
Support and services |
75,382 | 73,017 | 65,712 | 57,076 | 49,076 | ||||||||||
Total revenue |
360,284 | 359,670 | 338,299 | 312,110 | 246,551 | ||||||||||
Cost of revenue: |
|||||||||||||||
Product(1) |
51,881 | 63,253 | 65,470 | 63,941 | 61,884 | ||||||||||
Hosted and related services(1) |
61,384 | 60,401 | 54,057 | 43,087 | 9,723 | ||||||||||
Support and services(1) |
19,199 | 17,453 | 16,866 | 16,624 | 16,465 | ||||||||||
Total cost of revenue |
132,464 | 141,107 | 136,393 | 123,652 | 88,072 | ||||||||||
Gross profit |
227,820 | 218,563 | 201,906 | 188,458 | 158,479 | ||||||||||
Operating expenses: |
|||||||||||||||
Research and development(1) |
60,509 | 53,352 | 49,758 | 52,992 | 51,909 | ||||||||||
Sales and marketing(1) |
126,123 | 118,931 | 110,977 | 120,222 | 94,797 | ||||||||||
General and administrative(1) |
41,778 | 39,778 | 40,356 | 38,102 | 27,468 | ||||||||||
Settlements and defense fees |
56 | 8,475 | — | — | — | ||||||||||
Acquisition-related costs |
1,489 | — | — | — | 4,524 | ||||||||||
Total operating expenses |
229,955 | 220,536 | 201,091 | 211,316 | 178,698 | ||||||||||
Income (loss) from operations |
(2,135 | ) |
(1,973 | ) |
815 | (22,858 | ) |
(20,219 | ) |
||||||
34
Year Ended June 30, |
|||||||||||||||
2016 |
2015 |
2014 |
2013 |
2012(a) |
|||||||||||
(In thousands, except per share amounts) |
|||||||||||||||
Other income (expense): |
|||||||||||||||
Interest expense |
(469 | ) |
(531 | ) |
(643 | ) |
(1,722 | ) |
(560 | ) |
|||||
Interest income and other (expense), net |
(1,628 | ) |
(939 | ) |
(637 | ) |
(690 | ) |
(905 | ) |
|||||
Total other income (expense) |
(2,097 | ) |
(1,470 | ) |
(1,280 | ) |
(2,412 | ) |
(1,465 | ) |
|||||
Loss before provision for (benefit from) income taxes |
(4,232 | ) |
(3,443 | ) |
(465 | ) |
(25,270 | ) |
(21,684 | ) |
|||||
Provision for (benefit from) income taxes |
560 | 961 | 586 | 426 | (947 | ) |
|||||||||
Net loss |
$ | (4,792 | ) |
$ | (4,404 | ) |
$ | (1,051 | ) |
$ | (25,696 | ) |
$ | (20,737 | ) |
Net loss per common share(2): |
|||||||||||||||
Basic and diluted |
$ | (0.07 | ) |
$ | (0.07 | ) |
$ | (0.02 | ) |
$ | (0.44 | ) |
$ | (0.41 | ) |
Shares used in computing net loss per share: |
|||||||||||||||
Basic and diluted |
66,405 | 63,953 | 61,191 | 58,633 | 50,591 | ||||||||||
| (a) | The fiscal year ended June 30, 2012 includes the impact of the acquisition of M5 Networks, Inc. (“M5”), which was completed on March 23, 2012. |
| (1) | Includes stock-based compensation expense as follows: |
Year Ended June 30, |
|||||||||||||||
2016 |
2015 |
2014 |
2013 |
2012 |
|||||||||||
(In thousands) |
|||||||||||||||
Cost of product revenue |
$ | 64 | $ | 74 | $ | 69 | $ | 110 | $ | 132 | |||||
Cost of hosted and related services |
1,272 | 1,215 | 626 | 188 | 37 | ||||||||||
Cost of support and services revenue |
590 | 497 | 569 | 760 | 836 | ||||||||||
Research and development |
1,854 | 1,928 | 1,704 | 2,789 | 3,614 | ||||||||||
Sales and marketing |
2,569 | 2,391 | 1,996 | 2,921 | 4,031 | ||||||||||
General and administrative |
2,522 | 2,308 | 2,352 | 3,837 | 3,993 | ||||||||||
Total stock-based compensation expense |
$ | 8,871 | $ | 8,413 | $ | 7,316 | $ | 10,605 | $ | 12,643 | |||||
| (2) | See Note 8 to the Consolidated Financial Statements in Item 8 for a description of the method used to compute basic and diluted net loss per share. |
As of June 30, |
|||||||||||||||
2016 |
2015 |
2014 |
2013 |
2012 |
|||||||||||
(In thousands) |
|||||||||||||||
Consolidated balance sheet data: |
|||||||||||||||
Cash, cash equivalents and short-term investments |
$ | 108,159 | $ | 90,187 | $ | 56,145 | $ | 51,276 | $ | 55,495 | |||||
Working capital |
52,033 | 44,394 | 25,643 | 26,568 | 31,421 | ||||||||||
Total assets |
342,338 | 326,456 | 306,949 | 301,307 | 303,234 | ||||||||||
Line of credit, net of debt issuance costs |
— | — | 29,004 | 19,946 | — | ||||||||||
Total stockholders’ equity |
202,729 | 190,128 | 177,384 | 156,146 | 170,232 | ||||||||||
35
| ITEM 7. | MANAGEMENT’S DISCUSSION AND ANALYSIS OF FINANCIAL CONDITION AND RESULTS OF OPERATIONS |
The following discussion and analysis of our financial condition and results of operations should be read in conjunction with the consolidated financial statements and related notes included elsewhere in this document. This discussion contains forward-looking statements that involve risks and uncertainties. Our actual results could differ materially from those discussed below. Factors that could cause or contribute to such differences include, but are not limited to, those identified below, and those discussed above in the section entitled “Risk Factors.” We report results on a fiscal year ending June 30. For ease of reference within this section, 2016 refers to the fiscal year ended June 30, 2016, 2015 refers to the fiscal year ended June 30, 2015, and 2014 refers to the fiscal year ended June 30, 2014.
Overview
ShoreTel is a leading provider of brilliantly simple business communication solutions. We focus on the small and medium sized businesses seeking a Unified Communications (“UC”) solution allowing them to communicate anytime, anyplace and through any device that they chose.
We provide this to the market via two solutions: ShoreTel Connect, our UC solution, and Contact Center offering and ShoreTel Summit, our platform for developers and integrators. ShoreTel Connect delivers a fully featured UC solution and applications such as mobility, collaboration, and workgroups. ShoreTel Connect is unique in that it offers three different delivery models including cloud, onsite and hybrid. Connect Cloud provides a hosted voice solution to our customers. Connect OnSite provides our customers the ability to independently own and operate their equipment. Connect Hybrid enables our customers to use both our cloud and onsite offerings while still delivering the same user experience and providing our customers increased choice and flexibility. Summit, our Communications Platform as a Service (“CPaaS”) offering, delivers the option to either deeply integrate communications into any application or workflow or to create a standalone business communications application.
We believe our solutions address changes in the UC market being driven by both technological advances and new workplace trends. We believe some of the current factors affecting the UC market include: the shift to consuming communications from the cloud, addressing an increasingly mobile workforce, the ongoing need for collaboration, a desire for multiple forms of communication and a need to integrate communications into workflows and applications. Our solutions are sold through our extensive network of over 1,200 authorized resellers and value-added distributors throughout the world served either by national distributors or by ShoreTel directly.
We were originally incorporated in California in September 1996 and reincorporated in Delaware in 2007. ShoreTel is based in Sunnyvale, California, and has regional offices in North America, Europe, Asia and Australia. Additionally, our cloud-based services are provided from multiple data centers located in the United States, the United Kingdom and Australia. While most of our customers are located in the United States, we have remained fairly consistent in revenue from international sales, which accounted for approximately 8% of our total revenue for fiscal 2016 as compared with 8% and 9% in fiscal 2015 and 2014, respectively. We expect sales to customers in the United States will continue to comprise the majority of our sales in the foreseeable future.
Key Business Metrics
We monitor a number of key metrics to help forecast growth, establish budgets, measure the effectiveness of our sales and marketing efforts and to measure operational effectiveness.
Deferred revenue. Deferred revenue relates to the timing of revenue recognition for specific transactions based on delivery of service, support, specific commitments, product and services delivered to our value-added distributors that have not been delivered or sold through to resellers, and other factors. Deferred revenue primarily consists of billings or payments received in advance of revenue recognition from our transactions and are recognized as the revenue recognition criteria are met. Nearly all of our premise system sales include the purchase of post-contractual support contracts with terms of up to five years, and our renewal rates on these contracts have been high historically. We recognize support revenue on a ratable basis over the term of the support contract. Since we receive payment for support in advance of recognizing the related revenue, we carry a deferred revenue balance on our consolidated balance sheet. Almost all of our hosted services are billed a month
36
in advance. Billings that are collected before the service is delivered are included in the deferred revenue balance on our consolidated balance sheet. These amounts are recognized as revenue as the services are delivered. Our deferred revenue balance at June 30, 2016 was $77.7 million, of which $56.8 million is expected to be recognized within one year.
Gross margin. Our gross margins for products are primarily affected by our ability to reduce hardware costs faster than the decline in average overall system sales prices. We strive to increase our product gross margin by reducing hardware costs through product redesign and volume discount pricing from our suppliers. In general, product gross margin on our switches is greater than product gross margin on our IP phones. We consider our ability to monitor and manage these factors to be a key aspect of maintaining product gross margins and increasing our profitability.
Gross margin for hosted and related services is lower than the gross margins for support and services and product and is impacted primarily by the reselling of broadband circuits to customers, employee-related expense, data communication cost, carrier cost, telecom taxes, and intangible asset amortization expense. We expect that with the growth in hosted and related services revenue, the gross margins may reflect improvement due to economies of scale, synergies and other cost reductions in our service delivery model.
Gross margin for support and services is impacted primarily by labor-related expenses. The primary goal of our support and services function is to ensure a high level of customer satisfaction and our investments in support personnel and infrastructure are made with this goal in mind. The timing of additional investments in our support and services infrastructure could materially affect our cost of support and services revenue, both in absolute dollars and as a percentage of support and services revenue and total revenue, in any particular period.
Operating expense. Our operating expenses are comprised primarily of compensation and benefits for our employees and related expenses such as travel. Accordingly, increases in operating expenses historically have been primarily related to increases in our headcount. We intend to expand our workforce as we grow, and therefore, our ability to forecast revenue is critical to managing our operating expenses.
Average revenue per user. We calculate the average monthly service revenue per user (“ARPU”) for our hosted and related services revenue as the average monthly revenue per customer divided by the average number of seats per customer. The average monthly revenue per customer is calculated as the monthly service revenue from customers in the period, divided by the simple average number of business customers during the period. Our ARPU includes telecommunication internet circuits that we resell that could, as a percentage of our business, decline over time as our average customer size increases and therefore they are more likely to have their own networks already established. Our monthly ARPU for the three-month period ended June 30, 2016, 2015 and 2014 was approximately $51, $54 and $55, respectively. The decrease in ARPU was primarily due to a greater number of volume discounts related to increased sales to larger enterprise customers and a decrease in the resale of internet circuits to new customers as compared to the existing customer base.
Revenue churn. Revenue churn for our hosted and related services revenue is calculated by dividing the monthly recurring revenue from customers that have terminated during a period by the simple average of the total monthly recurring revenue from all customers in a given period. The effective management of the revenue churn is critical to our ability to maximize revenue growth and to maintain and improve margins. Our annualized revenue churn for the three months ended June 30, 2016, 2015 and 2014 was approximately 6%, 4% and 5%, respectively.
Basis of Presentation
Revenue. We derive our revenue from sales of our premise IP telecommunications systems, hosted services and related support and services.
Product revenue. Product revenue consists of sales of our premise solution and telephones for our hosted IP telecommunication systems. Our typical system includes a combination of IP phones, switches and software applications primarily for our premise-based solutions. We sell our products through channel partners that include resellers and value-added distributors. Prices to a given channel partner for hardware and software products depend on that channel partner's volume and other criteria, as well as our own strategic considerations. Product revenue has accounted for 44%, 51%, and 55% of our total revenue for fiscal years 2016, 2015 and 2014, respectively.
37
Hosted and related services revenue. Hosted and related services and solutions consist primarily of our proprietary hosted VoIP Unified Communications solution as well as other services such as contact center, mobility, foreign and domestic calling plans, certain UC applications, internet service provisioning, regulatory and telecommunications fees, training and other professional services. Our hosted and related services are sold through indirect channel resellers and a direct sales force. Our customers enter into one to three-year service agreements whereby they are billed for such services on a monthly basis. Revenue from our hosted and related services is recognized on a monthly basis as services are delivered. Revenue associated with various calling plans and internet services are recognized as such services are provided. Hosted and related services revenues accounted for 35%, 29% and 26% of our total revenues for fiscal 2016, 2015 and 2014, respectively.
Support and services revenue. Support and services revenue primarily consists of post-contractual support, and to a lesser extent revenue from training services, professional services and premise-based installations that we perform. Post-contractual support includes software updates which grant rights to unspecified software license upgrades and maintenance releases issued during the support period. Post-contractual support also includes both Internet- and phone-based technical support. Revenue from post-contractual support is recognized ratably over the contractual service period. Support and services revenues accounted for 21%, 20% and 19% of our total revenue for fiscal 2016, 2015 and 2014, respectively.
Cost of revenue. Cost of product revenue consists primarily of hardware costs, royalties and license fees for third-party software included in our systems, salary and related overhead costs of operations personnel, freight, warranty costs and provision for excess inventory. The majority of these costs vary with the unit volumes of products sold. Cost of hosted and related services revenue consists of personnel and related costs of the hosted services, data center costs, data communication cost, costs of regulatory and telecommunications fees, carrier cost and amortization of intangible assets. Cost of support and services revenue consists of salary and related overhead costs of personnel engaged in support and service.
Research and development expenses. Research and development expenses primarily include personnel costs, outside engineering costs, professional services, prototype costs, test equipment, software usage fees and facilities expenses. Research and development expenses are recognized when incurred. We have capitalized development costs incurred from determination of technological feasibility through general release of the product to customers, although capitalized development costs historically have not been significant. We are devoting substantial resources to the development of additional functionality of our Connect solution, Summit Platform and the ongoing development of new product technologies and related software applications to support this solution. We intend to continue to make investments in our research and development efforts because we believe they are essential to maintaining and improving our competitive position.
Sales and marketing expenses. Sales and marketing expenses primarily include personnel costs, sales and partner commissions, travel, marketing promotional and lead generation programs, branding and advertising, trade shows, sales demonstration equipment, professional services fees, amortization of intangible assets, and facilities expenses. We plan to continue to invest in development of our distribution channel by increasing the size of our field sales force to enable us to expand into new geographies and further increase our sales to enterprise customers. We expect that sales and marketing expenses will be our largest operating expense category.
General and administrative expenses. General and administrative expenses primarily relate to our executive, finance, human resources, legal and information technology organizations. General and administrative expenses primarily consist of personnel costs, professional fees for legal, board of directors' costs, accounting, tax, compliance and information systems, travel, recruiting expense, depreciation expense and facilities expenses.
Settlements and defense fees. Settlements and defense fees relate to one-time charges related to probable and estimable settlement amounts and professional fees incurred in connection with an unsolicited acquisition proposal.
Acquisition-related costs. Acquisition-related costs relate to legal, accounting, consulting, investment banker fees and other costs directly related to acquisitions.
Interest expense. Interest expense primarily consists of interest expense associated with our credit facility.
Interest income and other (expense). Interest income and other (expense) primarily consists of interest earned on cash, cash equivalents and short-term investments, gains and losses on foreign currency translations and transactions as other miscellaneous items affecting our operating results.
38
Provision for income taxes. Provision for income taxes includes federal, state and foreign tax on our income as well as any adjustments made to our valuation allowance for deferred tax assets. Since our inception, we have accumulated substantial net operating loss and tax credit carryforwards. We account for income taxes under an asset and liability approach. Deferred income taxes reflect the impact of temporary differences between assets and liabilities recognized for financial reporting purposes and such amounts recognized for income tax reporting purposes, net operating loss carryforwards and other tax credits measured by applying current enacted tax laws. Valuation allowances are provided when necessary to reduce deferred tax assets to an amount that is more likely than not to be realized.
Results of Operations
The following table sets forth selected consolidated statements of operations data as a percentage of total revenue for each of the periods indicated.
Year Ended June 30, |
|||||||||
2016 |
2015 |
2014 |
|||||||
Revenue: |
|||||||||
Product |
44 | % |
51 | % |
55 | % |
|||
Hosted and related services |
35 | % |
29 | % |
26 | % |
|||
Support and services |
21 | % |
20 | % |
19 | % |
|||
Total revenue |
100 | % |
100 | % |
100 | % |
|||
Cost of revenue: |
|||||||||
Product |
15 | % |
17 | % |
19 | % |
|||
Hosted and related services |
17 | % |
17 | % |
16 | % |
|||
Support and services |
5 | % |
5 | % |
5 | % |
|||
Total cost of revenue |
37 | % |
39 | % |
40 | % |
|||
Gross profit |
63 | % |
61 | % |
60 | % |
|||
Operating expenses: |
|||||||||
Research and development |
17 | % |
15 | % |
15 | % |
|||
Sales and marketing |
35 | % |
33 | % |
33 | % |
|||
General and administrative |
12 | % |
11 | % |
12 | % |
|||
Settlements and defense fees |
— | 3 | % |
— | |||||
Acquisition-related costs |
— | — | — | ||||||
Total operating expenses |
64 | % |
62 | % |
60 | % |
|||
Income (loss) from operations |
(1 | )% |
(1 | )% |
— | ||||
Other income (expense): |
|||||||||
Interest expense |
— | — | — | ||||||
Interest income and other (expense), net |
— | — | — | ||||||
Total other income (expense) |
— | — | — | ||||||
Loss before provision for income taxes |
(1 | )% |
(1 | )% |
— | ||||
Provision for income taxes |
— | — | — | ||||||
Net loss |
(1 | )% |
(1 | )% |
— | % |
|||
Comparison of Fiscal 2016 to 2015 and Fiscal 2015 to 2014
Revenue
Year Ended |
|||||||||||||||||||||
June 30, 2016 |
June 30, 2015 |
June 30, 2014 |
June 30, 2016 to June 30, 2015 |
June 30, 2015 to June 30, 2014 |
|||||||||||||||||
Change $ |
Change % |
Change $ |
Change % |
||||||||||||||||||
(in thousands, except percentages) |
|||||||||||||||||||||
Product revenue |
$ | 158,232 | $ | 181,272 | $ | 184,952 | $ | (23,040 | ) |
(13 | %) |
$ | (3,680 | ) |
(2 | %) |
|||||
Hosted and related services revenue |
126,670 | 105,381 | 87,635 | 21,289 | 20 | % |
17,746 | 20 | % |
||||||||||||
Support and services revenue |
75,382 | 73,017 | 65,712 | 2,365 | 3 | % |
7,305 | 11 | % |
||||||||||||
Total revenue |
360,284 | 359,670 | 338,299 | 614 | — | 21,371 | 6 | % |
|||||||||||||
39
Total revenue increased by $0.6 million in fiscal 2016 as compared to fiscal 2015.
Total revenue increased by $21.4 million, or 6%, in fiscal 2015 as compared to fiscal 2014.
Revenue from customers in the United States accounted for approximately 92%, 92% and 91% of total revenue for years ended June 30, 2016, 2015 and 2014, respectively.
Product revenue
Product revenue decreased by $23.0 million, or 13%, in fiscal 2016 and $3.7 million, or 2%, in fiscal 2015 primarily due to a decline in new customer volume related to less overall demand in the premise-based solution market.
Hosted and Related Services revenue
Hosted and related service revenue increased by $21.3 million, or 20%, in fiscal 2016 as compared to in fiscal 2015. Hosted and related service revenue increased by $17.7 million, or 20%, in fiscal 2015 as compared to in fiscal 2014. The increase in hosted and related services revenue was primarily due to market growth enabling the expansion of our customer base resulting from sales to new customers and additional sales to existing customers.
Support and Services revenue
Support and services revenue increased by $2.4 million, or 3%, in fiscal 2016, as compared to fiscal 2015. Support and services revenue increased by $7.3 million, or 11%, in fiscal 2015 as compared to fiscal 2014. The increase in support and services revenue in both fiscal 2016 and 2015 was primarily due to additional sales to existing customers resulting in higher post-contractual support revenues supported by high renewal rates and continued expansion of our customer base resulting from sales to new customers who contract for support agreements.
Gross margin
Year Ended |
|||||||||||||||||||||
June 30, 2016 |
June 30, 2015 |
June 30, 2014 |
June 30, 2016 to June 30, 2015 |
June 30, 2015 to June 30, 2014 |
|||||||||||||||||
Change $ |
Change % |
Change $ |
Change % |
||||||||||||||||||
(in thousands, except percentages) |
|||||||||||||||||||||
Product cost of revenue |
$ | 51,881 | $ | 63,253 | $ | 65,470 | $ | (11,372 | ) |
(18 | %) |
$ | (2,217 | ) |
(3 | %) |
|||||
Hosted and related services cost of revenue |
61,384 | 60,401 | 54,057 | 983 | 2 | % |
6,344 | 12 | % |
||||||||||||
Support and services cost of revenue |
19,199 | 17,453 | 16,866 | 1,746 | 10 | % |
587 | 3 | % |
||||||||||||
Total cost of revenue |
$ | 132,464 | $ | 141,107 | $ | 136,393 | $ | (8,643 | ) |
(6 | %) |
$ | 4,714 | 3 | % |
||||||
Product gross profit |
$ | 106,351 | $ | 118,019 | $ | 119,482 | $ | (11,668 | ) |
(10 | %) |
$ | (1,463 | ) |
(1 | %) |
|||||
Hosted and related services gross profit |
65,286 | 44,980 | 33,578 | 20,306 | 45 | % |
11,402 | 34 | % |
||||||||||||
Support and services gross profit |
56,183 | 55,564 | 48,846 | 619 | 1 | % |
6,718 | 14 | % |
||||||||||||
Total gross profit |
$ | 227,820 | $ | 218,563 | $ | 201,906 | $ | 9,257 | 4 | % |
$ | 16,657 | 8 | % |
|||||||
40
Year Ended |
|||||||||||||||
June 30, 2016 |
June 30, 2015 |
June 30, 2014 |
June 30, 2016 to June 30, 2015 |
June 30, 2015 to June 30, 2014 |
|||||||||||
Net Change |
Net Change |
||||||||||||||
Product gross margin |
67 | % |
65 | % |
65 | % |
2 | % |
— | ||||||
Hosted and related services gross margin |
52 | % |
43 | % |
38 | % |
9 | % |
5 | % |
|||||
Support and services gross margin |
75 | % |
76 | % |
74 | % |
(1 | %) |
2 | % |
|||||
Total gross margin |
63 | % |
61 | % |
60 | % |
2 | % |
1 | % |
|||||
Total gross margin increased to 63% in fiscal 2016 as compared to 61% in fiscal 2015 and 60% in fiscal 2014. The increases in total gross margin were primarily due to the increase in hosted and related services gross margin.
Product gross margin
Product gross margins increased to 67% in fiscal 2016 as compared to 65% in fiscal 2015. This increase was primarily due to the recognition of a $1.0 million expense during fiscal 2015 representing settlement of a legal matter with no corresponding charge in fiscal 2016.
Product gross margins remained consistent at 65% in both fiscal 2015 and fiscal 2014.
Hosted and related services gross margin
Hosted and related service gross margins increased to 52% in fiscal 2016 as compared to 43% for fiscal 2015 and 38% for fiscal 2014. The increases from the prior periods were primarily due to operating efficiencies gained in our hosted business model as we have continued to expand our hosted revenue base while managing operational costs and also due to the release of $2.0 million in fiscal 2016 related to certain previously accrued surcharges as a result of favorable resolutions as well as reaching the statute of limitations in those jurisdictions.
Support and Services gross margin
Support and services gross margins remained relatively consistent at 75% in fiscal 2016 as compared to 76% in fiscal 2015.
Support and services gross margins increased to 76% in fiscal 2015 as compared to 74% in fiscal 2014. This increase was driven by operation improvements which allowed lower personnel costs to support a larger customer base and generate a higher revenue amount from the same period in each prior year, coupled with an increase in related revenue from our growing customer base.
Operating expenses
Year Ended |
|||||||||||||||||||||
June 30, 2016 |
June 30, 2015 |
June 30, 2014 |
June 30, 2016 to June 30, 2015 |
June 30, 2015 to June 30, 2014 |
|||||||||||||||||
Change $ |
Change % |
Change $ |
Change % |
||||||||||||||||||
(in thousands, except percentages) |
|||||||||||||||||||||
Research and development |
$ | 60,509 | $ | 53,352 | $ | 49,758 | $ | 7,157 | 13 | % |
$ | 3,594 | 7 | % |
|||||||
Sales and marketing |
126,123 | 118,931 | 110,977 | 7,192 | 6 | % |
7,954 | 7 | % |
||||||||||||
General and administration |
41,778 | 39,778 | 40,356 | 2,000 | 5 | % |
(578 | ) |
(1 | %) |
|||||||||||
Settlements and defense fees |
56 | 8,475 | — | (8,419 | ) |
(99 | %) |
8,475 | N/A |
||||||||||||
Acquisition-related costs |
1,489 | — | — | 1,489 | N/A |
— | N/A |
||||||||||||||
Research and development. Research and development expense increased by $7.2 million, or 13%, in fiscal 2016 compared to fiscal 2015. The increase in research and development expenses was primarily due to an increase of $6.8 million in personnel costs, including related benefits costs and an increase in the allocation of corporate expenses of $1.1 million. These increases primarily related to an increase in headcount of research and development personnel. The increase in headcount was in part due to the acquisition of Corvisa LLC (“Corvisa”) in January 2016. These increases were partially offset by a decrease in consulting and professional services of $0.9 million.
41
Research and development expense increased by $3.6 million, or 7%, in fiscal 2015 compared to fiscal 2014. The increase in research and development expenses was primarily due to an increase of $1.7 million in personnel costs, including related benefits costs as well as an increase of $0.6 million in consulting and professional services. The increase in personnel costs was primarily due to an increase in headcount during fiscal 2015, primarily in Bangalore, India.
Sales and marketing. Sales and marketing expenses increased by $7.2 million, or 6%, in fiscal 2016 compared to fiscal 2015. The increase in sales and marketing expenses from the prior period was primarily due to an increase in personnel costs, including related benefits, bonus and commissions, of $4.9 million primarily related to an increase in headcount, in part due to the acquisition of Corvisa, and increased demand generation, partner commissions and promotional activities of $2.5 million.
Sales and marketing expenses increased by $8.0 million, or 7%, in fiscal 2015 compared to fiscal 2014. The increase in sales and marketing expenses from the prior period was primarily due to increased demand generation, partner commissions and promotional activities of $5.6 million and an increase in personnel related costs including, benefits, bonus and commissions of $2.1 million primarily attributable to an increase in headcount during fiscal 2015.
General and administrative. General and administrative expenses increased by $2.0 million, or 5%, in fiscal 2016 compared to fiscal 2015. The increase in general and administrative expenses from the prior period was primarily due to an increase in personnel costs, including related benefits costs, of $3.2 million, partially offset by a decrease in information technology related project costs of $0.8 million.
General and administrative expenses decreased by $0.6 million, or 1%, in fiscal 2015 compared to fiscal 2014. The decrease in general and administrative expenses from the prior period was primarily due to a decrease in sales tax expense of $1.8 million, a decrease in facilities costs of $0.6 million, partially offset by an increase in consulting and professional services of $1.8 million.
Settlements and defense fees. Settlements and defense fees of $0.1 million for fiscal 2016 was comprised of $0.1 million related to tax amounts accrued on the amount recorded in fiscal 2015 related to the Internal Revenue Service proposed withholding tax adjustment for the 2008 through 2012 tax years.
Settlements and defense fees of $8.5 million for fiscal 2015 were comprised of $6.8 million related to a settlement on escrow claims related to the acquisition of M5 Networks, Inc. (“M5”), $1.1 million related to an Internal Revenue Service proposed withholding tax adjustment for the 2008 through 2012 tax years and $0.6 million in professional fees incurred in connection with an unsolicited acquisition proposal. The $6.8 million expense related to the settlement on escrow claims was comprised of a $3.6 million charge related to the impairment of the indemnification asset, a $2.5 million charge for professional fee reimbursement and a $0.7 million modification accounting charge related to the change in fair value of foregone stock per the Agreement and Plan of Reorganization between M5 and the Company. There were no corresponding charges for fiscal 2014.
Acquisition-related costs. Acquisition-related costs of $1.5 million for fiscal 2016 primarily consisted of direct costs incurred related to the acquisitions of M5 Networks Australia Pty Ltd (“M5 Australia”) and Corvisa. There were no corresponding costs for fiscal 2015 or 2014.
Other income (expense), net
Year Ended |
|||||||||||||||||||||
June 30, 2016 |
June 30, 2015 |
June 30, 2014 |
June 30, 2016 to June 30, 2015 |
June 30, 2015 to June 30, 2014 |
|||||||||||||||||
Change $ |
Change % |
Change $ |
Change % |
||||||||||||||||||
(in thousands, except percentages) |
|||||||||||||||||||||
Interest expense |
$ | (469 | ) |
$ | (531 | ) |
$ | (643 | ) |
(62 | ) |
(12 | %) |
$ | (112 | ) |
(17 | %) |
|||
Interest income and other (expense), net |
(1,628 | ) |
(939 | ) |
(637 | ) |
689 | 73 | % |
302 | 47 | % |
|||||||||
Interest expense. Interest expense remained relatively consistent at $0.5 million for both fiscal 2016 and 2015 and $0.6 million for fiscal 2014.
Interest income and other (expense), net. Interest income and other (expense), net increased by $0.7 million in fiscal 2016 as compared to fiscal 2015 primarily due to amortization expenses.
42
Interest income and other expense, net increased by $0.3 million in fiscal 2015 as compared to fiscal 2014 due to an increase in our foreign exchange loss due to the strengthening of the U.S. dollar against certain foreign currencies in which we transact.
Provision for income tax
Year Ended |
|||||||||||||||||||||
June 30, 2016 |
June 30, 2015 |
June 30, 2014 |
June 30, 2016 to June 30, 2015 |
June 30, 2015 to June 30, 2014 |
|||||||||||||||||
Change $ |
Change % |
Change $ |
Change % |
||||||||||||||||||
(in thousands, except percentages) |
|||||||||||||||||||||
Provision for income taxes |
$ | 560 | $ | 961 | $ | 586 | $ | (401 | ) |
(42 | %) |
$ | 375 | 64 | % |
||||||
Our effective tax rate differs from the statutory rate largely due to our providing a full valuation allowance on the current year net operating losses. The provision for income taxes in fiscal 2016, 2015 and 2014 was primarily related to state and foreign income tax expense.
Liquidity and Capital Resources
Cash and cash equivalents and investments
The following table summarizes our cash and cash equivalents and short-term investments (in thousands):
Year ended June 30, |
|||||||||
2016 |
2015 |
2014 |
|||||||
Cash and cash equivalents |
$ | 61,726 | $ | 82,162 | $ | 53,472 | |||
Short-term investments |
46,433 | 8,025 | 2,673 | ||||||
Total |
$ | 108,159 | $ | 90,187 | $ | 56,145 | |||
As of June 30, 2016, our principal sources of liquidity consisted of cash, cash equivalents and short-term investments of $108.2 million, net accounts receivable of $32.9 million and the balance available of $73.6 million for borrowing under our New Credit Facility (as defined below).
On October 22, 2014, we entered into an Amended and Restated Credit Agreement which was further amended on December 1, 2014 and August 5, 2015 (“New Credit Facility”) which provides for a revolving loan facility for an aggregate principal amount not exceeding $100.0 million. The New Credit Facility amended and restated the prior credit facility. The New Credit Facility matures on October 22, 2019 and is payable in full upon maturity. The amounts borrowed and repaid under the New Credit Facility are available for future borrowings.
The borrowings under the New Credit Facility accrue interest (at our election) either at (i) the London interbank offered rate then in effect, plus a margin of between 1.50% and 2.25%, which is based on our consolidated EBITDA (as defined in the New Credit Facility), or (ii) the higher of (a) the bank’s publicly-announced prime rate then in effect and (b) the federal funds rate plus 0.50%, in each case of (a) or (b), plus a margin of between 0.00% and 0.50%, which will be based upon our consolidated EBITDA. We also pay commitment fees during the term of the New Credit Facility which varies depending on our consolidated EBITDA. The New Credit Facility is secured by substantially all of our assets.
The New Credit Facility contains customary affirmative and negative covenants, including compliance with financial ratios and metrics. The New Credit Facility and the related amendment requires us to maintain a minimum ratio of liquidity to its indebtedness (each as defined in the New Credit Facility) and varying amounts of Liquidity and Consolidated EBITDA specified in the New Credit Facility throughout the term of the agreement. As of June 30, 2016, we were in compliance with all such covenants and no amounts were outstanding under the New Credit Facility.
Historically, our principal uses of cash have consisted of the purchase of finished goods inventory from our contract manufacturers, payroll and other operating expenses related to the development and marketing of our new products, purchases of property and equipment and acquisitions.
Our future capital requirements will depend on many factors, including our rate of revenue growth, the expansion of our sales and marketing activities, the addition of new business initiatives, the timing and extent of
43
our expansion into new geographies, the timing of introductions of new products and enhancements to existing products, the continuing market acceptance of our products, common stock repurchases and acquisition and licensing activities. We may enter into agreements relating to potential investments in, or acquisitions of, complementary businesses or technologies in the future, which could also require us to seek additional equity or debt financing. If needed, additional funds may not be available on terms favorable to us or at all. We believe that the available amounts under the line of credit together with our cash flows from our operations will be sufficient to fund our operating requirements for at least the next twelve months.
The following table shows our cash flows from operating activities, investing activities and financing activities for the stated periods:
June 30, |
|||||||||
2016 |
2015 |
2014 |
|||||||
(In thousands) |
|||||||||
Cash provided by operating activities |
$ | 35,086 | $ | 41,145 | $ | 35,878 | |||
Cash used in investing activities |
$ | (63,693 | ) |
$ | (19,504 | ) |
$ | (6,972 | ) |
Cash provided by (used in) financing activities |
$ | 8,171 | $ | 7,049 | $ | (19,209 | ) |
||
Cash flows from operating activities
Net loss during fiscal 2016, 2015 and 2014 included non-cash charges of $8.9 million, $8.4 million and $7.3 million in stock-based compensation expense, respectively, and depreciation and amortization of $20.5 million, $19.1 million and $18.3 million, respectively. Net loss during fiscal 2015 included a charge related to the impairment of the indemnification asset of $3.6 million with no corresponding charge in the fiscal 2016 or fiscal 2014.
Cash provided by operating activities of $35.1 million during fiscal 2016 also reflects net changes in operating assets and liabilities, which provided $10.0 million of cash consisting primarily of an increase in deferred revenue of $6.1 million, an increase in accrued employee compensation of $3.1 million, a decrease in accounts receivable of $3.7 million, a decrease in inventory of $2.9 million and a decrease in prepaid expenses and other current assets of $2.1 million. These cash inflows were offset by a decrease in accrued taxes and surcharges of $6.0 million, a decrease in accrued liabilities and other of $1.2 million, and a decrease in accounts payable of $0.7 million.
Cash provided by operating activities of $41.1 million during fiscal 2015 also reflects net changes in operating assets and liabilities, which provided $13.4 million of cash consisting primarily of a decrease in inventory of $11.4 million, a decrease in indemnification asset of $2.0 million, an increase in accrued liabilities and other of $7.7 million and an increase in deferred revenue of $3.8 million. These cash inflows were partially offset by an increase in prepaid expenses of $4.2 million, an increase in accounts receivable of $2.9 million, a decrease in accrued taxes and surcharges of $2.3 million, a decrease in accrued employee compensation of $1.2 million and a decrease in accounts payable of $0.8 million.
Cash provided by operating activities of $35.9 million during fiscal 2014 also reflects net changes in operating assets and liabilities, which provided $10.4 million of cash consisting primarily of an increase in deferred revenue of $11.0 million, an increase in accounts payable of $6.2 million, an increase in accrued employee compensation of $3.4 million, a decrease in accounts receivable of $3.2 million, an increase in accrued taxes and surcharges of $0.9 million and a decrease in indemnification asset of $0.7 million. These cash inflows were offset by an increase in inventory of $7.5 million, a decrease in accrued liabilities and other of $4.1 million, an increase in prepaid expenses and other current assets of $2.1 million and an increase in other assets of $0.8 million.
Cash flows from investing activities
We have classified our investment portfolio as available for sale and our investments are made with a policy of capital preservation and liquidity as the primary objectives. We may hold investments to maturity; however, we may sell an investment at any time if the quality rating of the investment declines, the yield on the investment is no longer attractive or we are in need of cash. Because we invest only in investment securities that are highly liquid with a ready market, we believe that the purchase, maturity or sale of our investments has no material impact to our overall liquidity.
44
Net cash flow used in investing activities in fiscal 2016 was $63.7 million and primarily consisted of $48.2 million used to purchase investment securities, the acquisition of Corvisa and M5 Australia for $14.3 million, net of cash acquired and $10.8 million used to purchase property and equipment, partially offset by maturities of short-term investments of $9.7 million.
Net cash flow used in investing activities in fiscal 2015 was $19.5 million and primarily consisted of $12.2 million used to purchase investment securities, $11.4 million used to purchase property and equipment and $1.7 million used to purchase patents, technology and internally developed software, partially offset by maturities of short-term investments of $5.8 million.
Net cash flow used in investing activities in fiscal 2014 was $7.0 million and primarily consisted of $11.7 million used to purchase property and equipment and $0.9 million used to purchase investments securities, partially offset by maturities of short-term investments of $5.6 million.
Cash flows from financing activities
Net cash provided by financing activities was $8.2 million in fiscal 2016. In fiscal 2016, we received proceeds of $10.6 million from the issuance of common stock under various equity incentive plans, offset by the payment of $1.3 million for employee tax obligations associated with the vesting of restricted stock units. In addition, we repurchased $0.8 million of common stock during fiscal 2016.
Net cash provided by financing activities was $7.0 million in fiscal 2015. In fiscal 2015, we received proceeds of $9.3 million from the issuance of common stock under various equity incentive plans, offset by the payment of $1.2 million for employee tax obligations associated with the vesting of restricted stock units.
Net cash used by financing activities was $19.2 million in fiscal 2014. In fiscal 2014, we repaid $29.3 million for borrowings made under our previous Credit Facility, payments of $3.4 million of contingent purchase consideration in January 2014 pursuant to our acquisition of M5 and paid $0.9 million for employee tax obligations associated with the vesting of restricted stock units and paid $1.5 million in relation to our capital leases. These payments were partially offset by proceeds received of $15.8 million from the issuance of common stock under various employee benefit plans.
Common Stock Repurchases
In May 2016, the Board of Directors authorized the repurchase of up to $20.0 million of the Company's common stock from time to time at the discretion of our management. This stock repurchase authorization has no expiration date. During fiscal 2016, we repurchased approximately 126,000 shares of our common stock at a total cost of $0.8 million. As of June 30, 2016, we had a remaining authorization of $19.2 million for future share repurchases.
Contractual Obligations
The following is a summary of our contractual obligations as of June 30, 2016:
Payments Due by Period |
|||||||||||||||
(In thousands) |
Total |
Less Than 1 Year |
1-3 Years |
3-5 Years |
More than 5 Years |
||||||||||
Operating lease obligations |
$ | 27,476 | $ | 7,744 | $ | 12,038 | $ | 7,224 | $ | 470 | |||||
Line of credit |
— | — | — | — | — | ||||||||||
Non-cancellable purchase commitments (inventory and software licenses) |
15,395 | 14,945 | 441 | 9 | — | ||||||||||
Outstanding letters of credit |
635 | 635 | — | — | — | ||||||||||
Total |
$ | 43,506 | $ | 23,324 | $ | 12,479 | $ | 7,233 | $ | 470 | |||||
We contract with independent sources to manufacture our products and purchase components from a variety of suppliers. During the normal course of business, in order to manage future demand for our products and to ensure adequate component supply, we enter into agreements with manufacturers and suppliers which allow us to procure inventory based upon criteria and timing that we define. Certain of these purchase commitments are non-cancelable and unconditional commitments. In certain instances, these agreements allow us the option to cancel, reschedule, and adjust our requirements based on our business needs prior to firm orders being placed.
45
In addition to our contractual obligations noted above, we have a contractual obligation related to unrecognized tax benefits of approximately $6.3 million as of June 30, 2016.
Off-Balance Sheet Arrangements
We do not have any material off-balance sheet arrangements (other than those disclosed above within Contractual Obligations) nor do we have any material relationships with unconsolidated entities or financial partnerships, such as entities often referred to as structured finance or special purpose entities, which are established for the purpose of facilitating off-balance sheet arrangements or other contractually narrow or limited purposes.
Critical Accounting Policies and Estimates
Our consolidated financial statements are prepared in accordance with U.S. Generally Accepted Accounting Principles. These accounting principles require us to make certain estimates and judgments that can affect the reported amounts of assets and liabilities as of the dates of the consolidated financial statements, the disclosure of contingencies as of the dates of the consolidated financial statements, and the reported amounts of revenue and expenses during the periods presented. Although we believe that our judgments and estimates are reasonable under the circumstances, actual results may differ from those estimates.
We believe the following to be our critical accounting policies because they are important to the portrayal of our financial condition and results of operations and they require critical management judgments and estimates about matters that are uncertain:
| • | Revenue recognition; |
| • | Stock-based compensation; |
| • | Goodwill and purchased-intangible assets; and |
| • | Accounting for income and telecom taxes. |
If actual results or events differ materially from those contemplated by us in making these estimates, our reported financial condition and results of operations for future periods could be materially affected. See “Risk Factors” for certain matters that may affect our future financial condition or results of operations.
Revenue Recognition
We derive our revenue from the sale of hosted and premise based Unified Communication systems and services.
When a sales arrangement contains multiple elements, such as hardware and software products and/or services, we allocate revenue to each element based on relative selling prices. The relative selling price is determined using vendor specific objective evidence of fair value (“VSOE”) when available. When VSOE cannot be established, the Company attempts to determine the third party evidence of selling price (“TPE”) for the deliverables. TPE is determined based on competitor prices for similar deliverables when sold separately by the competitors. Generally, our product offerings differ from those of our competitors and comparable pricing of our competitors is often not available. Therefore, we are typically not able to determine TPE. When we are unable to establish selling price using VSOE or TPE, we use estimated selling prices (“ESP”) in our allocation of arrangement fees. The ESP for a deliverable is determined as the price at which we would transact if the products or services were sold on a stand-alone basis.
Product and Support and services revenues:
The sale of IP telecommunication systems include hardware, primarily phones and voice switches, software components and may also include training, installation, professional services and post-contractual support for the products. Our business strategy is centered on selling to enterprise customers through channel partners rather than directly. Sales to value-added distributors allow us to leverage our existing distribution infrastructure and sales personnel.
The typical system includes a combination of IP phones, switches and software applications. For sales transactions made both directly and to resellers, revenue is recognized at the time of shipment provided that all
46
the provisions of revenue recognition have been met. For sales to value-added distributors, revenue is initially deferred and is recognized at the time of sale by the distributor to their customer, provided all the provisions of revenue recognition have been met. We refer to this distribution approach as two-tier distribution model and the recognition of revenue at the time of sale by the distributor as the sell through method.
We recognize revenue when persuasive evidence of an arrangement exists, product has shipped or delivery has occurred (depending on when title passes), the sales price is fixed or determinable and free of contingencies and significant uncertainties, and collection is probable. The fee is considered fixed or determinable at the execution of an agreement, based on specific products and quantities to be delivered at specified prices. The agreements with reseller partners generally do not include rights of return or acceptance provisions. Even though substantially all of the contractual agreements do not provide return privileges, there are circumstances for which we will accept a return. We maintain a reserve for such returns based on historical experience with reseller partners. The agreements with our value-added distributors allow for limited rights of return of products generally purchased within the previous 90 days. In addition to such return rights, we generally offer price protection provisions to our distributors when there is a permanent reduction of our sales prices. In such cases, we are obligated to grant the distributor a credit for the difference between the change in the aggregate price of any amounts that have been purchased but unsold by the distributor as of the effective date of such decrease. In addition, certain of our distributors stock phones and switches and purchase licenses only upon sale to a value added reseller or end customer. Revenue is deferred for distributors until the distributor sells the hardware and license to their customer which would constitute a complete configuration of our system. To the extent that our agreements contain acceptance terms, we recognize revenue upon product acceptance, unless the acceptance provision is deemed to be perfunctory. Payment terms to customers generally range from net 30 to net 60 days. In the event payment terms are extended materially from the Company’s standard business practices, the fees are deemed to not be fixed or determinable and revenue is recognized when the payment becomes due. We assess the ability to collect from our customers based on a number of factors, including credit worthiness and past transaction history of the customer. If the customer is not deemed credit worthy, we defer all revenue from the arrangement until payment is received and all other revenue recognition criteria have been met. Shipping charges billed to customers are included in product revenue and the related shipping costs are included in cost of product revenue. Provisions for return allowances and product warranties are recorded at the time revenue is recognized based on our historical experience. The provision for return allowances is recorded as a reduction to revenues on the statement of operations and is included as a reduction to accounts receivable on the balance sheet.
Most of the products and services included in a system qualify as separate units of accounting. Many of our products have both software and non-software components that function together to deliver the essential functionality of the integrated system product. We analyze all of our software and non-software products and services and consider the features and functionalities of the individual elements and the stand alone sales of those individual components among other factors, to determine which elements are essential or non-essential to the overall functionality of the integrated system product. We recognize revenue related to installation services and training upon delivery of the service.
Our core software, which we refer to as “essential software,” is integrated with hardware and is essential to the functionality of the integrated system product. We also sell additional software which provides increased features and functions, but is not essential to the overall functionality of the integrated system products, which we refer to as “non-essential software.” At the initial purchase, the customer generally bundles together the hardware, essential software, non-essential software, as needed, and up to five years of post-contractual support. Thereafter, if the enterprise customer increases end users and functionality, it may add more hardware, both essential and non-essential software components, and related post-contractual support by purchasing them separately.
The revenue for these multiple element arrangements is allocated to the non-essential software deliverables and the non-software deliverables based on the relative selling prices of all of the deliverables in the arrangement using the hierarchy in the revenue accounting guidance. The non-essential software deliverables included in a multiple element arrangement are subject to the industry specific software revenue recognition guidance. The relative selling price is determined using vendor specific objective evidence of fair value (“VSOE”) when available. As we have not been able to obtain VSOE for all of the non-essential software deliverables in the arrangement, revenue allocated to the delivered non-essential software elements is recognized using the residual
47
method in accordance with industry specific software revenue recognition guidance. Under the residual method, the amount of revenue recognized for the delivered non-essential software elements equaled the total allocated consideration less the VSOE of any undelivered elements bundled with such non-essential software elements.
We have been able to establish VSOE for our professional and post contractual support services mainly based on the volume and the pricing of the stand-alone sales for these services within a narrow range. We establish our estimated selling price (“ESP”) for products by considering factors including, but not limited to, geographies, customer segments and pricing practices. The determination of ESP is made through consultation with and formal approval by our management. We regularly review VSOE, the third party evidence of selling price and ESP and maintain internal controls over the establishment and updates of these estimates.
Hosted and related services revenues:
Our hosted and related services and solutions consist primarily of our proprietary hosted VoIP Unified Communications system as well as other services such as minutes usage from foreign and domestic calling plans, certain Unified Communications applications, Internet service provisioning, training and other professional services. Additionally, we offer our customers the ability to purchase phones from us directly or rent such phones as part of their service agreements. Customers are not required to purchase phones from us directly as they can independently purchase such equipment. Our customers typically enter into a 12-month service agreement whereby they are billed for such services on a monthly basis.
Monthly recurring hosted services are recognized in the period when the service is delivered. The installation fees are recognized on a straight-line basis over the estimated customer life.
We bill most of the monthly recurring hosted service revenue a month in advance. Any amounts billed and collected, but for which the service is not yet delivered, are included in deferred revenue. These amounts are recognized as revenues only when the service is delivered.
We maintain a reserve for credits provided to customers for outages, quality issues, billing disputes or changes in the service levels that are included in the amounts that were billed in advance. The reserve for such credits is based on historical experiences and trends. We also maintain a reserve for amounts that are deemed as uncollectible.
Stock-Based Compensation
We measure all share-based payments to employees based on the grant date fair value of the awards and recognize these amounts in our consolidated statement of operations over the period during which the employee is required to perform services in exchange for the award (generally over the vesting period of the award). We amortize the fair value of share-based payments on a straight-line basis. Income tax benefits realized upon exercise or vesting of an award in excess of that previously recognized in earnings are presented in the consolidated statements of cash flows as a financing activity when applicable.
Stock-based compensation expense recognized in the consolidated statements of operations has been reduced for forfeitures since it is based on awards ultimately expected to vest. If factors change and we employ different assumptions in the application of our option-pricing model in future periods or if we experience different forfeiture rates, the compensation expense that is derived may differ significantly from what we have recorded in the current year.
Goodwill and Purchased-Intangible Assets
Goodwill is tested for impairment on an annual basis on June 30th and when specific circumstances dictate between annual tests. When impaired, the carrying value of goodwill is written down to fair value. The goodwill impairment test involves a two-step process. The first step, identifying a potential impairment, compares the fair value of a reporting unit with its carrying amount, including goodwill. If the carrying value of the reporting unit exceeds its fair value, the second step would need to be conducted; otherwise, no further steps are necessary as no potential impairment exists. The second step, measuring the impairment loss, compares the implied fair value of the reporting unit goodwill with the carrying amount of that goodwill. Any excess of the reporting unit goodwill carrying value over the respective implied fair value is recognized as an impairment loss. There was no impairment of goodwill identified in fiscal 2016, 2015, or 2014. The fair value of our single reporting unit was significantly in excess of the carrying value, which includes goodwill.
48
Purchased-intangible assets are amortized on a straight-line basis over the periods of benefit, ranging from two to eight years. We perform a review of purchased-intangible assets whenever events or changes in circumstances indicate that the useful life is shorter than we had originally estimated or that the carrying amount of assets may not be recoverable. If such facts and circumstances exist, we assess the recoverability of purchased-intangible assets by comparing the projected undiscounted net cash flows associated with the related asset or group of assets over their remaining lives against their respective carrying amounts. Impairments, if any, are based on the excess of the carrying amount over the fair value of those assets. If the useful life of the asset is shorter than originally estimated, we accelerate the rate of amortization and amortize the remaining carrying value over the new shorter useful life. There were no indicators of impairment of purchased-intangible assets identified in fiscal 2016, 2015, or 2014.
Accounting for Income and Telecom Taxes
We account for income taxes using the asset and liability method of accounting for income taxes. Deferred income taxes are recognized by applying enacted statutory tax rates applicable to future years to differences between the financial statement carrying amounts of existing assets and liabilities and their respective tax bases and operating loss and tax credit carryforwards. The effect on deferred tax assets and liabilities of a change in tax rates is recognized in income in the period that includes the enactment date. The measurement of deferred tax assets is reduced, if necessary, by a valuation allowance for any tax benefit of which future realization is uncertain.
In assessing the realization of deferred tax assets, management considers whether it is more likely than not that some portion or all of deferred tax assets will not be realized. The realization of deferred tax assets is based on several factors, including our past earnings and the scheduling of deferred taxes and projected income from operating activities. As of June 30, 2016, we do not believe it is more likely than not that the deferred tax assets relating to U.S. federal and state operations are realizable. We intend to maintain the valuation allowance until sufficient positive evidence exists to support reversal of some or all of the valuation allowance. Our income tax benefit recorded in the future will be reduced or increased in the event changes to the valuation allowance are required.
We had federal net operating loss carryforwards of approximately $93.9 million as of June 30, 2016, which expire at various dates between 2023 and 2036. These net operating loss carryforwards include the effects of a favorable tax ruling determined under Section 382 by the Internal Revenue Service in March 2010 as well as federal net operating loss carryforwards available from prior acquisitions. We have not completed Section 382 studies for net operating losses incurred in the years subsequent to July 2007. Upon the completion of these studies, the amount of net operating losses available for utilization may be limited.
As a provider of communication services, we assess whether to include the taxes and surcharges collected from customers and remitted to government authorities, including Universal Service Fund charges, sales, use, and various surcharges, in our revenues and expenses. This assessment includes whether we are the primary obligor or principal taxpayer for the taxes assessed in each jurisdiction where we do business. In jurisdictions where we determine that we are the principal taxpayer, we record the surcharges within our revenues and cost of hosted and related services. In jurisdictions where we determine that we are merely a collection agent for the government authority, we do not include them in our revenues or cost of hosted and related services.
Recent Accounting Pronouncements
Refer to Note 1 to the Consolidated Financial Statements in Item 8 for a discussion of the expected impact of recently issued accounting pronouncements.
| ITEM 7A. | QUANTITATIVE AND QUALITATIVE DISCLOSURES ABOUT MARKET RISK |
Market Risk
Market risk is the potential loss arising from adverse changes in market rates and prices, such as foreign currency exchange and interest rates. We do not enter into derivatives or other financial instruments for trading or speculative purposes. In the normal course of our business, we are exposed to foreign currency exchange rate risk inherent in conducting business globally in foreign currencies. We are primarily exposed to foreign currency fluctuations related to collections from accounts receivable balances and cash in banks that are denominated in
49
Australian dollar, British pound, Canadian dollar and the Euro. During the years ending June 30, 2016 and 2015, we used derivative instruments to reduce the volatility of earnings associated with changes in foreign currency exchange rates. We used foreign exchange forward contracts to mitigate the gains and losses generated from the re-measurement of certain foreign monetary assets and liabilities, primarily including cash balances, third party accounts receivable and intercompany transactions recorded on the balance sheet. These derivatives are not designated and do not qualify as hedge instruments. Accordingly, changes in the fair value of these instruments are recognized in other income and expenses during the period of change. As of June 30, 2016 a 10% change in the applicable foreign exchange rates would result in an approximately $0.6 million increase or decrease in our pretax earnings.
In addition, we currently hold our investment portfolio in accounts with two financial firms. If these firms were to experience financial or other regulatory difficulties, it might be difficult for us to access our investments in a timely manner.
Interest Rate Risk
Our exposure to the interest rate risk due to changes in the general level of United States interest rates is due to both our cash equivalents and short term investments and our indebtedness. We maintain an investment portfolio of various holdings, types, and maturities. These securities are generally classified as available for sale and consequently, are recorded on the balance sheet at fair value with unrealized gains and losses reported as a separate component of accumulated other comprehensive income (loss). At any time, a sharp rise in interest rates could have a material adverse impact on the fair value of our investment portfolio. Conversely, declines in interest rates could have a material positive impact on interest earnings for our portfolio. The following table presents the hypothetical change in fair values in the financial instruments we held at June 30, 2016 that are sensitive to changes in interest rates. The modeling technique used measures the change in fair values arising from selected potential changes in interest rates on our investment portfolio, which had a fair value of $50.0 million at June 30, 2016. Market changes reflect immediate hypothetical parallel shifts in the yield curve of plus or minus 100, 50 and 25 basis points.
Decrease in interest rates |
Increase in interest rates |
|||||||||||||||||
(in thousands) |
-100 BPS |
-50 BPS |
-25 BPS |
25 BPS |
50 BPS |
100 BPS |
||||||||||||
Total fair market value |
$ | 50,357 | $ | 50,161 | $ | 50,063 | $ | 49,867 | $ | 49,868 | $ | 49,573 | ||||||
Percentage change in fair market value |
0.8 | % |
0.4 | % |
0.2 | % |
-0.2 | % |
-0.4 | % |
-0.8 | % |
||||||
50
| ITEM 8. | FINANCIAL STATEMENTS AND SUPPLEMENTARY DATA |
SHORETEL, INC. AND SUBSIDIARIES
INDEX TO CONSOLIDATED FINANCIAL STATEMENTS
Page |
|||
51
REPORT OF INDEPENDENT REGISTERED PUBLIC ACCOUNTING FIRM
To the Board of Directors and Stockholders of
ShoreTel, Inc.
Sunnyvale, California
We have audited the accompanying consolidated balance sheets of ShoreTel, Inc. and subsidiaries (the “Company”) as of June 30, 2016 and 2015, and the related consolidated statements of operations, comprehensive loss, stockholders’ equity, and cash flows for each of the three years in the period ended June 30, 2016. These consolidated financial statements are the responsibility of the Company's management. Our responsibility is to express an opinion on these consolidated financial statements based on our audits.
We conducted our audits in accordance with the standards of the Public Company Accounting Oversight Board (United States). Those standards require that we plan and perform the audit to obtain reasonable assurance about whether the financial statements are free of material misstatement. An audit includes examining, on a test basis, evidence supporting the amounts and disclosures in the financial statements. An audit also includes assessing the accounting principles used and significant estimates made by management, as well as evaluating the overall financial statement presentation. We believe that our audits provide a reasonable basis for our opinion.
In our opinion, such consolidated financial statements present fairly, in all material respects, the financial position of ShoreTel, Inc. and subsidiaries as of June 30, 2016 and 2015, and the results of their operations and their cash flows for each of the three years in the period ended June 30, 2016, in conformity with accounting principles generally accepted in the United States of America.
We have also audited, in accordance with the standards of the Public Company Accounting Oversight Board (United States), the Company's internal control over financial reporting as of June 30, 2016, based on the criteria established in Internal Control — Integrated Framework (2013) issued by the Committee of Sponsoring Organizations of the Treadway Commission and our report dated September 12, 2016 expressed an unqualified opinion on the Company's internal control over financial reporting.
/s/ DELOITTE & TOUCHE LLP
San Jose, California
September 12, 2016
52
SHORETEL, INC. AND SUBSIDIARIES
CONSOLIDATED BALANCE SHEETS
(Amounts in thousands, except per share amounts)
June 30, |
||||||
2016 |
2015 |
|||||
ASSETS |
||||||
Current assets: |
||||||
Cash and cash equivalents |
$ | 61,726 | $ | 82,162 | ||
Short-term investments |
46,433 | 8,025 | ||||
Accounts receivable, net of allowances of $678 and $631 as of June 30, 2016 and 2015, respectively |
32,902 | 36,494 | ||||
Inventories |
12,488 | 15,053 | ||||
Prepaid expenses and other current assets |
13,420 | 14,315 | ||||
Total current assets |
166,969 | 156,049 | ||||
Property and equipment - net |
21,551 | 20,419 | ||||
Goodwill |
129,449 | 122,750 | ||||
Intangible assets - net |
18,788 | 22,217 | ||||
Other assets |
5,581 | 5,021 | ||||
Total assets |
$ | 342,338 | $ | 326,456 | ||
LIABILITIES AND STOCKHOLDERS’ EQUITY |
||||||
Current liabilities: |
||||||
Accounts payable |
$ | 14,932 | $ | 16,452 | ||
Accrued liabilities and other |
20,397 | 19,374 | ||||
Accrued employee compensation |
18,925 | 15,311 | ||||
Accrued taxes and surcharges |
3,917 | 9,902 | ||||
Deferred revenue |
56,765 | 50,616 | ||||
Total current liabilities |
114,936 | 111,655 | ||||
Long-term deferred revenue |
20,940 | 20,659 | ||||
Other long-term liabilities |
3,733 | 4,014 | ||||
Total liabilities |
139,609 | 136,328 | ||||
Commitments and contingencies (Note 13) |
||||||
Stockholders’ equity: |
||||||
Preferred stock, par value $.001 per share, authorized 5,000 shares; none issued and outstanding |
— | — | ||||
Common stock and additional paid-in capital, par value $.001 per share, authorized 500,000; 67,517 shares issued and 67,391 shares outstanding as of June 30, 2016 and 65,055 shares issued and outstanding as of June 30, 2015 |
379,871 | 361,691 | ||||
Treasury stock, at cost |
(819 | ) |
— | |||
Accumulated other comprehensive income |
36 | 4 | ||||
Accumulated deficit |
(176,359 | ) |
(171,567 | ) |
||
Total stockholders’ equity |
202,729 | 190,128 | ||||
Total liabilities and stockholders’ equity |
$ | 342,338 | $ | 326,456 | ||
See notes to consolidated financial statements
53
SHORETEL, INC. AND SUBSIDIARIES
CONSOLIDATED STATEMENTS OF OPERATIONS
Year Ended June 30, |
|||||||||
2016 |
2015 |
2014 |
|||||||
(Amounts in thousands, except per share amounts) |
|||||||||
Revenue: |
|||||||||
Product |
$ | 158,232 | $ | 181,272 | $ | 184,952 | |||
Hosted and related services |
126,670 | 105,381 | 87,635 | ||||||
Support and services |
75,382 | 73,017 | 65,712 | ||||||
Total revenue |
360,284 | 359,670 | 338,299 | ||||||
Cost of revenue: |
|||||||||
Product |
51,881 | 63,253 | 65,470 | ||||||
Hosted and related services |
61,384 | 60,401 | 54,057 | ||||||
Support and services |
19,199 | 17,453 | 16,866 | ||||||
Total cost of revenue |
132,464 | 141,107 | 136,393 | ||||||
Gross profit |
227,820 | 218,563 | 201,906 | ||||||
Operating expenses: |
|||||||||
Research and development |
60,509 | 53,352 | 49,758 | ||||||
Sales and marketing |
126,123 | 118,931 | 110,977 | ||||||
General and administrative |
41,778 | 39,778 | 40,356 | ||||||
Settlements and defense fees |
56 | 8,475 | — | ||||||
Acquisition-related costs |
1,489 | — | — | ||||||
Total operating expenses |
229,955 | 220,536 | 201,091 | ||||||
Income (loss) from operations |
(2,135 | ) |
(1,973 | ) |
815 | ||||
Other income (expense): |
|||||||||
Interest expense |
(469 | ) |
(531 | ) |
(643 | ) |
|||
Interest income and other (expense), net |
(1,628 | ) |
(939 | ) |
(637 | ) |
|||
Total other income (expense) |
(2,097 | ) |
(1,470 | ) |
(1,280 | ) |
|||
Loss before provision for income tax |
(4,232 | ) |
(3,443 | ) |
(465 | ) |
|||
Provision for income taxes |
560 | 961 | 586 | ||||||
Net loss |
$ | (4,792 | ) |
$ | (4,404 | ) |
$ | (1,051 | ) |
Net loss per common share, basic and diluted |
$ | (0.07 | ) |
$ | (0.07 | ) |
$ | (0.02 | ) |
Shares used in computing net loss per common share, basic and diluted |
66,405 | 63,953 | 61,191 | ||||||
See notes to consolidated financial statements
54
SHORETEL, INC. AND SUBSIDIARIES
CONSOLIDATED STATEMENTS OF COMPREHENSIVE LOSS
Year Ended June 30, |
|||||||||
2016 |
2015 |
2014 |
|||||||
(In thousands) |
|||||||||
Net loss |
$ | (4,792 | ) |
$ | (4,404 | ) |
$ | (1,051 | ) |
Other comprehensive income, net of tax: |
|||||||||
Unrealized gain on short-term investments, net |
32 | 3 | 3 | ||||||
Other comprehensive income |
32 | 3 | 3 | ||||||
Comprehensive loss |
$ | (4,760 | ) |
$ | (4,401 | ) |
$ | (1,048 | ) |
See notes to consolidated financial statements
55
SHORETEL, INC. AND SUBSIDIARIES
CONSOLIDATED STATEMENTS OF STOCKHOLDERS’ EQUITY
Common Stock and Additional Paid-In-Capital |
Treasury Stock |
Accumulated Other Comprehensive Income (Loss) |
Accumulated Deficit |
Total Stockholders’ Equity |
||||||||||||||
Shares |
Amount |
Amount |
||||||||||||||||
(Amounts in thousands) |
||||||||||||||||||
BALANCE - June 30, 2013 |
59,168 | $ | 322,260 | $ | — | $ | (2 | ) |
$ | (166,112 | ) |
$ | 156,140 | |||||
Common stock issued under stock-based compensation plans, net of taxes paid |
3,656 | 14,970 | 14,970 | |||||||||||||||
Stock-based compensation expense |
7,316 | 7,316 | ||||||||||||||||
Unrealized gain on short term investments, net |
3 | 3 | ||||||||||||||||
Net loss |
(1,051 | ) |
(1,051 | ) |
||||||||||||||
BALANCE - June 30, 2014 |
62,824 | $ | 344,546 | $ | — | $ | 1 | $ | (167,163 | ) |
$ | 177,384 | ||||||
Common stock issued under stock-based compensation plans, net of taxes paid |
2,231 | 8,068 | 8,068 | |||||||||||||||
Stock-based compensation expense |
8,413 | 8,413 | ||||||||||||||||
Fair value of escrow settlement modification |
664 | 664 | ||||||||||||||||
Unrealized gain on short term investments, net |
3 | 3 | ||||||||||||||||
Net loss |
(4,404 | ) |
(4,404 | ) |
||||||||||||||
BALANCE - June 30, 2015 |
65,055 | $ | 361,691 | $ | — | $ | 4 | $ | (171,567 | ) |
$ | 190,128 | ||||||
Common stock issued under stock-based compensation plans, net of taxes paid |
2,462 | 9,309 | 9,309 | |||||||||||||||
Stock-based compensation expense |
8,871 | 8,871 | ||||||||||||||||
Repurchases of common stock |
(126 | ) |
(819 | ) |
(819 | ) |
||||||||||||
Unrealized gain on short term investments, net |
32 | 32 | ||||||||||||||||
Net loss |
(4,792 | ) |
(4,792 | ) |
||||||||||||||
BALANCE - June 30, 2016 |
67,391 | $ | 379,871 | $ | (819 | ) |
$ | 36 | $ | (176,359 | ) |
$ | 202,729 | |||||
See notes to consolidated financial statements
56
SHORETEL, INC. AND SUBSIDIARIES
CONSOLIDATED STATEMENTS OF CASH FLOWS
Year Ended June 30, |
|||||||||
2016 |
2015 |
2014 |
|||||||
(In thousands) |
|||||||||
Cash flows from operating activities: |
|||||||||
Net loss |
$ | (4,792 | ) |
$ | (4,404 | ) |
$ | (1,051 | ) |
Adjustments to reconcile net loss to net cash provided by operating activities: |
|||||||||
Depreciation and amortization |
20,506 | 19,072 | 18,286 | ||||||
Amortization of premium on investments |
161 | 120 | 114 | ||||||
Stock-based compensation expense |
8,871 | 8,413 | 7,316 | ||||||
Loss on disposal of property, equipment and other assets |
145 | 97 | 466 | ||||||
Provision for doubtful accounts receivable |
216 | 182 | 200 | ||||||
Change in fair value of purchase consideration |
— | — | 111 | ||||||
Impairment of indemnification asset |
— | 3,584 | — | ||||||
Fair value of escrow settlement modification |
— | 664 | — | ||||||
Changes in assets and liabilities: |
|||||||||
Accounts receivable |
3,683 | (2,918 | ) |
3,160 | |||||
Inventories |
2,910 | 11,413 | (7,536 | ) |
|||||
Indemnification asset |
— | 2,022 | 671 | ||||||
Prepaid expenses and other current assets |
2,109 | (4,249 | ) |
(2,090 | ) |
||||
Other assets |
(4 | ) |
(34 | ) |
(786 | ) |
|||
Accounts payable |
(701 | ) |
(795 | ) |
6,209 | ||||
Accrued liabilities and other |
(1,249 | ) |
7,687 | (4,097 | ) |
||||
Accrued employee compensation |
3,101 | (1,216 | ) |
3,368 | |||||
Accrued taxes and surcharges |
(5,985 | ) |
(2,284 | ) |
874 | ||||
Purchase consideration |
— | — | (320 | ) |
|||||
Deferred revenue |
6,115 | 3,791 | 10,983 | ||||||
Net cash provided by operating activities |
35,086 | 41,145 | 35,878 | ||||||
Cash flows from investing activities: |
|||||||||
Purchases of property and equipment |
(10,834 | ) |
(11,393 | ) |
(11,689 | ) |
|||
Purchases of investments |
(48,210 | ) |
(12,176 | ) |
(923 | ) |
|||
Proceeds from sale/maturities of investments |
9,673 | 5,757 | 5,640 | ||||||
Cost of acquisition of businesses, net of cash acquired |
(14,322 | ) |
— | — | |||||
Purchase of software licenses, patents and other intangible assets |
— | (1,692 | ) |
— | |||||
Net cash used in investing activities |
(63,693 | ) |
(19,504 | ) |
(6,972 | ) |
|||
Cash flows from financing activities: |
|||||||||
Proceeds from issuance of common stock |
10,589 | 9,294 | 15,832 | ||||||
Taxes paid on vested and released stock awards |
(1,280 | ) |
(1,226 | ) |
(862 | ) |
|||
Repurchases of common stock |
(819 | ) |
— | — | |||||
Payments made under the line of credit |
— | — | (29,332 | ) |
|||||
Payments made under capital leases |
(319 | ) |
(393 | ) |
(1,479 | ) |
|||
Debt issuance costs |
— | (626 | ) |
— | |||||
Payments of contingent consideration related to business combination |
— | — | (3,368 | ) |
|||||
Net cash provided by (used in) financing activities |
8,171 | 7,049 | (19,209 | ) |
|||||
Net increase (decrease) in cash and cash equivalents |
(20,436 | ) |
28,690 | 9,697 | |||||
Cash and cash equivalents at beginning of year |
82,162 | 53,472 | 43,775 | ||||||
Cash and cash equivalents at end of year |
$ | 61,726 | $ | 82,162 | $ | 53,472 | |||
Supplemental cash flow disclosure: |
|||||||||
Cash paid for interest |
$ | 26 | $ | 298 | $ | 462 | |||
Cash paid for income taxes |
$ | 1,209 | $ | 885 | $ | 894 | |||
Noncash financing and investing activities: |
|||||||||
Purchase of patents included in period-end liabilities |
$ | — | $ | 333 | $ | 160 | |||
Unpaid portion of property and equipment purchases included in period-end accounts payable |
$ | 998 | $ | 1,318 | $ | 1,032 | |||
See notes to consolidated financial statements
57
SHORETEL, INC. AND SUBSIDIARIES
NOTES TO CONSOLIDATED FINANCIAL STATEMENTS
| 1. | THE COMPANY AND SIGNIFICANT ACCOUNTING POLICIES |
The Company - ShoreTel, Inc. was incorporated in California on September 17, 1996 and reincorporated in Delaware on June 22, 2007. ShoreTel, Inc. and its subsidiaries (referred herein as “the Company”) is a leading provider of brilliantly simple business communication solutions, comprised of integrated voice, video, data and mobile applications based on Internet Protocol (“IP”) technologies. The Company focuses on the small and medium sized businesses, with a Unified Communications (“UC”) platform that allows them to communicate anytime, anyplace, and through any device that they choose. The Company’s strategy is to provide customers with a flexible choice of deployment options: either operating the Company’s solution by subscribing to our cloud-based communication services, in their own onsite data centers or a hybrid combination of both.
Fiscal Year End - The Company operates on a fiscal year ending June 30.
Principles of Consolidation - The accompanying consolidated financial statements include the accounts of the Company’s wholly owned subsidiaries located worldwide. All transactions and balances between the parent and the subsidiaries have been eliminated in consolidation.
Correction of Prior Period Error - Subsequent to the issuance of the condensed consolidated financial statements as of and for the three months ended September 30, 2015, the Company determined installation revenue and related cost of revenue were being deferred and recognized over the contractual life for certain contracts that should have been recognized over the customer life. Accordingly, the accompanying consolidated financial statements reflect the Company’s correction of the consolidated statement of operations impact of the error for the fiscal years ended June 30, 2016, 2015 and 2014 and the condensed consolidated balance sheet impact as of June 30, 2015. As a result, hosted and related services revenue and cost of revenue were decreased by $1.0 million and $1.5 million for the fiscal years ended June 30, 2015 and 2014, respectively. Prepaid expense and other current assets was increased by $2.7 million, other assets was increased by $1.2 million, deferred revenue was increased by $1.0 million and long-term deferred revenue was increased by $3.0 million as of June 30, 2015. The cumulative impact of the correction on preceding period earnings is an increase to accumulated deficit of $0.1 million as of June 30, 2015. The correction did not affect the net cash provided by operating activities, net cash used in investing activities or net cash provided by financing activities for the fiscal years ended June 30, 2016, 2015 and 2014. The correction did not affect the net loss per share for the fiscal years ended June 30, 2016, 2015 and 2014. The foregoing corrections are not considered material by the Company.
Use of Estimates - The preparation of financial statements in conformity with accounting principles generally accepted in the United States of America requires management to make estimates and assumptions that affect the reported amounts of assets and liabilities and disclosure of contingent assets and liabilities at the date of the financial statements and reported amounts of revenues and expenses during the reporting period. The use of estimates is included in certain areas including revenue recognition, allowance for doubtful accounts, stock-based compensation, inventory and other assets valuation, accrued taxes and surcharges, accounting for income taxes and accounting for goodwill and purchased intangible assets. Actual results could differ from those estimates.
Concentration of Credit Risk - Financial instruments, which potentially subject the Company to concentrations of credit risk, consist principally of cash and cash equivalents, short-term investments and accounts receivable. As of June 30, 2016, substantially all of the Company’s cash and cash equivalents and short-term investments were managed by multiple financial institutions. Accounts receivable are typically unsecured and are derived from revenue earned from customers. The Company performs ongoing credit evaluations of its customers and maintains allowances for potential credit losses. At June 30, 2016 and June 30, 2015 one value-added distributor accounted for 42% and 33% of the total accounts receivable, respectively.
Fair Value of Financial Instruments - The carrying amounts of the Company’s financial instruments, including cash and cash equivalents, accounts receivable, accounts payable and accrued liabilities, approximate
58
their respective fair market values due to the short maturities of these financial instruments. Refer to Note 6 to the Consolidated Financial Statements for discussion of the methods used to determine the fair value of short-term investments. Refer to Note 7 to the Consolidated Financial Statements for discussion of the methods used to determine the fair value of the line of credit.
Cash and Cash Equivalents - The Company considers all highly liquid investments purchased with an original or remaining maturity of less than three months at the date of purchase to be cash equivalents. The Company’s cash and cash equivalents are maintained with various financial institutions.
Investments - The Company’s short-term investments are comprised of U.S. Government agency securities, corporate bonds and commercial paper. These investments are held in the custody of two major financial institutions. The specific identification method is used to determine the cost basis of disposed fixed income securities. At June 30, 2016 and 2015, the Company’s investments were classified as available-for-sale. These investments are recorded in the Consolidated Balance Sheets at fair value with net unrealized gains or losses reported as a separate component of accumulated other comprehensive income (loss), net of tax.
The Company recognizes an impairment charge when a decline in the fair value of its investments is considered to be other-than-temporary. An impairment is considered other-than-temporary if (i) the Company has the intent to sell the security, (ii) it is more likely than not that the Company will be required to sell the security before recovery of its entire amortized cost basis, or (iii) the Company does not expect to recover the entire amortized cost of the security. If an impairment is considered other-than-temporary based on (i) or (ii) described above, the entire difference between the amortized cost and the fair value of the security is recognized in earnings. If an impairment is considered other-than-temporary based on condition (iii), the amount representing credit losses, defined as the difference between the present value of the cash flows expected to be collected and the amortized cost basis of the debt security, will be recognized in earnings and the amount relating to all other factors will be recognized in other comprehensive income (“OCI”). In estimating the amount and timing of cash flows expected to be collected, the Company considers all available information including past events, current conditions, the remaining payment terms of the security, the financial condition of the issuer, expected defaults, and the value of underlying collateral. The Company has determined that gross unrealized losses on short-term investments at June 30, 2016 and 2015 are temporary in nature because each investment meets our investment policy and credit quality requirements. The Company has the ability and intent to hold these investments until they recover their unrealized losses, which may not be until maturity. Evidence that we will recover our investments outweighs evidence to the contrary.
Allowance for Doubtful Accounts - The Company records an allowance for doubtful accounts based upon its assessment of various factors. The Company considers historical experience, the age of the accounts receivable balances, the credit quality of its customers, current economic conditions and other factors that may affect customers’ ability to pay to determine the level of allowance required.
The change in allowance for doubtful accounts is summarized as follows (in thousands):
June 30, |
|||||||||
2016 |
2015 |
2014 |
|||||||
Allowance for doubtful accounts - beginning |
$ | 631 | $ | 636 | $ | 639 | |||
Current period provision |
216 | 182 | 200 | ||||||
Provision related to the acquisition of a business |
79 | — | — | ||||||
Write-offs charged to allowance, net of recoveries |
(248 | ) |
(187 | ) |
(203 | ) |
|||
Allowance for doubtful accounts - ending |
$ | 678 | $ | 631 | $ | 636 | |||
Inventories - Inventories, which consist principally of raw materials, finished goods and inventories held by distributors are stated at the lower of cost or market, with cost being determined under a standard cost method that approximates first-in, first-out. The Company accounts for excess and obsolete inventory by reducing the carrying value to the estimated market value of the inventory based upon management’s assumptions about future demand and market conditions.
Property and Equipment - Property and equipment are stated at cost. Depreciation is computed using the straight-line method over the estimated useful lives of the assets, which range from two to five years. Leasehold improvements are amortized over the shorter of the estimated useful lives of the asset or the lease term.
59
Software to be Sold, Leased or Marketed - Development costs of computer software to be sold, leased, or otherwise marketed are subject to capitalization beginning when a product’s technological feasibility has been established and ending when a product is available for general release to customers. In most instances, the Company’s products are released soon after technological feasibility has been established; therefore, costs incurred subsequent to achievement of technological feasibility are usually not significant. Capitalized costs are amortized using the straight-line method over the estimated economic life of the product. The Company evaluates the realizability of the assets and the related periods of amortization on a regular basis. Judgment is required in determining when technological feasibility of a product is established as well as its economic life.
Business Combinations – The Company recognizes identifiable assets acquired and liabilities assumed at their acquisition date fair values. Goodwill as of the acquisition date is measured as the excess of consideration transferred over the net of the acquisition date fair values of assets acquired and the liabilities assumed. While the Company uses its best estimates and assumptions as part of the purchase price allocation process to accurately value assets acquired and liabilities assumed at the acquisition date, the Company’s estimates are inherently uncertain and subject to refinement. As a result, during the measurement period, which may be up to one year from the acquisition date, the Company records adjustments to the assets acquired and liabilities assumed, with the corresponding offset to goodwill to the extent the Company identifies adjustments to the preliminary purchase price allocation. Upon the conclusion of the measurement period or final determination of the values of assets acquired or liabilities assumed, whichever comes first, any subsequent adjustments are recorded to the consolidated statements of operations.
Goodwill and Purchased-Intangible Assets - Goodwill is tested for impairment on an annual basis on June 30th and, when specific circumstances dictate, between annual tests. When impaired, the carrying value of goodwill is written down to fair value. The Company has a single reporting unit. The goodwill impairment test involves a two-step process. The first step, identifying a potential impairment, compares the fair value of a reporting unit with its carrying amount, including goodwill. If the carrying value of the reporting unit exceeds its fair value, the second step would need to be conducted; otherwise, no further steps are necessary as no potential impairment exists. The second step, measuring the impairment loss, compares the implied fair value of the reporting unit goodwill with the carrying amount of that goodwill. Any excess of the reporting unit goodwill carrying value over the respective implied fair value is recognized as an impairment loss. There was no impairment of goodwill identified in fiscal 2016, 2015 and 2014.
Purchased-intangible assets are amortized on a straight-line basis over the periods of benefit, ranging from two to eight years. The Company performs a review of purchased-intangible assets whenever events or changes in circumstances indicate that the useful life is shorter than it had originally estimated or that the carrying amount of assets may not be recoverable. If such facts and circumstances exist, the Company assesses the recoverability of purchased-intangible assets by comparing the projected undiscounted net cash flows associated with the related asset or group of assets over their remaining lives against their respective carrying amounts. Impairments, if any, are based on the excess of the carrying amount over the fair value of those assets. If the useful life of the asset is shorter than originally estimated, the Company accelerates the rate of amortization and amortizes the remaining carrying value over the new shorter useful life. There was no impairment of purchased-intangible assets identified in fiscal 2016, 2015 and 2014.
Long-Lived Assets - The Company evaluates the carrying value of long-lived assets to be held and when events or circumstances warrant such a review. The carrying value of a long-lived asset to be held and used is considered impaired when the anticipated separately identifiable undiscounted cash flows from such an asset are less than the carrying value of the asset. In that event, an impairment loss is recognized based on the amount by which the carrying value exceeds the fair value of the long-lived asset. Fair value is determined primarily using the anticipated cash flows discounted at a rate commensurate with the risk involved. There was no impairment of long-lived assets identified in fiscal 2016, 2015 and 2014.
Treasury Shares - From time to time, the Company repurchases shares of its common stock, depending on market conditions, in the open market, in accordance with programs authorized by the Board of Directors. Repurchased shares are held as treasury stock until such time as they are retired or re-issued. Retirements of treasury stock are non-cash equity transactions in which the reacquired shares are returned to the status of authorized but unissued shares and the cost is recorded as a reduction to both retained earnings and treasury stock.
60
Revenue Recognition - The Company derives its revenue from the sale of hosted and premise based Unified Communication systems and services.
When a sales arrangement contains multiple elements, such as hardware and software products and/or services, we allocate revenue to each element based on relative selling prices. The relative selling price is determined using vendor specific objective evidence of fair value (“VSOE”) when available. When VSOE cannot be established, the Company attempts to determine the third party evidence of selling price (“TPE”) for the deliverables. TPE is determined based on competitor prices for similar deliverables when sold separately by the competitors. Generally, our product offerings differ from those of our competitors and comparable pricing of our competitors is often not available. Therefore, we are typically not able to determine TPE. When we are unable to establish selling price using VSOE or TPE, we use estimated selling prices (“ESP”) in our allocation of arrangement fees. The ESP for a deliverable is determined as the price at which we would transact if the products or services were sold on a stand-alone basis.
Product and Support and Services Revenues:
The sale of IP telecommunication systems include hardware, primarily phones and voice switches, software components and may also include training, installation, professional services and post-contractual support for the products. The Company’s business strategy is centered on selling to enterprise customers through channel partners rather than directly. Channel partners include resellers as well as value-added distributors who in turn sell to the resellers. Sales to value-added distributors allow the Company to leverage its existing distribution infrastructure and sales personnel.
The typical system includes a combination of IP phones, switches and UC software applications. For sales transactions made both direct and to resellers revenue is recognized at the time of shipment provided that all the provisions of revenue recognition have been met. For sales to value-added distributors, revenue is initially deferred and is recognized at the time of sale by the distributor to their customer, provided all the provisions of revenue recognition have been met. The Company refers to this distribution approach as its two-tier distribution model and the recognition of revenue at the time of sale by the distributor as the sell through method.
The Company recognizes revenue when persuasive evidence of an arrangement exists, product has shipped or delivery has occurred (depending on when title passes), the sales price is fixed or determinable and free of contingencies and significant uncertainties, and collection is probable. The fee is considered fixed or determinable at the execution of an agreement, based on specific products and quantities to be delivered at specified prices. The agreements with reseller partners generally do not include rights of return or acceptance provisions. Even though substantially all of the contractual agreements do not provide return privileges, there are circumstances for which the Company will accept a return. The Company maintains a reserve for such returns based on historical experience with reseller partners. The agreements with the Company’s value-added distributors allow for limited rights of return of products generally purchased within the previous 90 days. In addition to such return rights, the Company generally offers price protection provisions to its distributors when there is a permanent reduction of its sales prices. In such cases, the Company is obligated to grant the distributor a credit for the difference between the changes in the aggregate price of any amounts that have been purchased but unsold by the distributor as of the effective date of such decrease. In addition, certain of the Company’s distributors stock phones and switches and purchase licenses only upon sale to a value added reseller or end customer. Revenue is deferred for distributors until the distributor sells the hardware and license to their customer which would constitute a complete configuration of our system. To the extent that the Company’s agreements contain acceptance terms, the Company recognizes revenue upon product acceptance, unless the acceptance provision is deemed to be perfunctory. Payment terms to customers generally range from net 30 to net 60 days. In the event payment terms are extended materially from the Company’s standard business practices, the fees are deemed to not be fixed or determinable and revenue is recognized when the payment becomes due. The Company assesses the ability to collect from its customers based on a number of factors, including credit worthiness and past transaction history of the customer. If the customer is not deemed credit worthy, the Company defers all revenue from the arrangement until payment is received and all other revenue recognition criteria have been met. Shipping charges billed to customers are included in product revenue and the related shipping costs are included in cost of product revenue. Provisions for return allowances are recorded at the time revenue is recognized based on the Company’s historical experience. The provision for return allowances is recorded as a reduction to revenues on the statement of operations and is included as a reduction to accounts receivable on the balance sheet.
61
Deferred revenue primarily consists of billings or payments received in advance of revenue recognition from the Company’s transactions and are recognized as the revenue recognition criteria are met. Nearly all of the Company’s system sales include the purchase of post-contractual support contracts with terms of up to five years, and the renewal rates on these contracts have been high historically. The Company recognizes support revenue on a ratable basis over the term of the support contract. Since the Company receives payment for support in advance of recognizing the related revenue, the Company carries a deferred revenue balance on the consolidated balance sheet.
Most of the products and services included in a premise-based system qualify as separate units of accounting. Many of the Company’s products have both software and non-software components that function together to deliver the essential functionality of the integrated system product. The Company analyzes all of its software and non-software products and services and considers the features and functionalities of the individual elements and the stand alone sales of those individual components among other factors, to determine which elements are essential or non-essential to the overall functionality of the integrated system product. The Company recognizes revenue related to installation services and training upon delivery of the service.
The Company’s core software, which we refer to as “essential software,” is integrated with hardware and is essential to the functionality of the integrated system product. The Company also sells additional software which provides increased features and functions, but is not essential to the overall functionality of the integrated system products, which we refer to as “non-essential software.” At the initial purchase, the customer generally bundles together the hardware, essential software, non-essential software, as needed, and up to five years of post-contractual support. Thereafter, if the enterprise customer increases its end users and system functionality, it may add more hardware, both essential and non-essential software components, and related post-contractual support by purchasing them separately.
The revenue for these multiple element arrangements is allocated to the non-essential software deliverables and the non-software deliverables based on the relative selling prices of all of the deliverables in the arrangement using the hierarchy in the accounting guidance. The non-essential software deliverables included in a multiple element arrangement are subject to the industry specific software revenue recognition guidance. As the Company has not been able to obtain VSOE for all of the non-essential software deliverables in the arrangement, revenue allocated to the delivered non-essential software elements is recognized using the residual method in accordance with industry specific software revenue recognition guidance. Under the residual method, the amount of revenue recognized for the delivered non-essential software elements equaled the total allocated consideration less the VSOE of any undelivered elements bundled with such non-essential software elements.
The Company has been able to establish VSOE for its professional and post contractual support services mainly based on the volume and the pricing of the stand-alone sales for these services within a narrow range. The Company establishes its ESP for products by considering factors including, but not limited to, geographies, customer segments and pricing practices. The determination of ESP is made through consultation with and formal approval by the Company’s management. The Company regularly reviews VSOE, TPE and ESP and maintains internal controls over the establishment and updates of these estimates.
Hosted and Related Services Revenues:
The Company’s hosted and related services and solutions consist primarily of our proprietary hosted voice over Internet Protocol (“VoIP”) UC system as well as other services such as foreign and domestic calling plans, certain UC applications, internet service provisioning, training and other professional services. Additionally, the Company offers their customers the ability to purchase phones from them directly or rent such phones as part of their service agreements. The customers are not required to purchase phones from the Company directly as they can independently purchase such equipment. Customers enter into a one to three-year service agreement whereby they are billed for such services on a monthly basis.
Monthly recurring hosted services are recognized on a straight line basis in the period when the service is delivered. The installation fees are recognized on a straight-line basis over the estimated customer life.
The Company bills most of the monthly recurring hosted service revenue a month in advance. Any amounts billed and collected, but for which the service is not yet delivered, are included in deferred revenue. These amounts are recognized as revenues only when the service is delivered.
62
The Company maintains a reserve for credits provided to customers for outages, quality issues, billing disputes or changes in the service levels that are included in the amounts that were billed in advance. The reserve for such credits is based on historical experiences and trends. The Company also maintains a reserve for amounts that are deemed as uncollectible.
Channel Partner Programs and Incentives - The Company records estimated reductions to revenues for channel partner programs and incentive offerings including special pricing agreements, promotions and other volume-based incentives. The Company also accrues for co-op marketing funds as a marketing expense if the Company receives an identifiable benefit in exchange and can reasonably estimate the fair value of the identifiable benefit received; otherwise, it is recorded as a reduction to revenues.
Warranties - The majority of the Company’s products are covered by a one-year limited manufacturer’s warranty. Estimated contractual warranty obligations are recorded when related sales are recognized based on historical experience. The determination of such provision requires the Company to make estimates of product return rates and expected costs to repair or replace the product under warranty. If actual costs differ significantly from these estimates, additional amounts are recorded when such costs are probable and can be reasonably estimated. The provisions for product warranties are recorded within cost of goods sold on the statement of operations and included within accrued liabilities and other on the balance sheet and are insignificant for fiscal 2016 and 2015.
Research and Development Costs – Research and development expenses primarily include personnel costs, outside engineering costs, professional services, prototype costs, test equipment, software usage fees and facilities expenses. Research and development expenses are recognized when incurred.
Income and Telecom Taxes – The Company utilizes the asset and liability method of accounting for income taxes. Deferred income taxes are recognized by applying enacted statutory tax rates applicable to future years to differences between the financial statement carrying amounts of existing assets and liabilities and their respective tax bases, as well as net operating loss and tax credit carryforwards. The effect on deferred tax assets and liabilities of a change in tax rates is recognized in income in the period that includes the enactment date. The measurement of deferred tax assets is reduced, if necessary, by a valuation allowance for any tax benefit of which future realization is uncertain. The Company recognizes the tax benefit from an uncertain tax position only if it is more likely than not the tax position will be sustained on examination by the taxing authorities, based on the technical merits of the position. The tax benefits recognized in the financial statements from such positions are then measured based on the largest benefit that has a greater than 50% likelihood of being realized upon settlement. Interest and penalties related to uncertain tax positions, if applicable, are recognized in the income tax provision.
As a provider of communication services, the Company assesses whether to include the taxes and surcharges collected from customers and remitted to government authorities, including Universal Service Fund charges, sales, use, and various surcharges, in the Company’s revenues and expenses. This assessment includes whether the Company is the primary obligor or principal taxpayer for the taxes assessed in each jurisdiction where the Company does business. In jurisdictions where the Company determines that it is the principal taxpayer, the Company records the surcharges these within revenues and cost of hosted and related services in the Consolidated Statements of Operations as well as within accrued taxes and surcharges in the Consolidated Balance Sheets. In jurisdictions where the Company determines that it is merely a collection agent for the government authority, the Company does not include them in our revenues and cost of hosted and related services.
Stock-Based Compensation – The Company measures the cost of employee services received in exchange for an award of equity instruments based on the grant date fair value of the award. The Company has a stock-based employee compensation plan. Generally, stock options granted to employees vest 25% at one year and then 1/36th monthly thereafter, and restricted stock units issued generally vest 25% at one, two, three and four years, and have a term of ten years.
63
The following table shows total stock-based compensation expense included in the accompanying Consolidated Statements of Operations for the years ended June 30, 2016, 2015 and 2014 (in thousands):
Year Ended June 30, |
|||||||||
2016 |
2015 |
2014 |
|||||||
Cost of product revenue |
$ | 64 | $ | 74 | $ | 69 | |||
Cost of hosted and related services revenue |
1,272 | 1,215 | 626 | ||||||
Cost of support and services revenue |
590 | 497 | 569 | ||||||
Research and development |
1,854 | 1,928 | 1,704 | ||||||
Sales and marketing |
2,569 | 2,391 | 1,996 | ||||||
General and administrative |
2,522 | 2,308 | 2,352 | ||||||
Total stock-based compensation expense |
$ | 8,871 | $ | 8,413 | $ | 7,316 | |||
Foreign Currency Translation – The Company’s foreign operations are subject to exchange rate fluctuations and foreign currency transaction costs, however, the majority of sales transactions are denominated in U.S. dollars. The functional currency of the subsidiaries is the U.S. dollar. Foreign currency denominated sales, costs and expenses are recorded at the average exchange rates during the year. Gains or losses resulting from foreign currency transactions are included in the consolidated statements of operations within other income (expense), net.
Accumulated Other Comprehensive Income (Loss) – Accumulated other comprehensive income (loss) only includes unrealized gains and losses on the Company’s available-for-sale securities.
Recent Accounting Pronouncements
New Accounting Updates Recently Adopted
In September 2015, the FASB issued ASU 2015-16, Business Combinations (Topic 805): Simplifying the Accounting for Measurement-Period Adjustments. The guidance requires that adjustments to provisional amounts recognized in a business combination be recorded during the measurement period in the period in which the adjustment amounts are determined. This also applies to the effect on earnings of changes in depreciation, amortization or other income effects, if any; as a result of the change in the provisional amounts as if the accounting had been completed at the acquisition date. This accounting guidance is effective for the Company in the financial reporting periods beginning after December 15, 2015, with early adoption permitted. This accounting standard was adopted by the Company beginning October 1, 2015 and it did not have an impact on the Company’s consolidated financial statements.
In November 2015, the FASB issued ASU 2015-17, Income Taxes (Topic 740): Balance Sheet Classification of Deferred Taxes, which simplifies the presentation of deferred income taxes. This ASU requires that deferred tax assets and liabilities be classified as non-current in a statement of financial position. The standard is effective in the annual reporting periods beginning after December 15, 2016. Early adoption is permitted for any interim and annual financial statements that have not yet been issued. The Company has early adopted ASU 2015-17 effective June 30, 2016 on a prospective basis. Adoption of this ASU resulted in a reclassification of our net current deferred tax assets to the net non-current deferred tax assets in our Consolidated Balance Sheet as of June 30, 2016. Prior periods were not retrospectively adjusted.
Recent Accounting Standards or Updates Not Yet Effective
In May 2014, the FASB issued ASU No. 2014-9 Revenue from Contracts with Customers (Topic 606) - an accounting standard that supersedes the revenue recognition requirements in Topic 605, Revenue Recognition. The core principle of the new guidance is that an entity should recognize revenue to depict the transfer of promised goods or services to customers in an amount that reflects the consideration to which the entity expects to be entitled in exchange for those goods or services. New disclosures about the nature, amount, timing and uncertainty of revenue and cash flows arising from contracts with customers are also required. The effective date of the new standard was deferred by one year by ASU No. 2015-14, Revenue from Contracts with Customers (Topic 606): Deferral of Effective Date. In March 2016, the FASB issued ASU No. 2016-08 Revenue from Contracts with Customers (Topic 606): Principal versus Agent Considerations, which amends the guidance to
64
clarify the implementation guidance on principal versus agent considerations (gross versus net revenue presentation). In April 2016, the FASB issued ASU No. 2016-10 Revenue from Contracts with Customers (Topic 606): Identifying Performance Obligations and Licensing, which amends the guidance with respect to certain implementation issues on identifying performance obligations and accounting for licenses of intellectual property. In May 2016, the FASB issued ASU No. 2016-11 Revenue Recognition (Topic 605) and Derivatives and Hedging (Topic 815): Rescission of SEC Guidance Because of Accounting Standards Updates 2014-09 and 2014-16 pursuant to Staff announcements at the March 3, 2016 EITF Meeting, which rescinds from the FASB Accounting Standards Codification certain SEC paragraphs as a result of two SEC Staff Announcements at the March 3, 2016 meeting. In May 2016, the FASB issued ASU 2016-12, Revenue from Contracts with Customers - Narrow-Scope Improvements and Practical Expedients, which clarifies certain narrow aspects of Topic 606 such as assessing the collectability criterion, presentation of sales taxes and other similar taxes collected from customers, noncash consideration, contract modifications at transition, completed contracts at transition, and technical correction. This accounting guidance is effective for the Company in annual financial reporting periods beginning after December 15, 2017; early adoption is permitted for periods beginning after December 15, 2016. ASU No. 2014-9 may be applied retrospectively (a) to each reporting period presented or (b) with the cumulative effect in retained earnings at the beginning of the adoption period. The Company is currently evaluating the method of adoption and the impact that the adoption of this accounting guidance may have on its consolidated financial statements.
In July 2015, the FASB issued ASU 2015-11, Inventory (Topic 330): Simplifying the Measurement of Inventory. Under this ASU, inventory will be measured at the “lower of cost and net realizable value” and options that currently exist for “market value” will be eliminated. The ASU defines net realizable value as the “estimated selling prices in the ordinary course of business, less reasonably predictable costs of completion, disposal, and transportation.” No other changes were made to the current guidance on inventory measurement. This accounting guidance is effective for the Company in financial reporting periods beginning after December 15, 2016. Early adoption is permitted. The Company is currently evaluating the impact that the adoption of this accounting guidance may have on its consolidated financial statements.
In February 2016, the FASB issued ASU 2016-02, Leases (Topic 842), which supersedes the lease accounting requirements in Topic 840. This ASU requires a dual approach for lessee accounting under which a lessee would account for leases as finance leases or operating leases. Both finance leases and operating leases will result in the lessee recognizing a right-of use asset and a corresponding lease liability. For finance leases, the lessee would recognize interest expense and amortization of the right-of-use asset, and for operating leases, the lessee would recognize a straight-line total lease expense. The guidance also requires qualitative and specific quantitative disclosures to supplement the amounts recorded in the financial statements so that users can understand more about the nature of an entity’s leasing activities, including significant judgments and changes in judgments. This accounting guidance is effective for the Company in annual financial reporting periods beginning after December 15, 2018. Early adoption is permitted. The Company is currently evaluating the impact that the adoption of this accounting guidance may have on its consolidated financial statements.
In March 2016, the FASB issued ASU 2016-09, Compensation-Stock Compensation (Topic 718): Improvements to Employee Share-Based Payment Accounting, which is intended to simplify several aspects of the accounting for share-based payment transactions, including certain income tax consequences, classification of awards as either equity or liabilities, and classification on the statement of cash flows. This accounting guidance is effective for the Company in annual financial reporting periods beginning after December 15, 2016. Early adoption is permitted. The Company is currently evaluating the impact that the adoption of this accounting guidance may have on its consolidated financial statements.
In June 2016, the FASB issued ASU 2016-13, Financial Instruments - Credit Losses (Topic 326): Measurement of Credit Losses on Financial Instruments, which changes how entities will measure credit losses for most financial assets and certain other instruments that are not measured at fair value through net income. Under the new guidance, an entity recognizes as an allowance its estimate of expected credit losses, which the FASB believes will result in more timely recognition of such losses. This accounting guidance is effective for the Company in financial reporting periods beginning after December 15, 2019. Early adoption is permitted in financial reporting periods beginning after December 15, 2018. The Company is currently evaluating the impact that the adoption of this accounting guidance may have on its consolidated financial statements.
65
| 2. | BUSINESS COMBINATIONS |
M5 Networks Australia Pty Ltd Acquisition
On November 16, 2015, the Company acquired all of the outstanding common stock of M5 Networks Australia Pty Ltd. (“M5 Australia”), a privately-held company based in Australia and a provider of hosted unified communications solutions, for a total cash consideration of $6.1 million (8.5 million Australian dollars). The acquisition accelerates the Company’s growth and expansion of providing hosted unified communications services in Australia.
In accordance with ASC 805, Business Combinations, the acquisition of M5 Australia was recorded as a purchase acquisition. Under the purchase method of accounting, the fair value of the consideration was allocated to assets and liabilities assumed at their fair values. The excess of the preliminary fair value of consideration paid over the preliminary fair values of net assets and liabilities acquired and identifiable intangible assets resulted in recognition of goodwill of approximately $5.2 million. The goodwill consists largely of expected expansion of the customer base and market share within the Australian hosted communications industry. The goodwill recorded is not deductible for income tax purposes.
Preliminary Purchase Price Allocation
The total purchase price was preliminarily allocated to M5 Australia’s net tangible and identifiable intangible assets based on their estimated fair values as of November 16, 2015 as set forth below. The primary areas of the purchase price allocation that are not yet finalized relate to deferred taxes and goodwill. The following is the preliminary purchase price allocation (in thousands):
(in thousands) |
Estimated useful lives (in years) |
|||||
Cash acquired |
$ | 224 | ||||
Other current assets |
386 | |||||
Intangible assets: |
||||||
Customer relationships |
1,300 | 5 | ||||
Goodwill |
5,210 | |||||
Other long-term assets |
164 | |||||
Other liabilities assumed |
(1,174 | ) |
||||
$ | 6,110 | |||||
Valuing certain components of the acquisition required the Company to make estimates that may be adjusted in the future, if new information is obtained about facts and circumstances that existed as of the acquisition date that, if known, would have resulted in the recognition of those assets and liabilities as of that date. Consequently, the purchase price allocation is considered preliminary. Final determination of these estimates could result in an adjustment to the preliminary purchase price allocation, with an offsetting adjustment to goodwill. Measurement period adjustments will be recorded in the period in which the adjustment amounts are determined.
The Company recognized $0.3 million associated with legal, accounting, consulting and other costs directly related to the acquisition as acquisition-related costs within the Consolidated Statement of Operations for fiscal 2016.
The results of operations of M5 Australia have been included in the Company’s consolidated statements of operations from the acquisition date, though revenue and gross margin from M5 Australia were not material for the fiscal 2016. Due to the continued integration of the combined business, it is impractical to determine the earnings from M5 Australia beyond the measure of gross profit. Pro forma results of operations have not been presented because the acquisition was not material to our results of operations.
Corvisa LLC Acquisition
On January 6, 2016, the Company acquired all of the outstanding membership interest in Corvisa LLC (“Corvisa”), a provider of cloud-based communications solutions, for total cash consideration of $8.7 million. The acquisition accelerates the Company’s growth and expansion of its hosted unified communications service offering.
66
In accordance with ASC 805, Business Combinations, the acquisition of Corvisa was recorded as a purchase acquisition. Under the purchase method of accounting, the fair value of the consideration was allocated to assets and liabilities assumed at their fair values. The fair value of purchased identifiable intangible assets was derived from model-based valuations from significant unobservable inputs (“Level 3 inputs”) determined by management. The fair value of purchased identifiable intangible assets was determined using the Company’s discounted cash flow models from operating projections prepared by management using a market participant rate of 35.0%. The excess of the preliminary fair value of consideration paid over the preliminary fair values of net assets and liabilities acquired and identifiable intangible assets resulted in recognition of goodwill of approximately $1.5 million. The goodwill consists largely of expected expansion of the customer base and market share within hosted communications industry. The goodwill recorded is deductible for income tax purposes.
The total purchase price was preliminarily allocated to Corvisa’s net tangible and identifiable intangible assets based on their estimated fair values as of January 6, 2016 as set forth below. The primary areas of the purchase price allocation that are not yet finalized relate to property and equipment, contingency accruals, deferred taxes and goodwill. The following is the preliminary purchase price allocation (in thousands):
(in thousands) |
Estimated useful lives (in years) |
|||||
Cash acquired |
$ | 227 | ||||
Other current assets |
933 | |||||
Intangible assets: |
||||||
Existing technology |
3,400 | 5 | ||||
Customer relationships |
100 | 3 | ||||
Favorable leases |
178 | 6 | ||||
Goodwill |
1,489 | |||||
Other long-term assets |
3,301 | |||||
Other liabilities assumed |
(966 | ) |
||||
$ | 8,662 | |||||
Valuing certain components of the acquisition required us to make estimates that may be adjusted in the future, if new information is obtained about facts and circumstances that existed as of the acquisition date that, if known, would have resulted in the recognition of those assets and liabilities as of that date. Consequently, the purchase price allocation is considered preliminary. Final determination of these estimates could result in an adjustment to the preliminary purchase price allocation, with an offsetting adjustment to goodwill. Measurement period adjustments will be recorded in the period in which the adjustment amounts are determined.
The Company recognized $1.2 million associated with legal, accounting, consulting and other costs directly related to the acquisition as acquisition-related costs within the Consolidated Statement of Operations for fiscal 2016.
The results of operations of Corvisa have been included in the Company’s consolidated statements of operations from the acquisition date, though revenue and gross margin from Corvisa were not material for fiscal 2016. Due to the continued integration of the combined business, it is impractical to determine the earnings from Corvisa beyond the measure of gross profit.
67
The unaudited pro forma financial information in the table set forth below summarizes the combined results of operations for the Company and its Corvisa acquisition as though Corvisa was combined as of the beginning of fiscal 2015. The pro forma financial information for the period presented also includes the business combination accounting effects resulting from the acquisition primarily related to amortization charges from acquired intangible assets. The pro forma financial information below is also adjusted to exclude the Company’s non-recurring acquisition-related costs of $1.2 million incurred in fiscal 2016 and included the year to date total in fiscal 2015. The pro forma financial information as presented below is for informational purposes only and is not indicative of the results of operations that would have been achieved if the Corvisa acquisition had taken place at the beginning of fiscal 2015.
(Unaudited) Twelve Months Ended June 30, |
||||||
2016 |
2015 |
|||||
(in thousands, except per share amounts) |
||||||
Total revenue |
$ | 361,313 | $ | 361,412 | ||
Net loss |
(17,006 | ) |
(26,427 | ) |
||
Basic and diluted net loss per share |
$ | (0.26 | ) |
$ | (0.41 | ) |
| 3. | BALANCE SHEET COMPONENTS |
Balance sheet components consisted of the following:
As of June 30, |
||||||
2016 |
2015 |
|||||
(Amounts in thousands) |
||||||
Inventories: |
||||||
Raw materials |
$ | 57 | $ | 92 | ||
Distributor inventory |
1,677 | 965 | ||||
Finished goods |
10,754 | 13,996 | ||||
Total inventories |
$ | 12,488 | $ | 15,053 | ||
Property and equipment: |
||||||
Computer equipment and tooling |
$ | 50,933 | $ | 41,532 | ||
Software |
7,328 | 5,211 | ||||
Furniture and fixtures |
3,880 | 3,421 | ||||
Leasehold improvements & others |
8,836 | 8,149 | ||||
Total property and equipment |
70,977 | 58,313 | ||||
Less accumulated depreciation and amortization |
(49,426 | ) |
(37,894 | ) |
||
Property and equipment – net |
$ | 21,551 | $ | 20,419 | ||
Deferred revenue: |
||||||
Product |
$ | 5,433 | $ | 2,912 | ||
Support and services |
59,465 | 57,967 | ||||
Hosted and related services |
12,807 | 10,396 | ||||
Total deferred revenue |
$ | 77,705 | $ | 71,275 | ||
Depreciation expense for the years ended June 30, 2016, 2015 and 2014 was $11.9 million, $10.6 million and $8.4 million, respectively.
68
| 4. | SHORT-TERM INVESTMENTS |
The following is a summary of the Company’s short-term investments (in thousands):
June 30, 2016 |
||||||||||||
Amortized Cost |
Gross Unrealized Gains |
Gross Unrealized Losses |
Fair Value |
|||||||||
Corporate bonds and commercial paper |
$ | 26,359 | $ | 9 | $ | (5 | ) |
$ | 26,363 | |||
U.S. Government agency securities |
20,038 | 32 | — | 20,070 | ||||||||
Total short-term investments |
$ | 46,397 | $ | 41 | $ | (5 | ) |
$ | 46,433 | |||
June 30, 2015 |
||||||||||||
Amortized Cost |
Gross Unrealized Gains |
Gross Unrealized Losses |
Fair Value |
|||||||||
Corporate bonds and commercial paper |
$ | 8,021 | $ | 4 | $ | — | $ | 8,025 | ||||
Total short-term investments |
$ | 8,021 | $ | 4 | $ | — | $ | 8,025 | ||||
Tax amounts related to unrealized gains (losses) were immaterial for all periods presented.
The following table summarizes the maturities of the Company’s short-term investments by contractual maturity (in thousands):
June 30, 2016 |
||||||
Amortized Cost |
Fair Value |
|||||
Less than 1 year |
$ | 28,107 | $ | 28,114 | ||
Due in 1 to 3 years |
18,290 | 18,319 | ||||
$ | 46,397 | $ | 46,433 | |||
June 30, 2015 |
||||||
Amortized Cost |
Fair Value |
|||||
Less than 1 year |
$ | 6,696 | $ | 6,702 | ||
Due in 1 to 3 years |
1,325 | 1,323 | ||||
$ | 8,021 | $ | 8,025 | |||
Actual maturities may differ from the contractual maturities because borrowers may have the right to call or prepay certain obligations.
| 5. | GOODWILL AND INTANGIBLE ASSETS |
Goodwill
Goodwill represents the excess of the purchase price in a business combination over the fair value of tangible and intangible assets acquired. Goodwill amounts are not amortized.
The following table summarizes the changes in the carrying value of goodwill for the years ended June 30, 2016 and 2015.
Total |
|||
As of June 30, 2014 |
$ | 122,750 | |
As of June 30, 2015 |
122,750 | ||
Addition |
6,699 | ||
As of June 30, 2016 |
$ | 129,449 | |
69
Intangible assets
The following is a summary of the Company’s intangible assets (in thousands):
June 30, 2016 |
June 30, 2015 |
|||||||||||||||||
Gross Carrying Amount |
Accumulated Amortization |
Net Carrying Amount |
Gross Carrying Amount |
Accumulated Amortization |
Net Carrying Amount |
|||||||||||||
Patents |
$ | 4,446 | $ | (3,919 | ) |
$ | 527 | $ | 4,446 | $ | (3,640 | ) |
$ | 806 | ||||
Technology |
31,434 | (23,523 | ) |
7,911 | 26,644 | (18,874 | ) |
7,770 | ||||||||||
Customer relationships |
24,700 | (14,513 | ) |
10,187 | 23,300 | (11,049 | ) |
12,251 | ||||||||||
Intangible assets in process and other |
178 | (15 | ) |
163 | 1,390 | — | 1,390 | |||||||||||
Intangible assets |
$ | 60,758 | $ | (41,970 | ) |
$ | 18,788 | $ | 55,780 | $ | (33,563 | ) |
$ | 22,217 | ||||
The intangible assets are being amortized over useful lives ranging from 2 years to 8 years.
Certain internally developed software became available for general release to customers during fiscal 2016; at which time, an aggregate of $1.4 million in software development costs were transferred from intangible assets in process to technology in the table above, and the amortization expense is being recognized related to these capitalized software costs.
Amortization of intangible assets for the years ended June 30, 2016, 2015 and 2014 was $8.4 million, $8.1 million and $9.8 million, respectively.
The estimated future amortization expenses for intangible assets, excluding intangible assets in process and other, for the next five years and thereafter are as follows (in thousands):
Years Ending June 30, |
|||
2017 |
$ | 7,508 | |
2018 |
5,513 | ||
2019 |
4,010 | ||
2020 |
1,267 | ||
2021 |
477 | ||
Thereafter |
13 | ||
Total |
$ | 18,788 | |
| 6. | FAIR VALUE DISCLOSURE |
Fair value is defined as the price that would be received to sell an asset or paid to transfer a liability in the principal market (or most advantageous market, in the absence of a principal market) for the asset or liability in an orderly transaction between market participants at the measurement date. Further, entities are required to maximize the use of observable inputs and minimize the use of unobservable inputs in measuring fair value, and to utilize a three-level fair value hierarchy that prioritizes the inputs used to measure fair value. The three levels of inputs used to measure fair value are as follows:
| • | Level 1 — Quoted prices in active markets for identical assets or liabilities. |
| • | Level 2 — Observable inputs other than quoted prices included within Level 1, including quoted prices for similar assets or liabilities in active markets; quoted prices for identical or similar assets or liabilities in markets that are not active; and inputs other than quoted prices that are observable or are derived principally from, or corroborated by, observable market data by correlation or other means. |
| • | Level 3 — Unobservable inputs that are supported by little or no market activity, are significant to the fair value of the assets or liabilities, and reflect the Company’s own assumptions about the assumptions market participants would use in pricing the asset or liability developed based on the best information available in the circumstances. |
70
The tables below set forth the Company’s financial instruments and liabilities measured at fair value on a recurring basis (in thousands):
June 30, 2016 |
||||||||||||
Fair Value |
Level 1 |
Level 2 |
Level 3 |
|||||||||
Assets: |
||||||||||||
Cash and cash equivalents: |
||||||||||||
Money market funds |
$ | 3,533 | $ | 3,533 | $ | — | $ | — | ||||
Short-term investments: |
||||||||||||
Corporate notes and commercial paper |
26,363 | — | 26,363 | — | ||||||||
U.S. Government agency securities |
20,070 | — | 20,070 | — | ||||||||
Total assets measured and recorded at fair value |
$ | 49,966 | $ | 3,533 | $ | 46,433 | $ | — | ||||
The above table excludes $58.2 million of cash balances on deposit at banks.
June 30, 2015 |
||||||||||||
Fair Value |
Level 1 |
Level 2 |
Level 3 |
|||||||||
Assets: |
||||||||||||
Cash and cash equivalents: |
||||||||||||
Money market funds |
$ | 4,025 | $ | 4,025 | $ | — | $ | — | ||||
Short-term investments: |
||||||||||||
Corporate notes and commercial paper |
8,025 | — | 8,025 | — | ||||||||
Total assets measured and recorded at fair value |
$ | 12,050 | $ | 4,025 | $ | 8,025 | $ | — | ||||
The above table excludes $78.1 million of cash balances on deposit at banks.
There were foreign exchange forward contracts (see Note 15) outstanding as of June 30, 2016 and 2015 which were entered into by the Company on the last day of the period. This fair value is not material.
Money market funds are classified within Level 1 of the fair value hierarchy because they are valued using quoted market prices in active markets. Short-term investments are classified within Level 2 of the fair value hierarchy because they are valued based on other observable inputs, including broker or dealer quotations, or alternative pricing sources. When quoted prices in active markets for identical assets or liabilities are not available, the Company relies on non-binding quotes from independent pricing services. Non-binding quotes are based on proprietary valuation models prepared by independent pricing services. These models use algorithms based on inputs such as observable market data, quoted market prices for similar instruments, historical pricing trends of a security as relative to its peers, internal assumptions of the independent pricing service and statistically supported models. The Company corroborates the reasonableness of non-binding quotes received from the independent pricing service by comparing them to the (a) actual experience gained from the purchases and redemption of investment securities, (b) quotes received on similar securities obtained when purchasing securities and (c) monitoring changes in ratings of similar securities and the related impact on the fair value. The types of instruments valued based on other observable inputs include U.S. government agency securities, corporate bonds, and commercial paper. The Company reviewed financial and non-financial assets and liabilities and concluded that there were no other-than-temporary impairment charges during fiscal 2016 and 2015. The Company reviews the fair value hierarchy on a quarterly basis. Changes in the ability to observe valuation inputs may result in a reclassification of levels of certain securities within the fair value hierarchy. The Company recognizes transfers into and out of levels within the fair value hierarchy as of the date in which the actual event or change in circumstances that caused the transfer occurs. There were no transfers between Level 1 and Level 2 of the fair value hierarchy for any of the periods presented.
Assets and Liabilities That Are Measured at Fair Value on a Nonrecurring Basis
Non-financial assets such as goodwill, intangible assets, and property, plant, and equipment are evaluated for impairment and adjusted to fair value using Level 3 inputs, only when impairment is recognized. Fair values are considered Level 3 when management makes significant assumptions in developing a discounted cash flow model based upon a number of considerations including projections of revenues, earnings and a discount rate. In addition, in evaluating the fair value of goodwill impairment, further corroboration is obtained using the
71
Company’s market capitalization. There were no indicators of impairment during fiscal 2016, 2015 and 2014 that required a nonrecurring fair value analysis to be performed on non-financial assets.
| 7. | LINE OF CREDIT |
On October 22, 2014 the Company entered into an Amended and Restated Credit Agreement which was further amended on December 1, 2014 and again on August 5, 2015 (“New Credit Facility”). This New Credit Facility replaces the Company’s previous credit facility. The New Credit Facility includes a revolving loan facility for an aggregate principal amount not exceeding $100.0 million. The New Credit Facility matures on October 22, 2019 and is payable in full upon maturity. The amounts borrowed and repaid under the New Credit Facility are available for future borrowings. The borrowings under the New Credit Facility accrue interest (at the election of the Company) either at (i) the London interbank offered rate then in effect, plus a margin of between 1.50% and 2.25%, which is based on the Company’s consolidated EBITDA (as defined in the New Credit Facility), or (ii) the higher of (a) the bank’s publicly-announced prime rate then in effect and (b) the federal funds rate plus 0.50%, in each case of (a) or (b), plus a margin of between 0.00% and 0.50%, which will be based upon the Company’s consolidated EBITDA. The Company also pays commitment fees during the term of the New Credit Facility which vary depending on the Company’s consolidated EBITDA. The New Credit Facility is secured by substantially all of the Company’s assets. As of June 30, 2016, the Company had $73.6 million available for borrowing under the New Credit Facility.
The New Credit Facility contains customary affirmative and negative covenants, including compliance with financial ratios and metrics. The New Credit Facility and the related amendment requires the Company to maintain a minimum ratio of liquidity to its indebtedness (each as defined in the New Credit Facility) and varying amounts of Liquidity and Consolidated EBITDA specified in the New Credit Facility throughout the term of the agreement. The Company was in compliance with all such covenants as of June 30, 2016.
As of June 30, 2016, no amounts were outstanding under the New Credit Facility. The Company amortizes deferred financing costs to interest expense on a straight-line basis over the term of the New Credit Facility.
| 8. | NET LOSS PER COMMON SHARE |
Basic net loss per share is determined by dividing net loss by the weighted average number of common shares outstanding during the period. Diluted net loss per common share is determined by dividing net loss by the weighted average number of common shares used in the basic net loss per common share calculation, plus the number of common shares that would be issued assuming conversion of all potentially dilutive securities outstanding under the treasury stock method.
The following table is a reconciliation of the numerators and denominators used in computing basic and diluted net loss per common share (in thousands other than per share amounts):
Year Ended June 30, |
|||||||||
2016 |
2015 |
2014 |
|||||||
Numerator: |
|||||||||
Net loss |
$ | (4,792 | ) |
$ | (4,404 | ) |
$ | (1,051 | ) |
Denominator: |
|||||||||
Weighted average common shares outstanding (basic and diluted) |
66,405 | 63,953 | 61,191 | ||||||
Net loss per share |
|||||||||
Basic and diluted |
$ | (0.07 | ) |
$ | (0.07 | ) |
$ | (0.02 | ) |
Anti-dilutive weighted shares related to stock-based options and awards excluded from the calculation of diluted shares were approximately 4.9 million, 3.8 million, and 4.2 million for the years ended June 30, 2016, 2015 and 2014 respectively.
72
| 9. | INCOME TAXES |
The components of loss before income taxes consist of the following (in thousands):
Year Ended June 30, |
|||||||||
2016 |
2015 |
2014 |
|||||||
Domestic |
$ | (5,375 | ) |
$ | (4,416 | ) |
$ | (1,008 | ) |
Foreign |
1,143 | 973 | 543 | ||||||
Total |
$ | (4,232 | ) |
$ | (3,443 | ) |
$ | (465 | ) |
The provision for income taxes consists of the following (in thousands):
Year Ended June 30, |
|||||||||
2016 |
2015 |
2014 |
|||||||
Current: |
|||||||||
Federal |
$ | (129 | ) |
$ | 159 | $ | 74 | ||
State |
100 | 528 | 336 | ||||||
Foreign |
685 | 299 | 166 | ||||||
Total current income tax |
656 | 986 | 576 | ||||||
Deferred: |
|||||||||
Federal |
17 | — | — | ||||||
State |
2 | — | — | ||||||
Foreign |
(115 | ) |
(25 | ) |
10 | ||||
Total deferred income tax |
(96 | ) |
(25 | ) |
10 | ||||
Provision for income taxes |
$ | 560 | $ | 961 | $ | 586 | |||
The difference between the provision for (benefit from) income taxes and the amount computed by applying the federal statutory income tax rate to loss before benefit from income tax is as follows (in thousands):
Year Ended June 30, |
|||||||||
2016 |
2015 |
2014 |
|||||||
Benefit from income tax at federal statutory rate |
$ | (1,439 | ) |
$ | (1,140 | ) |
$ | (153 | ) |
Non deductible expenses |
385 | 442 | 339 | ||||||
Federal Alternative Minimum Tax |
(129 | ) |
159 | 166 | |||||
Stock-based compensation |
273 | 314 | 84 | ||||||
Fair value of escrow settlement modification |
— | 225 | — | ||||||
Credits |
(1,775 | ) |
(574 | ) |
(590 | ) |
|||
State taxes |
100 | 528 | 337 | ||||||
Other |
201 | (56 | ) |
(102 | ) |
||||
Increase in valuation allowance |
2,944 | 1,063 | 505 | ||||||
Total |
$ | 560 | $ | 961 | $ | 586 | |||
73
Significant components of deferred tax assets consist of the following (in thousands):
June 30, |
||||||
2016 |
2015 |
|||||
Deferred Tax Assets |
||||||
Net operating loss carryforwards |
$ | 29,015 | $ | 26,990 | ||
Tax credit carryforwards |
20,659 | 17,176 | ||||
Stock compensation |
11,295 | 12,105 | ||||
Other |
10,285 | 14,309 | ||||
Gross deferred tax assets |
71,254 | 70,580 | ||||
Valuation allowance |
(69,413 | ) |
(66,213 | ) |
||
Total deferred tax assets |
1,841 | 4,367 | ||||
Deferred Tax Liabilities |
||||||
Acquistion intangibles |
(1,927 | ) |
(4,282 | ) |
||
Total deferred tax liabilities |
(1,927 | ) |
(4,282 | ) |
||
Total net deferred tax assets |
$ | (86 | ) |
$ | 85 | |
During the year ended June 30, 2016, the decrease in the Company’s deferred tax assets of $2.5 million was primarily due to changes in accruals, partially offset by an increase in tax credit and loss carryforwards. In addition, the decrease in the Company’s total deferred tax liabilities of $2.4 million was due to the amortization of the identifiable intangible property. In assessing the realization of deferred tax assets, management considers whether it is more likely than not that some or all of the deferred tax assets will be realized. The realization of deferred tax assets is based on several factors, such as the Company’s history of past earnings, the scheduling of deferred tax liabilities and projected future income from operating activities. As of June 30, 2016, management does not believe it is more likely than not that the net U.S. federal and state deferred tax assets are realizable. The Company intends to maintain the valuation allowance on its net deferred tax assets until sufficient positive evidence exists to support reversal of some or all of the allowance. The Company’s future income tax expense (benefit) will be affected in the event changes to the valuation allowance are required.
During the fourth quarter of fiscal 2016, the Company elected to prospectively adopt ASU 2015-17, Income Taxes (Topic 740): Balance Sheet Classification of Deferred Taxes, resulting in a reclassification of $3.8 million of net current deferred tax assets to the net non-current deferred tax assets in our consolidated balance sheet as of June 30, 2016. The prior reporting periods were not retrospectively adjusted.
The Company had federal net operating loss carryforwards of approximately $93.9 million as of June 30, 2016, which expire at various dates between 2023 and 2036. These net operating loss carryforwards include the effects of a favorable tax ruling determined under Section 382 by the Internal Revenue Service in March 2010 as well as federal net operating loss carryforwards available from prior acquisitions. The Company has not completed Section 382 studies for net operating losses incurred in the years subsequent to July 2007. Upon the completion of these studies, the amount of net operating losses available for utilization may be limited. Included in the net operating loss carryforward is approximately $10.9 million (pretax) of net operating loss attributable to excess stock option deductions. The related tax benefit of $3.7 million, if realized, will be recorded as additional paid-in capital. Including the net operating loss carryforwards available from prior acquisitions, the Company had California and other state net operating loss carryforwards of approximately $14.2 million and $9.4 million, respectively, which expire at various dates between fiscal 2018 and 2036.
As of June 30, 2016, the Company had Federal and California tax credit carryforwards of $16.2 million and $16.2 million, respectively. The federal tax credit carry forwards expire at various dates between 2023 and 2036. The California tax credits may be carried forward indefinitely.
The Company has not provided U.S. income taxes and foreign withholding taxes on the undistributed earnings of foreign subsidiaries because it is management’s intention to permanently reinvest such undistributed earnings outside of the United States. The Company evaluates its circumstances and reassesses this determination on a periodic basis. As of June 30, 2016, the determination of the unrecorded deferred tax liability related to
74
these earnings was not practicable. If circumstances change and it becomes apparent that some or all of the undistributed earnings of the Company's foreign subsidiaries will be remitted in the foreseeable future, the Company will be required to recognize a deferred tax liability on those amounts.
The “Protecting Americans from Tax Hikes (PATH) Act of 2015” (The Act) was enacted on December 18, 2015. The Act permanently extended the R&D credit and extended the 50% bonus depreciation provision though 2019 (through 2020 for certain longer-lived and transportation property).
The Company maintains liabilities for uncertain tax positions. These liabilities involve considerable judgment and estimation and are continuously monitored by management based on the best information available, including changes in tax regulations, the outcome of relevant court cases, and other pertinent information. As of June 30, 2016, 2015 and 2014, the Company's total amount of unrecognized tax benefit was approximately $6.3 million, $5.1 million and $4.2 million, respectively.
The aggregate annual changes in the balance of gross unrecognized tax benefits are as follows (in thousands):
Year Ended June 30, |
|||||||||
2016 |
2015 |
2014 |
|||||||
Beginning balance |
$ | 5,065 | $ | 4,165 | $ | 4,060 | |||
Decrease in tax positions for prior years |
(24 | ) |
— | (471 | ) |
||||
Increase in tax positions for current year |
1,233 | 900 | 576 | ||||||
Ending balance |
$ | 6,274 | $ | 5,065 | $ | 4,165 | |||
As of June 30, 2016, the Company's total amount of unrecognized tax benefit was approximately $6.3 million, of which, only $0.2 million, if recognized, would impact the effective tax rate. The Company does not expect its unrecognized tax benefits to change materially over the next 12 months.
While management believes that the Company has adequately provided for all tax positions, amounts asserted by tax authorities could be greater or less than the recorded position. Accordingly, the Company’s provisions on federal, state and foreign tax-related matters to be recorded in the future may change as revised estimates are made or the underlying matters are settled or otherwise resolved.
The Company’s primary tax jurisdiction is the United States. For federal and state tax purposes, the tax years 2001 through 2014 remain open and subject to tax examination by the appropriate federal or state taxing authorities.
| 10. | COMMON STOCK |
Common Shares Reserved for Issuance
At June 30, 2016, the Company had reserved shares of common stock for issuance as follows (in thousands):
Reserved under stock option plans |
14,596 | ||
Reserved under employee stock purchase plan |
378 | ||
Total |
14,974 |
| 11. | EMPLOYEE BENEFIT PLANS |
Equity Stock Incentive Plans
The Company grants nonqualified (“NQSO”) and incentive stock options (“ISOs”), restricted stock awards, and restricted stock units to officers, directors, employees and consultants under the 2015 Equity Incentive Plan (“2015 Plan”), which is the successor to the 2007 Equity Incentive Plan (“2007 Plan”). The 2015 Plan provides for the granting of ISOs and NQSOs for over a period not to exceed ten years and at exercise prices that are not less than 100% and 85%, respectively, of the estimated fair market value of the Company’s common stock on the date of grant as determined by the Board of Directors. The 2007 Plan provided for the granting of ISOs and NQSOs for over a period not to exceed ten years and at exercise prices that are not less than 100% of the
75
estimated fair market value of the Company’s common stock on the date of grant as determined by the Board of Directors. Stock options issued under the 2015 Plan and 2007 Plan generally vest 25% at one year and then 1/36th monthly thereafter, and restricted stock units issued under the 2015 Plan and 2007 Plan generally vest 25% at one, two, three and four years.
The 2007 Plan provided for automatic annual increases of shares available for issuance. In fiscal 2015, the Board of Directors increased the number of shares authorized and available for issuance under the 2007 Plan by 3.2 million shares pursuant to the automatic increase provision. The Company has ceased making grants under the 2007 Plan upon adoption of the 2015 Plan. As of June 30, 2016, the Company had 6.4 million shares of common stock available for future issuance under the 2015 Plan.
The following table summarizes the Company’s stock option activities for the fiscal year ended June 30, 2016 (in thousands, except per share amounts):
Shares Subject to Options Outstanding |
Weighted- Average Exercise Price |
Weighted- Average Remaining Contractual Term (in years) |
Aggregate Intrinsic Value |
|||||||||
Balance at July 1, 2015 |
6,263 | $ | 5.72 | |||||||||
Options granted |
1,836 | $ | 7.42 | |||||||||
Options exercised |
(1,341 | ) |
$ | 4.87 | ||||||||
Options cancelled/forfeited |
(490 | ) |
$ | 6.79 | ||||||||
Balance at June 30, 2016 |
6,268 | $ | 6.31 | 6.77 | $ | 5,378 | ||||||
Options exercisable at June 30, 2016 |
3,469 | $ | 5.86 | 5.41 | $ | 4,499 | ||||||
Vested and expected to vest at June 30, 2016 |
5,388 | $ | 6.19 | 6.47 | $ | 5,232 | ||||||
The weighted-average grant-date fair value of options granted during the years ended June 30, 2016, 2015, and 2014 was $3.22, $3.02, and $2.86, respectively. The total intrinsic value of options exercised in the years ended June 30, 2016, 2015, and 2014 was $4.9 million, $3.2 million, and $7.3 million, respectively, and represents the difference between the fair value of the Company’s common stock at the dates of exercise and the exercise price of the options.
The following table summarizes information about outstanding and exercisable options at June 30, 2016 (in thousands, except years and exercise prices):
Options Outstanding |
Options Exercisable |
||||||||||||||
Exercise Prices |
Number Outstanding |
Weighted Average Remaining Contractual Life (Years) |
Weighted Average Exercise Price |
Number Outstanding |
Weighted Average Exercise Price |
||||||||||
$3.20 - 4.25 |
523 | 5.02 | $ | 3.94 | 458 | $ | 3.94 | ||||||||
$4.31 |
710 | 6.73 | 4.31 | 571 | 4.31 | ||||||||||
$4.35 - 5.08 |
677 | 4.84 | 4.66 | 606 | 4.68 | ||||||||||
$5.10 - 6.39 |
655 | 5.77 | 5.48 | 479 | 5.42 | ||||||||||
$6.40 - 6.61 |
760 | 7.16 | 6.58 | 423 | 6.57 | ||||||||||
$6.62 - 7.10 |
680 | 8.20 | 6.78 | 203 | 6.70 | ||||||||||
$7.11 - 7.35 |
804 | 8.50 | 7.31 | 14 | 7.26 | ||||||||||
$7.41 - 7.60 |
627 | 9.02 | 7.44 | 53 | 7.45 | ||||||||||
$7.63 - 9.98 |
669 | 6.12 | 8.56 | 499 | 8.35 | ||||||||||
$10.37 - 13.73 |
163 | 2.15 | 11.20 | 163 | 11.20 | ||||||||||
Total |
6,268 | 6.77 | $ | 6.31 | 3,469 | $ | 5.86 | ||||||||
76
Stock-based Compensation
The Company estimates the fair value of stock options using the Black-Scholes option-pricing model, which requires the use of the following assumptions: (i) the expected volatility of the Company’s common stock, which is based on a blended rate of the Company’s own common stock volatility and the volatility data of certain peer companies; (ii) the expected term which is the period that the Company’s stock-based awards are expected to be outstanding based on Company’s actual historic grant, exercise, and post-vesting forfeiture data; (iii) an expected dividend yield, which is assumed to be 0% as the Company has not paid and, as of the date of grant, did not anticipate paying dividends in the foreseeable future; and (iv) a risk-free interest rate, which is based on the U.S. Treasury yield curve in effect on the date of grant for zero coupon U.S. Treasury notes with maturities approximately equal to expected term of the option award. The fair value of each option is estimated on the date of grant using the Black-Scholes option valuation method, with the following assumptions:
|
|
Year Ended June 30,
|
||
|
|
2016
|
2015
|
2014
|
|
Expected life from grant date of option
|
5.09-5.13 years
|
5.04-5.09 years
|
4.98-5.44 years
|
|
Risk-free interest rate
|
1.24-1.59%
|
1.45-1.70%
|
1.44-1.66%
|
|
Expected volatility
|
46-48%
|
49-50%
|
51-66%
|
|
Expected dividend yield
|
0%
|
0%
|
0%
|
As of June 30, 2016 total unrecognized compensation cost related to stock options granted to employees and non-employee directors was $3.4 million, net of estimated forfeitures, which the Company expects to recognize over 2.6 years.
Employee Stock Purchase Plan
The employee stock purchase plan (the “ESPP”) allows eligible employees to purchase shares of the Company's common stock at a discount through payroll deductions. The ESPP consists of six-month offering periods commencing on May 1st and November 1st of each year. Under the ESPP, employees purchase shares of the Company's common stock at 85% of the market value at either the beginning of the offering period or the end of the offering period, whichever price is lower.
In February of fiscal 2016 and 2015, pursuant to the automatic increase provisions of the ESPP, the Company’s Board of Directors approved increases to the number of shares authorized and reserved for issuance under the ESPP by 393,538 shares and 641,464 shares, respectively.
The fair value of stock purchase rights granted under the ESPP is estimated using the Black-Scholes option pricing model, based on the following assumptions:
|
|
Year Ended June 30,
|
||
|
|
2016
|
2015
|
2014
|
|
Expected life from grant date of ESPP
|
0.50 years
|
0.50 years
|
0.50 years
|
|
Risk-free interest rate
|
0.14-0.41%
|
0.06-0.09%
|
0.06-0.10%
|
|
Expected volatility
|
29-37%
|
35-43%
|
43-48%
|
|
Expected dividend yield
|
0%
|
0%
|
0%
|
Expenses related to shares issued under the ESPP are included in stock-based compensation expense. The Company issued 737,806 shares and 670,329 shares under the ESPP in fiscal 2016 and 2015, respectively, at a weighted average price per share of $5.51 and $6.19, respectively. As of June 30, 2016, total unrecognized compensation cost related to the ESPP plan was $0.4 million, which the Company expects to recognize over 0.5 years.
77
Restricted Stock Awards and Restricted Stock Units
Restricted stock award and restricted stock unit activity for the year ended June 30, 2016 is as follows (in thousands):
Shares |
Weighted- Average Grant Date Fair Value |
|||||
Outstanding - July 1, 2015 |
1,452 | $ | 6.07 | |||
Awarded |
1,254 | 7.59 | ||||
Released |
(552 | ) |
6.12 | |||
Forfeited |
(227 | ) |
6.47 | |||
Outstanding - June 30, 2016 |
1,927 | $ | 6.99 | |||
The grant-date fair value of restricted stock units granted during fiscal 2016, 2015 and 2014 was $9.3 million, $5.8 million and $4.5 million, respectively.
As permitted under the 2007 Plan, in fiscal 2016, the Company issued 26,773 shares of restricted stock awards, with a fair value of $0.2 million, to non-employee directors electing to receive them in lieu of an annual cash retainer. These shares were issued quarterly and vest immediately upon issuance.
As of June 30, 2016, total unrecognized compensation cost related to restricted stock awards and units awarded to employees and directors was $4.2 million, net of estimated forfeitures, which the Company expects to recognize over 2.6 years.
12. TREASURY STOCK
In May 2016, the Board of Directors authorized the repurchase of up to $20.0 million of the Company's common stock from time to time at the discretion of our management. This stock repurchase authorization has no expiration date.
Under these programs, the Company may repurchase shares in the open market and through privately negotiated transactions. Repurchases are funded with cash and cash generated from operations. The timing and amount of specific repurchase transactions will depend upon market conditions, corporate considerations and applicable legal and regulatory requirements. The Company accounts for repurchased shares of common stock as treasury stock. Treasury shares are recorded at cost and are included as a component of stockholders’ equity in our consolidated balance sheet.
A summary of the approved and active share buyback program is shown in the following table (in thousands, excluding transaction costs):
Shares Repurchased |
Average Price per Share |
Value of Shares Repurchased |
Remaining Amount Authorized |
|||||||||
(In thousands, except per share amounts) |
||||||||||||
Balance as of July 1, 2015 |
$ | — | ||||||||||
Authorization of repurchase shares in May 2016 |
20,000 | |||||||||||
Repurchase of common stock |
(126 | ) |
$ | 6.49 | $ | 819 | (819 | ) |
||||
Balance as of June 30, 2016 |
$ | 19,181 | ||||||||||
There were no share repurchases in fiscal 2015 or 2014.
There were no retirements of treasury stock during fiscal years 2016, 2015, and 2014.
| 13. | LITIGATION, COMMITMENTS AND CONTINGENCIES |
Litigation — As of June 30, 2016, the Company is involved in litigation relating to claims arising out of the ordinary course of business or otherwise. Any litigation, regardless of outcome, is costly and time-consuming, can divert the attention of management and key personnel from business operations, deter distributors from
78
selling the Company’s products and dissuade potential customers from purchasing the Company’s products. The Company defends itself vigorously against any such claims. With the exception of the items specifically noted herein, due to the uncertainty surrounding the litigation process, the Company is unable to estimate a range of loss, if any, at this time, however the Company does not believe a material loss is probable.
On September 15, 2011, a lawsuit was filed against the Company and several other companies in the United States District Court for the Eastern District of Texas by a patent holding company alleging patent infringement. On July 22, 2015, the Company and the plaintiff executed settlement and license agreements. On July 23, 2015, the Company and the plaintiff filed a stipulation with the Court to dismiss all claims and counterclaims with prejudice, which the Court granted on July 31, 2015. The Company recorded a $1.0 million charge related to past damages related to the settlement and license agreements. This charge is classified as product cost of revenue within the consolidated statement of operations for the fiscal year ended June 30, 2015. The settlement and license agreements also include an ongoing royalty on certain products which are not expected to have a material impact on the Company’s financial results.
Arbitration — In addition, on March 21, 2013, the Company provided Fortis Advisors LLC (“Fortis”), as representative of the former shareholders of M5 Networks, Inc. (“M5”), with a Claim Certificate disclosing certain claims for indemnification under the January 31, 2012 Agreement and Plan of Reorganization between M5 and the Company (the “Purchase Agreement”). Thereafter, the Company and Fortis engaged in negotiations in an attempt to resolve the indemnification claims asserted by the Company. In September 2013, the Company received notice of commencement of an arbitration proceeding by Fortis on behalf of the former shareholders of M5. Through the arbitration, Fortis sought a declaration that the Company’s claims for indemnification be precluded. On October 11, 2013, the Company served its response, denying all of Fortis’ allegations and asserting counterclaims for breach of the Purchase Agreement and declaratory relief. The arbitrator held a hearing with the parties from October 13, 2014 through October 16, 2014, addressing certain of the Company’s claims. The arbitrator issued his ruling on the matter on December 5, 2014.
On February 19, 2015, the Company and Fortis entered into an agreement to settle the escrow claim with a payout in cash to the Company in the amount of $2.1 million, with all other cash and shares held in escrow being released to the former shareholders of M5. As the settlement payout ratio of cash and stock mix differed from the Purchase Agreement, the Company recognized a $0.7 million modification accounting charge related to the change in fair value of foregone stock per the Purchase Agreement. The fair value of the common stock was measured using the closing price of our common stock as of February 19, 2015, the final settlement date.
Per the Purchase Agreement, the non-prevailing party was required to reimburse professional fees of the prevailing party. The arbitration ruling in December 2014 determined the former M5 shareholders to be the prevailing party, thus the Company was deemed to be required to reimburse professional fees incurred by former M5 shareholders related to the escrow proceedings. The Company and Fortis entered into an agreement to settle the professional fee reimbursement for $2.5 million, as such, the Company recognized this amount as a professional fee reimbursement charge classified as settlements and defense fees within the consolidated statement of operations for the fiscal year ended June 30, 2015.
Indemnification asset — As a result of the arbitration settlement made between the parties noted above, the Company recorded an impairment of the related indemnification asset to adjust the carrying value to the amount it realized from the related escrow proceeds. During fiscal 2015, the Company recorded an impairment charge of $3.6 million classified as settlements and defense fees within the consolidated statement of operations. The carrying amount of the indemnification asset was zero at June 30, 2015 as the settlement amount of $2.1 million was received during the fiscal year ended June 30, 2015.
Contingencies — During the three months ended December 31, 2014 the Internal Revenue Service (“IRS”) issued a Notice of Proposed Adjustment (“NOPA”) resulting from a withholding tax audit of payments made to non-U.S. vendors during calendar years 2008 through 2012. The NOPA asserts a liability for under-withheld tax of approximately $2.0 million, plus related penalties and estimated interest of approximately $1.3 million. While the Company disagrees with a majority of the IRS’ assertions and proposed liability, the Company accrued for the probable liability and recorded an expense classified as settlements and defense fees within the consolidated statement of operations of $0.1 million and $1.1 million for the fiscal years ended June 30, 2016 and 2015.
Settlements and defense fees — Settlements and defense fees within the consolidated statement of operations of $0.1 million for the fiscal year ended June 30, 2016 were comprised of an IRS proposed adjustment.
79
Settlements and defense fees within the consolidated statement of operations of $8.5 million for the fiscal year ended June 30, 2015 were comprised of a $3.6 million impairment of the indemnification asset charge, a $2.5 million charge for professional fee reimbursement, a $0.7 million modification accounting charge related to the change in fair value of foregone stock per the Purchase Agreement, $1.1 million related to an IRS proposed adjustment and $0.6 million in professional fees incurred in connection with an unsolicited acquisition proposal. There were no corresponding charges for fiscal 2014.
Leases - The Company leases its facilities under noncancelable operating leases which expire at various times through 2023. The leases provide for the lessee to pay all costs of utilities, insurance, and taxes. Future minimum lease payments under the noncancelable operating leases as of June 30, 2016, are as follows (in thousands):
Years Ending June 30, |
Operating leases |
||
2017 |
$ | 7,744 | |
2018 |
6,749 | ||
2019 |
5,289 | ||
2020 |
3,873 | ||
2021 |
2,097 | ||
Therafter |
1,724 | ||
Total minimum lease payments |
$ | 27,476 | |
Lease obligations for the Company’s foreign offices are denominated in foreign currencies, which were converted to U.S. dollars at the interbank exchange rate on June 30, 2016.
Rent expense for the years ended June 30, 2016, 2015, and 2014, was $5.4 million, $5.6 million and $4.2 million, respectively.
Purchase commitments - The Company had purchase commitments with contract manufacturers for inventory and with technology firms for usage of software licenses totaling approximately $15.4 million and $14.9 million as of June 30, 2016 and 2015, respectively.
Indemnification - Under the indemnification provisions of the Company’s customer agreements, the Company agrees to indemnify and defend its customers against infringement of any patent, trademark, or copyright or the misappropriation of any trade secret, arising from the customers’ legal use of the Company’s services. The exposure to the Company under these indemnification provisions is generally limited to the total amount paid by the customers under pertinent agreements. However, certain indemnification provisions potentially expose the Company to losses in excess of the aggregate amount received from the customer.
The Company also has entered into customary indemnification agreements with each of its officers and directors.
| 14. | SEGMENT INFORMATION |
ASC Topic 280, Segment Reporting, establishes standards for reporting information about operating segments, products and services, geographic areas of operations and major customers. Operating segments are defined as components of an enterprise for which separate financial information is available and evaluated regularly by the chief operating decision maker or decision making group in deciding how to allocate resources and in assessing performance. The Company’s chief operating decision-maker is its Chief Executive Officer (“CEO”). The CEO reviews financial information presented on a consolidated basis for purposes of making operating decisions and assessing financial performance. On this basis, the Company is organized and operates in a single segment: the design, development, marketing, and sale of business communication solutions.
Revenue by geographic region is based on the ship to address on the customer order. The following presents total revenue by geographic region (in thousands):
Year Ended June 30, |
|||||||||
2016 |
2015 |
2014 |
|||||||
United States of America |
$ | 330,841 | $ | 330,318 | $ | 307,116 | |||
International |
29,443 | 29,352 | 31,183 | ||||||
Total |
$ | 360,284 | $ | 359,670 | $ | 338,299 | |||
80
Revenue from one value-added distributor accounted for approximately 27%, 26% and 25% of the total revenue during the years ended June 30, 2016, 2015 and 2014, respectively.
The following presents a summary by geographic region of long-lived assets, excluding deferred tax assets, other assets, and intangible assets (in thousands):
As at June 30, |
||||||
2016 |
2015 |
|||||
United States of America |
$ | 20,323 | $ | 19,505 | ||
International |
1,228 | 914 | ||||
Total |
$ | 21,551 | $ | 20,419 | ||
| 15. | DERIVATIVE INSTRUMENTS AND HEDGING ACTIVITIES |
In the normal course of business, the Company is exposed to fluctuations in interest rates and the exchange rates associated with foreign currencies. During fiscal 2016, the Company used derivative instruments to reduce the volatility of earnings associated with changes in foreign currency exchange rates. The Company used foreign exchange forward contracts to mitigate the gains and losses generated from the re-measurement of certain foreign monetary assets and liabilities, primarily including cash balances, third party accounts receivable and intercompany transactions recorded on the balance sheet. These derivatives are not designated and do not qualify as hedge instruments. Accordingly, changes in the fair value of these instruments are recognized in other income and expenses during the period of change. These derivatives have maturities of approximately one month. The foreign exchange forward contracts outstanding as of June 30, 2016 were entered into by the Company on the last business day of the period. Given the relatively short duration such contracts are outstanding in relation to changes in potential market rates; the change in the fair value is not material and is not reflected either as an asset or a liability.
The following table presents the gross notional value of all our foreign exchange forward contracts outstanding as of June 30, 2016 and 2015 (in thousands).
June 30, 2016 |
||||||
Local Currency Amount |
Notional Contract Amount (USD) |
|||||
Australian dollar |
$ | 1,800 | $ | 1,316 | ||
British pound |
£ | 830 | 1,088 | |||
Canadian dollar |
$ | 940 | 718 | |||
Euro |
€ | 1,500 | 1,650 | |||
Total |
$ | 4,772 | ||||
June 30, 2015 |
||||||
Local Currency Amount |
Notional Contract Amount (USD) |
|||||
Australian dollar |
$ | 2,420 | $ | 1,840 | ||
British pound |
£ | 910 | 1,429 | |||
Canadian dollar |
$ | 750 | 596 | |||
Euro |
€ | 1,550 | 1,708 | |||
Total |
$ | 5,573 | ||||
| 16. | EMPLOYEE 401(K) PLAN |
Employee 401(k) Plan - The Company adopted a defined contribution retirement plan which has been determined by the Internal Revenue Service (“IRS”) to be qualified as a 401(k) plan (the “Plan”). The Plan covers substantially all employees. The Plan provides for voluntary tax deferred contributions of 1-20% of gross compensation, subject to certain IRS limitations. Effective January 1, 2015, the Company began matching employee contributions to the Plan on a dollar for dollar basis up to a maximum amount of $1,500 per year.
81
Employer matching contributions made by the Company vest immediately. Our employer matching contributions to the Plan were $1.1 million and $0.5 million for the fiscal year ended June 30, 2016 and 2015, respectively. There were no such contributions made during fiscal 2014.
| 17. | QUARTERLY FINANCIAL DATA (Unaudited) |
The following table summarizes the Company’s information on total revenue, gross profit, net income (loss) and earnings per share by quarter for the fiscal years ended June 30, 2016 and 2015. This data was derived from the Company’s unaudited consolidated financial statements.
Three Months Ended |
||||||||||||||||||||||||
Jun. 30, 2016 |
Mar. 31, 2016 |
Dec. 31, 2015 |
Sept. 30, 2015 |
Jun. 30, 2015 |
Mar. 31, 2015 |
Dec. 31, 2014 |
Sept. 30, 2014 |
|||||||||||||||||
(In thousands, except per share amounts) |
||||||||||||||||||||||||
Total revenue |
$ | 94,592 | $ | 85,236 | $ | 90,431 | $ | 90,025 | $ | 94,168 | $ | 84,743 | $ | 90,607 | $ | 90,152 | ||||||||
Gross profit |
59,487 | 52,436 | 57,885 | 58,012 | 59,607 | 49,922 | 55,270 | 53,764 | ||||||||||||||||
Net income (loss) |
(744 | ) |
(8,707 | ) |
2,545 | 2,114 | 4,727 | (2,621 | ) |
(6,862 | ) |
352 | ||||||||||||
Basic net income (loss) per common share |
$ | (0.01 | ) |
$ | (0.13 | ) |
$ | 0.04 | $ | 0.03 | $ | 0.07 | $ | (0.04 | ) |
$ | (0.11 | ) |
$ | 0.01 | ||||
Diluted net income (loss) per common share |
$ | 0.01 | $ | (0.13 | ) |
$ | 0.04 | $ | 0.03 | $ | 0.07 | $ | (0.04 | ) |
$ | (0.11 | ) |
$ | 0.01 | |||||
82
| ITEM 9. | CHANGES IN AND DISAGREEMENTS WITH ACCOUNTANTS ON ACCOUNTING AND FINANCIAL DISCLOSURE |
None.
| ITEM 9A. | CONTROLS AND PROCEDURES |
Evaluation of Disclosure Controls and Procedures
Under the supervision and with the participation of our management, including our Chief Executive Officer (“CEO”) and our Chief Financial Officer (“CFO”), we conducted an evaluation of our disclosure controls and procedures (as defined in Rules 13a-15(e) and 15d-15(e) under the Securities Exchange Act of 1934 (Exchange Act), as of the end of the period covered by this Annual Report on Form 10-K. Based upon that evaluation, our CEO and our CFO have concluded that the design and operation of our disclosure controls and procedures were effective to ensure that information required to be disclosed by us in reports that we file or submit under the Exchange Act (i) is recorded, processed, summarized and reported within the time periods specified in Securities and Exchange Commission rules and forms and (ii) is accumulated and communicated to our management, including our CEO and CFO, as appropriate to allow timely decisions regarding required disclosure.
Changes in Internal Control over Financial Reporting
As required by Rule 13a-15(d) of the Exchange Act, our management, including our Chief Executive Officer and Chief Financial Officer, conducted an evaluation of our “internal control over financial reporting” as defined in Exchange Act Rule 13a-15(f) to determine whether any changes in our internal control over financial reporting occurred during the fourth quarter of fiscal 2016 that materially affected, or are reasonably likely to materially affect, our internal control over financial reporting. Based on that evaluation, there have been no such changes during the fourth quarter of fiscal 2016.
Management’s Report on Internal Control Over Financial Reporting
Our management is responsible for establishing and maintaining adequate internal control over financial reporting (as defined in Rules 13a-15(f) and 15d-15(f) under the Securities Exchange Act of 1934). Our internal control over financial reporting is designed to provide reasonable assurance regarding the reliability of financial reporting and the preparation of financial statements for external purposes in accordance with generally accepted accounting principles.
Under the supervision and with the participation of our management, including our principal executive officer and principal financial officer, we conducted an evaluation of the effectiveness of our internal control over financial reporting based on the framework set forth in Internal Control — Integrated Framework issued by the Committee of Sponsoring Organizations of the Treadway Commission. Our assessment excluded internal control over financial reporting of M5 Networks Australia Pty Ltd. and Corvisa LLC which were acquired on November 16, 2015 and January 6, 2016, respectively, and whose financial results constituted 0.5% and 0.4% of our consolidated revenue for the year ended June 30, 2016, respectively. Based on our evaluation under the framework set forth in Internal Control — Integrated Framework (2013), our management concluded that our internal control over financial reporting was effective as of June 30, 2016.
The effectiveness of our internal control over financial reporting as of June 30, 2016 has been audited by Deloitte & Touche LLP, an independent registered public accounting firm, as stated in its report which appears below.
Inherent Limitations on Effectiveness of Controls
Our management, including our CEO and CFO, does not expect that our disclosure controls and procedures or our internal controls will prevent all errors and all fraud. A control system, no matter how well conceived and operated, can provide only reasonable, not absolute, assurance that the objectives of the control system are met. Further, the design of a control system must reflect the fact that there are resource constraints, and the benefits of controls must be considered relative to their costs. Our disclosure controls and procedures and our internal controls over financial reporting have been designed to provide reasonable assurance of achieving their objectives. Because of the inherent limitations in all control systems, no evaluation of controls can provide absolute assurance that all control issues and instances of fraud, if any, have been detected.
83
REPORT OF INDEPENDENT REGISTERED PUBLIC ACCOUNTING FIRM
To the Board of Directors and Stockholders of
ShoreTel, Inc.
Sunnyvale, California
We have audited the internal control over financial reporting of ShoreTel, Inc. and subsidiaries (the “Company”) as of June 30, 2016, based on the criteria established in Internal Control — Integrated Framework (2013) issued by the Committee of Sponsoring Organizations of the Treadway Commission. As described in Management’s Report on Internal Control over Financial Reporting, management excluded internal control over financial reporting of M5 Networks Australia Pty Ltd. and Corvisa LLC which were acquired on November 16, 2015 and January 6, 2016, respectively, and whose financial results constituted 0.5% and 0.4% of the Company’s consolidated revenue for the year ended June 30, 2016, respectively. Accordingly, our audit did not include the internal control over financial reporting at M5 Networks Australia Pty Ltd. and Corvisa LLC. The Company's management is responsible for maintaining effective internal control over financial reporting and for its assessment of the effectiveness of internal control over financial reporting, included in the accompanying Management’s Report on Internal Control over Financial Reporting. Our responsibility is to express an opinion on the Company's internal control over financial reporting based on our audit.
We conducted our audit in accordance with the standards of the Public Company Accounting Oversight Board (United States). Those standards require that we plan and perform the audit to obtain reasonable assurance about whether effective internal control over financial reporting was maintained in all material respects. Our audit included obtaining an understanding of internal control over financial reporting, assessing the risk that a material weakness exists, testing and evaluating the design and operating effectiveness of internal control based on the assessed risk, and performing such other procedures as we considered necessary in the circumstances. We believe that our audit provides a reasonable basis for our opinion.
A company's internal control over financial reporting is a process designed by, or under the supervision of, the company's principal executive and principal financial officers, or persons performing similar functions, and effected by the company's board of directors, management, and other personnel to provide reasonable assurance regarding the reliability of financial reporting and the preparation of financial statements for external purposes in accordance with generally accepted accounting principles. A company's internal control over financial reporting includes those policies and procedures that (1) pertain to the maintenance of records that, in reasonable detail, accurately and fairly reflect the transactions and dispositions of the assets of the company; (2) provide reasonable assurance that transactions are recorded as necessary to permit preparation of financial statements in accordance with generally accepted accounting principles, and that receipts and expenditures of the company are being made only in accordance with authorizations of management and directors of the company; and (3) provide reasonable assurance regarding prevention or timely detection of unauthorized acquisition, use, or disposition of the company's assets that could have a material effect on the financial statements.
Because of the inherent limitations of internal control over financial reporting, including the possibility of collusion or improper management override of controls, material misstatements due to error or fraud may not be prevented or detected on a timely basis. Also, projections of any evaluation of the effectiveness of the internal control over financial reporting to future periods are subject to the risk that the controls may become inadequate because of changes in conditions, or that the degree of compliance with the policies or procedures may deteriorate.
In our opinion, the Company maintained, in all material respects, effective internal control over financial reporting as of June 30, 2016, based on the criteria established in Internal Control — Integrated Framework (2013) issued by the Committee of Sponsoring Organizations of the Treadway Commission.
We have also audited, in accordance with the standards of the Public Company Accounting Oversight Board (United States), the consolidated financial statements as of and for the year ended June 30, 2016 of the Company and our report dated September 12, 2016 expressed an unqualified opinion on those financial statements.
/s/ DELOITTE & TOUCHE LLP
San Jose, California
September 12, 2016
84
| ITEM 9B. | OTHER INFORMATION |
None.
PART III
| ITEM 10. | DIRECTORS, EXECUTIVE OFFICERS AND CORPORATE GOVERNANCE |
The information required by this item is incorporated by reference to our definitive Proxy Statement for the 2016 Annual Meeting of Stockholders to be filed with the SEC within 120 days after the end of our fiscal year ended June 30, 2016.
| ITEM 11. | EXECUTIVE COMPENSATION |
The information required by this item is incorporated by reference to our definitive Proxy Statement for the 2016 Annual Meeting of Stockholders to be filed with the SEC within 120 days after the end of our fiscal year ended June 30, 2016.
| ITEM 12. | SECURITY OWNERSHIP OF CERTAIN BENEFICIAL OWNERS AND MANAGEMENT AND RELATED STOCKHOLDER MATTERS |
The information required by this item is incorporated by reference to our definitive Proxy Statement for the 2016 Annual Meeting of Stockholders to be filed with the SEC within 120 days after the end of our fiscal year ended June 30, 2016.
| ITEM 13. | CERTAIN RELATIONSHIPS AND RELATED TRANSACTIONS, AND DIRECTOR INDEPENDENCE |
The information required by this item is incorporated by reference to our definitive Proxy Statement for the 2016 Annual Meeting of Stockholders to be filed with the SEC within 120 days after the end of our fiscal year ended June 30, 2016.
| ITEM 14. | PRINCIPAL ACCOUNTING FEES AND SERVICES |
The information required by this item is incorporated by reference to our definitive Proxy Statement for the 2016 Annual Meeting of Stockholders to be filed with the SEC within 120 days after the end of our fiscal year ended June 30, 2016.
PART IV
| ITEM 15. | EXHIBITS, FINANCIAL STATEMENT SCHEDULES |
(a) (1) Financial Statements - See Index to Financial Statements in Item 8 of this Report.
(2) Financial Statement Schedule - Financial statement schedules have been omitted because the required information is not present or not present in amounts sufficient to require submission of the schedule, or because the information required is included in the financial statements or the notes to those financial statements.
(3) Exhibits - See Exhibit Index following the signature page of this Report.
85
Pursuant to the requirements of Section 13 or 15(d) of the Securities Exchange Act of 1934, the registrant has duly caused this Annual Report on Form 10-K to be signed on its behalf by the undersigned, thereunto duly authorized, on this 12th day of September 2016.
|
|
ShoreTel, Inc.
|
|
|
|
|
|
|
|
By:
|
/s/ MICHAEL E. HEALY
|
|
|
|
Michael E. Healy
|
|
|
|
Chief Financial Officer
|
86
POWER OF ATTORNEY
KNOW ALL PERSONS BY THESE PRESENTS that each individual whose signature appears below constitutes and appoints Allen Seto and Michael E. Healy, his or her true and lawful attorney-in-fact and agent with full power of substitution, for him or her and in his or her name, place and stead, in any and all capacities, to sign any and all amendments to this Annual Report on Form 10-K, with all exhibits thereto and all documents in connection therewith, with the Securities and Exchange Commission, granting unto said attorney-in-fact and agent, full power and authority to do and perform each and every act and thing requisite and necessary to be done in and about the premises, as fully to all intents and purposes as he or she might or could do in person, hereby ratifying and confirming all that said attorney-in-fact and agent, or his or her substitute or substitutes, may lawfully do or cause to be done by virtue hereof.
Pursuant to the requirements of the Securities Exchange Act of 1934, this Annual Report on Form 10-K has been signed below by the following persons on behalf of the registrant and in the capacities and on the dates indicated.
|
Name
|
Title
|
Date
|
|
/s/ DON JOOS
|
President and
Chief Executive Officer and Director (Principal Executive Officer) |
September 12, 2016
|
|
Don Joos
|
|
|
|
|
|
|
|
/s/ MICHAEL E. HEALY
|
Chief Financial Officer
(Principal Financial Officer) |
September 12, 2016
|
|
Michael E. Healy
|
|
|
|
|
|
|
|
/s/ KEITH A. JONES
|
Worldwide Corporate Controller
(Principal Accounting Officer) |
September 12, 2016
|
|
Keith A. Jones
|
|
|
|
|
|
|
|
/s/ CHARLES D. KISSNER
|
Chairperson of the Board
|
September 12, 2016
|
|
Charles D. Kissner
|
|
|
|
|
|
|
|
/s/ MARJORIE BOWEN
|
Director
|
September 12, 2016
|
|
Marjorie Bowen
|
|
|
|
|
|
|
|
/s/ MARK F. BREGMAN
|
Director
|
September 12, 2016
|
|
Mark F. Bregman
|
|
|
|
|
|
|
|
/s/ KENNETH DENMAN
|
Director
|
September 12, 2016
|
|
Kenneth Denman
|
|
|
|
|
|
|
|
/s/ SHANE ROBISON
|
Director
|
September 12, 2016
|
|
Shane Robison
|
|
|
|
|
|
|
|
/s/ CONSTANCE SKIDMORE
|
Director
|
September 12, 2016
|
|
Constance Skidmore
|
|
|
|
|
|
|
|
/s/ EDWARD F. THOMPSON
|
Director
|
September 12, 2016
|
|
Edward F. Thompson
|
|
|
|
|
|
|
|
/s/ JOSEF VEJVODA
|
Director
|
September 12, 2016
|
|
Josef Vejvoda
|
|
|
87
|
Exhibit
Number |
Exhibit Title
|
|
2.1
|
Membership Interest Purchase Agreement by and among ShoreTel, Inc., Corvisa Services LLC and Novation Companies, Inc., dated as of December 21, 2015 (incorporated by reference to Exhibit 2.1 of the Company’s Form 8-K filed on January 8, 2016).
|
|
|
|
|
3.1
|
Third Restated Certificate of Incorporation of the Company (incorporated by reference to Exhibit 3.01 of the Company’s Annual Report on Form 10-K for the year ended June 30, 2007 filed on September 27, 2007).
|
|
|
|
|
3.2
|
Fourth Amended and Restated Bylaws of the Company (incorporated by reference to Exhibit 3.1 of the Company’s Form 8-K filed on September 15, 2014).
|
|
|
|
|
4.1
|
Form of the Company’s Common Stock certificate (incorporated by reference to Exhibit 4.1 of Amendment No. 5 to the Company’s Registration Statement on Form S-1 (File No. 333-140630)).
|
|
|
|
|
10.1+
|
Form of Indemnity Agreement between the Company and each of its directors and executive officers (incorporated by reference to Exhibit 10.1 of Amendment No. 1 to the Company’s Registration Statement on Form S-1 (File No. 333-140630)).
|
|
|
|
|
10.2+
|
1997 Stock Option Plan and forms of stock option agreement and stock option exercise agreement (incorporated by reference to Exhibit 10.2 of the Company’s Registration Statement on Form S-1 (File No. 333-140630)).
|
|
|
|
|
10.3+
|
2007 Equity Incentive Plan and forms of stock option agreement and stock option exercise agreement (incorporated by reference to Exhibit 10.3 of Amendment No. 3 to the Company’s Registration Statement on Form S-1 (File No. 333-140630)).
|
|
|
|
|
10.4+
|
2015 Equity Incentive Plan and forms of restricted stock unit award agreement and stock option award agreement (incorporated by reference to Exhibit 4.04 of the Company’s Registration Statement on Form S-8 filed on December 29, 2015).
|
|
|
|
|
10.5+
|
2007 Employee Stock Purchase Plan, as amended on November 2, 2010 (incorporated by reference to Exhibit 10.1 of the Company’s Quarterly Report on Form 10-Q for the quarter ended December 31, 2010 filed on February 4, 2011).
|
|
|
|
|
10.6+
|
Executive Employment Agreement dated August 12, 2013, by the Company and Donald Joos (incorporated by reference to Exhibit 10.5 of the Company’s Annual Report on Form 10-K for the year ended June 30, 2013 filed on September 12, 2013).
|
|
|
|
|
10.7+
|
First Amendment to the Executive Employment Agreement dated June 1, 2016, by the Company and Donald Joos.
|
|
|
|
|
10.8+
|
Offer Letter, dated April 22, 2007, by the Company and Michael E. Healy (incorporated by reference to Exhibit 10.19 of Amendment No. 2 to the Company’s Registration Statement on Form S-1 (File No. 333-140630)).
|
|
|
|
|
10.9+
|
Executive Incentive Compensation Plan (incorporated by reference to Exhibit 10.8 of the Company’s Annual Report on Form 10-K for the year ended June 30, 2013 filed on September 12, 2013).
|
88
|
Exhibit
Number |
Exhibit Title
|
|
10.10+
|
Form of “Tier 2” Retention Incentive Agreement (incorporated by reference to Exhibit 10.2 of the Company’s Quarterly Report on Form 10-Q for the quarter ended March 31, 2011, filed on May 9, 2011).
|
|
|
|
|
10.11+
|
Form of Form of “Tier 3” Retention Incentive Agreement (incorporated by reference to Exhibit 10.3 of the Company’s Quarterly Report on Form 10-Q for the quarter ended March 31, 2011, filed on May 9, 2011).
|
|
|
|
|
10.12
|
Lease Agreement between River Place Corporate Park, LP and the Company, dated June 30, 2008, and as amended on September 16, 2009, December 2009, and December 10, 2010 (incorporated by reference to Exhibit 10.2 of the Company’s Quarterly Report on Form 10-Q for the quarter ended December 31, 2010 filed on February 4, 2011).
|
|
|
|
|
10.13
|
Office Lease Oakmead West, dated April 20, 2007, between the Company and Carr NP Properties, L.L.C. (incorporated by reference to Exhibit 10.18 to Amendment No. 2 of the Company’s Registration Statement on Form S-1 (File No. 333-140630), Amendment No. 1 thereto (incorporated by reference to, Exhibit 10.11 of the Company’s Annual Report on Form 10-K for the year ended June 30, 2009, filed on September 10, 2009) and Amendment No. 2 thereto (incorporated by reference to Exhibit 10.2 of the Company’s Quarterly Report on Form 10-Q for the quarter ended December 31, 2013, filed on February 7, 2014).
|
|
|
|
|
10.14
|
Lease Agreement, dated July 21, 2011 between the Company and BRE/US Industrial Properties, L.L.C. (incorporated by reference to Exhibit 10.16 of the Company’s Annual Report on Form 10-K for the year ended June 30, 2011 filed on September 12, 2011).
|
|
|
|
|
10.15
|
$100,000,000 Senior Secured Credit Facilities Amended and Restated Credit Agreement dated as of October 22, 2014 among the Company, the lenders named therein and Silicon Valley Bank (incorporated by reference to exhibit 10.1 of the Company’s Quarterly Report on Form 10-Q for the quarter ended December 31, 2014 filed on February 6, 2015) , Amendment Letter dated as of December 1, 2014 (incorporated by reference to exhibit 10.1 of the Company’s Quarterly Report on Form 10-Q for the quarter ended December 31, 2014 filed on February 6, 2015) and Second Amendment Letter dated August 5, 2015 (incorporated by reference to the Company’s Form 8-K filed on August 7, 2015).
|
|
|
|
|
10.16
|
Amended and Restated Guarantee and Collateral Agreement dated as of October 22, 2014 (incorporated by reference to exhibit 10.1 of the Company’s Quarterly Report on Form 10-Q for the quarter ended December 31, 2014 filed on February 6, 2015).
|
|
|
|
|
21
|
Subsidiaries.
|
|
|
|
|
23.1
|
Consent of independent registered public accounting firm.
|
|
|
|
|
24.1
|
Power of Attorney (included on the signature page).
|
|
|
|
|
31.1
|
Rule 13a-14(a)/15d-14(a) Certification of Principal Executive Officer.
|
|
|
|
|
31.2
|
Rule 13a-14(a)/15d-14(a) Certification of Principal Financial Officer.
|
|
|
|
|
32.1
|
Section 1350 Certification of Principal Executive Officer.
|
|
|
|
|
32.2
|
Section 1350 Certification of Principal Financial Officer.
|
89
|
Exhibit
Number |
Exhibit Title
|
|
101.INS
|
XBRL Instance Document.
|
|
|
|
|
101.SCH
|
XBRL Taxonomy Extension Schema Document.
|
|
|
|
|
101.CAL
|
XBRL Taxonomy Extension Calculation Linkbase Document.
|
|
|
|
|
101.DEF
|
XBRL Taxonomy Extension Definition Linkbase Document.
|
|
|
|
|
101.LAB
|
XBRL Taxonomy Extension Label Linkbase Document.
|
|
|
|
|
101.PRE
|
XBRL Taxonomy Extension Presentation Linkbase Document.
|
| + | Management Compensatory Plan or Arrangement |
| (b) | Financial Statement Schedules. |
All schedules have been omitted because they are either inapplicable or the required information has been given in the consolidated financial statements or the notes thereto.
90