Attached files
| file | filename |
|---|---|
| 8-K - 8-K - FIRST FINANCIAL BANCORP /OH/ | a8-kinvestorpresentation96.htm |

1
EXHIBIT 99.1

2
Certain statements contained in this release which are not statements of historical fact constitute forward-looking
statements within the meaning of the Private Securities Litigation Reform Act. Examples of forward-looking statements
include, but are not limited to, projections of revenues, income or loss, earnings or loss per share, the payment or non-
payment of dividends, capital structure and other financial items, statements of plans and objectives of First Financial or its
management or board of directors and statements of future economic performances and statements of assumptions
underlying such statements. Words such as ‘‘believes,’’ ‘‘anticipates,’’ “likely,” “expected,” ‘‘intends,’’ and other similar
expressions are intended to identify forward-looking statements but are not the exclusive means of identifying such
statements. Management’s analysis contains forward-looking statements that are provided to assist in the understanding
of anticipated future financial performance. However, such performance involves risks and uncertainties that may cause
actual results to differ materially. These factors include, but are not limited to: economic, market, liquidity, credit, interest
rate, operational and technological risks associated with the Company’s business; the effect of and changes in policies and
laws or regulatory agencies (notably the recently enacted Dodd-Frank Wall Street Reform and Consumer Protection Act);
management’s ability to effectively execute its business plan; mergers and acquisitions, including costs or difficulties
related to the integration of acquired companies; the Company’s ability to comply with the terms of loss sharing
agreements with the FDIC; the effect of changes in accounting policies and practices; and the costs and effects of litigation
and of unexpected or adverse outcomes in such litigation. Please refer to the Company’s Annual Report on Form 10-K for
the year ended December 31, 2015, as well as its other filings with the SEC, for a more detailed discussion of these risks,
uncertainties and other factors that could cause actual results to differ from those discussed in the forward-looking
statements. Such forward-looking statements are meaningful only on the date when such statements are made, and the
Company undertakes no obligation to update any forward-looking statement to reflect events or circumstances after the
date on which such a statement is made to reflect the occurrence of unanticipated events.
Forward Looking Statement Disclosure

3
About First Financial Bancorp
Strategic Direction
Recent Financial Results
Presentation Contents

4
Company Overview
NASDAQ: FFBC
Overview
Founded: 1863
Headquarters: Cincinnati, Ohio
Banking Centers: 101
Assets: $8.3 billion
Loans: $5.7 billion
Deposits: $6.1 billion
Wealth Mgmt: $2.4 billion AUM
Lines of Business
Commercial / Private Banking
C&I, I-CRE, ABL, Equipment Finance,
Treasury, Wealth
Retail Banking
Consumer, Mortgage, Small Business
Commercial Finance
Quick Service Restaurant,
Insurance Agency Finance
$ in millions except “per share” and where otherwise noted in the presentation
www.bankatfirst.com
$19.45
$18.18 $18.07
$19.08
$17.94
3.29%
3.52% 3.54%
3.35%
3.57%
2Q161Q164Q153Q152Q15
Share Price Dividend Yield

Central OH
Loans $0.9 billion
Loan Growth (Y-o-Y) 32.7%
Deposits $0.4 billion
Deposit Market Share #14 (0.9%)
Banking Centers 6
Fortune 500 Companies 4
5
Our Markets
Indianapolis
Loans $0.5 billion
Loan Growth (Y-o-Y) 34.9%
Deposits $0.5 billion
Deposit Market Share #13 (1.2%)
Banking Centers 8
Fortune 500 Companies 3
Community Markets
Loans $1.2 billion
Loan Growth (Y-o-Y) 0.4%
Deposits $2.5 billion
Banking Centers 34
Greater Cincinnati
Loans $2.0 billion
Loan Growth (Y-o-Y) 9.1%
Deposits $2.4 billion
Deposit Market Share #5 (2.2%)
Banking Centers 49
Fortune 500 Companies 9
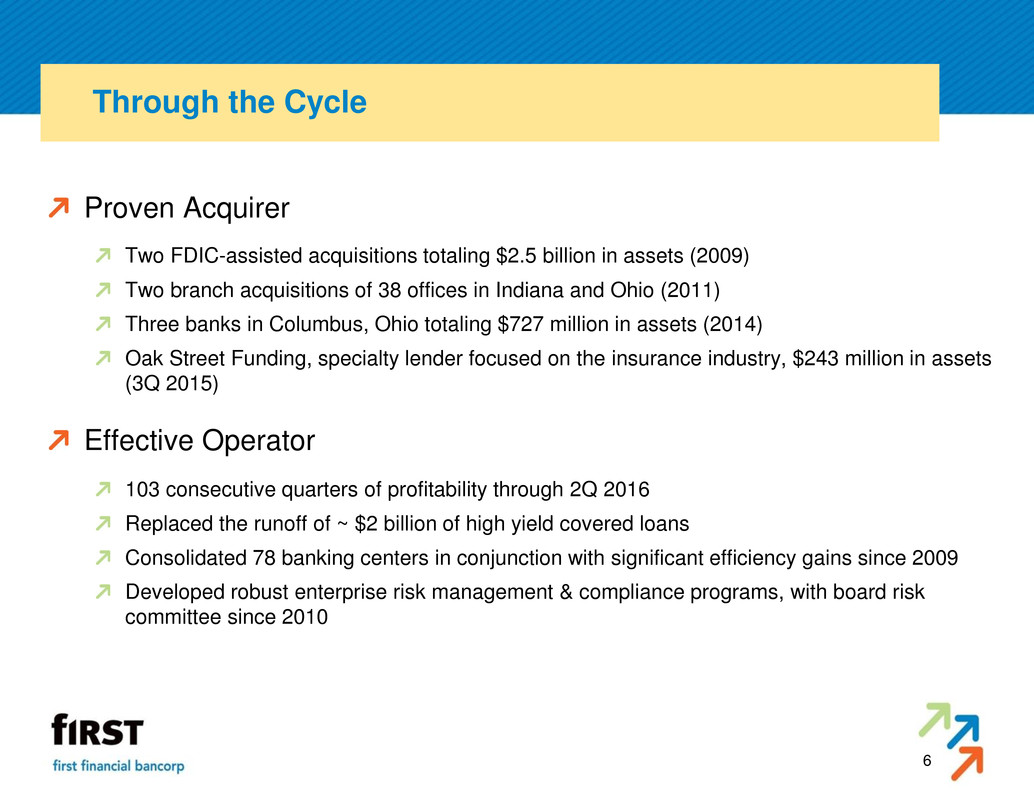
Proven Acquirer
Two FDIC-assisted acquisitions totaling $2.5 billion in assets (2009)
Two branch acquisitions of 38 offices in Indiana and Ohio (2011)
Three banks in Columbus, Ohio totaling $727 million in assets (2014)
Oak Street Funding, specialty lender focused on the insurance industry, $243 million in assets
(3Q 2015)
Effective Operator
103 consecutive quarters of profitability through 2Q 2016
Replaced the runoff of ~ $2 billion of high yield covered loans
Consolidated 78 banking centers in conjunction with significant efficiency gains since 2009
Developed robust enterprise risk management & compliance programs, with board risk
committee since 2010
6
Through the Cycle

Product expansions
Specialty lending (~ $1 billion, excluding Oak Street)
Mobile banking & other technology enhancements for clients
Re-entry into mortgage business (2010)
2015 originations of $320 million
Wealth infrastructure improvements
Investment model
Real estate management, tax & insurance outsourcing
Significant technology & infrastructure investments
Continued expansion of risk management & compliance
7
Investments in our Business

Proven & sustainable business model
Well managed through the cycle
Conservative operating philosophy
Consistent profitability
Robust capital management
Prudent steward of shareholders’ capital
Strong asset quality
Well defined M&A strategy
Selective markets, products & asset diversification
Direct linkage between compensation and performance
STI, LTI, management stock ownership targets
8
Invest with First Financial

9
1 – includes dividend reinvestment
2 – simple average - assumes equal weight
3 – 2016 YTD through 08/29/2016
Total Shareholder Return 1
Company Ticker 2008-2Q16 2015 2016 YTD
(3)
First Financial FFBC 151.34% 0.68% 23.01%
KBW Regional Bank Index KRX 29.21% 5.99% 8.10%
NASDAQ Composite CCMP 102.01% 7.11% 5.47%
Fifth Third FITB -14.66% 1.27% 0.10%
US Bancorp USB 55.46% -2.81% 4.07%
PNC PNC 51.25% 6.81% -6.04%
Park National PRK 126.30% 6.74% 9.58%
Old National ONB 11.99% -5.72% 5.08%
Select Bank Average (2) AVG 46.07% 1.26% 2.56%

10
About First Financial Bancorp
Strategic Direction
Recent Financial Results

11
Operational Excellence
• Focus on cost, efficiency & volume
Client Intimacy
• Strong client focus
• Relationship driven
Product Leadership
• Develop new products, new markets &
new techniques
What does First Financial stand for?
Strategic Overview

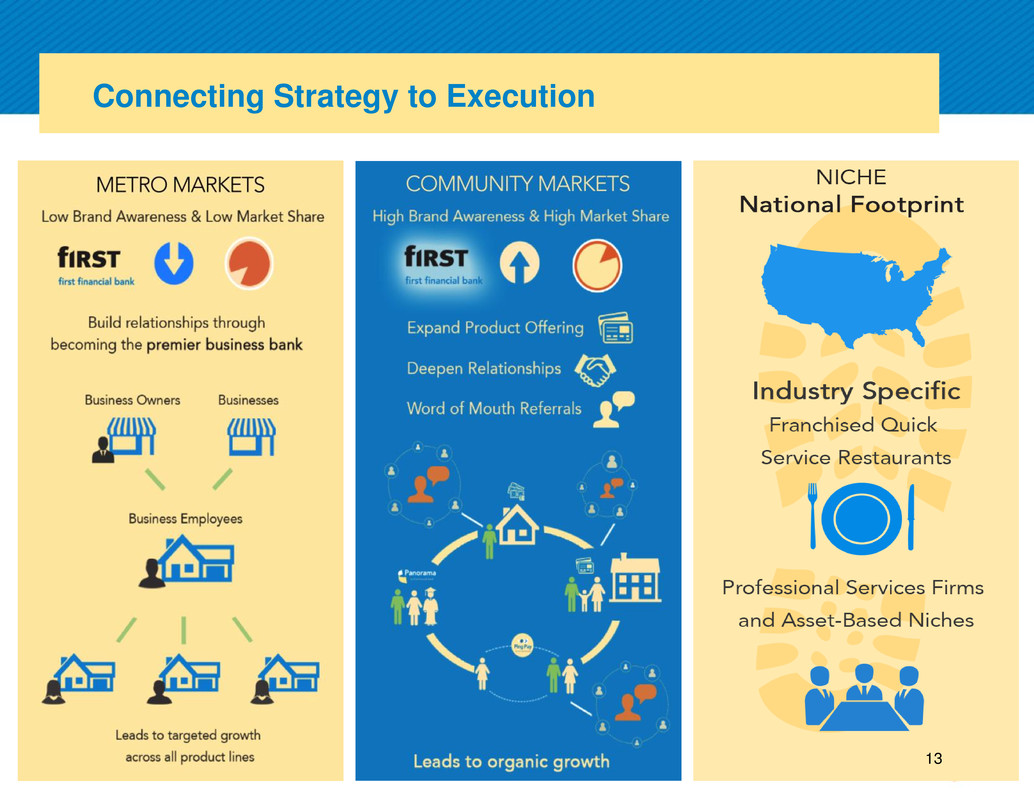
Our strategy is to be the Premier Business Bank in the markets we
serve
“Bank the business, bank the owner & bank the employees.”
Rationale:
Our value proposition – relationship banking & sophisticated solutions – resonates with and
is desired by small / mid-size businesses
Alignment with our competitive advantage
By expanding relationships with our business clients, we can efficiently grow all areas of the
bank – Consumer, Wealth & Business Banking
12
Premier Business Bank Our Strategy
13
Connecting Strategy to Execution
13

14
Strategic Priorities
Deliver top quartile shareholder returns
Continue to invest in innovative solutions that enable our clients to bank with us on their
terms
Promote leadership & development within our communities
Achieve best-in-class compliance & risk management programs
Remain vigilant in our credit philosophy & oversight
Focused growth efforts in metropolitan markets
Maintain a disciplined approach to process improvement & expense management
Deploy capital in an opportunistic & risk-appropriate manner
Proactively develop leadership talent across the organization
Plan & prepare for the $10 billion asset threshold
Pace – 3 to 5 years organic
Preparation – DFAST, risk, compliance, data management

15
About First Financial Bancorp
Strategic Direction
Recent Financial Results

16
2Q 2016 Highlights – 103rd Consecutive Quarter of Profitability
Total assets increased $116.5 million, to $8.3 billion, compared to the linked quarter.
EOP loans increased $196.6 million, or 14.4% annualized, compared to the linked quarter.
EOP deposits decreased $57.2 million, or 3.7% annualized, compared to the linked quarter
EOP investment securities decreased $84.2 million, or 4.4%, compared to the linked quarter.
Balance Sheet
Profitability
Asset Quality
Net Interest Income
&
Net Interest Margin
Non-Interest Income
&
Non-Interest Expense
Capital
Non-interest income increased $4.7 million to $20.2 million.
Non-interest expense = $49.4 million.
Efficiency ratio = 56.6%.
Net interest income = $67.1 million, a $0.6 million increase compared to the linked quarter.
Effective yield earned on loans decreased 4 bps to 4.55%.
Net interest margin decreased 1 bp to 3.61%, 3.67% on a fully tax equivalent basis.
Net income = $22.6 million or $0.36 per diluted share.
Return on average assets = 1.11%.
Return on average shareholders’ equity = 10.84%
Return on average tangible common equity = 14.49%.
Provision expense = $4.0 million. Net charge offs = $1.1 million. NCOs / Avg. Loans = 0.08% annualized.
Non-performing Loans / Total Loans = 0.88%. Non-performing Assets / Total Assets = 0.72%.
ALLL / Non-accrual Loans = 254.56%. ALLL / Total Loans = 0.99%.
Total capital ratio = 12.70%.
Tier 1 capital ratio = 10.07%.
Tangible common equity ratio = 7.85%.
Tangible book value per share = $10.26.

17
Strategy & Outlook
Focus remains on organic growth and executing our core strategy:
1. Growing loans at risk-appropriate returns
Strong organic growth opportunities resulting from the mix of markets, products & businesses
built over the last five years
Full year 2016 loan growth trending toward high single digits to low double digits
Stable margin outlook in the near term, similar to 1H 2016
2. Growing core deposits to fund loan growth & generate fee income
Ever-present focus on growing low cost, core deposits
Continue repositioning our balance sheet - redeploy cash flows from securities to fund
organic loan growth, similar to 1H 2016
3. Growing noninterest income to help build & diversify revenue
Strategies focused on product pricing, governance and client penetration
4. Maintaining our focus on efficiency & diligent expense management
Non-interest expense base expected to be approximately $50 million per quarter
5. Remaining vigilant in our credit oversight
18
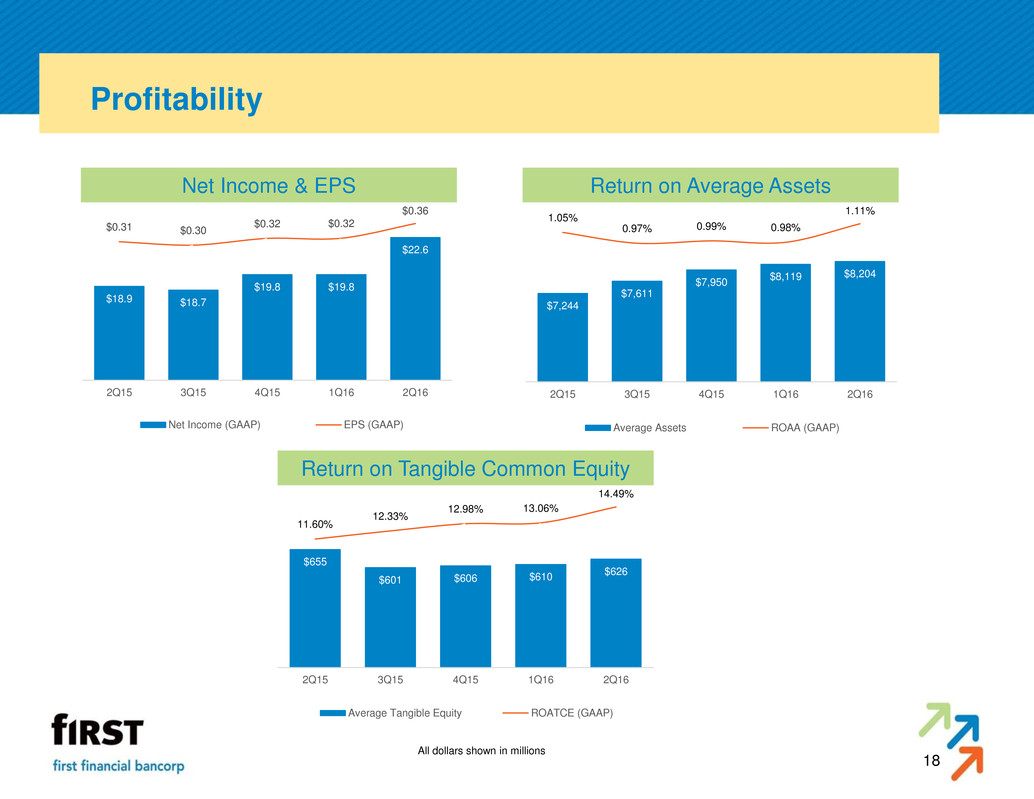
Profitability
Net Income & EPS Return on Average Assets
Return on Tangible Common Equity
$22.6
$19.8 $19.8
$18.7 $18.9
$0.36
$0.32 $0.32
$0.30 $0.31
2Q161Q164Q153Q152Q15
Net Income (GAAP) EPS (GAAP)
All dollars shown in millions
$8,204 $8,119
$7,950
$7,611
$7,244
1.11%
0.98% 0.99% 0.97%
1.05%
2Q161Q164Q153Q152Q15
Average Assets ROAA (GAAP)
$626
$610 $606 $601
$655
14.49%
13.06% 12.98%
12.33%
11.60%
2Q161Q164Q153Q152Q15
Average Tangible Equity ROATCE (GAAP)
19
Net Income
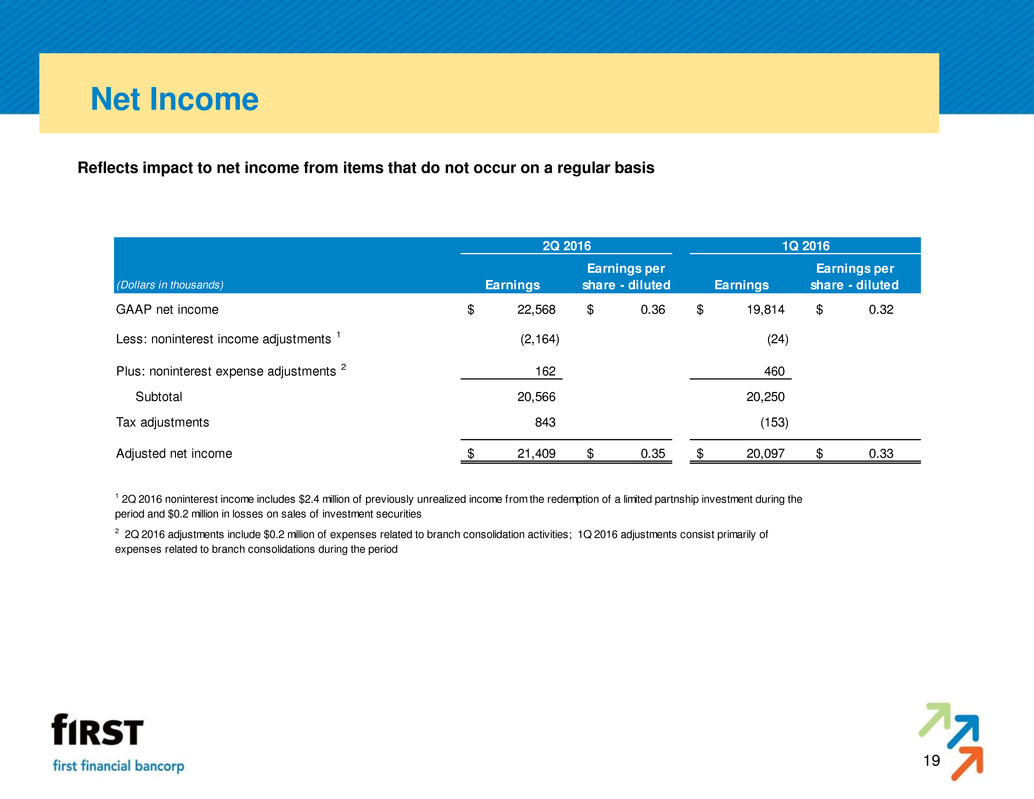
Reflects impact to net income from items that do not occur on a regular basis
Earnings per Earnings per
(Dollars in thousands) Earnings share - diluted Earnings share - diluted
GAAP net income 22,568$ 0.36$ 19,814$ 0.32$
Less: noninterest income adjustments 1 (2,164) (24)
Plus: noninterest expense adjustments 2 162 460
Subtotal 20,566 20,250
Tax adjustments 843 (153)
Adjusted net income 21,409$ 0.35$ 20,097$ 0.33$
2 2Q 2016 adjustments include $0.2 million of expenses related to branch consolidation activities; 1Q 2016 adjustments consist primarily of
expenses related to branch consolidations during the period
1 2Q 2016 noninterest income includes $2.4 million of previously unrealized income from the redemption of a limited partnship investment during the
period and $0.2 million in losses on sales of investment securities
2Q 2016 1Q 2016

20
Loan Portfolio
Loan Product Mix (EOP) Net Loan Change (Linked Quarter)
$48.9
$9.6
$92.0
$33.5
$6.8
$5.8
C&I - Commercial &
Leasing
C&I - Owner Occupied
CRE
Investor CRE
Construction
Installment and Credit
Card
Resi. Mtg. and Home
Equity
33% 34% 33% 33%
29%
14% 14% 15% 15%
16%
28%
27% 27%
27%
28%
7%
6%
6%
5%
5%
17%
18%
18%
19%
20%
2%
1%
2%
2%
2%
$5,701
$5,505
$5,389
$5,216
$4,853
2Q161Q164Q153Q152Q15
C&I - Commercial & Leasing C&I - Owner Occupied CRE
Investor CRE Construction
Resi. Mtg. and Home Equity Installment and Credit Card
All dollars shown in millions

21
Loan Portfolio
Loan Portfolio By Geography 1
Average Loan Size & Rate 2
Nationwide Lending Platforms
1 Includes loans held for sale. Excludes purchase accounting loan marks.
2 Average loan balances in $000s.
3 Includes Oak Street, Franchise, shared national credits & other loans outside
Ohio, Indiana, & Kentucky.
$2,797
49%
$1,477
26%
$201
3%
$1,259
22%
Ohio
Indiana
Kentucky
National Business
$341
6%
$550
10%
$4,810
84%
Oak Street
Franchise
All Other Loans
$349
$398
$600
$732
$458
$111 $32
3.9%
4.0%
3.7%
5.4%
7.5%
4.0% 4.1%
C&I* OOCRE* ICRE* Franchise Oak Street Mortgage Home
Equity
Average Balance Weighted Average Rate
* Ex.Franchise & Oak Street
3

22
Loan Portfolio
C&I Loans By Industry 1 CRE Loans By Collateral 2
1 Industry types included in Other representing greater than 1% of total C&I loans include Retail Trade, Health Care, Public Administration, Waste
Management, and Education.
2 Collateral types included in Other representing greater than 1% of total CRE loans include Farmland, Commercial Building Construction,
Hotel/Motel, Manufacturing Facility, School/Education, Nursing/Assisted Living, Recreation Facility, Commercial Lot, Residential Building
Construction, Strip Center, Church, Vacant Land 6+ Acres.
Accommodation
and Food Services
24%
Finance and
Insurance
21%
Manufacturing
15%
Wholesale
Trade
7%
Real Estate and
Rental and
Leasing
5%
Professional,
Scientific, and
Technical Services
5%
Construction
4%
Agriculture,
Forestry, Fishing
and Hunting
3% Other
16%
Retail
13%
Office
11%
Residential, Multi
Family 5+
9%
Commercial Building
Construction
7%
Residential, 1-4 Family
7%
Restaurant
7%
Industrial Facility
5%
Warehouse
4%
Medical Office
3%
Student Housing
3%
All others
31%

23
Investment Portfolio
Total EOP investments of $1.84 billion
Investment Portfolio / Total Assets = 22.1%
Effective yield earned during second quarter = 2.54%
Portfolio duration = 2.5 years
Portfolio Composition Portfolio Quality
Agency, 67.7%
AAA, 14.5%
AA+, 2.5%
AA, 2.5%
AA-, 1.7%
BBB+, 1.1%
BBB, 1.9%
BBB-, 1.1%
FRB/FHLB Stock, 2.8%
Other, 4.2%
Agency CMOs
29%
Commercial MBS
23%
Asset-backed
securities
14%
Agency Pass-
through
Securities
12% Municipal Securities
8%
Non-Agency CMOs
5%
Regulatory stock
3%
Corporate securities
2%
Non-Agency Pass-
through Securities
2%
U.S. Government
Agency Debt
1%
Other
1%
U.S. Government
Debt
0%

24
Asset Quality
Non-Performing Assets / Total Assets Classified Assets / Total Assets
Allowance / Total Loans Net Charge Offs & Provision Expense
$59.6
$64.1
$70.1 $71.1
$76.2
0.72%
0.78%
0.86%
0.90%
1.03%
2Q161Q164Q153Q152Q15
NPAs NPAs / Total Assets
$56.7 $53.7 $53.4 $53.3 $52.9
0.99% 0.98% 0.99% 1.02%
1.09%
1.06% 1.08%
1.11%
1.17%
1.27%
2Q161Q164Q153Q152Q15
Allowance for Loan Losses
ALLL / Total Loans
(ALLL + Loan Marks - Indem Asset) / Total Loans
All dollars shown in millions
$1.1 $1.3 $1.8 $2.2 $3.3
$4.0
$1.7
$1.9
$2.6
$3.1
0.08% 0.10%
0.14% 0.17%
0.27%
2Q161Q164Q153Q152Q15
NCOs Provision Expense NCOs / Average Loans
$143.3
$133.9 $132.4 $130.1
$139.9
1.72%
1.63% 1.63% 1.63%
1.90%
2Q161Q164Q153Q152Q15
Classified Assets Classified Assets / Total Assets

25
Net Interest Income / Net Interest Margin
Gross loans include loans held for sale and FDIC indemnification asset
All dollars shown in millions
Average Deposits Net Interest Income
Average Securities Average Loans
$1,441 $1,387 $1,402 $1,344 $1,325
$1,483 $1,392 $1,424 $1,231 $1,220
$2,042 $1,938 $2,005 $2,015 $1,950
$1,342 $1,419 $1,416 $1,370 $1,276
0.35% 0.36%
0.33% 0.32% 0.32%
2Q161Q164Q153Q152Q15
NIB Demand IB Demand Savings
Time Cost of Deposits
$67.1 $66.6 $66.1
$63.2
$58.7
3.67%
3.68% 3.69%
3.67%
3.62%
2Q161Q164Q153Q152Q15
Net Interest Income Net Interest Margin (FTE)
$5,584
$5,435
$5,267
$5,053
$4,814
4.55%
4.59%
4.62%
4.52%
4.45%
2Q161Q164Q153Q152Q15
Gross Loans Loan Yield
$1,870
$1,939 $1,934
$1,848
$1,783
2.54% 2.59%
2.44%
2.39%
2.34%
2Q161Q164Q153Q152Q15
Average Investment Securities Investment Securities Yield

26
Interest Rate Sensitivity
Loan Portfolio – Floating Loan Growth (1)
Sensitivity Trend (Up100, Up200) (3)
48% Y-o-Y growth in floating rate lending (1)
34% Y-o-Y growth in client derivatives (2)
% of loans repricing:
<=3 months 56%
<1 year 59%
Securities portfolio duration – 2.5 years
Non-maturity, interest bearing accounts
modeled to increase 63 bps in an “Up 100”
scenario
(1) As defined by EOP loans repricing in three months or less.
(2) As defined by client derivative notional balances.
(3) Immediate parallel shifts across a 12 month horizon
$2,148
$2,523
$2,676 $2,811
$3,179
44%
48% 49%
51%
56%
2Q15 3Q15 4Q15 1Q16 2Q16
Floating % of Gross Loans
-$0.022
-$0.005
$0.001 $0.005
$0.018
$0.004
$0.029 $0.030
$0.038
$0.071 -0.87%
-0.19% 0.03% 0.16%
0.62%
0.15%
1.04% 1.03% 1.28%
2.42%
2Q15 3Q15 4Q15 1Q16 2Q16
Up100 Up200 Up100 Up200
EPS Impact Sensitivity

27
Non-Interest Income
Non-Interest Income 2Q16 Highlights
* Includes net gain on sale of investment securities and other noninterest income.
All dollars shown in millions
Total non-interest income increased
$4.7 million, or 30.2%
Bankcard income increased $0.2
million or 8.6%
Client derivative income increased
$0.7 million or 64.3%
Net gains from sales of loans
increased $0.7 million or 56.3%
Loss share related income increased
$0.8 million or 207.9%
Other non-interest income increased
$2.5 million, or 119.6%, including $2.4
million of income from the redemption
of a limited partnership investment
$0.2 million in losses on sale of
investment securities
22% 28% 30% 24% 22%
16% 22% 20%
15% 15%
15% 19% 19% 14% 14%
9%
8% 8%
9% 9%
9%
7% 6%
8% 4%
6%
3% 4%
14% 18%
22%
14% 13%
16%
18%
$20.2
$15.5 $15.8
$20.4
$21.4
2Q161Q164Q153Q152Q15
Service Charges Wealth Mgmt
Bankcard Gains from sales of loans
Client derivatives Loss Share Income
Other *

28
Non-Interest Expense
Noninterest Expense 2Q16 Highlights
Efficiency Ratio
$49.4
$50.7 $51.3
$53.0
$48.8
56.6%
61.8% 62.6%
63.5%
60.9%
2Q161Q164Q153Q152Q15
NIE (GAAP) Efficiency Ratio (GAAP)
60% 58% 58% 52% 56%
40% 42% 42% 48% 44%
$49.4 $50.7 $51.3
$53.0
$48.8
1,403 1,390 1,400 1,394 1,366
2Q161Q164Q153Q152Q15
Personnel Non-Personnel FTE
All dollars shown in millions
Total non-interest expenses declined
$1.3 million, or 2.6%
$0.5 million, or 9.4%, decline in
occupancy expense primarily as a
result of branch consolidation costs in
the prior quarter
$0.5 million, or 28.4%, decline in
professional services expenses
primarily due to seasonal wealth
management related expenses in the
prior quarter
Other non-interest expense includes
$0.2 million of expenses related to
branch consolidation activities

29
Capital
Tier 1 Common Equity
Tangible Book Value Total Capital
Tangible Common Equity
All capital numbers are considered preliminary
All dollars shown in millions
$635.5
$615.1
$597.5 $601.3
$656.9
$10.26 $9.94 $9.69 $9.74
$10.65
2Q161Q164Q153Q152Q15
Tangible Book Value Tangible Book Value per Share
$849.3 $831.9 $822.4 $812.0
$751.8
12.70% 12.84% 13.04%
13.37% 13.31%
12.50%
2Q161Q164Q153Q152Q15
Total Capital Total Capital Ratio Target
$673.3
$658.0
$648.7
$638.6
$697.1
10.07% 10.16% 10.28%
10.51%
12.34%
10.50%
2Q161Q164Q153Q152Q15
Tier 1 Common Equity Tier 1 Common Ratio Target
$635.5
$615.1
$597.5 $601.3
$656.9
7.85% 7.71% 7.53%
7.84%
9.08%
2Q161Q164Q153Q152Q15
Tangible Book Value Tangible Common Ratio

30
Appendix: Non-GAAP to GAAP Reconciliation
Net interest income and net interest margin - fully tax equivalent
June 30, Mar. 31, Dec. 31, Sep. 30, June 30, June 30, June 30,
2016 2016 2015 2015 2015 2016 2015
Net interest income $67,132 $66,555 $66,083 $63,159 $58,674 $133,687 $117,260
Tax equivalent
adjustment 1,058 1,052 1,046 1,000 988 2,110 1,971
Net interest income -
tax equivalent $68,190 $67,607 $67,129 $64,159 $59,662 $135,797 $119,231
Average earning assets $7,475,711 $7,398,013 $7,219,995 $6,938,107 $6,616,960 $7,436,862 $6,596,921
Net interest margin* 3.61 % 3.62 % 3.63 % 3.61 % 3.56 % 3.62 % 3.58 %
Net interest margin (fully
tax equivalent)* 3.67 % 3.68 % 3.69 % 3.67 % 3.62 % 3.67 % 3.64 %
Three Months Ended YTD
* Margins are calculated using net interest income annualized divided by average earning assets.
Net interest income-tax equivalent, appears in the tables entitled “Additional Data” at the bottom of the “Consolidated Quarterly Statements of
Income” pages. The tax equivalent adjustment to net interest income recognizes the income tax savings when comparing taxable and tax-
exempt assets and assumes a 35% tax rate. Management believes that it is a standard practice in the banking industry to present net interest
margin and net interest income on a fully tax equivalent basis. Therefore, management believes these measures provide useful information to
investors by allowing them to make peer comparisons. Management also uses these measures to make peer comparisons.
31
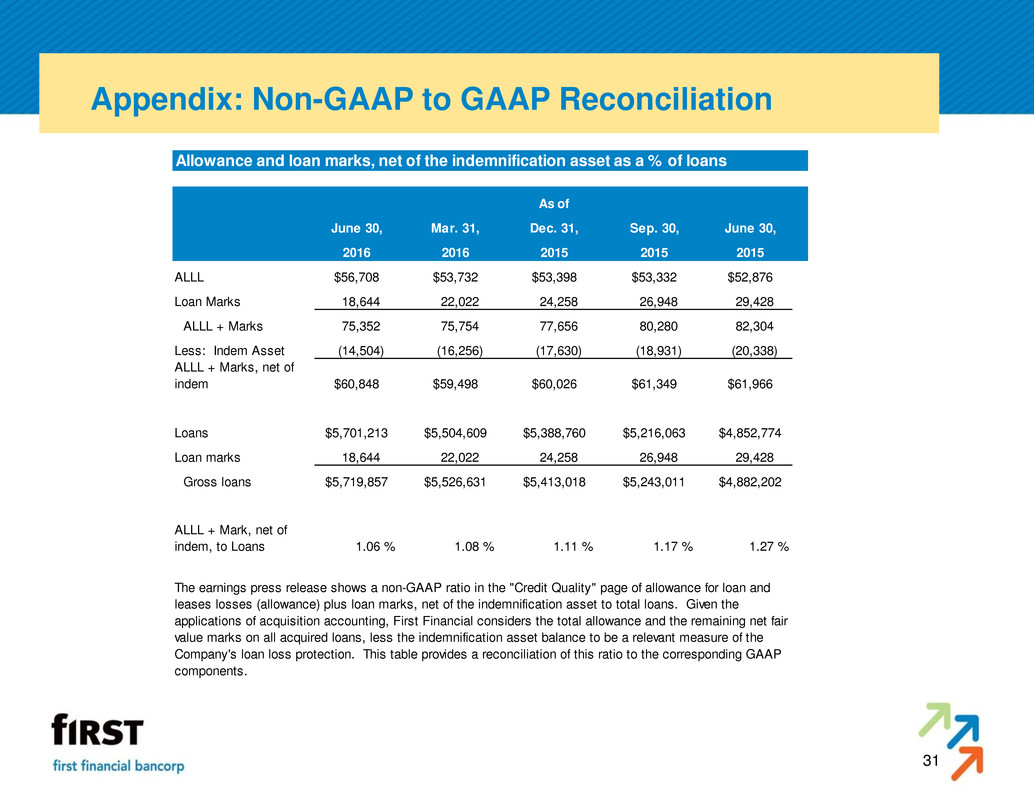
Appendix: Non-GAAP to GAAP Reconciliation
Allowance and loan marks, net of the indemnification asset as a % of loans
June 30, Mar. 31, Dec. 31, Sep. 30, June 30,
2016 2016 2015 2015 2015
ALLL $56,708 $53,732 $53,398 $53,332 $52,876
Loan Marks 18,644 22,022 24,258 26,948 29,428
ALLL + Marks 75,352 75,754 77,656 80,280 82,304
Less: Indem Asset (14,504) (16,256) (17,630) (18,931) (20,338)
ALLL + Marks, net of
indem $60,848 $59,498 $60,026 $61,349 $61,966
Loans $5,701,213 $5,504,609 $5,388,760 $5,216,063 $4,852,774
Loan marks 18,644 22,022 24,258 26,948 29,428
Gross loans $5,719,857 $5,526,631 $5,413,018 $5,243,011 $4,882,202
ALLL + Mark, net of
indem, to Loans 1.06 % 1.08 % 1.11 % 1.17 % 1.27 %
As of
The earnings press release shows a non-GAAP ratio in the "Credit Quality" page of allowance for loan and
leases losses (allowance) plus loan marks, net of the indemnification asset to total loans. Given the
applications of acquisition accounting, First Financial considers the total allowance and the remaining net fair
value marks on all acquired loans, less the indemnification asset balance to be a relevant measure of the
Company's loan loss protection. This table provides a reconciliation of this ratio to the corresponding GAAP
components.

32
Appendix: Non-GAAP to GAAP Reconciliation
Additional non-GAAP ratios
June 30, Mar. 31, Dec. 31, Sep. 30, June 30, June 30, June 30,
(Dollars in thousands, except per share data) 2016 2016 2015 2015 2015 2016 2015
Net income (a) $22,568 $19,814 $19,820 $18,673 $18,949 $42,382 $36,570
Average total shareholders' equity 837,412 821,588 817,756 812,396 800,598 829,500 794,588
Less:
Goodw ill and other intangible (211,199) (211,533) (211,865) (211,732) (145,465) (211,199) (145,465)
Average tangible equity (b) 626,213 610,055 605,891 600,664 655,133 618,301 649,123
Total shareholders' equity 846,723 826,587 809,376 813,012 802,383 846,723 802,383
Less:
Goodw ill (211,199) (211,533) (211,865) (211,732) (145,465) (211,199) (145,465)
Ending tangible equity (c) 635,524 615,054 597,511 601,280 656,918 635,524 656,918
Total assets 8,310,102 8,193,554 8,147,411 7,880,533 7,383,372 8,310,102 7,383,372
Less:
Goodw ill (211,199) (211,533) (211,865) (211,732) (145,465) (211,199) (145,465)
Ending tangible assets (d) 8,098,903 7,982,021 7,935,546 7,668,801 7,237,907 8,098,903 7,237,907
Risk-w eighted assets (e) 6,685,158 6,478,716 6,308,139 6,073,899 5,647,658 6,685,158 5,647,658
Total average assets 8,203,837 8,118,945 7,950,278 7,611,389 7,243,886 8,161,391 7,222,717
Less:
Goodw ill (211,199) (211,533) (211,865) (211,732) (145,465) (211,199) (145,465)
Average tangible assets (f) $7,992,638 $7,907,412 $7,738,413 $7,399,657 $7,098,421 $7,950,192 $7,077,252
Ending shares outstanding (g) 61,959,529 61,855,027 61,641,680 61,713,633 61,707,847 61,959,529 61,707,847
Ratios
Return on average tangible shareholders' equity (a)/(b) 14.49 % 13.06 % 12.98 % 12.33 % 11.60 % 13.78 % 11.36 %
Ending tangible equity as a percent of:
Ending tangible assets (c)/(d) 7.85 % 7.71 % 7.53 % 7.84 % 9.08 % 7.85 % 9.08 %
Risk-w eighted assets (c)/(e) 9.51 % 9.49 % 9.47 % 9.90 % 11.63 % 9.51 % 11.63 %
Average tangible equity as a percent of average tangible assets (b)/(f) 7.83 % 7.71 % 7.83 % 8.12 % 9.23 % 7.78 % 9.17 %
Tangible book value per share (c)/(g) 10.26$ 9.94$ 9.69$ 9.74$ 10.65$ 10.26$ $10.65
Three months ended YTD
The earnings press release also includes some non-GAAP ratios in the “Consolidated Financial Highlights” page. These ratios are: (1) Return on average tangible shareholders' equity; (2) Ending tangible
shareholders' equity as a percent of ending tangible assets; (3) Ending tangible shareholders' equity as a percent of risk-w eighted assets; (4) Average tangible shareholders' equity as a percent of average
tangible assets; and (5) Tangible book value per share. The Ending tangible shareholders' equity as a percent of ending tangible assets and Average tangible shareholders' equity as a percent of average
tangible assets are also show n in the “Regulatory Capital” section of the “Capital Adequacy” page in the earnings release. The Company considers these critical metrics w ith w hich to analyze banks. The
ratios have been included in the earnings press release to facilitate a better understanding of the Company's capital structure and f inancial condition.

33
