Attached files
| file | filename |
|---|---|
| EX-99.1 - EXHIBIT 99.1 - PG&E Corp | ex99_1.htm |
| 8-K - PG&E CORPORATION 8-K 8-30-2016 - PG&E Corp | form8k.htm |
Exhibit 99.2

Summary ofPG&E’s 2017 GRCSettlement Agreement Public WorkshopAugust 30, 2016

Overview of the Settlement Agreement *

Headlines 15 parties – all who filed testimony in the case – have joined the SettlementFor 2017, the Settlement includes an $88 million (1.1%) increase to PG&E’s 2016 authorized revenue requirement For 2018 and 2019, the Settlement includes additional increases of $444 million (5.5%) and $361 million (4.3%), respectivelyThe Settlement resolves all issues except two:For 2020, ORA and PG&E agree to a third attrition year with an increase of $361 million (4.1%)PG&E, CUE and EDF support a new balancing account for costs arising from the ongoing natural gas leak abatement rulemakingTURN and others oppose these two provisions. *
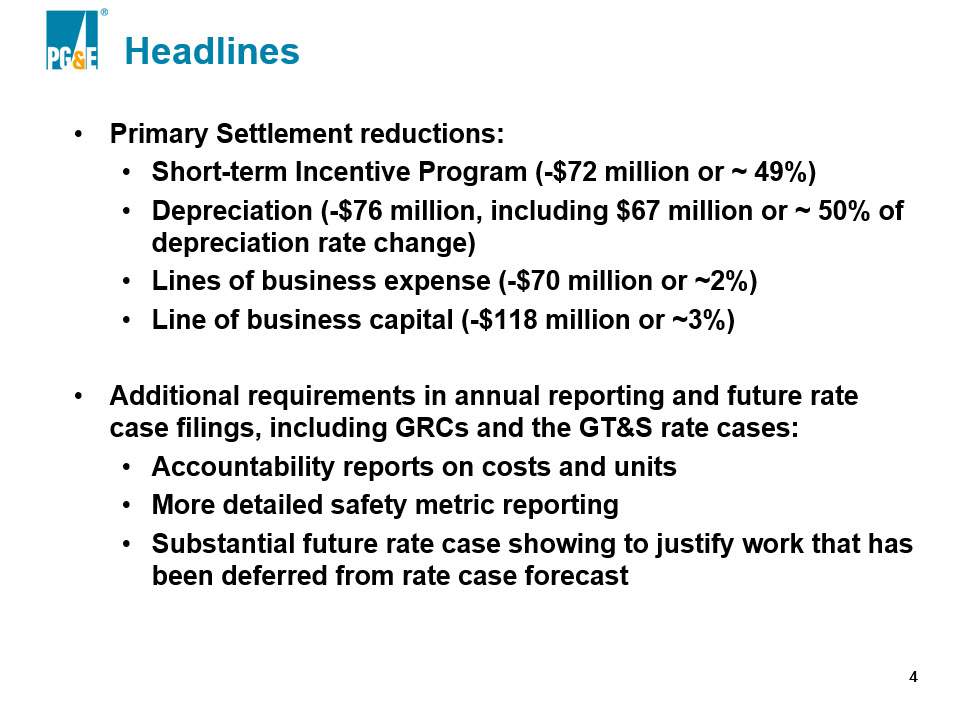
Headlines Primary Settlement reductions:Short-term Incentive Program (-$72 million or ~ 49%)Depreciation (-$76 million, including $67 million or ~ 50% of depreciation rate change)Lines of business expense (-$70 million or ~2%)Line of business capital (-$118 million or ~3%)Additional requirements in annual reporting and future rate case filings, including GRCs and the GT&S rate cases:Accountability reports on costs and unitsMore detailed safety metric reportingSubstantial future rate case showing to justify work that has been deferred from rate case forecast *
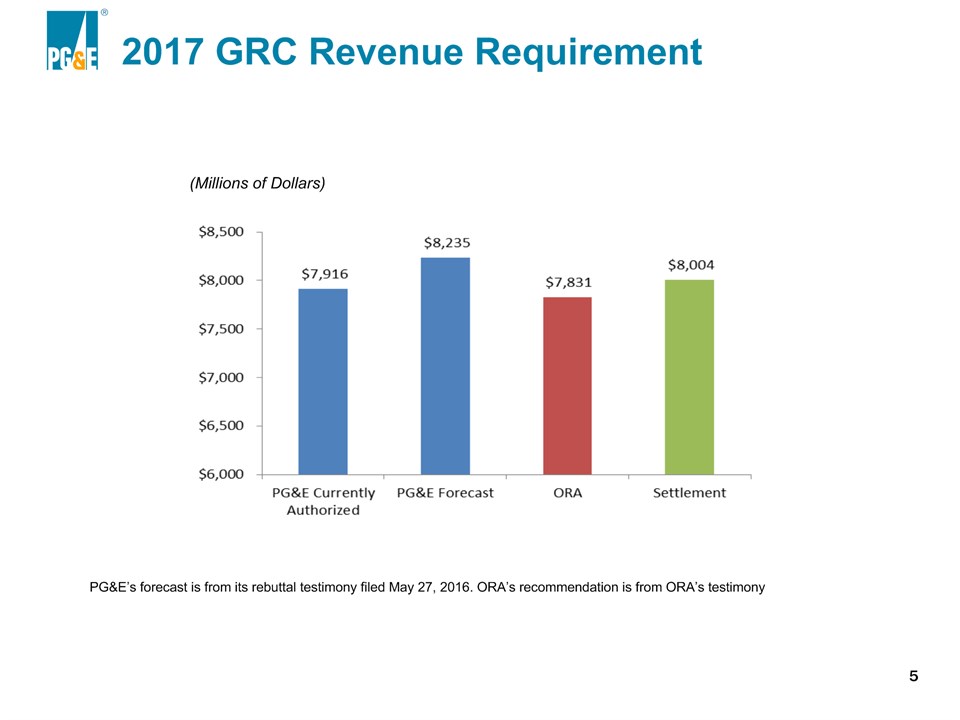
2017 GRC Revenue Requirement * PG&E’s forecast is from its rebuttal testimony filed May 27, 2016. ORA’s recommendation is from ORA’s testimony (Millions of Dollars)

2017 – 2019 Revenue Requirement IncreasesPG&E, ORA, TURN and Settlement * Post Test Year Increases PG&E ORA ORA Alternative TURN TURN Alternative Settlement 2018 $467 $274 $444 $469 $458 $444 2019 $368 $283 $361 $250 $290 $361 2020 * N/A $294 $361 N/A N/A $361 (Millions of Dollars) * The 2020 attrition proposal is a contested issue.

2017 GRC PG&E, ORA and Settlement Increase by Functional Area (not LOB) * Functional AreaRevenue Requirement PG&E Forecast Increase PG&E Forecast Increase ORARecommended Increase (Decrease) ORARecommended Increase (Decrease) Settlement Recommended Increase (Decrease) Settlement Recommended Increase (Decrease) Difference(PG&E and Settlement) (millions) (millions) (millions) (millions) Electric Distribution $67 1.6% ($146) (3.5%) ($62) (1.5%) ($128) Gas Distribution $59 3.4% ($59) (3.4%) ($3) (0.2%) ($62) Electric Generation* $193 9.9% $119 6.1% $153 7.8% ($40) Total Revenue Requirement Increase $319 4.0% ($85) (1.1%) $88 1.1% ($231) * PG&E’s 2016 adopted electric generation revenue reflects $144 million in credits from the Department of Energy litigation and overfunded revenue associated with the PV Program. The reduced credit level contributes $124 million, or 62%, of the increase in the 2017 electric generation revenue forecast.
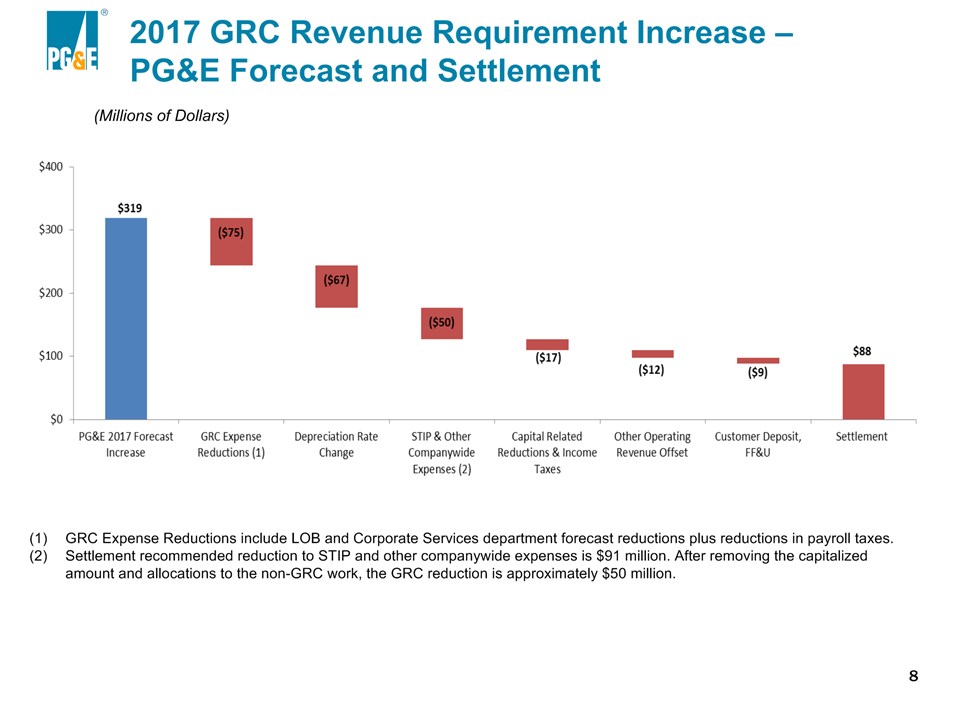
2017 GRC Revenue Requirement Increase – PG&E Forecast and Settlement * GRC Expense Reductions include LOB and Corporate Services department forecast reductions plus reductions in payroll taxes.Settlement recommended reduction to STIP and other companywide expenses is $91 million. After removing the capitalized amount and allocations to the non-GRC work, the GRC reduction is approximately $50 million. (Millions of Dollars)

Lines of Business Operating Expense(Millions of Nominal Dollars) * ($70M or 2.3%) PG&E’s forecast has been adjusted to reflect changes included in the errata and rebuttal filings. Corporate Services (A&G) department costs are presented in FERC dollars; reduction is relative to 100% of company A&G costs including allocations to GT&S, TO.

Lines of Business Capital Expenditures(Millions of Nominal Dollars) * ($118M or 2.9%) PG&E’s forecast has been adjusted to reflect changes included in the errata and rebuttal filings.

Company-wide Expenses(Millions of Nominal Dollars) * Major Adjustments49% reduction to Short Term Incentive Program (-$72M)1% reduction to Medical and Retirement Benefits (-$8M)8% reduction to Insurance (-$7M)12% reduction to Workforce Transition (-$2M)2% reduction to Workers’ Compensation (-$1M) ($91M or 9.5%) * Pension plan trust contribution is recovered separately outside of the GRC.

Balancing and Memorandum Accounts Accounts to be Maintained Major Emergency balancing accountVegetation Management balancing account and associated incremental inspection and removal cost tracking accountDiablo Canyon Seismic Studies balancing accountNuclear Safety balancing accountHydro Relicensing balancing accountResidential Rate Reform memo accountTax Act memo account Accounts to be Eliminated Gas Leak Survey and Repair balancing accountSmart Grid Pilot Deployment Project balancing accountSan Francisco Incandescent Streetlight Replacement memo accountPhotovoltaic Program memo accountEnergy Data Center memo accountDynamic Pricing memo accountSmartMeterTM Opt-Out balancing accountAffiliate Transfer Fees accountsRevised Customer Energy Statement balancing accountCustomer Data Access balancing account * While PG&E has not proposed new balancing accounts in the 2017 GRC application, the Settlement proposes to create:Tax Repair memo account (not contested)New Environmental Regulatory balancing account for gas distribution (contested) New Accounts

Summaries by Lines of BusinessSettlement states that PG&E should strive for reasonable rates of steady state replacement, consistent with risk-informed decision making, for crucial operating equipment necessary to provide safe and reliable service.The fact that Settling Parties set specific amounts for certain categories of costs, by itself, is not intended to limit PG&E’s management’s discretion to spend funds, provided that such discretion is exercised in a manner consistent with PG&E’s obligation to provide safe and reliable service, as well as relevant Commission requirements and orders. *

Gas Distribution(Millions of Nominal Dollars) O&M Expense 2017 Capital Expenditures * Major AdjustmentsGas Operation Technology and R&D/Innovation (-$9.3M)Corrosion Control (-$5.2M)Leak Management (-$2.5M)Other Support (-$0.5M) Major AdjustmentsNew Business (-$10M) Other Settlement ItemsProvides sufficient funding for 4-year leak surveyAccepts removal of idle gas stubsFaster repair of Grade 3 gas leaks
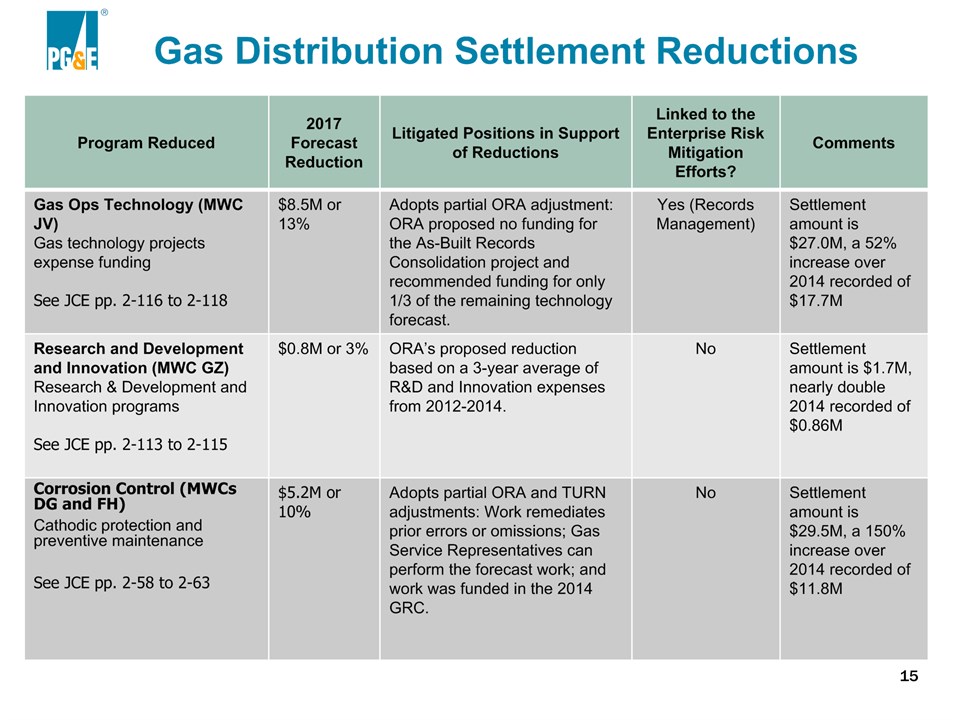
Gas Distribution Settlement Reductions Program Reduced 2017 Forecast Reduction Litigated Positions in Support of Reductions Linked to the Enterprise Risk Mitigation Efforts? Comments Gas Ops Technology (MWC JV)Gas technology projects expense fundingSee JCE pp. 2-116 to 2-118 $8.5M or 13% Adopts partial ORA adjustment: ORA proposed no funding for the As-Built Records Consolidation project and recommended funding for only 1/3 of the remaining technology forecast. Yes (Records Management) Settlement amount is $27.0M, a 52% increase over 2014 recorded of $17.7M Research and Development and Innovation (MWC GZ)Research & Development and Innovation programsSee JCE pp. 2-113 to 2-115 $0.8M or 3% ORA’s proposed reduction based on a 3-year average of R&D and Innovation expenses from 2012-2014. No Settlement amount is $1.7M, nearly double 2014 recorded of $0.86M Corrosion Control (MWCs DG and FH)Cathodic protection and preventive maintenanceSee JCE pp. 2-58 to 2-63 $5.2M or 10% Adopts partial ORA and TURN adjustments: Work remediates prior errors or omissions; Gas Service Representatives can perform the forecast work; and work was funded in the 2014 GRC. No Settlement amount is $29.5M, a 150% increase over 2014 recorded of $11.8M *

Gas Distribution Reductions * Program Reduced 2017 Forecast Reduction Litigated Positions in Support of Reductions Linked to the Enterprise Risk Mitigation Efforts? Comments Corrective Maintenance (MWC FI) – Leak RepairGas distribution corrective maintenance, the reduction targeted leak managementSee JCE pp. 2-76 to 2-78 $2.5M or 2% Adopts partial ORA, TURN and CFC adjustments: funding to stabilize the inventory of below-ground Grade 3 leaks. Settlement provides sufficient funding for PG&E to perform leak survey on a 4-year cycle. No Settlement amount is $87.8M, a 65% increase over 2014 recorded of $53.2M Other Support (MWC AB)Quality management, industry association dues and minor building projectsSee JCE pp. 2-123 to 2-125 $0.5M or 12% Adopts partial TURN adjustment: Reduce funding because of cost avoidance by recycling spoils. No Settlement amount is $4.0M, a 40% decrease compared to 2014 recorded of $6.7M (MWC AB captures misc. items and does not typically have a consistent spending pattern) New Business (MWC 29)Customer connectsSee JCE pp. 2-105 to 2-108 $10M or 13% Adopts partial TURN adjustment: PG&E’s forecast overestimates the number of non-residential connects. No Settlement amount is $69.2M, a 34% increase over 2014 recorded of $51.8M

Major AdjustmentsMapping and Records Management (-$2.5M)Overhead Maintenance (-$2.0M)Technology (-$1.4M)Capacity Programs (-$1.2M) Major AdjustmentsNew Business (-$43.4M)Capacity Programs (-$40.5M)Rule 20A (-$23.7M)Substation Asset Management (-$10.0M)Reliability Programs (-$7.0M)Cable Replacement Program (+$14.0M)FLISR (+$8.5M) – see Appendix Grasshopper Switches (+$0.4M) – see Appendix Electric Distribution(Millions of Nominal Dollars) O&M Expense 2017 Capital Expenditures * Other Settlement ItemsRequires pole loading study and related replacement prioritizing high risk areasAccepts PG&E’s proposed Rule 20A work credit allocation of $41.3M

Electric Distribution Settlement Expense Reductions * Program Reduced 2017 Forecast Reduction Litigated Positions in Support of Reductions Linked to the Enterprise Risk Mitigation Efforts? Comments Mapping and Records Management (MWC GE)Base mapping activities and specific records management projectsSee JCE pp. 2-278 to 2-280 $2.5M or 28% Adopts partial ORA and TURN adjustments: No funding for records management projects. ORA also recommended no funding for base mapping. Yes (Records Management) Settlement amount is $6.4M, a 81% increase over 2014 recorded of $3.5M Overhead Maintenance (MWC KA)Various types of overhead maintenance programs, including overhead notifications and surge arrester grounding programSee JCE pp. 2-189 to 2-191 $2.0M or 3% Adopts partial ORA and TURN adjustments: ORA recommended reduction to overhead notifications. TURN recommended reductions to the surge arrester program. No Settlement amount is $73.6M, a 24% increase over 2014 recorded of $59.3M Technology (MWC JV)Electric technology projects expense fundingSee JCE pp. 2-275 to 2-277 $1.4M or 19% Adopts partial ORA adjustment: ORA recommended no funding for technology expense. No Settlement amount is $6.0M, a 58% increase over 2014 recorded of $3.8M Capacity Programs (MWC BA, JV)Volt VAR Optimization (VVO) Program expense fundingSee JCE pp. 2-258 to 2-263 $1.2M or 74% Adopts partial ORA and TURN adjustments: ORA recommended no funding for VVO Program. TURN recommended that the VVO Program be limited to deployment on 12 additional feeders. No Settlement amount is $0.4M; this is a new program starting 2017
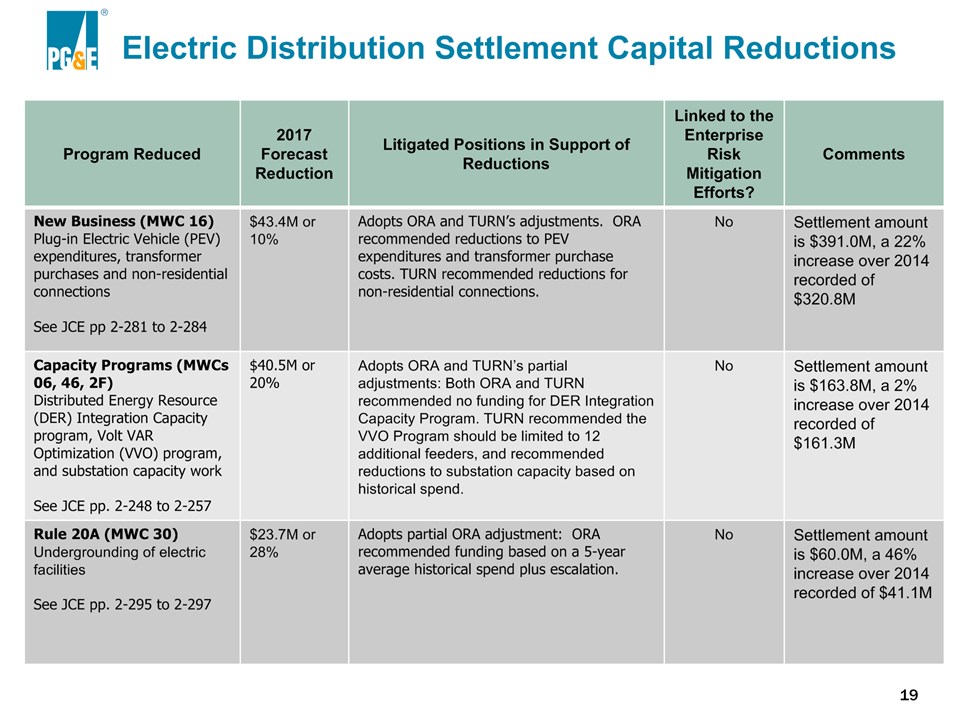
Electric Distribution Settlement Capital Reductions * Program Reduced 2017 Forecast Reduction Litigated Positions in Support of Reductions Linked to the Enterprise Risk Mitigation Efforts? Comments New Business (MWC 16)Plug-in Electric Vehicle (PEV) expenditures, transformer purchases and non-residential connectionsSee JCE pp 2-281 to 2-284 $43.4M or 10% Adopts ORA and TURN’s adjustments. ORA recommended reductions to PEV expenditures and transformer purchase costs. TURN recommended reductions for non-residential connections. No Settlement amount is $391.0M, a 22% increase over 2014 recorded of $320.8M Capacity Programs (MWCs 06, 46, 2F)Distributed Energy Resource (DER) Integration Capacity program, Volt VAR Optimization (VVO) program, and substation capacity workSee JCE pp. 2-248 to 2-257 $40.5M or 20% Adopts ORA and TURN’s partial adjustments: Both ORA and TURN recommended no funding for DER Integration Capacity Program. TURN recommended the VVO Program should be limited to 12 additional feeders, and recommended reductions to substation capacity based on historical spend. No Settlement amount is $163.8M, a 2% increase over 2014 recorded of $161.3M Rule 20A (MWC 30)Undergrounding of electric facilitiesSee JCE pp. 2-295 to 2-297 $23.7M or 28% Adopts partial ORA adjustment: ORA recommended funding based on a 5-year average historical spend plus escalation. No Settlement amount is $60.0M, a 46% increase over 2014 recorded of $41.1M
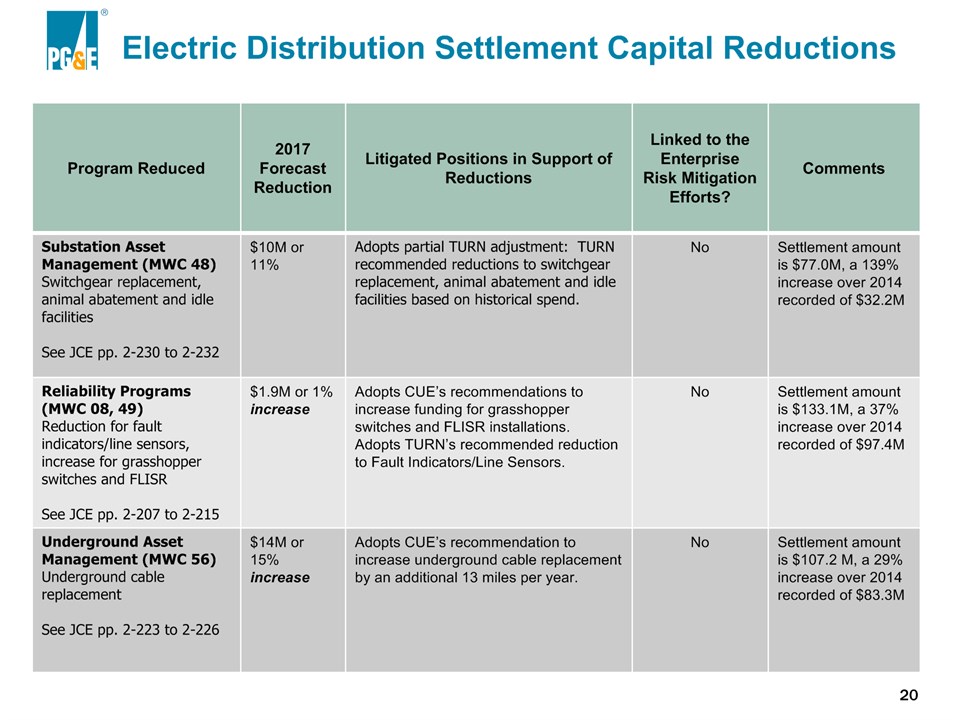
Electric Distribution Settlement Capital Reductions * Program Reduced 2017 Forecast Reduction Litigated Positions in Support of Reductions Linked to the Enterprise Risk Mitigation Efforts? Comments Substation Asset Management (MWC 48)Switchgear replacement, animal abatement and idle facilitiesSee JCE pp. 2-230 to 2-232 $10M or 11% Adopts partial TURN adjustment: TURN recommended reductions to switchgear replacement, animal abatement and idle facilities based on historical spend. No Settlement amount is $77.0M, a 139% increase over 2014 recorded of $32.2M Reliability Programs (MWC 08, 49)Reduction for fault indicators/line sensors, increase for grasshopper switches and FLISRSee JCE pp. 2-207 to 2-215 $1.9M or 1% increase Adopts CUE’s recommendations to increase funding for grasshopper switches and FLISR installations.Adopts TURN’s recommended reduction to Fault Indicators/Line Sensors. No Settlement amount is $133.1M, a 37% increase over 2014 recorded of $97.4M Underground Asset Management (MWC 56)Underground cable replacementSee JCE pp. 2-223 to 2-226 $14M or 15% increase Adopts CUE’s recommendation to increase underground cable replacement by an additional 13 miles per year. No Settlement amount is $107.2 M, a 29% increase over 2014 recorded of $83.3M
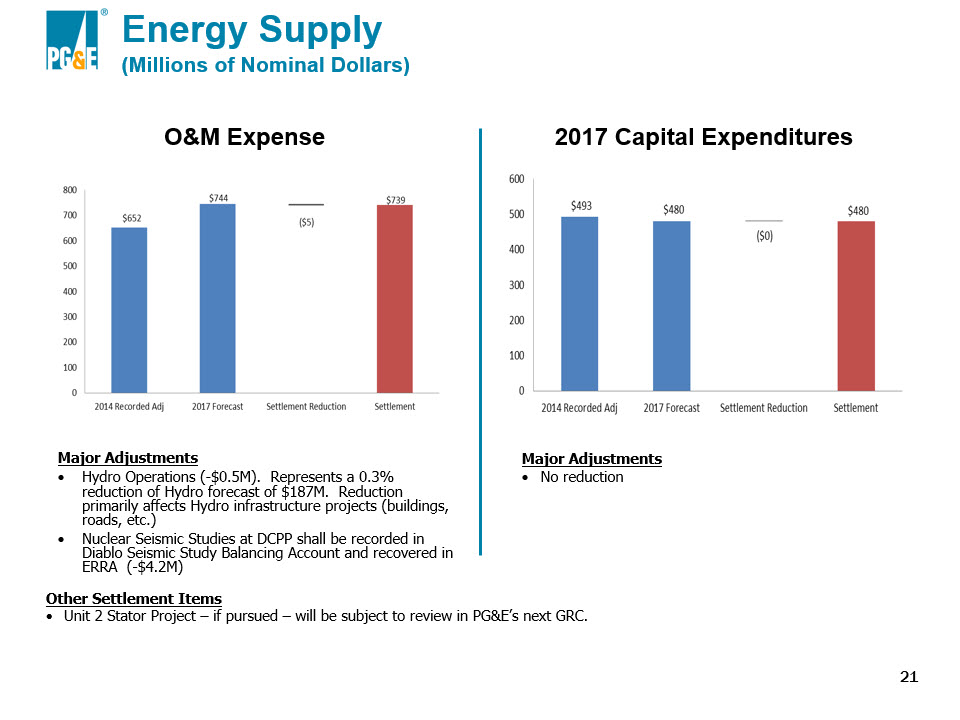
Energy Supply(Millions of Nominal Dollars) O&M Expense 2017 Capital Expenditures * Major AdjustmentsHydro Operations (-$0.5M). Represents a 0.3% reduction of Hydro forecast of $187M. Reduction primarily affects Hydro infrastructure projects (buildings, roads, etc.)Nuclear Seismic Studies at DCPP shall be recorded in Diablo Seismic Study Balancing Account and recovered in ERRA (-$4.2M) Major AdjustmentsNo reduction Other Settlement ItemsUnit 2 Stator Project – if pursued – will be subject to review in PG&E’s next GRC.

Energy Supply Settlement Expense Reductions * Program Reduced 2017 Forecast Reduction Litigated Positions in Support of Reductions Linked to the Enterprise Risk Mitigation Efforts? Comments Maintenance of Hydro Infrastructure (MWC KI)Maintenance of buildings, roads, and bridgesSee JCE pp. 2-385 to 2-386 $300K or 2% Adopts partial ORA and TURN adjustments. No Settlement amount is $14.5M, a 33% increase over 2014 recorded of $10.9M Maintenance of Hydro Reservoirs, Dams, and Waterways (MWC AX)Maintenance of and repairs to water conveyance and storage systemsSee JCE pp. 2-369 to 2-370 $125K or 0.4% Adopts partial ORA and TURN adjustments. No Settlement amount is $32M, a 33% increase over 2014 recorded of $24M. Maintenance of Hydro Generating Equipment (MWC KH)Maintenance of buildings, roads, and bridgesSee JCE pp. 2-383 to 2-384 $75K or 0.2% Adopts partial ORA and TURN adjustments. No Settlement amount is $36M, a 10% increase over 2014 recorded of $32.7M

Customer Care(Millions of Nominal Dollars) O&M Expense 2017 Capital Expenditures * Major AdjustmentsResidential Rate Reform costs to be tracked in a memo account (-$17.9M)Customer Engagement (-$7.1M)Contact Centers (-$3.8M)Metering (-$1.0M)Customer Retention (-$0.8M) Major AdjustmentsResidential Rate Reform costs to be tracked in a memo account (-$1.3M) Other Settlement ItemsAll local offices will remain open; PG&E may file an application to close local offices no earlier than July 1, 2018Agrees to PG&E’s proposal to reduce PG&E’s telephone service level from 80/20 to 76/60Requires that customer retention activities be booked “below the line”Provides targeted marketing, education and outreach to low-income and underserved communitiesAgrees to PG&E’s proposal to discontinue gas meter in-testing

Shared Services(Millions of Nominal Dollars) O&M Expense 2017 Capital Expenditures * Major AdjustmentsReal Estate (-$3.3M)Enterprise Corrective Action Program (-$2.5M)Sourcing Programs (-$0.9M)Environmental Programs (-$0.7M) Major AdjustmentsReal Estate (-$5.4M) Other Settlement ItemsProvides for annual meeting with PG&E and Settling Parties to discuss safety-related programs* PG&E’s 2017 forecast and settlement removes costs associated with the gas remedies ($14M expense and $7M capital)

Information Technology(Millions of Nominal Dollars) O&M Expense 2017 Capital Expenditures * Major AdjustmentsNo reductions in IT Foundational or Baseline Operations Portfolios Major AdjustmentsNo reductions in IT Foundational or Baseline Operations Portfolios

Corporate Services (Millions of Nominal Dollars) Corporate Services Expense 2017 Capital Expenditures * Major AdjustmentsHuman Resources (-$0.9M)Finance (-$0.4M)Regulatory Affairs (-$0.8M)Executive Offices and Corporate Secretary (-$0.5M)Corporate Affairs (-$0.1M) Major AdjustmentsNo reduction *Corporate Services (Exhibits (PG&E-8) and (PG&E-9)) department costs are presented in FERC dollars; reduction is relative to 100% of company A&G costs including allocations to GT&S, TO, etc.; includes Corporate Services IT costs

Recommendations on Rate Base, Depreciation and other Financial Matters *

2017 GRC Rate Base(Millions of Nominal Dollars) * Major AdjustmentsForecast capital expenditure related adjustments 2017: reduction of $118M2016: reduction of $31M2015: reduction of $186MWorking Cash Reduction in purchased power ($22M)Reduction in Other Receivables ($10M)Increase in Goods and Services payment lag ($22M)Reduction is partially offset by working cash increases derived from labor and STIP adjustments

Depreciation and Other Technical Recommendations The Settlement also provides for the following: Depreciation rate-related increase of $67 million (50% of PG&E’s forecast increase in depreciation rate changes)Other Operating Revenue Offsets increase by $13 million Agrees to use short-term interest rate of 1.7% for customer deposits (reduction of $6.4 million in revenues)Accepts PG&E’s forecast of income and property taxesAccepts PG&E’s allocation method for common costs Accepts PG&E’s proposed capitalization rates methodology *

Reporting Requirements Annual Spending Accountability ReportsCompares authorized spending to actual spending for gas distribution, electric distribution and electric generationFor safety and reliability work, provides MAT code level comparison, as applicable, and compares authorized units of work vs. actual units of workProvides explanation of any significant deviations between authorized and actual spending and between authorized and actual units of workAdditional Gas Distribution Specific Annual Reporting RequirementsPG&E plans to develop the capability to differentiate leak find rates by leak survey technology/approach and will make this information available in the annual gas distribution safety report when availableCross Bore Program forecast and actual values for number of inspections, repairs, and expenses, plus explanations of variances between forecast and actual *

Reporting Requirements Additional Electric Distribution Annual Reporting RequirementsAsset Replacement and Reliability Progress number of poles replaced through the Pole Replacement and other company programs as available, and the age of poles in PG&E’s system; number of stand-alone circuit breakers replaced or installed;miles of paper-insulated lead sheath cable (PILC) and high molecular weight polyHMWPE cable, respectively, replaced or rejuvenated;number of miles of overhead conductor replaced; number of grasshopper switches replaced;number of FLISR installations in the Reliability program; andnumber of overhead fuse installations. Surge Arrester Program units completed in the Surge Arrester Grounding program in the previous year; total amount of customer spend in the Surge Arrester Grounding program in the previous year; anda count of locations mistakenly identified in PG&E’s location survey, to address TURN’s concerns about PG&E’s unit forecast. *

* Annually for the prior year, PG&E will provide to interested parties on request monthly data, if available, for each line of business showing the following safety metrics (to the extent applicable to the line of business): Incidents of wires down911 Emergency ResponseDig-in reductionsGas emergency responseDiablo Canyon Safety and Reliability IndicatorsHydro public safety indexLost work day case rateOSHA recordable rate (injuries per 200,000 production hours)Near-hits reportedPreventable motor vehicle accidentsSerious preventable motor vehicle accidentsContractor lost work daysContractor days awayContractor OSHA recordable rateNumber of fires requiring engine response attributed to PG&E operations Employee fatalities and life-altering injuries attributed to PG&E operations Reporting Safety Metrics

Principles for Deferred Work * For previously funded safety work that PG&E has deferred and for which PG&E seeks future funding, PG&E’s GRC showing must demonstrate that the request is consistent with the following six principles reflected in PG&E’s 2014 GRC Decision. (For brevity, this summary paraphrases the principles.) The fact that PG&E must pay for a higher priority activity does not nullify PG&E’s responsibilities to fund authorized work unless that work is no longer deemed necessary for safety.PG&E is responsible for providing safe and reliable service whether or not its overall spending matches authorized funding levels.PG&E bears the risk that, as a result of meeting spending obligations necessary to provide safe and reliable service, the earned rate of return may be less than the authorized return.While PG&E has finite funds to meet capital and operational needs, PG&E is not restricted to spending only up to the adopted GRC forecast.PG&E bears the responsibility and discretion to adjust priorities and accommodate changing conditions, but reprioritizing projects does not automatically justify postponing projects previously deemed necessary for safe and reliable service.The GRC is a tool in supporting PG&E’s ability to provide safe and reliable service while affording a reasonable opportunity to earn its rate of return. Adopted revenue requirements and disposition of disputed ratemaking issues should be consistent with these goals. PG&E’s showing may also include a showing of what other work may have been undertaken in lieu of the deferred work.

Appendix *

* Grasshopper Switches PG&E shall increase its replacement rates for grasshopper switches from 20 per year to 30 per year Grasshopper / Overhead switch program replaces antiquated switches that do not meet new operating criteria or that negatively affect the operational flexibility of the grid.

FLISR System * FLISR - Feeder Automation System PG&E RT-SCADA System PG&E Mountaintop Radio System FLISR – Fault Location, Isolation, and Service RestorationSelf-restoring feeder automation technology designed to improve service reliability PG&E shall increase its forecasted level of FLISR installations from 77 to not more than 116 per year.
