Attached files
| file | filename |
|---|---|
| 8-K - FORM 8-K - CCUR Holdings, Inc. | v447871_8k.htm |
| EX-99.1 - EXHIBIT 99.1 - CCUR Holdings, Inc. | v447871_ex99-1.htm |
Exhibit 99.2

FY 2016 Q4 & FULL YEAR EARNINGS CALL PRESENTATION August 30, 2016
FORWARD LOOKING STATEMENTS Certain statements made or incorporated by reference in this presentation may constitute “forward - looking statements” within the meaning of the federal securities laws. These statements are made pursuant to the safe harbor provision of the Private Securities Litigation Reform Act of 1995. Statements regarding future events and developments and our future performance, as well as our expectations, beliefs, plans, estimates, or projections relating to the future, are forward - looking statements within the meaning of these laws. All forward - looking statements are subject to certain risks and uncertainties that could cause actual events to differ materially from those projected. Important risk factors related to our business are discussed in our Form 10 - K filed with the Securities and Exchange Commission (“SEC”) on August 26, 2015, and may be discussed in subsequent filings with the SEC. The risk factors discussed in such Form 10 - K under the heading “Risk Factors” are specifically incorporated by reference in this presentation. Our forward - looking statements are based on current expectations and speak only as of the date of this presentation. We undertake no obligation to publicly update or revise any forward - looking statement, whether as a result of future events, new information, or otherwise. 2
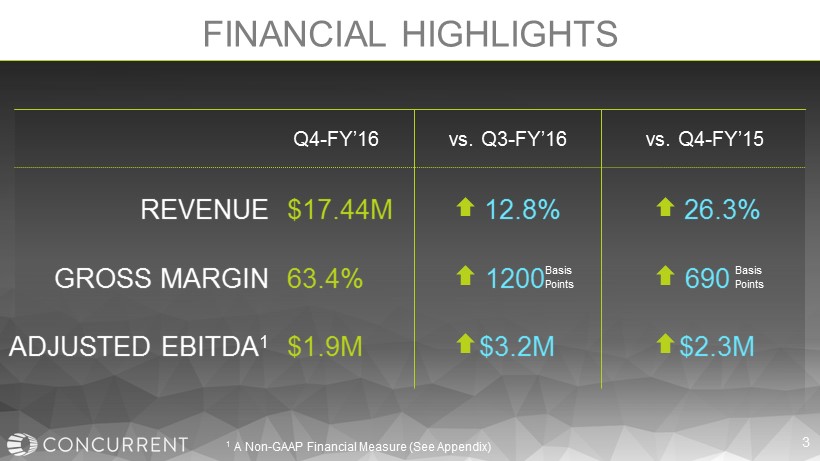
FINANCIAL HIGHLIGHTS vs. Q3 - FY’16 REVENUE $17.44M 12.8% 26.3% ADJUSTED EBITDA 1 $1.9M $3.2M $2.3M vs. Q4 - FY’15 3 GROSS MARGIN 63.4% 1200 690 Basis Points Basis Points Q4 - FY’16 1 A Non - GAAP Financial Measure (See Appendix)
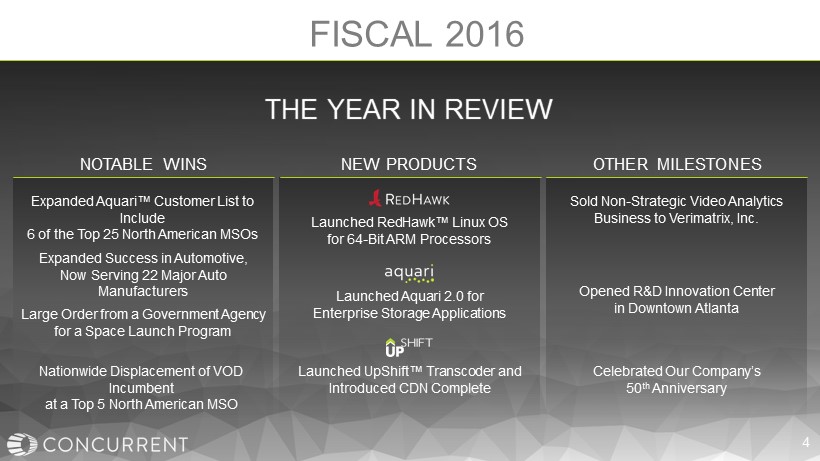
FISCAL 2016 THE YEAR IN REVIEW Expanded Aquari ™ Customer List to Include 6 of the Top 25 North American MSOs NOTABLE WINS NEW PRODUCTS OTHER MILESTONES Sold Non - Strategic Video Analytics Business to Verimatrix , Inc. Opened R&D Innovation Center in Downtown Atlanta Nationwide Displacement of VOD Incumbent at a Top 5 North American MSO Expanded Success in Automotive, Now Serving 22 Major Auto Manufacturers Large Order from a Government Agency for a Space Launch Program Launched RedHawk ™ Linux OS for 64 - Bit ARM Processors Launched Aquari 2.0 for Enterprise Storage Applications Launched UpShift ™ Transcoder and I ntroduced CDN Complete 4 Celebrated Our Company’s 50 th Anniversary
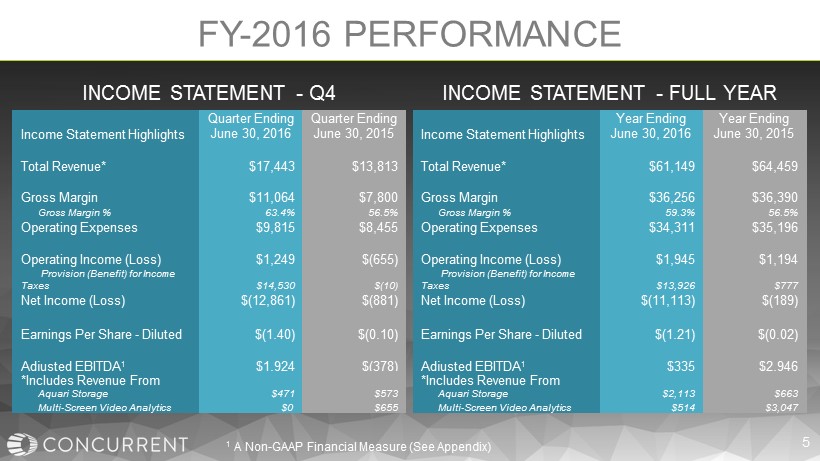
Income Statement Highlights Quarter Ending June 30, 2016 Quarter Ending June 30, 2015 Total Revenue* $17,443 $13,813 Gross Margin $11,064 $7,800 Gross Margin % 63.4% 56.5% Operating Expenses $9,815 $8,455 Operating Income (Loss) $1,249 $(655) Provision (Benefit) for Income Taxes $14,530 $(10) Net Income (Loss) $(12,861) $(881) Earnings Per Share - Diluted $(1.40) $(0.10) Adjusted EBITDA 1 $1,924 $(378) INCOME STATEMENT - Q4 FY - 2016 PERFORMANCE Income Statement Highlights Year Ending June 30, 2016 Year Ending June 30, 2015 Total Revenue* $61,149 $64,459 Gross Margin $36,256 $36,390 Gross Margin % 59.3% 56.5% Operating Expenses $34,311 $35,196 Operating Income (Loss) $1,945 $1,194 Provision (Benefit) for Income Taxes $13,926 $777 Net Income (Loss) $(11,113) $(189) Earnings Per Share - Diluted $(1.21) $(0.02) Adjusted EBITDA 1 $335 $2,946 INCOME STATEMENT - FULL YEAR 5 *Includes Revenue From Aquari Storage $471 $573 Multi - Screen Video Analytics $0 $655 *Includes Revenue From Aquari Storage $2,113 $663 Multi - Screen Video Analytics $514 $3,047 1 A Non - GAAP Financial Measure (See Appendix)
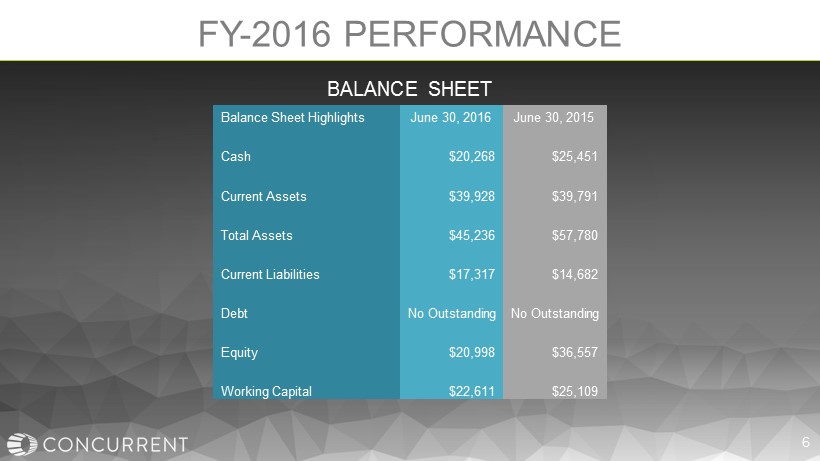
Balance Sheet Highlights June 30, 2016 June 30, 2015 Cash $20,268 $25,451 Current Assets $39,928 $39,791 Total Assets $45,236 $57,780 Current Liabilities $17,317 $14,682 Debt No Outstanding No Outstanding Equity $20,998 $36,557 Working Capital $22,611 $25,109 BALANCE SHEET FY - 2016 PERFORMANCE 6
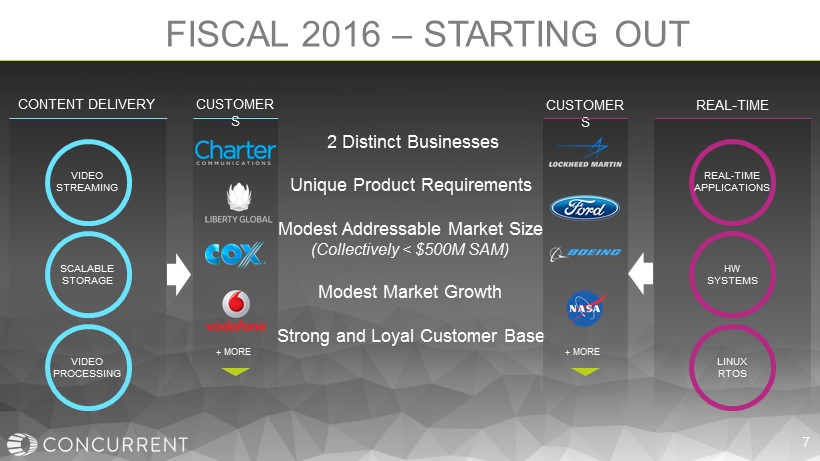
FISCAL 2016 – STARTING OUT CONTENT DELIVERY SCALABLE STORAGE VIDEO STREAMING VIDEO PROCESSING REAL - TIME HW SYSTEMS REAL - TIME APPLICATIONS LINUX RTOS 2 Distinct Businesses Unique Product Requirements Modest Addressable Market Size (Collectively < $500M SAM) Modest Market Growth Strong and Loyal Customer Base CUSTOMER S CUSTOMER S + MORE + MORE 7
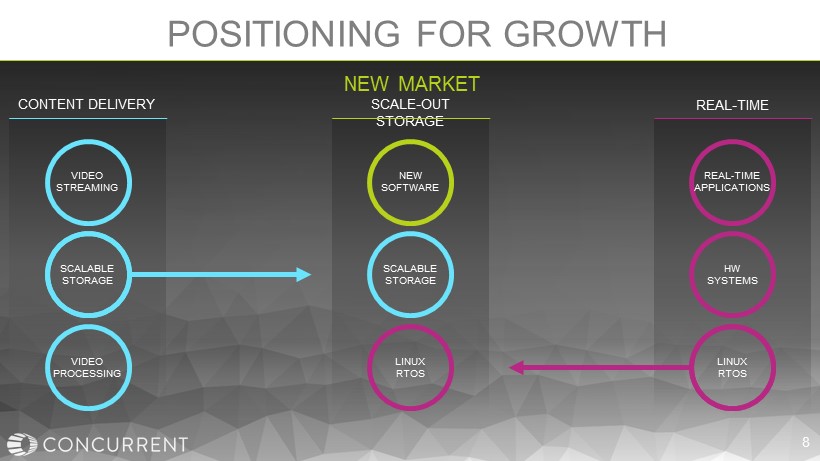
POSITIONING FOR GROWTH CONTENT DELIVERY SCALABLE STORAGE VIDEO STREAMING VIDEO PROCESSING REAL - TIME REAL - TIME APPLICATIONS SCALE - OUT STORAGE SCALABLE STORAGE HW SYSTEMS LINUX RTOS LINUX RTOS NEW SOFTWARE 8 NEW MARKET
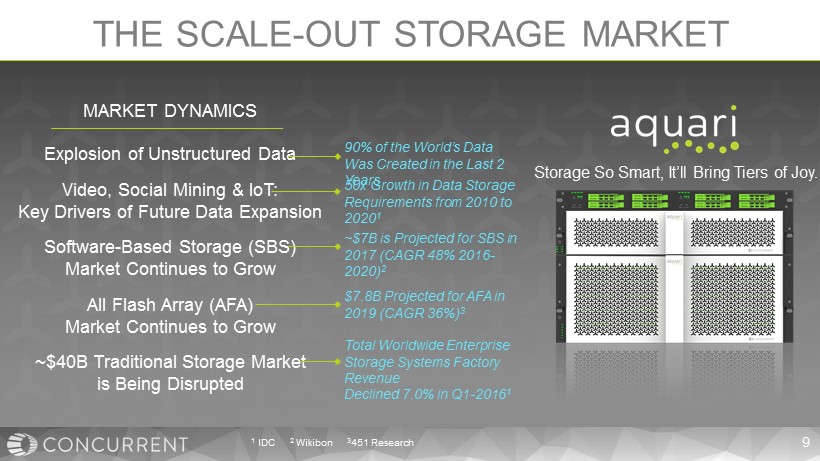
THE SCALE - OUT STORAGE MARKET MARKET DYNAMICS Explosion of Unstructured Data Video , Social Mining & IoT : Key Drivers of Future Data Expansion Software - Based Storage ( SBS) Market Continues to Grow All Flash Array (AFA) Market Continues to Grow ~$40B Traditional Storage Market is Being Disrupted ~$ 7 B is Projected for SBS in 2017 (CAGR 48% 2016 - 2020) 2 $ 7.8B Projected for AFA in 2019 (CAGR 36%) 3 Total Worldwide E nterprise S torage S ystems F actory R evenue D eclined 7.0 % in Q1 - 2016 1 90% of the World’s Data Was Created in the Last 2 Years 50x Growth in Data Storage Requirements from 2010 to 2020 1 Storage So Smart, It’ll Bring Tiers of Joy. 1 IDC 2 Wikibon 3 451 Research 9
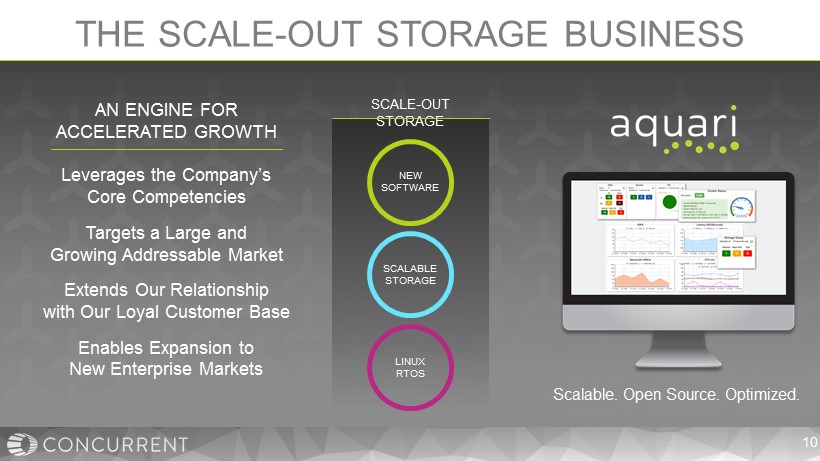
THE SCALE - OUT STORAGE BUSINESS SCALE - OUT STORAGE SCALABLE STORAGE LINUX RTOS NEW SOFTWARE AN ENGINE FOR ACCELERATED GROWTH Leverages the Company’s C ore C ompetencies Targets a Large and G rowing A ddressable M arket Extends O ur R elationship with Our L oyal C ustomer B ase Enables Expansion to N ew E nterprise M arkets Scalable. Open Source. Optimized. 10
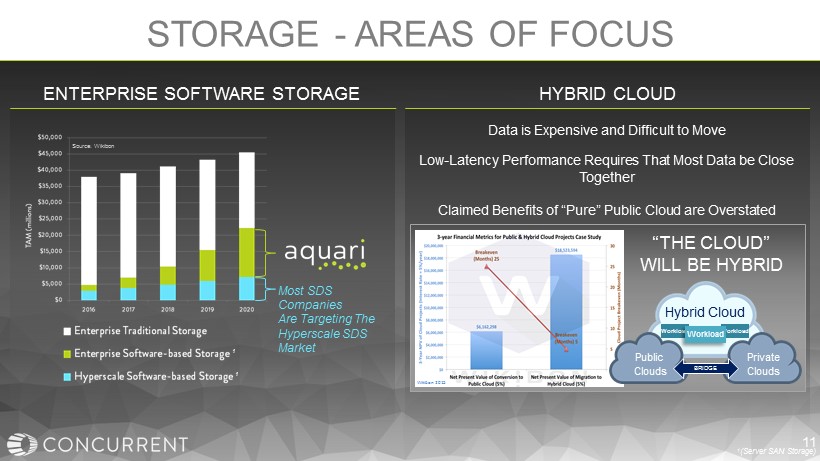
STORAGE - AREAS OF FOCUS ENTERPRISE SOFTWARE STORAGE Most SDS Companies Are Targeting The Hyperscale SDS Market HYBRID CLOUD Data is Expensive and Difficult to M ove Low - Latency Performance Requires That Most Data be Close T ogether Claimed Benefits of “Pure” Public Cloud are Overstated Hybrid Cloud BRIDGE Public Clouds Private Clouds Workload Workload Workload “THE CLOUD” WILL BE HYBRID Wikibon 2015 Source: Wikibon 1 (Server SAN Storage) 1 1 11
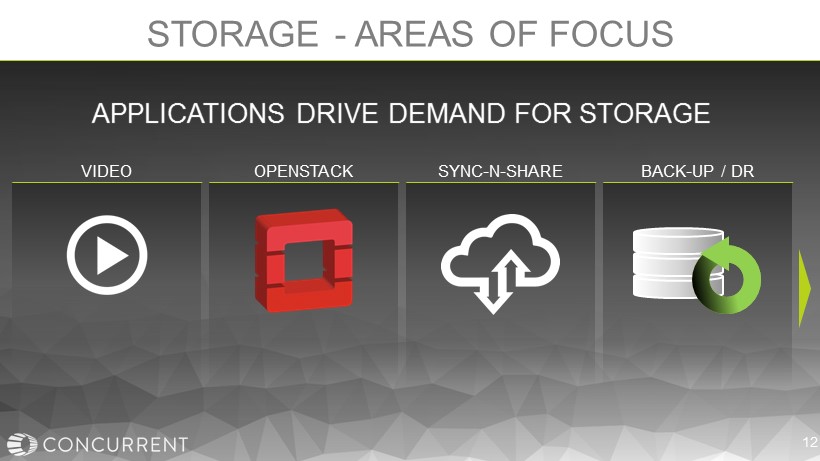
STORAGE - AREAS OF FOCUS VIDEO OPENSTACK SYNC - N - SHARE BACK - UP / DR APPLICATIONS DRIVE DEMAND FOR STORAGE 12
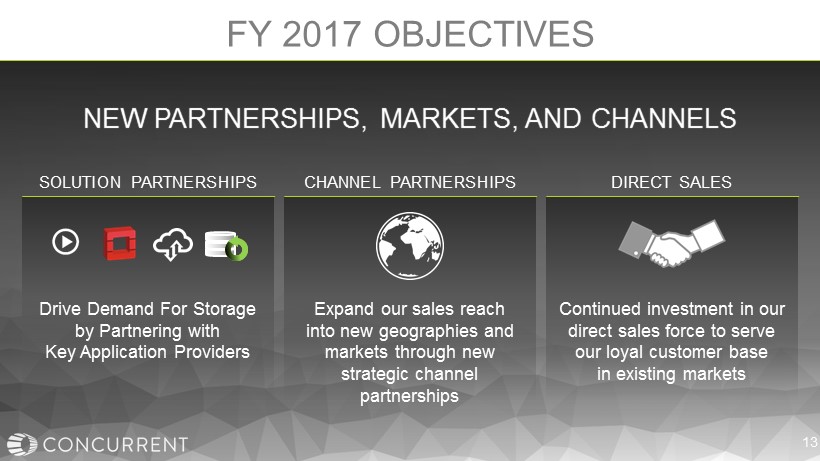
Drive Demand For Storage by P artnering with Key Application Providers SOLUTION PARTNERSHIPS CHANNEL PARTNERSHIPS Expand our sales reach into new geographies and markets through new strategic channel partnerships Continued investment in our direct sales force to serve our loyal customer base in existing markets DIRECT SALES FY 2017 OBJECTIVES NEW PARTNERSHIPS, MARKETS, AND CHANNELS 13

UPCOMING EVENTS September 9 - 16 Amsterdam Storage & Content Delivery September 26 – 29 Philadelphia Storage & Content Delivery September 27 - 29 Shanghai Real - Time Solutions 14 Oct. 5 - 6 London Oct. 25 - 28 Barcelona Storage October 25 - 28, Barcelona
To supplement the company’s condensed consolidated financial statements prepared in accordance with U.S. generally accepted accounting principles (“GAAP” ), this presentation provides information concerning the company’s Adjusted EBITDA, a non - GAAP financial measure. Reconciliations of Adjusted EBITDA to net income, the most comparable GAAP financial measure, can be found in tables immediately following this slide. For purposes of this presentation, Adjusted EBITDA is defined as GAAP net income, less interest income and other income (expe nse ), net, provision for income taxes, depreciation and amortization expenses, share - based compensation expense and gain on the sale of assets. The company considers Adjusted EBITDA important to understanding its historical results and identifying current and future trends impacting its business. Management uses Adjusted EBITDA to compare the company’s performance to that of prior periods and evaluate the company’s financial and operating results on a consistent basis from period to period. The company also believes this measure, when viewed in combination with the company’s financial results prepared in accordance with GAAP, provides useful information to investors to evaluate ongoing operating re sul ts and trends. The adjustments to the company’s GAAP results are made with the intent of providing both management and investors a more complete understanding of the company’s underlying operational results, trends and performance. Additionally, adjusted EBITDA is not intended to be a measure of cash flow for management’s discretionary use. We believe that the inclusion of Adju ste d EBITDA is appropriate to provide additional information to investors because securities analysts, noteholders and other investors use these non - GAAP financial measures to assess our operating performance across periods on a consistent basis and to evaluate the relative risk of an investment in our secu rit ies. Adjusted EBITDA has limitations as an analytical tool, however, including the following: • Although depreciation and amortization are non - cash charges, the assets being depreciated and amortized will often have to be re placed in the future and adjusted EBITDA does not reflect any cash requirements for such replacements; • Adjusted EBITDA does not reflect our cash expenditures, or future requirements for capital expenditures or contractual commit men ts; • Adjusted EBITDA does not reflect changes in, or cash requirements for, our working capital needs; • Adjusted EBITDA does not reflect our tax expense or any cash requirements to pay income taxes; and • Adjusted EBITDA does not reflect the impact of earnings or charges resulting from matters we do not consider to be indicative of our ongoing operations, but may nonetheless have a material impact on our results of operations. The presentation of Adjusted EBITDA is not meant to be considered in isolation or as a substitute for or superior to the company’s financial results determined in accordance with GAAP. In addition, the company’s presentation of Adjusted EBITDA may not be computed in the same manner as similarly titled measures used by other companies, inc luding other companies in our industry. APPENDIX NON - GAAP FINANCIAL MEASURES
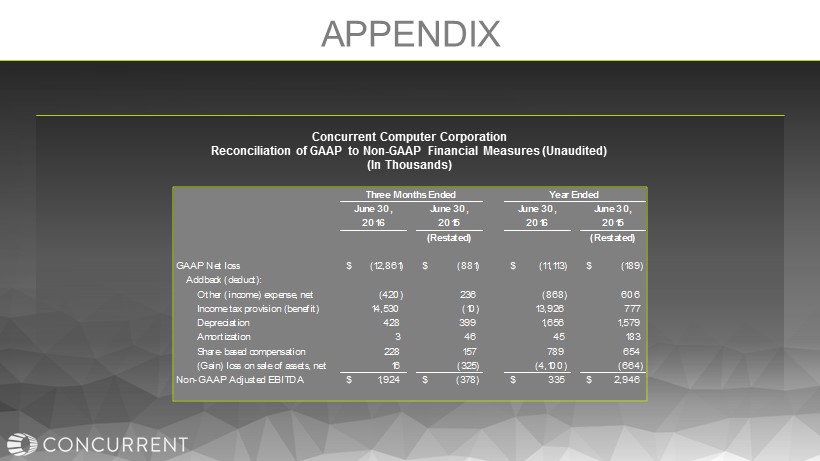
APPENDIX Concurrent Computer Corporation Reconciliation of GAAP to Non - GAAP Financial Measures (Unaudited) (In Thousands) June 30, June 30, June 30, June 30, 2016 2015 2016 2015 (Restated) (Restated) GAAP Net loss (12,861)$ (881)$ (11,113)$ (189)$ Addback (deduct): Other (income) expense, net (420) 236 (868) 606 Income tax provision (benefit) 14,530 (10) 13,926 777 Depreciation 428 399 1,656 1,579 Amortization 3 46 45 183 Share-based compensation 228 157 789 654 (Gain) loss on sale of assets, net 16 (325) (4,100) (664) Non-GAAP Adjusted EBITDA 1,924$ (378)$ 335$ 2,946$ Year Ended Three Months Ended

THANK YOU